Price Wizard for Bloomberg Guide - pfr.com selecting a single security, reading in a text file with...
30
Parallax Financial Research 9/23/2014 Users Guide for Price Wizard™ on Bloomberg
Transcript of Price Wizard for Bloomberg Guide - pfr.com selecting a single security, reading in a text file with...
Parallax Financial Research
9/23/2014
UsersGuideforPriceWizard™onBloomberg
Parallax Financial Research
1
Users Guide for Price Wizard™ on Bloomberg
What is Price Wizard? Page 2
What is a Neural Network? Page 3
What Factors are used in Price Wizard? Page 4
How do I use Price Wizard? Page 5
The Application APPS PRICEWIZ <Go> Page 6 o Security & Filter Selection Page 7 o Performing Valuation Page 10 o Price Wizard Results List Page 11 o Price Wizard Output Options Page 13 o Results Analysis Page 21 o Price Wizard is International Page 26
Price Wizard Users Page 27
FAQ Page 29

Parallax Financial Research
2
What is Price Wizard?
Price Wizard is a suite of industry‐scoped multi‐factor neural network equity models that were pre‐
trained to convert recently reported company fundamentals into a current estimated market price. It
uses no future growth expectations, analyst estimates, or price momentum. In fact, Price Wizard input
factors do not include price in any form, past or present. This program automatically performs an
appraisal by simultaneously using common stores of value like earnings, cash flow, book, and dividends,
along with critical modifiers such as industry, margins, debt, interest rates, and inflation, to determine a
price.
Price Wizard was first invented in 1990 to estimate the pre‐offering value of IPOs, and has since been
incorporated in several money management programs. To our surprise, stocks that were undervalued
by some amount tended to drift toward value at 400‐500 basis points per year in excess of the overall
market. Marque Millennium Capital Management has used Price Wizard to manage its large cap value
portfolios since 1991, and has achieved those numbers (www.marqmil.com).
Price Wizard has been rebuilt for Bloomberg users, and version 4 is even more powerful. It was recently
run on the Russell 3000 stock list. Over an 11.35‐year period ending Sep‐2013, the average annual
return of rolling monthly portfolios for all stocks was 21.57%, with a risk of 19.87%, for a Return/Risk
ratio of 1.08. Portfolios constructed using the top decile of Price‐Wizard‐ranked stocks showed a return
of 41.28% with a risk of 23.41%, for an excess return of 1971 basis points, and a Return/Risk ratio of 1.76
(see Pages 17‐18).
The Price Wizard application allows users to value equities on any global exchange, display those results
on weekly, monthly, or quarterly scale charts, and then see an analysis of aggregate valuation and past
performance.
Price Wizard uses neural network technology, which means that it had to be trained on how to price
stocks using fundamentals. Neural nets learn from example. The benefit is that our networks have
found interrelationships between the fundamental factors that are not obvious using simpler modeling
schemes or ranking methods. The downside is that they don’t tell us exactly why a price is found to be a
certain number. Our users have learned to trust the consistency and wisdom of Price Wizard valuations.
We hope you will too.

Parallax Financial Research
3
Figure 1. This is an example of valuations (dark magenta) on a monthly chart of Google
What is a Neural Network?
A neural network is a mathematical modeling tool which has the capacity to learn by example. This is an
extraordinarily useful ability, especially in financial modeling, where the inputs & outputs are usually
well documented, and there are countless examples. Networks are “trained” by being presented with
thousands of facts, each fact consisting of inputs and corresponding outputs. Through a unique feedback
process, the network learns how those inputs are related to the outputs, and develops a general model
to describe the relationship.
In our case, fundamentals were fed in, and the corresponding current stock price was used as the
output. Significant sources of bias and data error had to be dealt with, and so our proprietary data
preparation, training, and price reconstruction steps were critical to the success of the model.
The training for Price Wizard Version 4.0 ended in 2000, so all of the results you see in this guide and
while running the application, are “out‐of‐sample” after that year.

Parallax Financial Research
4
What Factors are used in Price Wizard?
Here is the list of factors used in Price Wizard:
Earnings
Sales
Net Income
Dividends
Cash Flow
Industry Group
Book Value
Debt
Margins
Inflation Rate
Interest Rate
Here is the relative importance of each factor used in Price Wizard:

Parallax Financial Research
5
How do I use Price Wizard?
The efficient market theory would have us believe that stocks are always at or very near fair value. We
don’t see that. The cycles of optimism and pessimism regularly cause price to swing away from value.
Our other product, ExtremeHurst (APPS EHURST<go>), attempts to detect the crowd effect, while Price
Wizard attempts to bring us a value that is absent any crowd expectations or biases. The chart below
represents a new way to judge risk and reward in your portfolios. The amount that a stock is overpriced
IS the downside risk, while the amount which is underpriced, the potential reward. The best way to use
Price Wizard is to modify your portfolios to stay on the right side of value….or the wrong side if you have
short portfolios.
Figure 2. Price Wizard redefines risk and reward
It is recommended that managers use Price Wizard at least to rank stocks in their universe. We
recognize that most managers have to match their holdings to a benchmark, so it isn’t possible to
exclude an entire sector just because it’s overvalued. In this case, use Price Wizard to rank stocks in
overvalued sectors or industries.

Parallax Financial Research
6
The Application on Bloomberg (at APPS PRICEWIZ <Go>)
Price Wizard App Window
Price Wizard is a single Windows dialog box. It is divided into seven sections from top to bottom that correspond to the workflow sequence. These sections include security and filter selection, the run button and progress bars, the results list, the chart area, zoom control, and the output options. Please press the “Help” button for more information on how to use Price Wizard or to contact sales/technical support.
CPU Usage Price Wizard performs millions of mathematical calculations including neural network math during each run. You will notice a sharp increase in CPU usage during searches

Parallax Financial Research
7
Bloomberg Data Limits
Bloomberg clients have monthly data usage limitations. We recommend that you carefully select a security universe and run valuations as needed. Price Wizard reads about twenty data time series for each symbol that makes it through the filters.
Security & Filter Selection
Let’s take a closer look at security and filter selection: The user can select which securities to search by
either selecting a single security, reading in a text file with one security name per line, retrieving each
security holding from an index (SPX for S&P 500, NKY for Nikkei, CAC, DAX, etc.), reading securities from
a Bloomberg client portfolio (PRTU <Go>), or by selecting a region or country to access all their
respective securities. The next step is to select the type of security, and time scale desired for display.
In price Wizard, only equity‐related securities are allowed. In later versions we will include equity ETFs
and Indices, so they are grayed‐out for now in the list. The next menu has a list of GICS sectors for your
search. The final menu has an additional list of filters to apply. The market cap filter passes stocks
through according to their size. The liquidity filter ensures that securities with volume actually have
volume on every trading day and trade enough dollar volume on an average day. The price filter sets a
minimum price level. Checking “Recently Updated Valuations” in the Additional Filters menu, will
ensure that valuations are based on recent data. The program will remember which securities were
excluded and not search them again if ”Remember Filtered” is checked.
Single Security Select this to value a single equity. Be sure to enter the full name e.g., “MSFT US Equity”
Parallax Financial Research
8
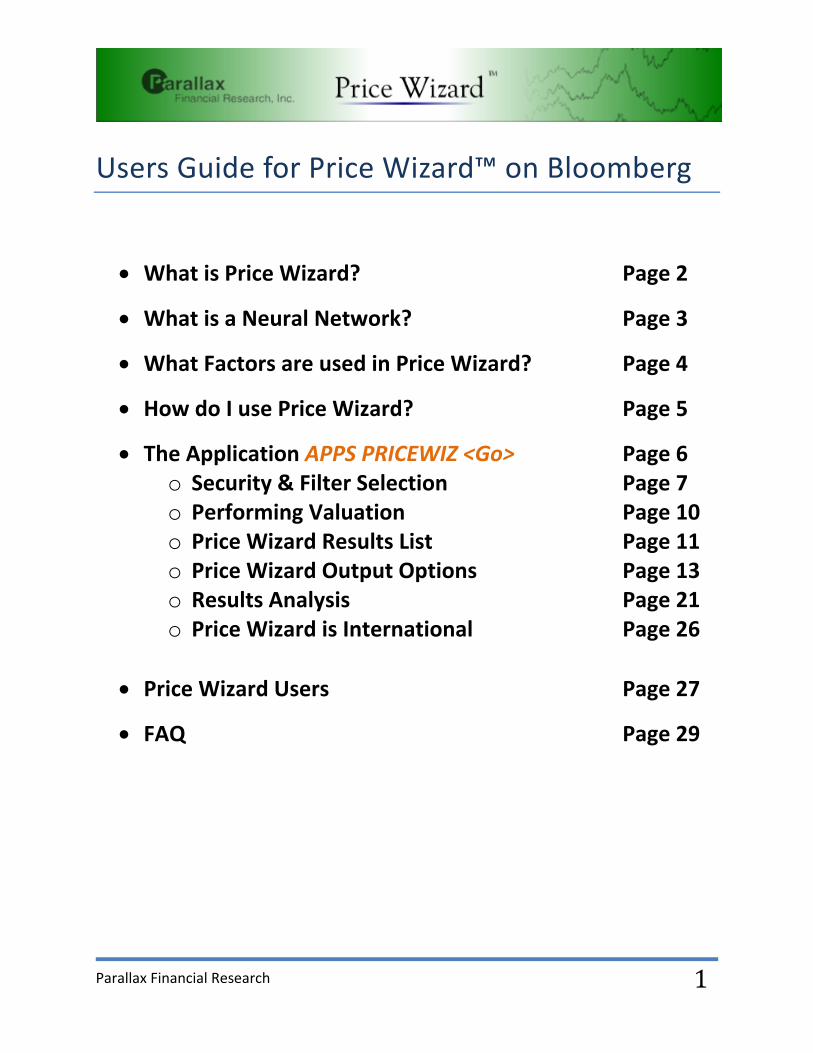
Securities List A text file created using NotePad or other text editor with a list of securities, one per line, in the following format: <security name> space <exchange code> space <yellow‐key>. For example:
Index Holdings Search just the securities that make up an equity index by typing the Bloomberg index name at the prompt. For example, SPX for the S&P 500 index:
Portfolio (PRTU) Bloomberg offers clients the ability to keep portfolios on their system using PRTU <go>. If you wish to search only your portfolio securities then enter your portfolio name at the prompt. It should be in the following format: U1234567‐1
where the “1234567” is your Bloomberg UUID and the “‐1” is the portfolio number.
Country Search all equities by country.
Region Search all equities by region.
Security Select which type of equity or equity portfolio for valuation. Note that later versions will be able to price ETFs and Equity indices. These options will be grayed out until then. Also select the background time interval for plotting historical valuations. Note that these time periods are evenly spaced so that a “Month” may be from July 20th to August 20th.
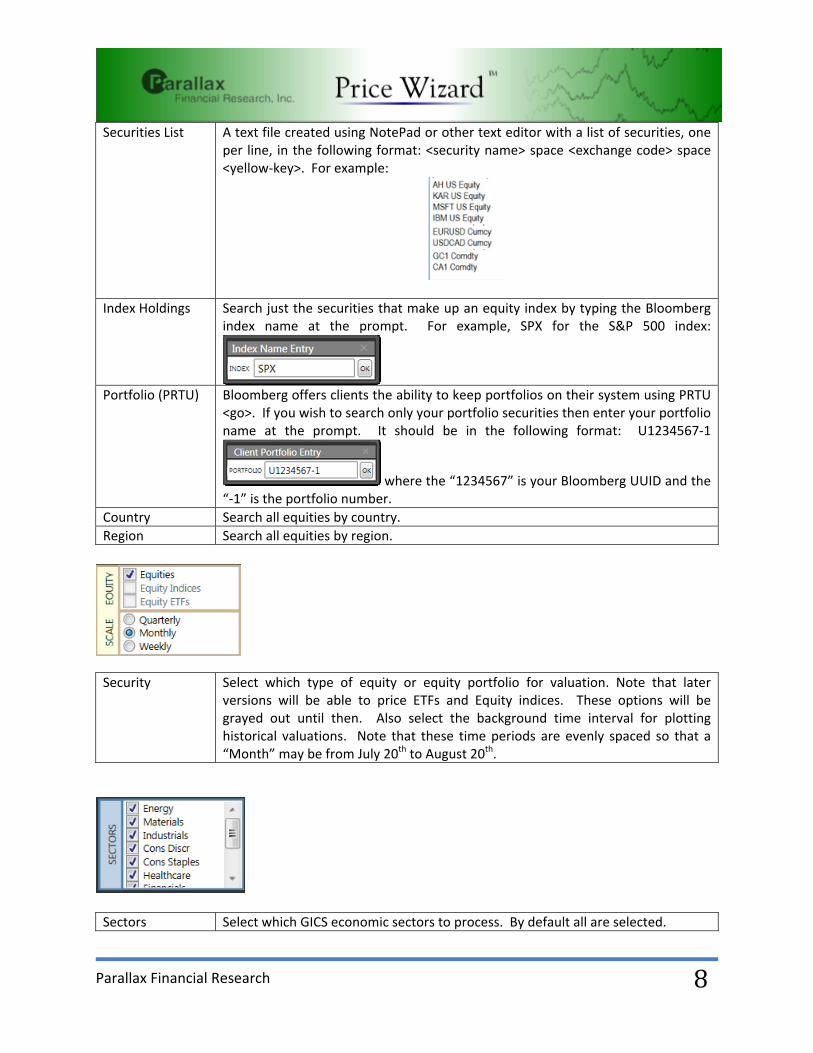
Sectors Select which GICS economic sectors to process. By default all are selected.

Parallax Financial Research
9
‐‐‐‐>
Market Cap Filter Select the market capitalization range to limit your valuation search.
Price Filter Select the minimum allowable equity price to limit your valuation search
Liquidity Filter Select the minimum average dollar volume to limit your valuation search
Valuation Filter Select the valuation threshold to limit your valuation results
Recently Updated Valuations
Check this option to search for new signals only. If it is unchecked the search will find all signals that are still active….but it will take longer.
Remember Filtered
Check this option for the program to remember all the securities that have been disqualified for signal search. This memory will persist even when the program is closed
Increasing 12mo Valuations
Select this option to find only signals that have the highest possible quality
Increasing 12mo Prices
This is our recommended setting for finding signals
Recent ExtremeHurst™ Signals
Select this option to limit valuations to only those equities that have active ExtremeHurst signals. For more information on ExtremeHurst, type APPS EHURST <go> on your Bloomberg terminal
Historical Data Output
Check this option to enable all of the valuation history to be saved to CSV. If unchecked, only the most recent valuations will be saved to file
Enable Prior Version
Select this if you were a client for Version 3 of Price Wizard (on another platform) and wish to read in that valuation history. Contact Parallax for further information
Parallax Financial Research
10
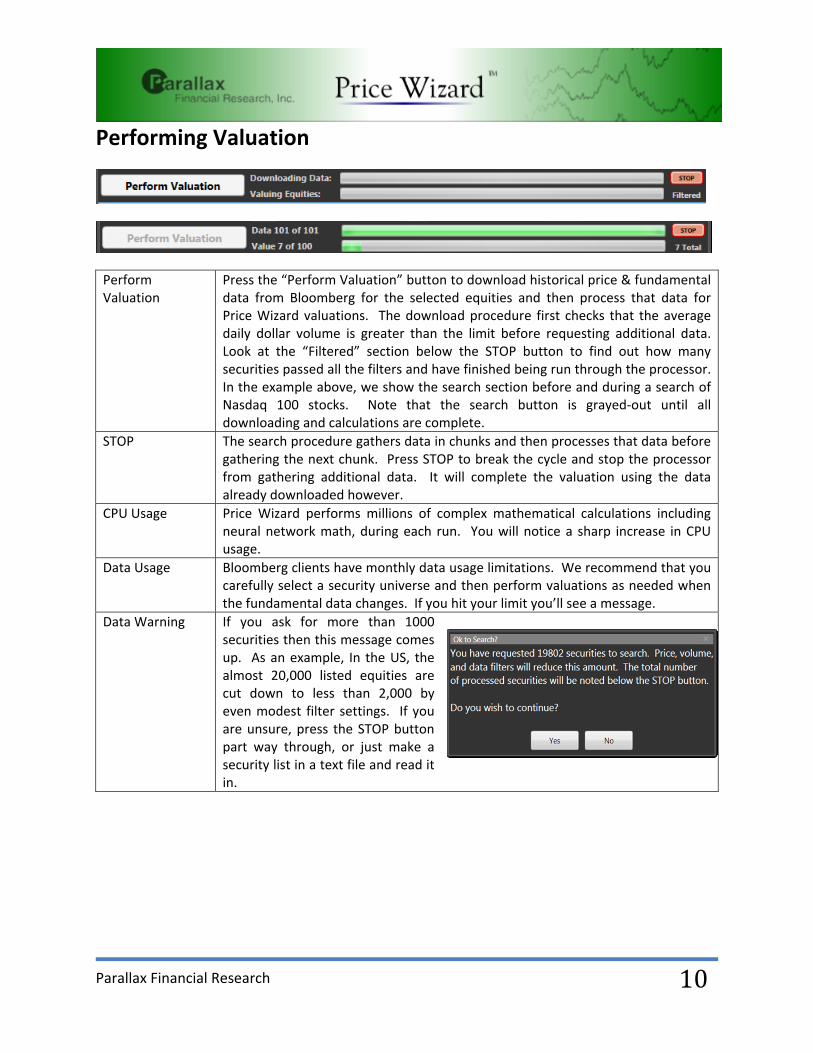
Performing Valuation
Perform Valuation
Press the “Perform Valuation” button to download historical price & fundamental data from Bloomberg for the selected equities and then process that data for Price Wizard valuations. The download procedure first checks that the average daily dollar volume is greater than the limit before requesting additional data. Look at the “Filtered” section below the STOP button to find out how many securities passed all the filters and have finished being run through the processor. In the example above, we show the search section before and during a search of Nasdaq 100 stocks. Note that the search button is grayed‐out until all downloading and calculations are complete.
STOP The search procedure gathers data in chunks and then processes that data before gathering the next chunk. Press STOP to break the cycle and stop the processor from gathering additional data. It will complete the valuation using the data already downloaded however.
CPU Usage Price Wizard performs millions of complex mathematical calculations including neural network math, during each run. You will notice a sharp increase in CPU usage.
Data Usage Bloomberg clients have monthly data usage limitations. We recommend that you carefully select a security universe and then perform valuations as needed when the fundamental data changes. If you hit your limit you’ll see a message.
Data Warning If you ask for more than 1000 securities then this message comes up. As an example, In the US, the almost 20,000 listed equities are cut down to less than 2,000 by even modest filter settings. If you are unsure, press the STOP button part way through, or just make a security list in a text file and read it in.
Parallax Financial Research
11
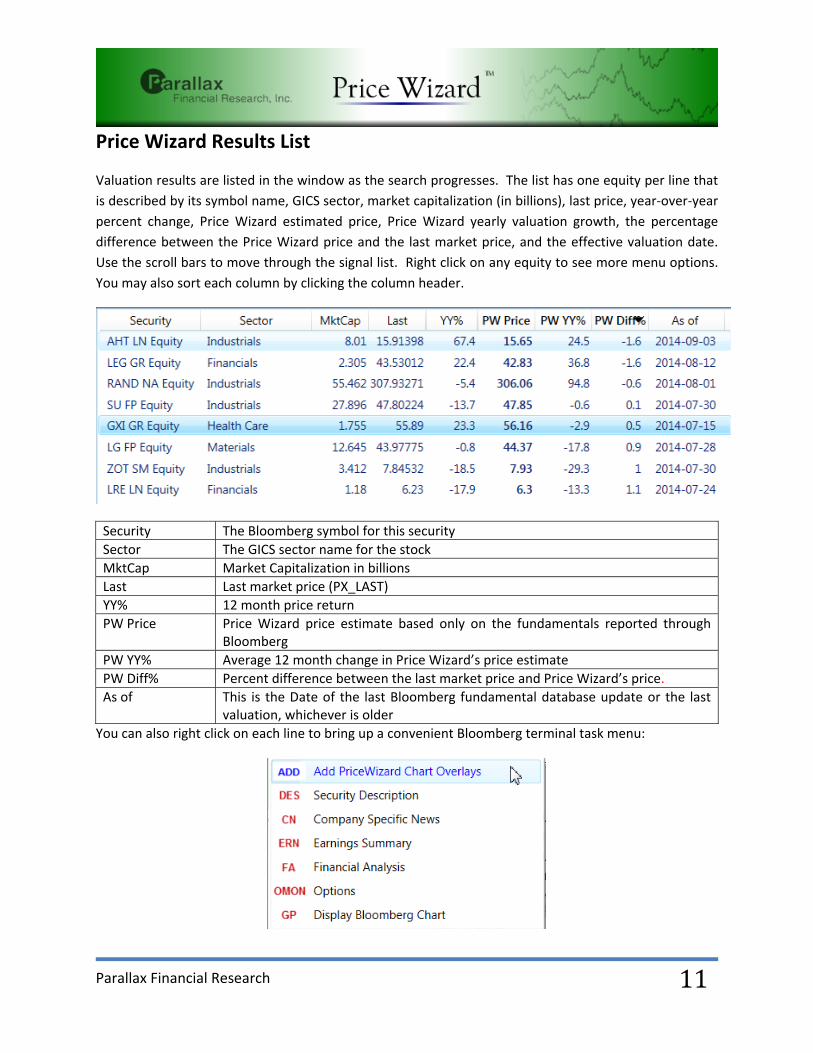
Price Wizard Results List
Valuation results are listed in the window as the search progresses. The list has one equity per line that
is described by its symbol name, GICS sector, market capitalization (in billions), last price, year‐over‐year
percent change, Price Wizard estimated price, Price Wizard yearly valuation growth, the percentage
difference between the Price Wizard price and the last market price, and the effective valuation date.
Use the scroll bars to move through the signal list. Right click on any equity to see more menu options.
You may also sort each column by clicking the column header.
Security The Bloomberg symbol for this security
Sector The GICS sector name for the stock
MktCap Market Capitalization in billions
Last Last market price (PX_LAST)
YY% 12 month price return
PW Price Price Wizard price estimate based only on the fundamentals reported through Bloomberg
PW YY% Average 12 month change in Price Wizard’s price estimate
PW Diff% Percent difference between the last market price and Price Wizard’s price.
As of This is the Date of the last Bloomberg fundamental database update or the last valuation, whichever is older
You can also right click on each line to bring up a convenient Bloomberg terminal task menu:

Parallax Financial Research
12
GP: Display Bloomberg Chart
DES: Security Description

Parallax Financial Research
13
Price Wizard Output Options
There are seven output‐related buttons across the bottom. “Save List” allows the user to write the
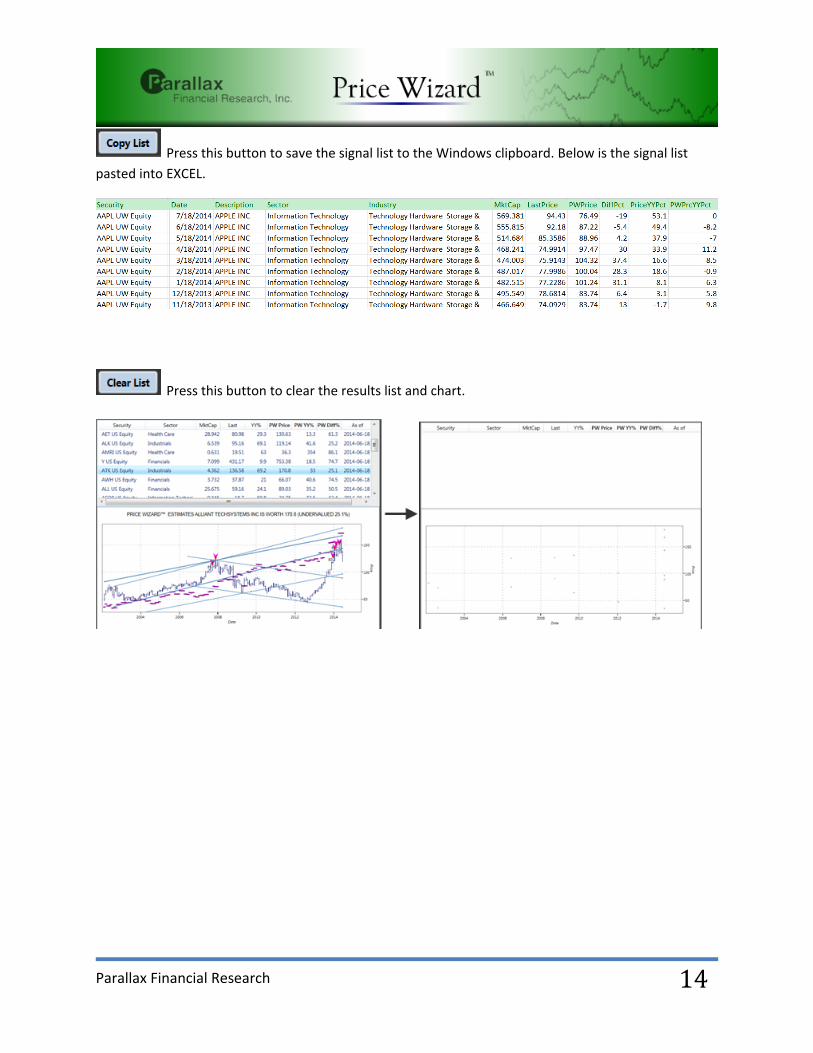
signals to a CSV file. The “Copy List” button places the same results data in the clipboard, so it can be
pasted in a spreadsheet or other compatible document. “Clear List” wipes the results list clean. The
“Print Screen” button sends an image of the current dialog box to the printer. It does not save all the
results. “Copy Screen” sends an image of the current dialog box to the clipboard. “Analysis” performs
two functions, aggregate valuation analysis and past performance analysis. The “Studies+” button adds
other Parallax technical studies to the current chart. Note that these studies are available individually
from the Bloomberg APP store. Finally, the “ChartBook+” button accumulates the user’s favorite chart
images for later printing and viewing.
Press this button to save the signal list to a comma delimited text file.
Parallax Financial Research
14
Press this button to save the signal list to the Windows clipboard. Below is the signal list
pasted into EXCEL.
Press this button to clear the results list and chart.

Parallax Financial Research
15
Press this button to print a copy of the screen image.
Press this button to copy an image of the screen to the windows clipboard. This allows you
to paste the image in a report or email.

Parallax Financial Research
16
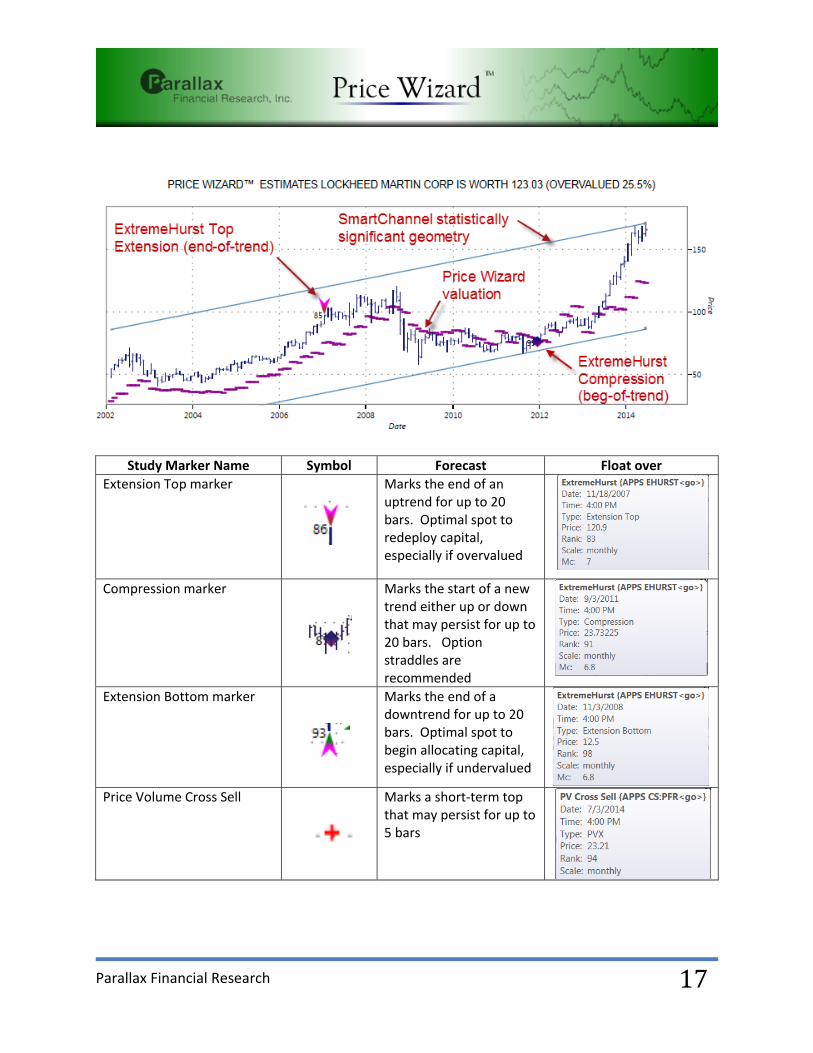
Press the “Studies+” button to add additional studies to the selected chart. Once pressed, we run ExtremeHurst (Custom Study “PFEH”), SmartChannel (Custom Study “PFSC”) and Price‐Volume
Crossover (Custom Study “PFPVC”) studies. These studies are available through the Bloomberg app
store at either APPS EHURST <go> or APPS CS:PFR <go>.
Chart with Parallax Studies added
Parallax Financial Research
17
Study Marker Name Symbol Forecast Float over
Extension Top marker
Marks the end of an uptrend for up to 20 bars. Optimal spot to redeploy capital, especially if overvalued
Compression marker
Marks the start of a new trend either up or down that may persist for up to 20 bars. Option straddles are recommended
Extension Bottom marker
Marks the end of a downtrend for up to 20 bars. Optimal spot to begin allocating capital, especially if undervalued
Price Volume Cross Sell
Marks a short‐term top that may persist for up to 5 bars

Parallax Financial Research
18
Price Volume Cross Buy
Marks a short‐term bottom that may persist for up to 5 bars
SmartChannel Lines Marks support and resistance

Parallax Financial Research
19
Press this button to save the current chart image to a book for later printing and review.
On the printout, we also include current fundamental data:

Parallax Financial Research
20
Our Help screen is shown below. Our links were not allowed to be live.
Parallax Financial Research, Inc. is a small scientific research boutique in Redmond, WA. The firm
empowers professional money managers with a distinct edge through its unique fundamental and
quantitative stock and commodity models. Our models are composed of individual "predictors" which
are based on the financial application of both chaos and complexity theories, and presented in clear
visualizations. These predictors are blended into forecasting models using genetically‐enhanced neural
networks. Our careful application of these mathematical modeling techniques yields unique and
powerful solutions to enhance manager performance. Visit our website at www.pfr.com
Parallax Financial Research
21
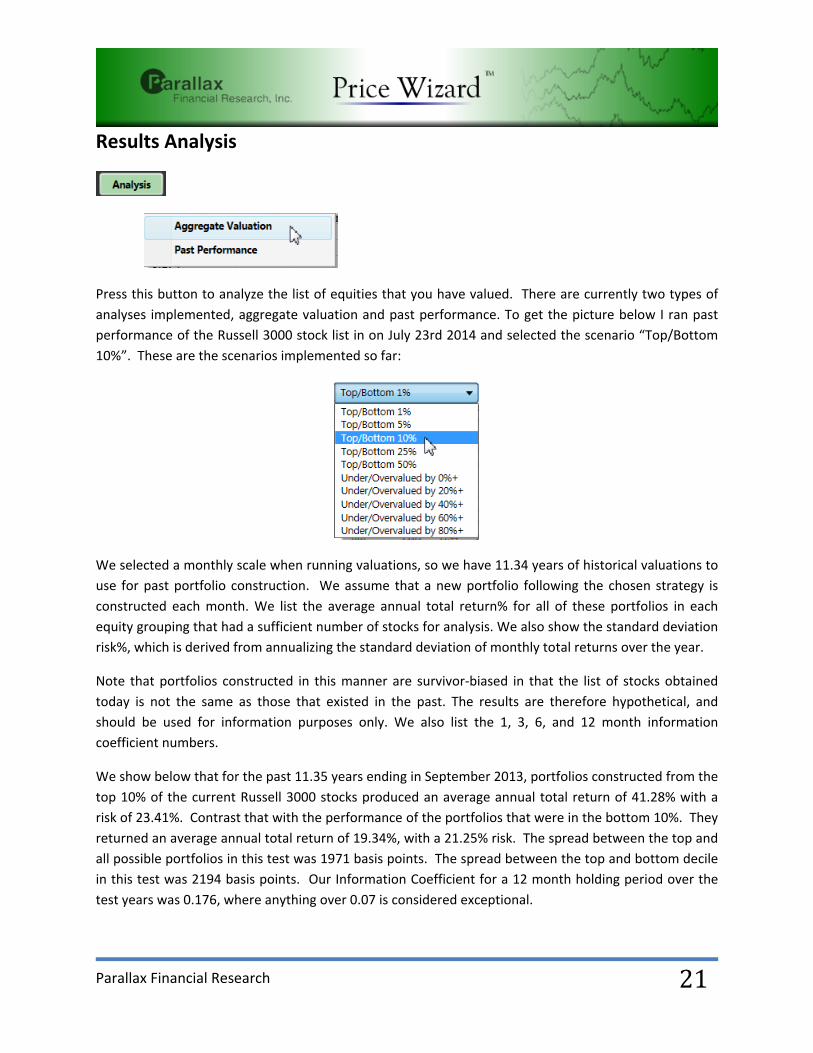
Results Analysis
Press this button to analyze the list of equities that you have valued. There are currently two types of
analyses implemented, aggregate valuation and past performance. To get the picture below I ran past
performance of the Russell 3000 stock list in on July 23rd 2014 and selected the scenario “Top/Bottom
10%”. These are the scenarios implemented so far:
We selected a monthly scale when running valuations, so we have 11.34 years of historical valuations to
use for past portfolio construction. We assume that a new portfolio following the chosen strategy is
constructed each month. We list the average annual total return% for all of these portfolios in each
equity grouping that had a sufficient number of stocks for analysis. We also show the standard deviation
risk%, which is derived from annualizing the standard deviation of monthly total returns over the year.
Note that portfolios constructed in this manner are survivor‐biased in that the list of stocks obtained
today is not the same as those that existed in the past. The results are therefore hypothetical, and
should be used for information purposes only. We also list the 1, 3, 6, and 12 month information
coefficient numbers.
We show below that for the past 11.35 years ending in September 2013, portfolios constructed from the
top 10% of the current Russell 3000 stocks produced an average annual total return of 41.28% with a
risk of 23.41%. Contrast that with the performance of the portfolios that were in the bottom 10%. They
returned an average annual total return of 19.34%, with a 21.25% risk. The spread between the top and
all possible portfolios in this test was 1971 basis points. The spread between the top and bottom decile
in this test was 2194 basis points. Our Information Coefficient for a 12 month holding period over the
test years was 0.176, where anything over 0.07 is considered exceptional.

Parallax Financial Research
22
PriceWizardResultsfortop2500USStocks(usingRussell3000IndexholdingsonAug19,2014–about2500hadrecentvaluations)
Top5%
Top10%

Parallax Financial Research
23
The picture below is a graph of the information coefficient from the table above:

Parallax Financial Research
24
The numbers in blue represent the aggregate valuations for each equity group. We list the equal‐
weighted average, cap‐weighted average, and the median valuation. Negative numbers mean the group
is overvalued.
The Aggregate Valuation of Russell 3000 stocks on Sept 23, 2014 are shown below (<0 means
overvalued):

Parallax Financial Research
25
Use Price Wizard to evaluate the overall valuation of the market:
It probably should be noted that these stocks are overvalued by a median of 9.9% at this writing. This
implies that a correction might be coming in the near future.

Parallax Financial Research
26
Price Wizard™ is International
Price Wizard works world‐wide too! Below are analyses of several international stock groupings that
were run on Sept 23th, 2014.
EuropeanStocks(SXXPIndexsince2008)
JapaneseStocks(NKYIndexsince2008)
CanadianStocks(SPTSXIndexsince2008)

Parallax Financial Research
27
ChineseStocks(SHCOMPIndexsince2008)
IndiaStocks(CNX500Index)
Price Wizard Users
Several money managers are using or have used the ExtremeHurst product as a part of their
management business and have consented to be listed as references for potential users:
1. MARTIN MCBROOM, PRESIDENT
MCBROOM & ASSOCIATES, LLC.
6795 EDMOND ST. #10
LAS VEGAS, NEVADA 89118
(213) 612‐4626
EMAIL: [email protected]
2. BILL MECKEL, PRESIDENT
MARQUE MILLENNIUM CAPITAL MANAGEMENT
850 THIRD AVE, FLOOR 18
NEW YORK, NY 10022
(212) 759‐6800
EMAIL: [email protected]

Parallax Financial Research
28
Price Wizard Hints & FAQs
What does Price Wizard do?
It finds the most reasonable market price for a company’s stock, given the reported fundamentals.
Why does it work? Unlike other methods, Price Wizard considers all the sources of corporate value at the same time, and in the context of the specific industry. A company with negative earnings may be very valuable, but conventional methods might exclude it from investment searches.
I already have a stock valuation process, so why do I need Price Wizard?
Price Wizard’s approach is very different from standard methods. It provides another opinion of value, and our research shows that the top decile, ranked by Price Wizard, significantly outperforms
How can I test Price Wizard?
We have two ways you can do testing. First run valuations for your stock universe. Then, under “Additional Options”, check the “Historical Data Output” and save/copy the list to a file. All of the historic valuations will be available to you for testing. In addition we have an “Analysis” button which will run a number of simple portfolio construction strategies and report annual test results.
How long do signals last? Fundamental valuation is a long‐term utility, meaning 6‐12months. Stocks that are significantly undervalued tend to move toward value over time. Company fundamentals tend to move slowly, and are only released quarterly.
Which securities work best?
Any stock should work as long as the required fundamentals have been reported accurately
Where does it run? Price Wizard runs locally on your computer using your CPU unless you use Bloomberg Anywhere on the web, which runs on Bloomberg servers
Less CPU impact Price Wizard is compute‐intensive and will spike your CPU. Run it at night or when few other programs are running or consider running it over the web at https://bba.bloomberg.net/
Use fewer securities Hone your universe to only the securities that you need and either place them in a Bloomberg portfolio, use the holdings of an index, or use our security file format where each line contains one security:
Can I see Price Wizard valuations on Bloomberg charts?
Not yet. Perhaps it will be possible in the future
How well does it work? Universe: Russell 3000 Index stocks from 2002‐mid 2014 Top 10% Long-only average annual gain= 41.28% with Rew/Risk of 1.76 Top/Bottom decile spread return is 21.94% Ave 1 month IC of 0.091
Why is it so expensive? The signals are highly predictive and will increase your portfolio performance….or you can cancel. Subscriptions are month‐to‐month

Parallax Financial Research
29
Can I use soft dollars to pay for it?
Yes, if you use TradeBook. Contact Sean Steinmetz at (212) 617‐3237 to arrange
Can you extend my trial period?
Yes, if you are serious about purchasing and are willing to have a one‐on‐one walkthrough to make sure that you know exactly how it might fit in your workflow. Contact us.
Why are some valuations missing?
Either some data item was missing or our methodology failed to converge on a price.
Why do some valuations appear to jump up or down sometimes?
Either some data items are in error, such as earnings at 120.0 instead of 12.0, or our methodology has converged on an alternate acceptable solution. To check the fundamental inputs, just save the list of valuations with the History option checked.
How does ExtremeHurst compare to Ford and Holt?
We have studied both Holt’s and Ford’s literature, and our performance appears to be comparable.
Can I request some additions to your application?
Yes, we welcome all comments and requests. It helps us plan for upgrades
Can I search BB Monitor Lists
Not at this time, but we have requested this functionality