PRICE WATCH February 2015 Prices March 31,...
38
FEWS NET [email protected] www.fews.net FEWS NET is a USAID-funded activity. The content of this report does not necessarily reflect the view of the United States Agency for International Development or the United States Government PRICE WATCH February 2015 Prices March 31, 2015 KEY MESSAGES In West Africa, market availability was adequate in February, with supplies from recent 2014/15 harvests and international rice and wheat imports. Staple food prices were stable or declining, except in areas directly and indirectly affected by the conflict in northeastern Nigeria. The recent opening of borders among Ebola-affected countries contributed to improved trade flows in some areas, following disruptions over the second half of 2014 (Pages 3-6). In East Africa, maize markets were well-supplies decline in Tanzania, Kenya, Somalia, and surplus-producing areas of Ethiopia with recent harvests and regional trade flows. Markets were likewise well supplied with in Somalia, Sudan, and Ethiopia. Staple food prices were high and variable in the Greater Upper Nile States of South Sudan. Conflict and insecurity continued to disrupt markets in parts of South Sudan, Somalia, and the Darfur and South Kordofan States in Sudan (Pages 6-10). In Southern Africa, regional staple food stocks continued to tighten in February, but availability remains higher than previous years. Harvests from the 2013/14 production year were well-above average in the region’s surplus-producing countries. Food availability improved in flood-affected southern Malawi as road conditions improved and with increased food assistance (Pages 10-13). Locally produced staple food prices increased progressively throughout Central America and Caribbean as market supplies from the below-average Otoño harvest in Haiti and Postrera harvest in Central America decreased earlier than normal. Imported wheat, yellow maize, and rice availability and prices were stable region-wide (Pages_14-15). In Central Asia, wheat availability remained good in Afghanistan and Pakistan. Prices stabilized in Kazakhstan and Tajikistan after increasing over the last quarter of 2014 (Pages 16-17). International maize, rice, and soybean prices were stable while wheat prices declined slightly in February, and all were below February 2014 levels due very well supplied global markets from record or near record global production in 2014. Crude oil prices increased slightly in February, but remained below average. (Pages 2-3). Figure 1. FEWS NET regional price indices and FAO Food Price Index, January 2010 – January 2015 Sources: FAO and FEWS NET The Famine Early Warning Systems Network (FEWS NET) monitors trends in staple food prices in countries at risk of food insecurity. The Price Watch provides an update on market and price trends in selected reference markets. Specific trends for key reference markets and commodities are available in the Price Watch Annexes 1 and 2. FEWS NET gratefully acknowledges partner organizations, ministries of agriculture, national market information systems, the Regional Agricultural Intelligence Network, the Food and Agriculture Organization of the United Nations (FAO), the World Food Programme (WFP), and others for their assistance in providing price data.
Transcript of PRICE WATCH February 2015 Prices March 31,...

FEWS NET
[email protected] www.fews.net
FEWS NET is a USAID-funded activity. The content of this report does not necessarily reflect
the view of the United States Agency for International Development or the United States Government
PRICE WATCH February 2015 Prices March 31, 2015
KEY MESSAGES
In West Africa, market availability was adequate in February, with supplies from recent 2014/15 harvests and international rice and wheat imports. Staple food prices were stable or declining, except in areas directly and indirectly affected by the conflict in northeastern Nigeria. The recent opening of borders among Ebola-affected countries contributed to improved trade flows in some areas, following disruptions over the second half of 2014 (Pages 3-6).
In East Africa, maize markets were well-supplies decline in Tanzania, Kenya, Somalia, and surplus-producing areas of Ethiopia with recent harvests and regional trade flows. Markets were likewise well supplied with in Somalia, Sudan, and Ethiopia. Staple food prices were high and variable in the Greater Upper Nile States of South Sudan. Conflict and insecurity continued to disrupt markets in parts of South Sudan, Somalia, and the Darfur and South Kordofan States in Sudan (Pages 6-10).
In Southern Africa, regional staple food stocks continued to tighten in February, but availability remains higher than previous years. Harvests from the 2013/14 production year were well-above average in the region’s surplus-producing countries. Food availability improved in flood-affected southern Malawi as road conditions improved and with increased food assistance (Pages 10-13).
Locally produced staple food prices increased progressively throughout Central America and Caribbean as market supplies from the below-average Otoño harvest in Haiti and Postrera harvest in Central America decreased earlier than normal. Imported wheat, yellow maize, and rice availability and prices were stable region-wide (Pages_14-15).
In Central Asia, wheat availability remained good in Afghanistan and Pakistan. Prices stabilized in Kazakhstan and Tajikistan after increasing over the last quarter of 2014 (Pages 16-17).
International maize, rice, and soybean prices were stable while wheat prices declined slightly in February, and all were below February 2014 levels due very well supplied global markets from record or near record global production in 2014. Crude oil prices increased slightly in February, but remained below average. (Pages 2-3).
Figure 1. FEWS NET regional price indices and FAO Food Price Index,
January 2010 – January 2015
Sources: FAO and FEWS NET
The Famine Early Warning Systems Network (FEWS NET) monitors trends in staple food prices in countries at risk of food insecurity. The Price Watch
provides an update on market and price trends in selected reference markets. Specific trends for key reference markets and commodities are available in the Price Watch Annexes 1 and 2. FEWS NET gratefully acknowledges partner organizations, ministries of agriculture, national market information systems, the Regional Agricultural Intelligence Network, the Food and Agriculture Organization of the United Nations (FAO), the World Food
Programme (WFP), and others for their assistance in providing price data.
PRICE WATCH March 2015
Famine Early Warning Systems Network 2
INTERNATIONAL MARKETS
Current situation
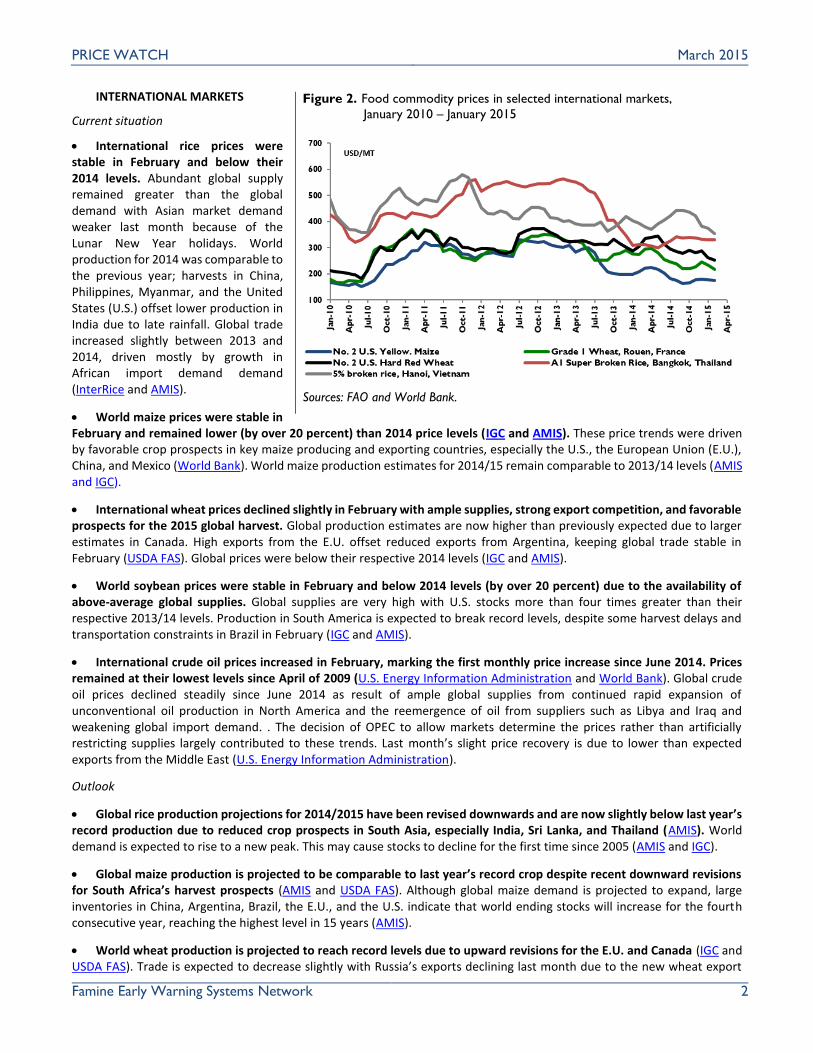
International rice prices were stable in February and below their 2014 levels. Abundant global supply remained greater than the global demand with Asian market demand weaker last month because of the Lunar New Year holidays. World production for 2014 was comparable to the previous year; harvests in China, Philippines, Myanmar, and the United States (U.S.) offset lower production in India due to late rainfall. Global trade increased slightly between 2013 and 2014, driven mostly by growth in African import demand demand (InterRice and AMIS).
World maize prices were stable in February and remained lower (by over 20 percent) than 2014 price levels (IGC and AMIS). These price trends were driven by favorable crop prospects in key maize producing and exporting countries, especially the U.S., the European Union (E.U.), China, and Mexico (World Bank). World maize production estimates for 2014/15 remain comparable to 2013/14 levels (AMIS and IGC).
International wheat prices declined slightly in February with ample supplies, strong export competition, and favorable prospects for the 2015 global harvest. Global production estimates are now higher than previously expected due to larger estimates in Canada. High exports from the E.U. offset reduced exports from Argentina, keeping global trade stable in February (USDA FAS). Global prices were below their respective 2014 levels (IGC and AMIS).
World soybean prices were stable in February and below 2014 levels (by over 20 percent) due to the availability of above-average global supplies. Global supplies are very high with U.S. stocks more than four times greater than their respective 2013/14 levels. Production in South America is expected to break record levels, despite some harvest delays and transportation constraints in Brazil in February (IGC and AMIS).
International crude oil prices increased in February, marking the first monthly price increase since June 2014. Prices remained at their lowest levels since April of 2009 (U.S. Energy Information Administration and World Bank). Global crude oil prices declined steadily since June 2014 as result of ample global supplies from continued rapid expansion of unconventional oil production in North America and the reemergence of oil from suppliers such as Libya and Iraq and weakening global import demand. . The decision of OPEC to allow markets determine the prices rather than artificially restricting supplies largely contributed to these trends. Last month’s slight price recovery is due to lower than expected exports from the Middle East (U.S. Energy Information Administration).
Outlook
Global rice production projections for 2014/2015 have been revised downwards and are now slightly below last year’s record production due to reduced crop prospects in South Asia, especially India, Sri Lanka, and Thailand (AMIS). World demand is expected to rise to a new peak. This may cause stocks to decline for the first time since 2005 (AMIS and IGC).
Global maize production is projected to be comparable to last year’s record crop despite recent downward revisions for South Africa’s harvest prospects (AMIS and USDA FAS). Although global maize demand is projected to expand, large inventories in China, Argentina, Brazil, the E.U., and the U.S. indicate that world ending stocks will increase for the fourth consecutive year, reaching the highest level in 15 years (AMIS).
World wheat production is projected to reach record levels due to upward revisions for the E.U. and Canada (IGC and USDA FAS). Trade is expected to decrease slightly with Russia’s exports declining last month due to the new wheat export
Figure 2. Food commodity prices in selected international markets,
January 2010 – January 2015
Sources: FAO and World Bank.

PRICE WATCH March 2015
Famine Early Warning Systems Network 3
duty, which started on February 1 and will last until June 30 in response to recent depreciation of the local currency and resulting increase in export demand and domestic prices increases (USDA FAS). Global stocks ending in 2015 are projected to reach their highest level in twelve years, but consumption is also expected to rise (AMIS and IGC).
The global soybean production forecast indicates record global production and trade levels in 2014/15, with an 11 percent increase from 2013/14 output (IGC).The large harvests (particularly among South American exporters) will increase global stock levels. Global consumption is forecast to rise as well and world trade is projected to reach a new record level (AMIS and IGC).
International crude oil prices are expected to decline further over 2015, with the 2015 average price projected to be 45 percent lower than that of 2014. Non-OPEC oil production is expected to continue rising, encouraged by innovative technique exploration. However, fuel prices may increase in some importing countries due to the depreciation of the local currency vis- à-vis the U.S. dollar and changing local fuel price policies (U.S. Energy Information Administration and World Bank).
Staple food price trends across the FEWS NET countries will vary considerably in the coming months in response to local and regional market conditions; international market trends will play a more limited role in most countries (Figure 1). Fuel price trends in FEWS NET countries will depend on both international market conditions, the evolution of local exchange rates in relation to the U.S. Dollar, and the design and implementation of local fuel import and price policies.
WEST AFRICA
In West Africa markets were generally well-supplied in February with recent regional 2014/15 cereal harvests (maize, sorghum, and millet) and stable imports of rice and wheat from international markets. Carryover stocks from the 2013/14 marketing year and 2014/15 production were generally above average in the region’s surplus-producing countries (Nigeria, Benin, Ghana, the Côte d’Ivoire, Mali, and Burkina Faso), resulting in above-average levels of exportable regional surpluses. Trade flows within the region are generally taking place without any major disruptions, with the exception of the Ebola affected countries (Guinea, Liberia, and Sierra Leone) and those areas directly and indirectly affected by the violence and conflict in emanating from north Eastern Nigeria and the Central African Republic. However, market activities and price trends varied considerably by commodity and by marketing basin.
Regional maize production was over 10 percent above average, resulting in ample market supplies in the region’s main production zones (the central and eastern marketing basins). Prices were stable or declined between January and February, during the post-harvest period, and were generally average to below average. Prices in Nigeria, the region’s largest producer, were over 20 percent below average in some essential markets (Dawano). Market prices increased sharply in parts of Chad (Bol and Moussoro) in February due to the effects of localized below-average production and increased demand from displaced populations.
Regional millet production continued on a downward trend in 2014 (29 percent below average), as producers shifted towards relatively more profitable maize and sesame. Sorghum production was average at a regional level, but 34 percent below average in the western marketing basin (Mauritania and Senegal). Regional millet and sorghum prices were generally stable between January and February, although prices did increase in parts of Mauritania.
The region is particularly well supplied with locally-produced and imported rice. Regional rice production has expanded in recent years, and was over 20 percent above average in 2014. Rice imports have recently been most intense in major consuming countries such as Nigeria and Senegal. Indeed, in Senegal, the availability of ample imported rice supplies at stable international prices have helped to offset the effects on staple food markets of subsequent years of below-average production.
Below-average pasture availability in some of region’s most important pastoral and agro-pastoral areas has negatively affected ruminant livestock production conditions in many areas in January, at the end of the pastoral grazing period. Sheep supply in northern Burkina Faso (Djibo) increased in February as pastoralists sold off parts of their herds. Sheep prices in Mauritania were up to 18 percent below their 2014 levels in January. Furthermore, the conflicts in northeastern Nigeria and in the Central African Republic (CAR) have disrupted livestock movement and trade flows in affected areas. Sheep prices in Chad, where trade is affected by both conflicts, continued to decline in January. Livestock prices have declined progressively in affected areas in recent months.
PRICE WATCH March 2015
Famine Early Warning Systems Network 4
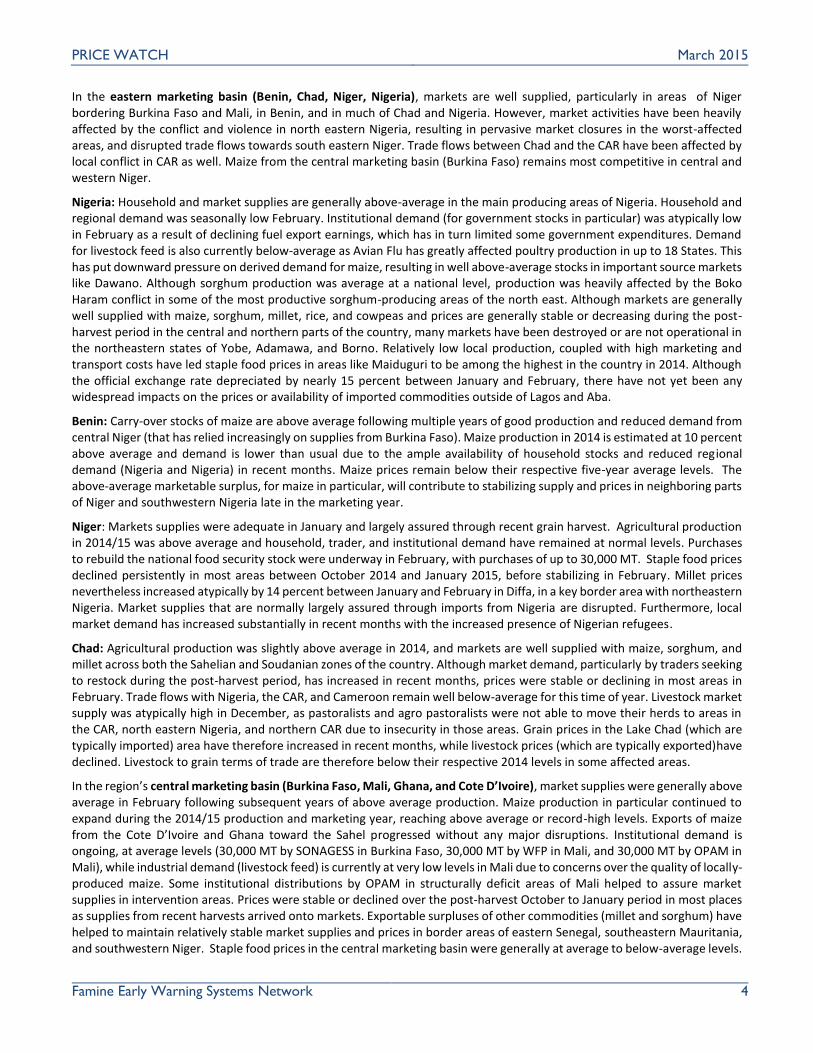
In the eastern marketing basin (Benin, Chad, Niger, Nigeria), markets are well supplied, particularly in areas of Niger bordering Burkina Faso and Mali, in Benin, and in much of Chad and Nigeria. However, market activities have been heavily affected by the conflict and violence in north eastern Nigeria, resulting in pervasive market closures in the worst-affected areas, and disrupted trade flows towards south eastern Niger. Trade flows between Chad and the CAR have been affected by local conflict in CAR as well. Maize from the central marketing basin (Burkina Faso) remains most competitive in central and western Niger.
Nigeria: Household and market supplies are generally above-average in the main producing areas of Nigeria. Household and regional demand was seasonally low February. Institutional demand (for government stocks in particular) was atypically low in February as a result of declining fuel export earnings, which has in turn limited some government expenditures. Demand for livestock feed is also currently below-average as Avian Flu has greatly affected poultry production in up to 18 States. This has put downward pressure on derived demand for maize, resulting in well above-average stocks in important source markets like Dawano. Although sorghum production was average at a national level, production was heavily affected by the Boko Haram conflict in some of the most productive sorghum-producing areas of the north east. Although markets are generally well supplied with maize, sorghum, millet, rice, and cowpeas and prices are generally stable or decreasing during the post-harvest period in the central and northern parts of the country, many markets have been destroyed or are not operational in the northeastern states of Yobe, Adamawa, and Borno. Relatively low local production, coupled with high marketing and transport costs have led staple food prices in areas like Maiduguri to be among the highest in the country in 2014. Although the official exchange rate depreciated by nearly 15 percent between January and February, there have not yet been any widespread impacts on the prices or availability of imported commodities outside of Lagos and Aba.
Benin: Carry-over stocks of maize are above average following multiple years of good production and reduced demand from central Niger (that has relied increasingly on supplies from Burkina Faso). Maize production in 2014 is estimated at 10 percent above average and demand is lower than usual due to the ample availability of household stocks and reduced regional demand (Nigeria and Nigeria) in recent months. Maize prices remain below their respective five-year average levels. The above-average marketable surplus, for maize in particular, will contribute to stabilizing supply and prices in neighboring parts of Niger and southwestern Nigeria late in the marketing year.
Niger: Markets supplies were adequate in January and largely assured through recent grain harvest. Agricultural production in 2014/15 was above average and household, trader, and institutional demand have remained at normal levels. Purchases to rebuild the national food security stock were underway in February, with purchases of up to 30,000 MT. Staple food prices declined persistently in most areas between October 2014 and January 2015, before stabilizing in February. Millet prices nevertheless increased atypically by 14 percent between January and February in Diffa, in a key border area with northeastern Nigeria. Market supplies that are normally largely assured through imports from Nigeria are disrupted. Furthermore, local market demand has increased substantially in recent months with the increased presence of Nigerian refugees.
Chad: Agricultural production was slightly above average in 2014, and markets are well supplied with maize, sorghum, and millet across both the Sahelian and Soudanian zones of the country. Although market demand, particularly by traders seeking to restock during the post-harvest period, has increased in recent months, prices were stable or declining in most areas in February. Trade flows with Nigeria, the CAR, and Cameroon remain well below-average for this time of year. Livestock market supply was atypically high in December, as pastoralists and agro pastoralists were not able to move their herds to areas in the CAR, north eastern Nigeria, and northern CAR due to insecurity in those areas. Grain prices in the Lake Chad (which are typically imported) area have therefore increased in recent months, while livestock prices (which are typically exported)have declined. Livestock to grain terms of trade are therefore below their respective 2014 levels in some affected areas.
In the region’s central marketing basin (Burkina Faso, Mali, Ghana, and Cote D’Ivoire), market supplies were generally above average in February following subsequent years of above average production. Maize production in particular continued to expand during the 2014/15 production and marketing year, reaching above average or record-high levels. Exports of maize from the Cote D’Ivoire and Ghana toward the Sahel progressed without any major disruptions. Institutional demand is ongoing, at average levels (30,000 MT by SONAGESS in Burkina Faso, 30,000 MT by WFP in Mali, and 30,000 MT by OPAM in Mali), while industrial demand (livestock feed) is currently at very low levels in Mali due to concerns over the quality of locally-produced maize. Some institutional distributions by OPAM in structurally deficit areas of Mali helped to assure market supplies in intervention areas. Prices were stable or declined over the post-harvest October to January period in most places as supplies from recent harvests arrived onto markets. Exportable surpluses of other commodities (millet and sorghum) have helped to maintain relatively stable market supplies and prices in border areas of eastern Senegal, southeastern Mauritania, and southwestern Niger. Staple food prices in the central marketing basin were generally at average to below-average levels.

PRICE WATCH March 2015
Famine Early Warning Systems Network 5
In the western marketing basin (Senegal and Mauritania), grain production was 10 percent below average, overall. However, production of millet and sorghum, two important local grains, was over 40 percent below average. Markets supplies in the western marketing basin have remained adequate due to the availability of imported rice and wheat from stable international markets and imports of regionally-produced grains (particularly in areas bordering Mali). These trade flows continued in February, despite Mauritania’s official border closure with Mali.
Mauritania: Local sorghum production was 27 percent below average over the 2014/15 production season. Markets were nevertheless well supplied with imported wheat and rice from international markets. Border areas with Mali (such as Adel Bagrou) were supplied with sorghum by markets in neighboring Mali, and at the lowest nation-wide. Indeed, prices in Adel Bagrou were among the only prices to decline with the onset of the harvest period (although prices there did increase there in February). Pastoral grazing conditions are below-normal and pastoralists are relying more on wheat as livestock feed, which has put additional upward pressure on staple food prices. Staple food prices are above-average in all markets, except in markets bordering neighboring Mali. Livestock prices have declined in recent months, resulting in declining terms of trade in some agro pastoral areas.
Senegal: Staple food availability improved in February with the arrival of new harvests onto markets. This is despite the well below average production this year (over 30 percent below average). Regional imports (millet, sorghum, and maize) and record high Imports from international (rice and maize) were adequate to meet local needs and keep prices from increasing drastically in recent months. Rice importers in Senegal have been effective in assuring adequate market supplies. The effects of subsequent years of below-average production has largely been offset on markets by the presence of these imports and staple foods prices in Senegal have remained stable in recent months. The exception to this general trends is in the border areas with Guinea, where there border was closed through the last week of January 2015 due to concerns over the Ebola outbreak. Disruptions along key marketing corridors has put upward pressure on marketing costs, resulting in increasing in prices in some key markets (Ziguinchor).
Markets in the countries most affected by the Ebola outbreak (Guinea, Liberia, and Sierra Leone) experienced significant disruptions (and outright closures) in many areas over the second half of 2014. This resulted in a significant overall decline in economic activities in each of the affected countries. By late December 2014, many markets and borders reopened, after closures due to concerns over the spread of the disease. Despite these opportunities for the improved movement of goods, many actual border crossing points remained closed, making trade more difficult and costly. Harvests and marketing of dry season rice and tubers and garden vegetables (tomato, carrots, cabbage, and lettuce) progressed, albeit at reduced levels compared to a normal year.
Figures 3-6. Price trends in selected markets in
West Africa
Sources: Information System on agricultural markets (SIMA) Niger, Agricultural Market
Observatory (OMA) Mali, Burkina Faso SONAGESS, Information System market (SIM) in Senegal, the World Food Programme (WFP), and FEWSNET.

PRICE WATCH March 2015
Famine Early Warning Systems Network 6
Market were well supplied in Guinea in February. However, the prices of many locally produced commodities and some livestock were below their respective 2013 levels in December. This is attributed to difficulties marketing over long distances (including regional markets) that has resulted in excess supply in many places. Imported rice prices were stable.
Staple food prices declined in Sierra Leone between October and December, during the post-harvest period. Local and imported commodity prices were similar to or above their respective 2014 levels due the effects of the Ebola-related markets disruptions.
In Liberia, imported rice prices were generally stable in January in most markets due to the availability of supplies from the recently concluded local rice harvest. However, food prices were above their respective 2014 levels in Monrovia (local price) and Tubmanburg (imported rice) due to the combined effects of disruptions along domestic marketing corridors and the lagged effect of the depreciation of the Liberian dollar.
Outlook
Market supplies are expected to increase in the coming months in both rural and urban areas as well as trade flows between surplus and deficit areas progress in February and March 2015. Market demand will likewise decline as agricultural household food availability improves following recent grain and tuber harvests. Institutional purchases are expected to be average and not have any major impacts on market activities. Staple food prices are expected to stabilize in the coming months as the marketing season progresses. Trade opportunities in northeastern Nigeria and in border areas of neighboring countries will vary with the outbreaks of violence and conflict. Many markets in the directly affected areas will likely remain closed or destroyed. Trade flows within and between the Ebola affected countries will likely improve in many places, now that many borders have reopened and the disease caseload and stabilized. Trade flows between Mali and neighboring Mauritania and Senegal will progress over the 2014/15 marketing year, and will continue to stabilize supplies and prices in border areas. Prices are generally expected to follow season trends, although seasonal price increases may be limited as the lean season sets in, due to the ample availability of regional supplies. FEWS NET will monitor the recent depreciation of the XOF and NGN and any potential implication for imports of rice and wheat from international markets, particularly in Senegal and Nigeria.
EAST AFRICA
Current Situation
In East Africa, maize markets were well supplied with recent harvests in Tanzania, Ethiopia, and Somalia and regional imports in Kenya. Ample sorghum supplies in Ethiopia, Sudan, and Somalia supported seasonal stable or declining price trends in February. Maize prices increased seasonally in Uganda, but remained below their respective five-year average levels. Dry bean prices increased seasonally in Tanzania and Uganda. Sorghum prices remained above their five-year average levels in Sudan due to the lingering effects of below-average 2013/14 production, the depreciation of the local currency, and the partial removal of the local fuel price subsidy. In South Sudan, market supplies improved in some areas due to seasonal improvement in road access , increased supplies from the recent harvests (albeit below-average), and increasing imports from Sudan and Uganda. Staple food prices nevertheless remained exceptionally high in conflict afflicted Greater Upper Nile. Livestock prices declined seasonally in southeastern pastoral areas of Ethiopia, Kenya, and Somalia with the progression of the January-to-March dry season when animal body conditions deteriorate and market demand is low. Food availability and prices were stable in Djibouti.
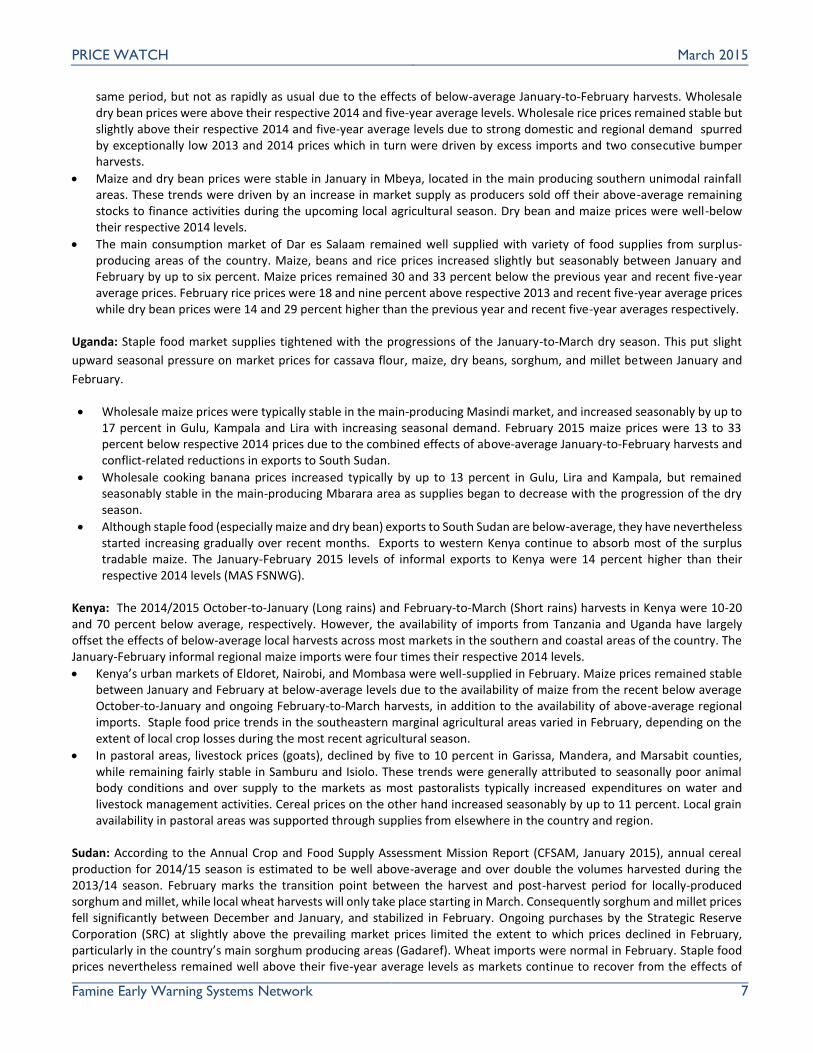
Tanzania: The January-to-February (Vuli) harvests in the northeastern bimodal rainfall areas were below average. This affected mostly local dry bean and potato production. However, these same areas had above normal July-to-September (Masika) harvests, during which the majority of producers focus more on maize production, keeping staple food supplies generally stable in January. Relatively well-supplied markets and competitive prices have continued to encourage regional exports. By February 2015, FEWS NET estimated exportable maize surpluses to be over 600,000 MT, stocked mostly in the southern highland areas.
Wholesale maize prices were atypically stable following the recent January-to-February maize and bean harvests in Arusha, the main reference market in the northeastern bimodal rainfall areas. This price stability was attributed to 50-to-60 percent below average local harvests. Prices were nevertheless below their respective 2014 and five-year average levels, reflecting two consecutive seasons of above average national harvests. Wholesale bean price decreased over the
PRICE WATCH March 2015
Famine Early Warning Systems Network 7
same period, but not as rapidly as usual due to the effects of below-average January-to-February harvests. Wholesale dry bean prices were above their respective 2014 and five-year average levels. Wholesale rice prices remained stable but slightly above their respective 2014 and five-year average levels due to strong domestic and regional demand spurred by exceptionally low 2013 and 2014 prices which in turn were driven by excess imports and two consecutive bumper harvests.
Maize and dry bean prices were stable in January in Mbeya, located in the main producing southern unimodal rainfall areas. These trends were driven by an increase in market supply as producers sold off their above-average remaining stocks to finance activities during the upcoming local agricultural season. Dry bean and maize prices were well-below their respective 2014 levels.
The main consumption market of Dar es Salaam remained well supplied with variety of food supplies from surplus-producing areas of the country. Maize, beans and rice prices increased slightly but seasonably between January and February by up to six percent. Maize prices remained 30 and 33 percent below the previous year and recent five-year average prices. February rice prices were 18 and nine percent above respective 2013 and recent five-year average prices while dry bean prices were 14 and 29 percent higher than the previous year and recent five-year averages respectively.
Uganda: Staple food market supplies tightened with the progressions of the January-to-March dry season. This put slight
upward seasonal pressure on market prices for cassava flour, maize, dry beans, sorghum, and millet between January and
February.
Wholesale maize prices were typically stable in the main-producing Masindi market, and increased seasonably by up to 17 percent in Gulu, Kampala and Lira with increasing seasonal demand. February 2015 maize prices were 13 to 33 percent below respective 2014 prices due to the combined effects of above-average January-to-February harvests and conflict-related reductions in exports to South Sudan.
Wholesale cooking banana prices increased typically by up to 13 percent in Gulu, Lira and Kampala, but remained seasonably stable in the main-producing Mbarara area as supplies began to decrease with the progression of the dry season.
Although staple food (especially maize and dry bean) exports to South Sudan are below-average, they have nevertheless started increasing gradually over recent months. Exports to western Kenya continue to absorb most of the surplus tradable maize. The January-February 2015 levels of informal exports to Kenya were 14 percent higher than their respective 2014 levels (MAS FSNWG).
Kenya: The 2014/2015 October-to-January (Long rains) and February-to-March (Short rains) harvests in Kenya were 10-20 and 70 percent below average, respectively. However, the availability of imports from Tanzania and Uganda have largely offset the effects of below-average local harvests across most markets in the southern and coastal areas of the country. The January-February informal regional maize imports were four times their respective 2014 levels.
Kenya’s urban markets of Eldoret, Nairobi, and Mombasa were well-supplied in February. Maize prices remained stable between January and February at below-average levels due to the availability of maize from the recent below average October-to-January and ongoing February-to-March harvests, in addition to the availability of above-average regional imports. Staple food price trends in the southeastern marginal agricultural areas varied in February, depending on the extent of local crop losses during the most recent agricultural season.
In pastoral areas, livestock prices (goats), declined by five to 10 percent in Garissa, Mandera, and Marsabit counties, while remaining fairly stable in Samburu and Isiolo. These trends were generally attributed to seasonally poor animal body conditions and over supply to the markets as most pastoralists typically increased expenditures on water and livestock management activities. Cereal prices on the other hand increased seasonably by up to 11 percent. Local grain availability in pastoral areas was supported through supplies from elsewhere in the country and region.
Sudan: According to the Annual Crop and Food Supply Assessment Mission Report (CFSAM, January 2015), annual cereal production for 2014/15 season is estimated to be well above-average and over double the volumes harvested during the 2013/14 season. February marks the transition point between the harvest and post-harvest period for locally-produced sorghum and millet, while local wheat harvests will only take place starting in March. Consequently sorghum and millet prices fell significantly between December and January, and stabilized in February. Ongoing purchases by the Strategic Reserve Corporation (SRC) at slightly above the prevailing market prices limited the extent to which prices declined in February, particularly in the country’s main sorghum producing areas (Gadaref). Wheat imports were normal in February. Staple food prices nevertheless remained well above their five-year average levels as markets continue to recover from the effects of
PRICE WATCH March 2015
Famine Early Warning Systems Network 8
well-below average production of 2013/14 (that led to record high prices in many markets and reduced carryover stocks), increased agricultural inputs costs (labor in particular), higher marketing costs driven by changes the fuel price policy in 2013, and the effects of other macroeconomic factors (depreciation of the local currency).
South Sudan: Foreign exchange and imported fuel scarcity continued to adversely affect staple food marketing throughout South Sudan between January and February. February 2015 staple food price trends varied considerably across South Sudan in February, but were generally higher than their respective five-year average levels.
Staple food availability was generally lowest in conflict-affected areas, resulting in very high price levels. However, even within the Greater Upper Nile (GUN) prices differed significantly from one areas to the next. These large variations were largely attributed to food assistance flows.
Relative stability and improved physical road access led to resumed economic activities in many places in the conflict-affected States in January and February. However, tensions in hotspot areas continued to limit trade along the corridors linking the main markets to secondary markets, especially those corridors that pass through areas of different political orientations. The number of traders and transporters willing to risk providing supplies to the conflict areas were also limited by the insecurity. The recent conflicts and security situation has also limited the seasonal pre-stocking of supplies by both traders and humanitarian organizations (when compared to average levels) in preparation for the rainy May-October rainy season when roads become impassable. However, pre-stocking by humanitarian organizations is currently greater than 2014 levels.
Outside of the main conflict areas, market demand is seasonally low due to increased dependence on own production. This, together with the availability of imports from Sudan and Uganda have led to stable or declining prices in the many areas. Imports of sorghum from Sudan have increased albeit at low levels following bumper harvest in the surplus-producing Blue Nile, Sinar, White Nile and Gadarif States and the easing of cross-border trade. Although cross-border trade is picking up, the volumes traded from Uganda and Sudan remain below average and yet four times higher than their respective 2014 levels.
Both domestic supplies and imports are increasingly moving past Juba market into Greater Equatoria and Bahr El Ghazal. However, the volumes traded were still lower than in the respective pre-conflict period, yet better than in 2014. In Lakes state, insecurity caused by tribal reprisal conflict and cattle raiding continued to disrupt trade along the main marketing corridors in February.
Somalia: The January-to-February (Deyr) harvests (mostly sorghum production) was almost complete in February, and is expected to be slightly above 2013/14 and five-year average levels. Staple food prices have remained stable or decreased seasonally since December 2014 as harvested crops continued to arrive onto markets.
Sorghum prices decreased typically by 19 percent between January and February in the main-producing Baidoa market. February 2015 prices were comparable to their respective 2014 levels but 16 percent below recent five year average prices.
Although white maize has been abundant in most markets in southern Somalia, prices in the main producing Qoryoley market was atypically stable between January and February. This was attributed to high demand of maize in the neighbouring regions of middle and Lower Juba which had poor production during the October-to-December seasons. February prices in these two regions were 43 percent higher than 2014 prices, but comparable to their respective five-year average levels.
Livestock prices (goat local quality) in most of the pastoral zones of central and northern Somalia have decreased by up to 22 percent when compared to six months ago. Although February prices were up to seven percent lower than their respective February 2014 levels in northern markets, a large decline of 29 percent was observed in central Somalia due to increased supply in the markets to pay off debts, food and water costs during the current December-to-April (Jilaal) dry season.
Imported commodity (rice, sugar, wheat flour and vegetable oil) prices remained stable in February due to stable and or declining world prices, and typical increased trade supply from ports..
Ethiopia: Staple food availability was adequate in February, although sorghum and maize price trends varied considerably due to variations in the October-to-January (Meher) harvest. This recent harvest accounts for 90 percent of the total food production in Ethiopia.
Staple food prices were seasonably stable between January and February in the western surplus-producing areas of the country following increased market supply from the average-to-slightly above average October-to-January (Meher)
PRICE WATCH March 2015
Famine Early Warning Systems Network 9
harvest. The prices of maize were lower than respective 2014 prices by up to 20 percent in Sodo market in SNNPR, Shoa Robit (Amhara), Delo (Oromia) and Adwa (Tigray) due to relatively better October-to-January (Meher) harvest. Similarly, sorghum prices were lower than respective 2014 prices by up to 14 percent in Dire Dawa, Karati (SNNPR), Sekota (Amhara) and Korem (Tigray).
Maize grain prices were stable or increased marginally by up to eight percent in the consumption areas in the northern and eastern areas of the country including Adigrat market in Tigray Region, Bure (Amhara), Dire Dawa (Dire Dawa) and Deder (Eastern Oromia).
Local food availability was lower than normal and consequently maize prices were unseasonably higher between January and February by up to 27 percent in some central and lowlands areas of eastern Oromia including Abomsa (Central Oromia) and Babile ( eastern Oromia) respectively. This was attributed to below average Meher production, poor performance of the 2014 March-to-May Belg rains, and delayed start of June-to-September (Kiremt) rains.
Livestock prices declined seasonably by up to 20 percent in Gode, Shinile, Degehabour and Kebridehar markets due to increased supply during the January-to-March dry season.
Djibouti: Prices of wheat flour, sorghum flour and rice remained seasonably stable in February.
Outlook
Tanzania: Below normal rainfall forecast in the remainder of the November-to-May (Msimu) season coupled with normal-to-below normal forecast for March-to-June (Masika) season in the northeastern bimodal areas will likely result in below average 2014/2015 harvests. However, the excessive 650,000 MT carryover stocks, limited storage, and the pressing need by traders to pay back maize bought on credit, will likely limited any atypical price increases for some time. Staple food prices in Tanzania are expected to remain stable in March pending downward reversal in April as a result of availability of green and early harvests. Further decrease in prices is expected with the start of Msimu harvest in May followed by Masika harvest in June.
Kenya: Cereal prices are expected to decrease seasonally across most reference markets household stocks deplete and reliance on markets intensifies. The below-average short rains crop harvest is unlikely to improve household food stocks. Continued imports of maize from Tanzania and Uganda are expected through June. As a result, any sharp spikes in prices are unlikely. Livestock prices on the other hand are expected to decline typically gradually through April, and thereafter start increasing from May through June, as the rangeland conditions improve following the onset of the long rains.
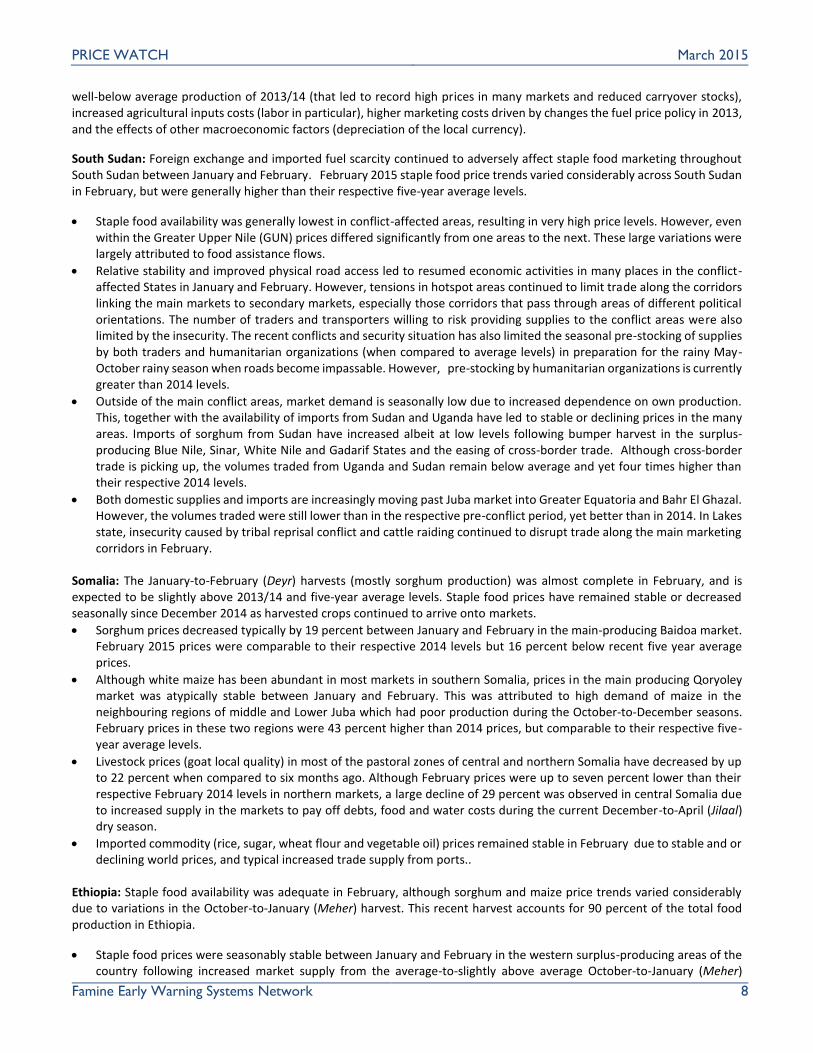
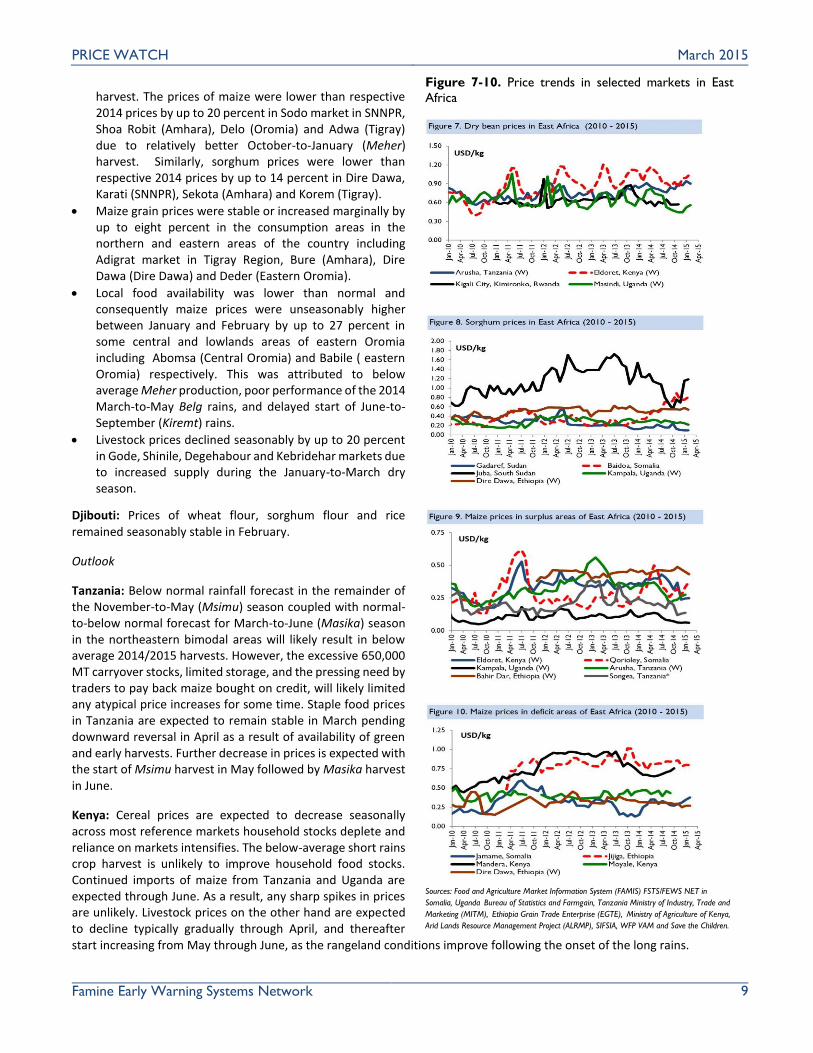
Figure 7-10. Price trends in selected markets in East
Africa
Sources: Food and Agriculture Market Information System (FAMIS) FSTS/FEWS NET in
Somalia, Uganda Bureau of Statistics and Farmgain, Tanzania Ministry of Industry, Trade and
Marketing (MITM), Ethiopia Grain Trade Enterprise (EGTE), Ministry of Agriculture of Kenya,
Arid Lands Resource Management Project (ALRMP), SIFSIA, WFP VAM and Save the Children.

PRICE WATCH March 2015
Famine Early Warning Systems Network 10
Uganda: The prices of staple food crops are expected to continue increasing gradually in line with seasonal trends through June. However, the increase in prices will likely be moderated by ample availability as a result of above average November-to-December harvests and reduced supplies to South Sudan due to conflict-related constraints.
Sudan: The prices of sorghum and miller are expected to follow a seasonal gradual increasing trend through April as supplies tighten towards the start of the May-to-September lean period. The increase in prices will likely be supported by traders holding on to stocks in anticipation of better prices in the lean season, increased pressure by traders on the government to allow formal sorghum and sesame exports, and increased procurement for strategic grain reserves. Sorghum and millet prices are likely to be below their respective 2014 levels, but above their recent five-year average levels. Locally-produced wheat prices are expected to start decreasing seasonally with the beginning of harvest in March/April 2015.
South Sudan: Staple food prices are expected to follow seasonal trends in most markets between March and April as households in non-conflict state continue to rely on own production. However, inflation caused by devaluation of South Sudan pound is expected to limit any major seasonal decline in prices. Sorghum prices in Rumbek (Lakes State) will most likely also follow the seasonal increasing trend with high variability due to insecurity. Staple food prices in conflict-affected areas in Greater Upper Nile will most likely be lower than their respective 2014 levels because of relatively better year on year humanitarian access and pre-stocking by traders. Prices are expected to be lower than the same period in 2014 in some specific counties in Upper Nile (along the Jabalein-Renk-Melut-Malakal route) and Jonglei (Gambella-Akobo-Waat/Lankien) where pre-stocking by traders is expected to be better with stocks sourced from Renk/Sudan and Ethiopia respectively during the dry February-to-May dry season. However, increased informal and formal taxes, and reduced number of traders due to high risks including disincentive to trade as a result of food aid distribution are expected to result in exorbitantly high prices of imported processed commodities like flour, sugar, salt, and oils.
Ethiopia: Staple food prices are likely to rise seasonally from March onwards particularly in the June-to-August (Belg) rains dependent areas where the main lean season runs from April to June. With the anticipated near normal to below normal March to May (Gu) rains, livestock body conditions are expected to decline. The poor livestock body conditions, increased sales due to shortage of pasture and water, and the need for cash by households to purchase food, will likely contribute to further decline in livestock prices through June.
Somalia: Staple grain prices will likely trend upwards seasonably through June due to combination of factors including reducing cereal supplies, sustained demand from deficit regions and relatively higher prices of alternative imported cereals (wheat flour and rice) which will likely add pressure to local staples. Civil insecurity and local ‘taxes’ will likely disrupt/contribute to higher prices especially cereals en route to deficit regions including urban parts of Central and Banadir regions. Although cross border white sorghum inflow from Ethiopia has been reported, it will likely have no significant impact on prices of local cereals. Imported commodity prices are most likely to be stable until May 2015 before the monsoon tides curtails sea transport. Livestock prices are likely to be stable or decline slightly through April before rising from May with the resumption of livestock export trade activities in May 2015 for the Ramadan period in June and later on for the Hajj.
Djibouti: Prices of wheat flour, sorghum flour and rice are expected to remain stable through June.
SOUTHERN AFRICA
Current Situation
Southern Africa: Regional food availability and trade flows were generally normal in February, including southern Malawi where market functioning previously disrupted by flooding in January was restored due to infrastructure repairs, such as roads and bridges. Staple food prices were stable at their highest levels of the year with the progression of the lean season, except in South Africa where maize prices rose sharply because of poor harvest prospects for 2015 based on extended periods of poorly distributed rainfall which resulted in mid-season dryness. Maize prices were generally lower than their respective 2014 levels and lower than their respective five-year average levels in all monitored countries except South Africa and Zambia were prices were lower than last year’s levels but significantly higher than the five-year average. Rice, cassava, and dry beans contributed to regional food availability and had mixed price trends. South Africa: Dry conditions during February in the largest growing regions of the Free State and North West caused irreversible damage to maize crops. The resulting unfavorable crop forecasts for a below-average 2015 harvest drove white and yellow maize prices up by 27 and 15 percent in February, surpassing the recent five-year averages by 23 and nine percent,
PRICE WATCH March 2015
Famine Early Warning Systems Network 11
respectively. Maize production is currently expected to be 32 percent below the 2014 harvest and nearly 20 percent below the recent five-year average. Pessimistic harvest prospects have prompted imports of yellow maize though by the end of February it was not yet clear how much has been imported. Despite the poor harvest prospects, domestic requirements for the 2015/15 marketing year can still be met by carry-over stocks, estimated at 2.3 million MT as of 1 May 2015, combined with and a projected 2015 harvest of 9.6 million MT as well as imports of 0.5 million MT. The country is expected to remain narrowly a net exporter with an exportable surplus of 0.74 million which may be adequate to meet regional maize demand. The large carry-over stocks from the above-average 2014 harvests kept prices below those of 2014. Formal maize grain exports to deficit areas of the region continued uninterrupted in February. However, exports were as from the beginning of the 2014/15 marketing year were 38 percent lower in comparison to the same period in the 2013/14 marketing year as a result of above-average harvests throughout the region in 2014. Zambia: Maize grain and maize meal availability remained above-average in February. Although February normally marks the peak of the lean season when prices increase significantly, prices reached their peak levels but were atypically stable owing to availability from the 2014 harvest which was 28 percent above-average. Formal maize export volumes declined between January and February.
Exceptions to this general price trend were Kasama, Mongu and Kitwe markets where prices rose seasonally by 10, 11 and five percent, respectively, between January and February.
Maize prices in February were generally close to their respective 2014 levels except for Choma (a high production area), as well as Mongu and Solwezi markets (both deficit areas) where prices were lower compared to that of 2014, by 38 percent in Choma and by 16 percent in Mongu and Solwezi, owing to above-average local harvests. However prices remained above their respective five-year average levels (by 19 to 58 percent) with the exception of Choma which had a price 10 percent lower than its respective five-year average. These above-average prices were due to the lingering effects of increases in the FRA maize purchase price in 2014 and higher marketing (transport) costs.
Maize meal prices were atypically stable at most reference markets. Although maize prices were higher for millers last month (at ZMW 1.50/KG compared to ZMW 1.40/KG that sustained until December), this stability was supported by the reduction in fuel prices by an average of 27 percent in mid-January in response to the major decline in international crude oil prices. Chipata and Choma were the two exceptions where maize meal prices rose seasonally by 11 and 10 percent, respectively. Maize meal prices were generally similar to or below 2014 levels but continued to be above the five-year average due to the lingering effects of above-average maize grain prices during the 2013/14 marketing season and higher processing and transportation costs earlier in 2014.
The National Food Reserve Agency (FRA) currently has stocks of up to 1,260,000 MT, part of which is available for sale locally at ZMK 1.50 per kilogram and internationally at USD 240 per MT. Formal maize exports to Zimbabwe followed typical trends and decreased by 25 percent between January and February. Informal maize exports to DRC also decreased by 30 percent while maize inflows from Mozambique remained stable as is typical in February.
Tanzania: The January-to-February (Vuli) harvests in the northeastern bimodal rainfall areas were below average. This affected mostly local dry bean and potato production. However, these same areas had above normal July-to-September (Masika) harvests, during which the majority of producers focus more on maize production, keeping staple food supplies generally stable in January. Relatively well-supplied markets and competitive prices have continued to encourage regional exports. By February 2015, FEWS NET estimated exportable maize surpluses to be over 600,000 MT, stocked mostly in the southern highland areas.
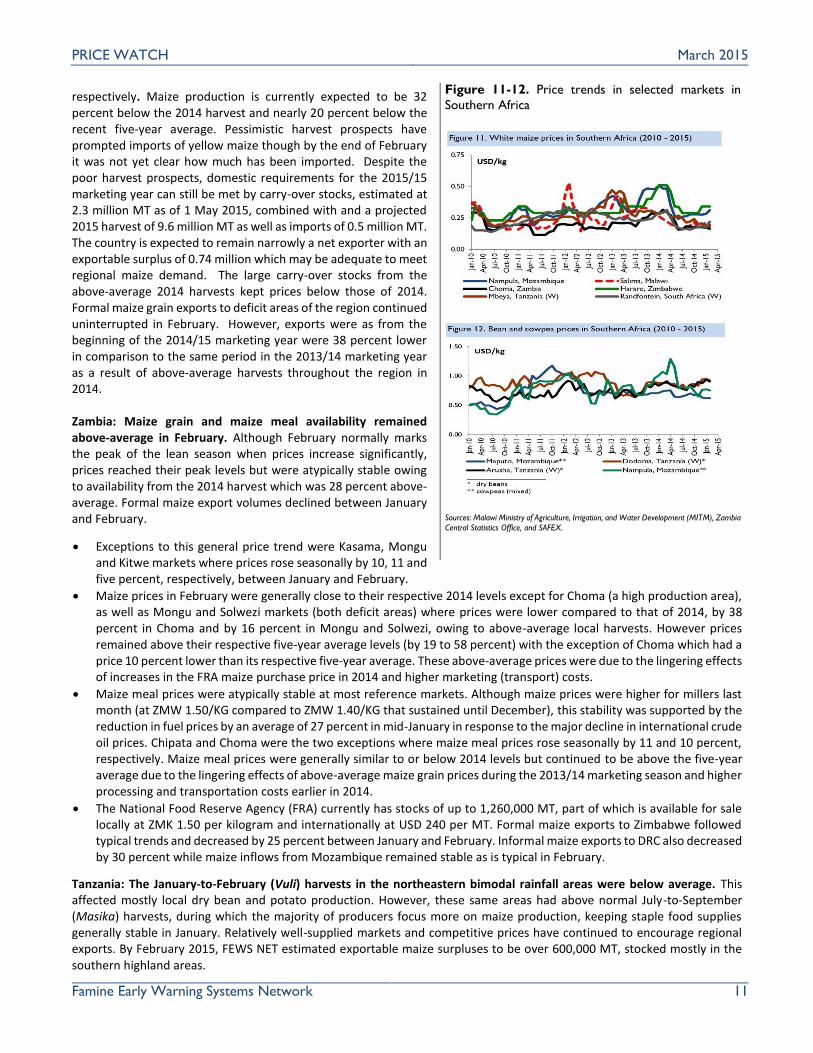
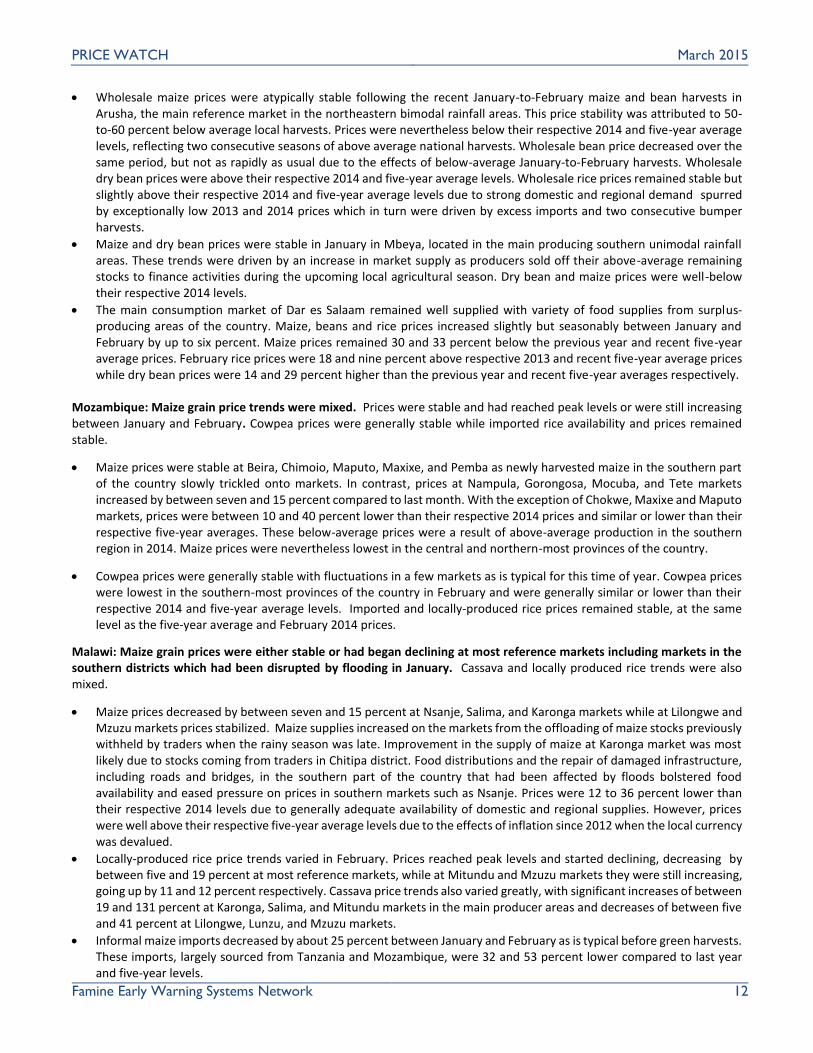
Figure 11-12. Price trends in selected markets in
Southern Africa
Sources: Malawi Ministry of Agriculture, Irrigation, and Water Development (MITM), Zambia
Central Statistics Office, and SAFEX.
PRICE WATCH March 2015
Famine Early Warning Systems Network 12
Wholesale maize prices were atypically stable following the recent January-to-February maize and bean harvests in Arusha, the main reference market in the northeastern bimodal rainfall areas. This price stability was attributed to 50-to-60 percent below average local harvests. Prices were nevertheless below their respective 2014 and five-year average levels, reflecting two consecutive seasons of above average national harvests. Wholesale bean price decreased over the same period, but not as rapidly as usual due to the effects of below-average January-to-February harvests. Wholesale dry bean prices were above their respective 2014 and five-year average levels. Wholesale rice prices remained stable but slightly above their respective 2014 and five-year average levels due to strong domestic and regional demand spurred by exceptionally low 2013 and 2014 prices which in turn were driven by excess imports and two consecutive bumper harvests.
Maize and dry bean prices were stable in January in Mbeya, located in the main producing southern unimodal rainfall areas. These trends were driven by an increase in market supply as producers sold off their above-average remaining stocks to finance activities during the upcoming local agricultural season. Dry bean and maize prices were well-below their respective 2014 levels.
The main consumption market of Dar es Salaam remained well supplied with variety of food supplies from surplus-producing areas of the country. Maize, beans and rice prices increased slightly but seasonably between January and February by up to six percent. Maize prices remained 30 and 33 percent below the previous year and recent five-year average prices. February rice prices were 18 and nine percent above respective 2013 and recent five-year average prices while dry bean prices were 14 and 29 percent higher than the previous year and recent five-year averages respectively.
Mozambique: Maize grain price trends were mixed. Prices were stable and had reached peak levels or were still increasing between January and February. Cowpea prices were generally stable while imported rice availability and prices remained stable.
Maize prices were stable at Beira, Chimoio, Maputo, Maxixe, and Pemba as newly harvested maize in the southern part of the country slowly trickled onto markets. In contrast, prices at Nampula, Gorongosa, Mocuba, and Tete markets increased by between seven and 15 percent compared to last month. With the exception of Chokwe, Maxixe and Maputo markets, prices were between 10 and 40 percent lower than their respective 2014 prices and similar or lower than their respective five-year averages. These below-average prices were a result of above-average production in the southern region in 2014. Maize prices were nevertheless lowest in the central and northern-most provinces of the country.
Cowpea prices were generally stable with fluctuations in a few markets as is typical for this time of year. Cowpea prices were lowest in the southern-most provinces of the country in February and were generally similar or lower than their respective 2014 and five-year average levels. Imported and locally-produced rice prices remained stable, at the same level as the five-year average and February 2014 prices.
Malawi: Maize grain prices were either stable or had began declining at most reference markets including markets in the southern districts which had been disrupted by flooding in January. Cassava and locally produced rice trends were also mixed.
Maize prices decreased by between seven and 15 percent at Nsanje, Salima, and Karonga markets while at Lilongwe and Mzuzu markets prices stabilized. Maize supplies increased on the markets from the offloading of maize stocks previously withheld by traders when the rainy season was late. Improvement in the supply of maize at Karonga market was most likely due to stocks coming from traders in Chitipa district. Food distributions and the repair of damaged infrastructure, including roads and bridges, in the southern part of the country that had been affected by floods bolstered food availability and eased pressure on prices in southern markets such as Nsanje. Prices were 12 to 36 percent lower than their respective 2014 levels due to generally adequate availability of domestic and regional supplies. However, prices were well above their respective five-year average levels due to the effects of inflation since 2012 when the local currency was devalued.
Locally-produced rice price trends varied in February. Prices reached peak levels and started declining, decreasing by between five and 19 percent at most reference markets, while at Mitundu and Mzuzu markets they were still increasing, going up by 11 and 12 percent respectively. Cassava price trends also varied greatly, with significant increases of between 19 and 131 percent at Karonga, Salima, and Mitundu markets in the main producer areas and decreases of between five and 41 percent at Lilongwe, Lunzu, and Mzuzu markets.
Informal maize imports decreased by about 25 percent between January and February as is typical before green harvests. These imports, largely sourced from Tanzania and Mozambique, were 32 and 53 percent lower compared to last year and five-year levels.
PRICE WATCH March 2015
Famine Early Warning Systems Network 13
Zimbabwe: Markets were well-supplied with locally produced and imported maize grain and meal supplies in February. Remaining stocks from the 26 percent above-average 2014 harvest helped to support national maize markets. Formal maize imports from Zambia declined seasonally by 25 percent between January and February. Over the past few months, these trade flows have been supported by economic incentives as the Government maize producer price in Zimbabwe of USD 390 per MT is well above the Zambian export parity price of USD 240 per MT. Furthermore, declining fuel prices since November helped support the national marketing system by reducing transport costs resulting in declines of eight to 14 percent in the price of maize meal at Renkini, Kombayi and Sakubva between January and February. Elsewhere, maize meal prices were stable. Maize grain prices varied, increasing seasonally by 17 and 37 percent at Kombayi and Sakubva markets respectively while remaining stable at other reference markets. Both maize grain and maize meal prices remained well-below their respective 2014 levels and lower or similar to their three-year average levels, even in structurally deficit areas of the country. Outlook Southern Africa: Prices of maize are expected to remain stable or begin declining in March across all countries, including South Africa which experienced significant price increases in February. Green harvests in March in areas that have received normal rains so far this season are likely to ease pressure on staple food prices in those areas. With average harvest prospects for the region, this situation is expected to continue until June. Prices will trend close to their respective 2014 and fiveyear average levels. South Africa: Maize prices are expected to follow seasonal trends, stabilizing or decreasing slightly in March, despite significant price increases in February triggered by poor harvest prospects following maize crop damage in the largest growing regions of the Free State and North West. Prices are however expected to trend similar or slightly higher than their respective 2014 level and five-year averages. International maize prices will remain at levels lower than those of 2014 driven by favorable crop prospects in key maize producing and exporting countries providing an upper bound for South African maize price increases. Formal maize exports of existing contracts are expected to continue uninterrupted. Zambia: Maize grain prices are expected to remain stable until April after which they will begin declining as households start accessing cereals from new harvests. A delayed start of the season in southern and eastern Zambia will likely delay access to green harvests. Maize meal prices may remain stable in March, supported by fuel price decreases in January. Maize grain and maize meal prices are likely to remain similar to their respective 2014 levels but remain above the five-year averages. ..Formal maize exports within the region are likely to increase as the major exporter South Africa may need to import maize to stabilize national supplies. Informal maize exports to DRC are expected to decrease as is typical during this period, while maize imports from Mozambique will follow seasonal trends and remain relatively low until the next harvest in May. Tanzania: Maize, dry bean, and rice prices across the country are expected to remain stable in March pending downward reversal in April as a result of availability of green and early harvests.. Further decreases in prices are expected with the start of Msimu harvest in May followed by Masika harvest in June. Mozambique: Maize grain prices are expected to begin declining in March and continue decreasing until June. Prices will be maintained at levels similar to 2014 and the five-year average due to above average harvests in 2014. Rice prices will remain stable while cowpeas prices will will generally decrease. Malawi: Maize prices are expected to continue or begin declining in March as households start accessing green harvests. This trend is expected to continue until May. However, prices are likely to remain lower or similar to 2014 levels because of increased maize harvests in 2014, but will be sustained above the five-year average as effects of the depreciation of local currency lingers. Zimbabwe: Prices of maize grain are likely to remain stable in March then begin declining from April up to June. Maize meal prices are likely to remain stable in March. Prices of both commodities are expected to be lower or similar to their respective 2014 and two-year averages levels.
CENTRAL AMERICA AND CARIBBEAN

PRICE WATCH March 2015
Famine Early Warning Systems Network 14
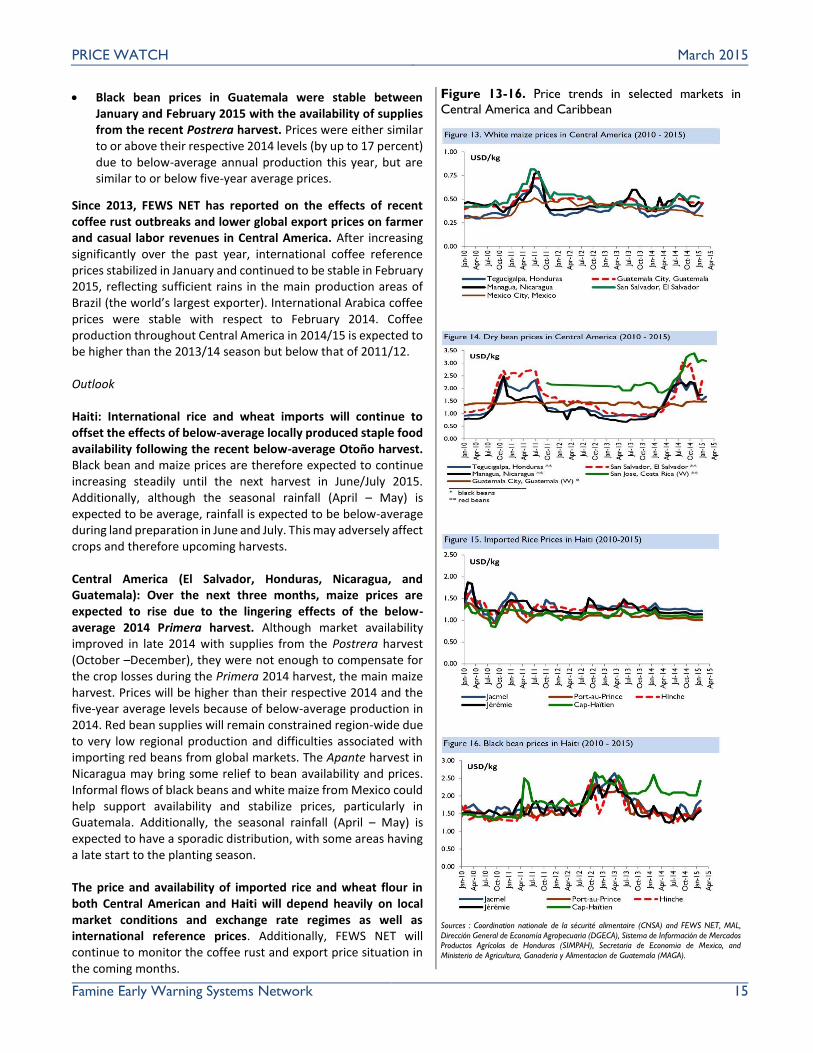
Current Situation Central America and the Caribbean: Staple food availability remained generally adequate to meet local needs from recent regional harvests (the October to December Otoño harvest in Haiti and the October-to-December Postrera harvest in Central America) and imports from international and regional markets. However, maize and black bean prices increased in Haiti in February due to reduced market supplies following a below-average Otoño harvest, coupled with higher than usual market demand for seeds for the current planting season. Maize price trends varied in Central America, continuing to rise in Honduras and El Salvador with the depletion of local market supplies but remaining stable in Guatemala due to the availability of Mexican imports. After remaining stable in January with supplies from the Postrera harvest, red bean prices increased atypically in February, ahead of normal seasonal increases that usually start in March. Black bean prices were stable in Guatemala due to the availability of remaining supplies from the recent harvests in December. Bean prices remain generally above their 2014 and five-year average levels. Imported rice and wheat availability and prices remained stable region-wide. Haiti: Market supplies of beans, maize, and maize flour were below-average in February due to the effects of a recent below-average Otoño harvest (October – December) and disrupted imports from the Dominican Republic. The 2014 Otoño harvest was 40 to 60 percent below-average due to below-average rainfall country-wide. Market supplies of locally produced beans and maize therefore started to deplete earlier and more quickly than usual. Furthermore, seed availability from own production was below-average, resulting in increased demand for seeds for the current planting season (February/March). Together, these supply and demand side drivers put upward pressure on locally produced black bean and maize prices. The availability and prices of imported rice and yellow maize from global markets remained stable.
Black bean prices increased atypically by up to 20 percent between January and February 2015. Black bean prices in all markets remained above their respective February 2014 price levels by five to 28 percent, and well above the five-year average levels by 14 percent in Jeremie to 68 percent in Cap Haitian. The very high levels observed in Cap Haitian is explained by the fact that this area is a relatively large urban area that is relatively isolated from surplus-producing areas.
Maize flour prices were stable or increased in February due to the effects of increased maize grain prices and restricted borders by the Government of the Dominican Republic (DR) on import flows. Imports from the DR contribute a significant portion of the national maize flour supply. The borders were restricted in mid-January due to concerns over local political turmoil in Haiti. Maize flour prices increased most sharply in Hinche and Jeremie by 10 and five percent respectively, between January and February 2015. Maize flour price trends varied considerably when compared to 2014.
Central America (El Salvador, Honduras, Nicaragua, and Guatemala): Supplies of regionally-produced maize and beans remain below average. Despite the availability of supplies from the recent average Postrera harvest (October – December), overall market supplies began to diminish earlier than normal due to below-average carry-over stocks from the below-average 2014 Primera harvest (July-August). As a result, locally-produced staple food prices were stable or began increasing up to two months earlier than usual (in January rather than March).
Maize prices were stable in Guatemala and similar to the five-year average levels. Informal maize imports from Mexico (which had a bumper harvest this year and where prices are currently regionally competitive) helped offset significant maize production losses of the Primera harvest (which contributes to the majority of regional supply). However, maize supplies depleted elsewhere in region. Maize prices increased, on average, by over 10 percent between January and February in both Honduras and El Salvador. White maize prices remained significantly above their respective 2014 levels (by 47 percent on average in Honduras and by 58 percent on average in El Salvador), and the five-year average levels in both Honduras and El Salvador (by 33 percent).
The Postrera bean harvest, which contributes the majority of total national annual bean production in both El Salvador and Honduras (85 and 60 percent, respectively), depleted early this year causing prices to increase early in the season. As a result, red bean prices increased in February, ahead of typical seasonal increases, and remain up to 75 percent above February 2014 prices and over 40 percent above the five-year average levels in El Salvador, Nicaragua, and Honduras. The drivers behind the atypically high red bean prices over the past year include (1) below-average 2013 Primera harvests in Honduras, (2) below-average Postrera harvests in December 2013 in Honduras, (3) reduction in the area of red beans planted in Nicaragua in favor of black beans, (4) high regional demand (especially from Costa Rica, which recently stopped purchasing form China) leading to above-average trade flow within the region, and (5) speculation by traders who anticipated even higher prices in 2014.
PRICE WATCH March 2015
Famine Early Warning Systems Network 15
Black bean prices in Guatemala were stable between January and February 2015 with the availability of supplies from the recent Postrera harvest. Prices were either similar to or above their respective 2014 levels (by up to 17 percent) due to below-average annual production this year, but are similar to or below five-year average prices.
Since 2013, FEWS NET has reported on the effects of recent coffee rust outbreaks and lower global export prices on farmer and casual labor revenues in Central America. After increasing significantly over the past year, international coffee reference prices stabilized in January and continued to be stable in February 2015, reflecting sufficient rains in the main production areas of Brazil (the world’s largest exporter). International Arabica coffee prices were stable with respect to February 2014. Coffee production throughout Central America in 2014/15 is expected to be higher than the 2013/14 season but below that of 2011/12. Outlook Haiti: International rice and wheat imports will continue to offset the effects of below-average locally produced staple food availability following the recent below-average Otoño harvest. Black bean and maize prices are therefore expected to continue increasing steadily until the next harvest in June/July 2015. Additionally, although the seasonal rainfall (April – May) is expected to be average, rainfall is expected to be below-average during land preparation in June and July. This may adversely affect crops and therefore upcoming harvests. Central America (El Salvador, Honduras, Nicaragua, and Guatemala): Over the next three months, maize prices are expected to rise due to the lingering effects of the below-average 2014 Primera harvest. Although market availability improved in late 2014 with supplies from the Postrera harvest (October –December), they were not enough to compensate for the crop losses during the Primera 2014 harvest, the main maize harvest. Prices will be higher than their respective 2014 and the five-year average levels because of below-average production in 2014. Red bean supplies will remain constrained region-wide due to very low regional production and difficulties associated with importing red beans from global markets. The Apante harvest in Nicaragua may bring some relief to bean availability and prices. Informal flows of black beans and white maize from Mexico could help support availability and stabilize prices, particularly in Guatemala. Additionally, the seasonal rainfall (April – May) is expected to have a sporadic distribution, with some areas having a late start to the planting season. The price and availability of imported rice and wheat flour in both Central American and Haiti will depend heavily on local market conditions and exchange rate regimes as well as international reference prices. Additionally, FEWS NET will continue to monitor the coffee rust and export price situation in the coming months.
Figure 13-16. Price trends in selected markets in
Central America and Caribbean
Sources : Coordination nationale de la sécurité alimentaire (CNSA) and FEWS NET, MAL,
Dirección General de Economía Agropecuaria (DGECA), Sistema de Información de Mercados Productos Agrícolas de Honduras (SIMPAH), Secretaria de Economia de Mexico, and
Ministerio de Agricultura, Ganaderia y Alimentacion de Guatemala (MAGA).
PRICE WATCH March 2015
Famine Early Warning Systems Network 16
CENTRAL ASIA Current Situation:
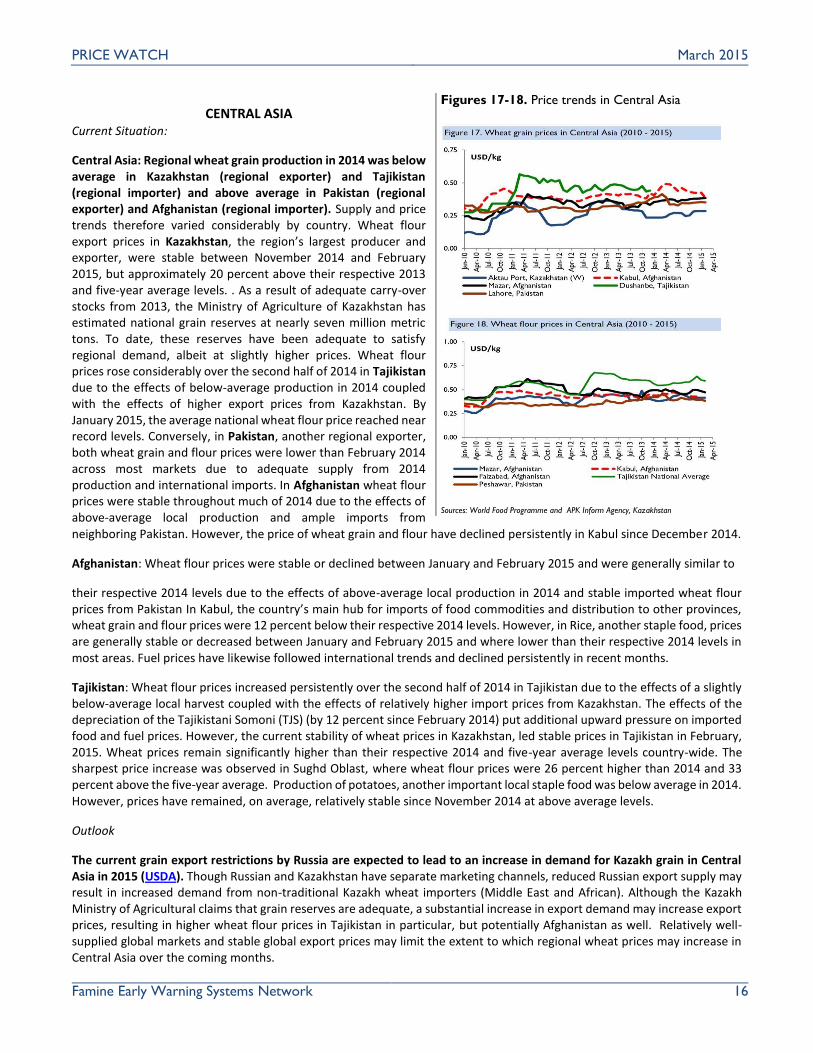
Central Asia: Regional wheat grain production in 2014 was below average in Kazakhstan (regional exporter) and Tajikistan (regional importer) and above average in Pakistan (regional exporter) and Afghanistan (regional importer). Supply and price trends therefore varied considerably by country. Wheat flour export prices in Kazakhstan, the region’s largest producer and exporter, were stable between November 2014 and February 2015, but approximately 20 percent above their respective 2013 and five-year average levels. . As a result of adequate carry-over stocks from 2013, the Ministry of Agriculture of Kazakhstan has estimated national grain reserves at nearly seven million metric tons. To date, these reserves have been adequate to satisfy regional demand, albeit at slightly higher prices. Wheat flour prices rose considerably over the second half of 2014 in Tajikistan due to the effects of below-average production in 2014 coupled with the effects of higher export prices from Kazakhstan. By January 2015, the average national wheat flour price reached near record levels. Conversely, in Pakistan, another regional exporter, both wheat grain and flour prices were lower than February 2014 across most markets due to adequate supply from 2014 production and international imports. In Afghanistan wheat flour prices were stable throughout much of 2014 due to the effects of above-average local production and ample imports from neighboring Pakistan. However, the price of wheat grain and flour have declined persistently in Kabul since December 2014.
Afghanistan: Wheat flour prices were stable or declined between January and February 2015 and were generally similar to
their respective 2014 levels due to the effects of above-average local production in 2014 and stable imported wheat flour prices from Pakistan In Kabul, the country’s main hub for imports of food commodities and distribution to other provinces, wheat grain and flour prices were 12 percent below their respective 2014 levels. However, in Rice, another staple food, prices are generally stable or decreased between January and February 2015 and where lower than their respective 2014 levels in most areas. Fuel prices have likewise followed international trends and declined persistently in recent months.
Tajikistan: Wheat flour prices increased persistently over the second half of 2014 in Tajikistan due to the effects of a slightly below-average local harvest coupled with the effects of relatively higher import prices from Kazakhstan. The effects of the depreciation of the Tajikistani Somoni (TJS) (by 12 percent since February 2014) put additional upward pressure on imported food and fuel prices. However, the current stability of wheat prices in Kazakhstan, led stable prices in Tajikistan in February, 2015. Wheat prices remain significantly higher than their respective 2014 and five-year average levels country-wide. The sharpest price increase was observed in Sughd Oblast, where wheat flour prices were 26 percent higher than 2014 and 33 percent above the five-year average. Production of potatoes, another important local staple food was below average in 2014. However, prices have remained, on average, relatively stable since November 2014 at above average levels.
Outlook
The current grain export restrictions by Russia are expected to lead to an increase in demand for Kazakh grain in Central Asia in 2015 (USDA). Though Russian and Kazakhstan have separate marketing channels, reduced Russian export supply may result in increased demand from non-traditional Kazakh wheat importers (Middle East and African). Although the Kazakh Ministry of Agricultural claims that grain reserves are adequate, a substantial increase in export demand may increase export prices, resulting in higher wheat flour prices in Tajikistan in particular, but potentially Afghanistan as well. Relatively well-supplied global markets and stable global export prices may limit the extent to which regional wheat prices may increase in Central Asia over the coming months.
Figures 17-18. Price trends in Central Asia
Sources: World Food Programme and APK Inform Agency, Kazakhstan
PRICE WATCH March 2015
Famine Early Warning Systems Network 17
In Pakistan, staple food (wheat grain and flour) supply and prices will be supported by the national strategic reserve. Due to relatively lower international prices, Pakistan imported nearly 727,600 metric tons of wheat from Russia and Ukraine between July and November 2014, nearly double 2013 levels. Although there are various prices support measures in place (20 percent import tariff recently imposed and a producer support price to encourage wheat cultivation), there is currently no strong evidence that indicates wheat grain or flour prices will increase considerably or atypically in the coming months. Area under potato cultivation in Pakistan increased by 10 percent between 2013 and 2014. Favorable weather conditions are expected to result in a 10 percent increase in local production, to approximately six million metric tons. Given local consumption patterns, this is equivalent to a three million metric ton exportable surplus. The Pakistani government recently removed export duties on potatoes to encourage regional trade. December potato prices in Pakistan were 18 to 44 percent lower than those observed in Tajikistan, which may encourage trade flows between the two countries.
Wheat flour prices are expected to continue increasing in Tajikistan, in tandem with Kazakh wheat export prices. However, the extent to which prices increase will depend on the more general international wheat price trends and trade opportunities outside of Central Asia. Potato imports from Pakistan may alleviate some of the pressure on local potato supply and prices in 2015.
Wheat flour prices will be stable in Afghanistan due to the continued effects of above-average local production and the availability of stable imports from Pakistan (and to a lesser extent, Kazakhstan). For instances, the press office of the Regional Chamber of Entrepreneurs (RCE) announced in late December that exporters from the Southern region of Kazakhstan have agreed with Afghanistan to export flour and macaroni in 2015. Nine supply contracts were signed with a projected value of $100 million. Under these contracts the regional entrepreneurs would deliver over 40,000 tons of macaroni and 55,000 tons of flour, as well as chipboards made of cotton stalks to Afghanistan.

Current Current
price/kg One One 5-year price/kg One One 5-year
Major markets US$ price month year avg. Major markets US$ price month year avg.
Cotonou Maize* Ouagadougou Dried Milk
Benin XOF 165 Burkina Faso XOF 5,750
$0.29 (Sankaryare) $9.95
Rice Gasoline
XOF 530 XOF 682
$0.92 $1.18
Cowpea Koudougou Millet*
XOF 545 Burkina Faso XOF 183
$0.94 $0.32
Bohicon Maize* Maize
Benin XOF 135 XOF 144
$0.23 $0.25
Rice Sorghum
XOF 425 XOF 168
$0.74 $0.29
Come Maize* Djibo Millet*
Benin XOF 170 Burkina Faso XOF 180
$0.29 $0.31
Rice Maize
XOF 425 XOF 174
$0.74 $0.30
Malanville Wh Maize* Sorghum
Benin XOF 125 XOF 154
$0.22 $0.27
Cassava Flr Bobo Millet*
XOF 480 Dioulasso XOF 196
$0.83 Burkina Faso $0.34
Parakou Maize* (Nineta) Maize
Benin XOF 130 XOF 112
$0.22 $0.19
Rice Sorghum
XOF 425 XOF 147
$0.74 $0.25
Ouagadougou Millet* Pouytenga Millet*
Burkina Faso XOF 201 Burkina Faso XOF 202
(Sankaryare) $0.35 $0.35
Maize Maize
XOF 126 XOF 137
$0.22 $0.24
Sorghum Sorghum
XOF 186 XOF 144
$0.32 $0.25
Veg Oil Solenzo Millet*
XOF 900 Burkina Faso XOF 133
$1.56 $0.23
FEWS NET
one year, and one year, and
5-year avg. 5-year avg.
West
Afr
ica
-8 -21 -25 ▼ ▼
% Change Over
Change over
% Change Over
Change over
one month, one month,
PRICE WATCH ANNEX 1 February 2015 Prices March 31, 2015
Food and Fuel Price Trends Food and Fuel Price Trends
▼ ►
0 -16 -8 ► ▼ ▼ 3 -5
▲ ▲
0 0 3 ► ► ► -4 -7
▼
West
Afr
ica
0 5 19 ►
-2 ►
1 ►
3 5 7 ► ▲ ▲
-6 ► ► ▼
0 -11 -13 ► ▼ ▼
▼ ►
-4 -10 -18 ► ▼ ▼ 0 0
0 -13 -10 ► ▼ ▼0 -20 - ► ▼ -
3 -12 -2 ► ▼ ►-3 -21 - ► ▼ -
2 -5 2 ► ▼ ►-3 28 84 ► ▲ ▲
0 -16 -7 ► ▼ ▼0 -17 -16 ► ▼ ▼
-5 -3 -1 ▼ ► ►-1 -14 -13 ► ▼ ▼
0 -14 -21 ► ▼ ▼0 -10 -16 ► ▼ ▼
1 -6 -13 ► ▼ ▼-2 -13 -23 ► ▼ ▼
5 4 4 ▲ ► ►-2 -7 -9 ► ▼ ▼
-1 -13 -14 ► ▼ ▼0 -5 -5 ► ▼ ▼
1 3 -3 ► ► ►-4 -9 -11 ► ▼ ▼
FEWS NET is a USAID-funded activity. The content of this report does not necessarily reflect the view of the United States Agency for International Development or the United States Government.
The Famine Early Warning Systems Network (FEWS NET) monitors trends in staple food prices in countries vulnerable to food insecurity. The Price Watch Annex 1 provides prices
and price changes for key markets and staple foods monitored across FEWS NET countries and regions. The prices listed are final monthly average prices for February, 2015. The
commodities with an asterisk (*) are the staples most often consumed by the poor in the indicated market. Additional commodities provided are important commodities consumed in
the same areas or fuel prices that affect food prices. Final monthly average prices are used. The symbols (▲►▼) depict the direction of price changes: the red upward-facing arrow
denotes an increase of five percent or greater, The blue horizontal arrow denotes no change or changes that are smaller than 5 percent, and the green downward-facing arrow
denotes price decreases that are five percent or greater. The three arrows respectively correspond to the percent change in prices this month compared to last month, last year, and
the five-year average. The “-“ symbol indicates that data are not available. The commodities with a reference (W) are wholesale prices. Otherwise, all reported prices are retail.
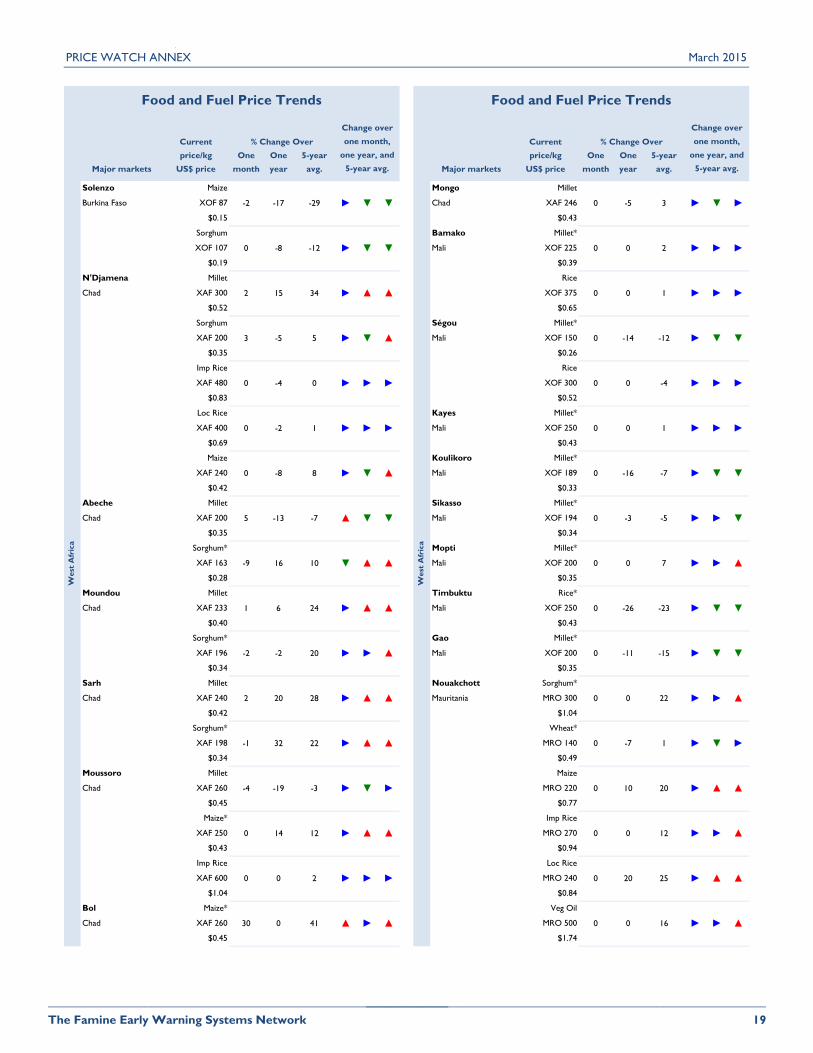
PRICE WATCH ANNEX
Current Current
price/kg One One 5-year price/kg One One 5-year
Major markets US$ price month year avg. Major markets US$ price month year avg.
Solenzo Maize Mongo Millet
Burkina Faso XOF 87 Chad XAF 246
$0.15 $0.43
Sorghum Bamako Millet*
XOF 107 Mali XOF 225
$0.19 $0.39
N'Djamena Millet Rice
Chad XAF 300 XOF 375
$0.52 $0.65
Sorghum Ségou Millet*
XAF 200 Mali XOF 150
$0.35 $0.26
Imp Rice Rice
XAF 480 XOF 300
$0.83 $0.52
Loc Rice Kayes Millet*
XAF 400 Mali XOF 250
$0.69 $0.43
Maize Koulikoro Millet*
XAF 240 Mali XOF 189
$0.42 $0.33
Abeche Millet Sikasso Millet*
Chad XAF 200 Mali XOF 194
$0.35 $0.34
Sorghum* Mopti Millet*
XAF 163 Mali XOF 200
$0.28 $0.35
Moundou Millet Timbuktu Rice*
Chad XAF 233 Mali XOF 250
$0.40 $0.43
Sorghum* Gao Millet*
XAF 196 Mali XOF 200
$0.34 $0.35
Sarh Millet Nouakchott Sorghum*
Chad XAF 240 Mauritania MRO 300
$0.42 $1.04
Sorghum* Wheat*
XAF 198 MRO 140
$0.34 $0.49
Moussoro Millet Maize
Chad XAF 260 MRO 220
$0.45 $0.77
Maize* Imp Rice
XAF 250 MRO 270
$0.43 $0.94
Imp Rice Loc Rice
XAF 600 MRO 240
$1.04 $0.84
Bol Maize* Veg Oil
Chad XAF 260 MRO 500
$0.45 $1.74
one year, and one year, and
5-year avg. 5-year avg.
West
Afr
ica
-2 -17 -29 ► ▼
March 2015
Food and Fuel Price Trends Food and Fuel Price Trends
% Change Over
Change over
% Change Over
Change over
one month, one month,
► ► ►
2 15 34 ► ▲ ▲
► ▼ ►
0 -8 -12 ► ▼ ▼
▼
West
Afr
ica
0 -5 3
0 0 2
0
▼ ▼
0 -4 0 ► ► ► 0
▲ 0 -14 -12 ►
0 1 ► ► ►
3 -5 5 ► ▼
► ►
0 -8 8 ► ▼ ▲ 0
► 0 0 1 ►
0 -4 ► ► ►
0 -2 1 ► ►
► ▼
-9 16 10 ▼ ▲ ▲ 0
▼ 0 -3 -5 ►
-16 -7 ► ▼ ▼
5 -13 -7 ▲ ▼
▼ ▼
-2 -2 20 ► ► ▲ 0
▲ 0 -26 -23 ►
0 7 ► ► ▲
1 6 24 ► ▲
► ▲
-1 32 22 ► ▲ ▲ 0
▲ 0 0 22 ►
-11 -15 ► ▼ ▼
2 20 28 ► ▲
▲ ▲
0 14 12 ► ▲ ▲ 0
► 0 10 20 ►
-7 1 ► ▼ ►
-4 -19 -3 ► ▼
▲ ▲
30 0 41 ▲ ► ▲ 0
► 0 20 25 ►
0 12 ► ► ▲
0 0 2 ► ►
0 16 ► ► ▲
__________________________________________________________________
The Famine Early Warning Systems Network
__________________________________________________________________
19

PRICE WATCH ANNEX March 2015
Current Current
price/kg One One 5-year price/kg One One 5-year
Major markets US$ price month year avg. Major markets US$ price month year avg.
Nouakchott Gas Oil Magta-Lahjar Wheat*
Mauritania MRO 385 Mauritania MRO 150
$1.34 $0.52
Gasoline Imp Rice
MRO 436 MRO 245
$1.52 $0.85
Adel Bagrou Sorghum* Loc Rice
Mauritania MRO 128 MRO 208
$0.44 $0.72
Wheat* Veg Oil
MRO 200 MRO 500
$0.70 $1.74
Imp Rice Sugar
MRO 265 MRO 208
$0.92 $0.72
Loc Rice Niamey Millet*
MRO 225 Niger XOF 237
$0.78 $0.41
Veg Oil Maize
MRO 500 XOF 193
$1.74 $0.33
Sugar Rice
MRO 260 XOF 400
$0.90 $0.69
Aoujeft Sorghum* Sorghum
Mauritania MRO 400 XOF 221
$1.39 $0.38
Wheat* Dried Milk
MRO 140 XOF 3,900
$0.49 $6.75
Boghé Sorghum* Veg Oil
Mauritania MRO 231 XOF 800
$0.80 $1.38
Wheat* Bread
MRO 125 XOF 161
$0.44 $0.28
Imp Rice Gas Oil
MRO 200 XOF 540
$0.70 $0.93
Loc Rice Gasoline
MRO 179 XOF 538
$0.62 $0.93
Veg Oil Maradi Millet*
MRO 351 Niger XOF 142
$1.22 $0.25
Sugar Sorghum
MRO 200 XOF 152
$0.70 $0.26
Magta-Lahjar Sorghum* Maize
Mauritania MRO 275 XOF 163
$0.96 $0.28
one year, and one year, and
5-year avg. 5-year avg.
West
Afr
ica
0 0 18 ► ►
% Change Over
Change over
% Change Over
Change over
one month, one month,
Food and Fuel Price Trends Food and Fuel Price Trends
► ►
16 -18 -12 ▲ ▼ ▼ 2 1
► ▲
0 0 - ► ► - 2 -2
▲
West
Afr
ica
0 0 13 ►
4 ►
10 ►
4 -17 - ► ▼ -
8 ► ► ▲
-5 4 15 ▼ ► ▲
► ▲
1 14 40 ► ▲ ▲ 0 0
1 -1 -6 ► ► ▼0 5 9 ► ▲ ▲
1 -14 -3 ► ▼ ►2 13 15 ► ▲ ▲
-1 -8 -1 ► ▼ ►7 45 - ▲ ▲ -
0 0 -7 ► ► ▼3 9 - ► ▲ -
0 - - ► - --17 16 20 ▼ ▲ ▲
0 - - ► - -0 0 - ► ► -
0 0 0 ► ► ►0 0 6 ► ► ▲
0 0 0 ► ► ►-1 -9 0 ► ▼ ►
4 -35 -30 ► ▼ ▼-1 -13 -10 ► ▼ ▼
0 0 0 ► ► ►0 2 7 ► ► ▲
-4 -21 -21 ► ▼ ▼5 16 25 ▲ ▲ ▲
4 -23 -14 ► ▼ ▼4 -8 - ► ▼ -
__________________________________________________________________
The Famine Early Warning Systems Network
__________________________________________________________________
20
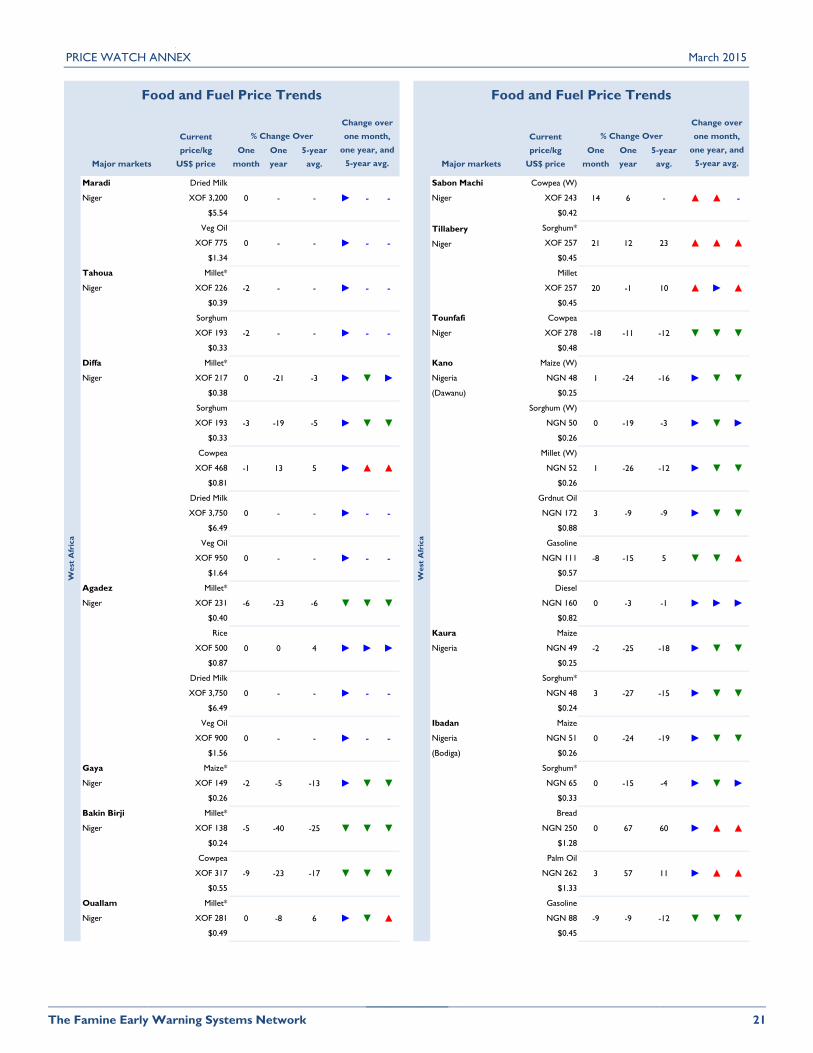
PRICE WATCH ANNEX March 2015
Current Current
price/kg One One 5-year price/kg One One 5-year
Major markets US$ price month year avg. Major markets US$ price month year avg.
Maradi Dried Milk Sabon Machi Cowpea (W)
Niger XOF 3,200 Niger XOF 243
$5.54 $0.42
Veg Oil Tillabery Sorghum*
XOF 775 Niger XOF 257
$1.34 $0.45
Tahoua Millet* Millet
Niger XOF 226 XOF 257
$0.39 $0.45
Sorghum Tounfafi Cowpea
XOF 193 Niger XOF 278
$0.33 $0.48
Diffa Millet* Kano Maize (W)
Niger XOF 217 Nigeria NGN 48
$0.38 (Dawanu) $0.25
Sorghum Sorghum (W)
XOF 193 NGN 50
$0.33 $0.26
Cowpea Millet (W)
XOF 468 NGN 52
$0.81 $0.26
Dried Milk Grdnut Oil
XOF 3,750 NGN 172
$6.49 $0.88
Veg Oil Gasoline
XOF 950 NGN 111
$1.64 $0.57
Agadez Millet* Diesel
Niger XOF 231 NGN 160
$0.40 $0.82
Rice Kaura Maize
XOF 500 Nigeria NGN 49
$0.87 $0.25
Dried Milk Sorghum*
XOF 3,750 NGN 48
$6.49 $0.24
Veg Oil Ibadan Maize
XOF 900 Nigeria NGN 51
$1.56 (Bodiga) $0.26
Gaya Maize* Sorghum*
Niger XOF 149 NGN 65
$0.26 $0.33
Bakin Birji Millet* Bread
Niger XOF 138 NGN 250
$0.24 $1.28
Cowpea Palm Oil
XOF 317 NGN 262
$0.55 $1.33
Ouallam Millet* Gasoline
Niger XOF 281 NGN 88
$0.49 $0.45
one year, and one year, and
5-year avg. 5-year avg.
West
Afr
ica
0 - - ► -
Food and Fuel Price Trends Food and Fuel Price Trends
% Change Over
Change over
% Change Over
Change over
one month, one month,
▲ ▲ ▲
-2 - - ► - -
▲ ▲ -
0 - - ► - -
-
West
Afr
ica
14 6 -
21 12 23
20
▼
▼
▼
►
▼
▼
▲
▼
0 -21 -3 ► ▼ ► 1
- -18 -11 -12 ▼
-1 10 ▲ ► ▲
-2 - - ► -
►
-1 13 5 ► ▲ ▲ 1
▼ 0 -19 -3 ►
-24 -16 ► ▼ ▼
-3 -19 -5 ► ▼
▼
0 - - ► - - -8
- 3 -9 -9 ►
-26 -12 ► ▼ ▼
0 - - ► -
►
0 0 4 ► ► ► -2
▼ 0 -3 -1 ►
-15 5 ▼ ▼ ▲
-6 -23 -6 ▼ ▼
▼
0 - - ► - - 0
- 3 -27 -15 ►
-25 -18 ► ▼ ▼
0 - - ► -
►
-5 -40 -25 ▼ ▼ ▼ 0
▼ 0 -15 -4 ►
-24 -19 ► ▼ ▼
-2 -5 -13 ► ▼
▲
0 -8 6 ► ▼ ▲ -9
▼ 3 57 11 ►
67 60 ► ▲ ▲
-9 -23 -17 ▼ ▼
-9 -12 ▼ ▼ ▼
__________________________________________________________________
The Famine Early Warning Systems Network
__________________________________________________________________
21
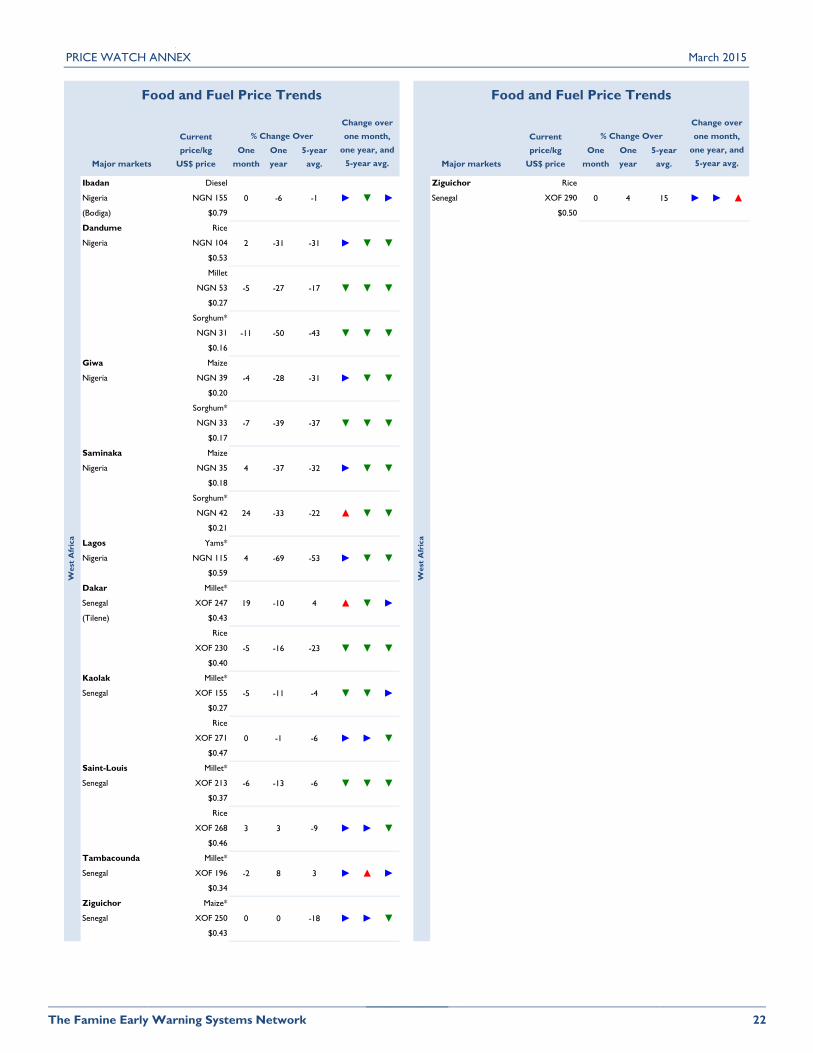
PRICE WATCH ANNEX March 2015
Current Current
price/kg One One 5-year price/kg One One 5-year
Major markets US$ price month year avg. Major markets US$ price month year avg.
Ibadan Diesel Ziguichor Rice
Nigeria NGN 155 Senegal XOF 290
(Bodiga) $0.79 $0.50
Dandume Rice
Nigeria NGN 104
$0.53
Millet
NGN 53
$0.27
Sorghum*
NGN 31
$0.16
Giwa Maize
Nigeria NGN 39
$0.20
Sorghum*
NGN 33
$0.17
Saminaka Maize
Nigeria NGN 35
$0.18
Sorghum*
NGN 42
$0.21
Lagos Yams*
Nigeria NGN 115
$0.59
Dakar Millet*
Senegal XOF 247
(Tilene) $0.43
Rice
XOF 230
$0.40
Kaolak Millet*
Senegal XOF 155
$0.27
Rice
XOF 271
$0.47
Saint-Louis Millet*
Senegal XOF 213
$0.37
Rice
XOF 268
$0.46
Tambacounda Millet*
Senegal XOF 196
$0.34
Ziguichor Maize*
Senegal XOF 250
$0.43
one year, and one year, and
5-year avg. 5-year avg.
West
Afr
ica
0 -6 -1 ► ▼
% Change Over
Change over
% Change Over
Change over
one month, one month,
Food and Fuel Price Trends Food and Fuel Price Trends
-5 -27 -17 ▼ ▼ ▼
► ▲
2 -31 -31 ► ▼ ▼
►
West
Afr
ica
0 4 15 ►
-4 -28 -31 ► ▼ ▼
-11 -50 -43 ▼ ▼ ▼
24 -33 -22 ▲ ▼ ▼
4 -37 -32 ► ▼ ▼
-7 -39 -37 ▼ ▼ ▼
-5 -16 -23 ▼ ▼ ▼
19 -10 4 ▲ ▼ ►
4 -69 -53 ► ▼ ▼
-6 -13 -6 ▼ ▼ ▼
0 -1 -6 ► ► ▼
-5 -11 -4 ▼ ▼ ►
0 0 -18 ► ► ▼
-2 8 3 ► ▲ ►
3 3 -9 ► ► ▼
__________________________________________________________________
The Famine Early Warning Systems Network
__________________________________________________________________
22

PRICE WATCH ANNEX March 2015
Current Current
price/kg One One 5-year price/kg One One 5-year
Major markets US$ price month year avg. Major markets US$ price month year avg.
Dikhil Rice Belem Bahir Dar Mixed Teff (W)
Djibouti DJF 120 Ethiopia ETB 12.66
$0.68 $0.63
Wheat Flr* Bure White Maize*
(W) DJF 130 Ethiopia ETB 4.10
$0.73 $0.20
Sorghum Flr Wheat Grain (W)
DJF 130 ETB 8.55
$0.73 $0.43
Tadjourah Rice Belem Dire Dawa White Maize
Djibouti DJF 130 Ethiopia ETB 7.00
$0.73 $0.35
Wheat Flr* Yellow Sorghum
DJF 115 ETB 9.50
$0.65 $0.47
Alisabieh Rice Belem Wheat Grain (W)
Djibouti DJF 140 ETB 12.00
$0.79 $0.60
Wheat Flr* Mixed Teff (W)
DJF 130 ETB 14.00
$0.73 $0.70
Sorghum Flr Gode White Maize*
(W) DJF 165 Ethiopia ETB 10.00
$0.93 $0.50
Arta Rice Belem Jijiga White Maize*
(W)Djibouti DJF 120 Ethiopia ETB 14.00
$0.68 $0.70
Wheat Flr* Yellow Sorghum
(W) DJF 130 ETB 7.00
$0.73 $0.35
Sorghum Flr Mekele Mixed Teff (W)
DJF 200 Ethiopia ETB 10.32
$1.13 $0.51
Obock Rice Belem Nekemte White Maize*
(W)Djibouti DJF 141 Ethiopia ETB 4.00
$0.80 $0.20
Wheat Flr* Sodo White Maize*
(W) DJF 120 Ethiopia ETB 4.50
$0.68 $0.22
Addis Ababa White Maize*
(W)
Nairobi Wh Maize* (W)
Ethiopia ETB 6.66 Kenya KES 27
$0.33 $0.29
Yellow Sorghum
(W)
Beans (W)
ETB 12.00 KES 70
$0.60 $0.78
Mixed Teff (W) Potato (W)
ETB 13.73 KES 36
$0.68 $0.39
Bahir Dar White Maize*
(W)
Sorghum (W)
Ethiopia ETB 4.30 KES 41
$0.21 $0.46
one year, and one year, and
5-year avg. 5-year avg.
East
Afr
ica
0 -8 -12 ► ▼
Food and Fuel Price Trends Food and Fuel Price Trends
% Change Over
Change over
% Change Over
Change over
one month, one month,
- -
0 - - ► - - -4 -
► ▲
8 18 14 ▲ ▲ ▲ 3 -
▼
East
Afr
ica
3 1 32 ►
- ►
- ►
19 -14 13 ▲
2 1 30 ►
-22 -30 10 ▼
0 -24 -3 ►
▼ ▲
32 ▲ ▲ ▲
0 15 7 ► ▲ ▲
- -
0 0 -4 ► ► ► 8 8
► ▲0 0 11 ► ► ▲
4 50 60 ► ▲ ▲0 8 3 ► ▲ ►
▼ ▲0 0 -11 ► ► ▼
-17 0 45 ▼ ► ▲22 -3 17 ▲ ► ▲
▼ ►0 0 -8 ► ► ▼
-30 -30 8 ▼ ▼ ▲0 8 4 ► ▲ ►
- -11 13 - ▼ ▲0 0 0 ► ► ►
0 - - ► - -1 1 -1 ► ► ►
11 2 22 ▲ ► ▲-3 -8 29 ► ▼ ▲
2 -26 -11 ► ▼ ▼-15 -5 21 ▼ ▼ ▲
1 3 -1 ► ► ►0 - - ► - -
- 6 6 - ▲ ▲-1 -3 27 ► ► ▲
__________________________________________________________________
The Famine Early Warning Systems Network
__________________________________________________________________
23
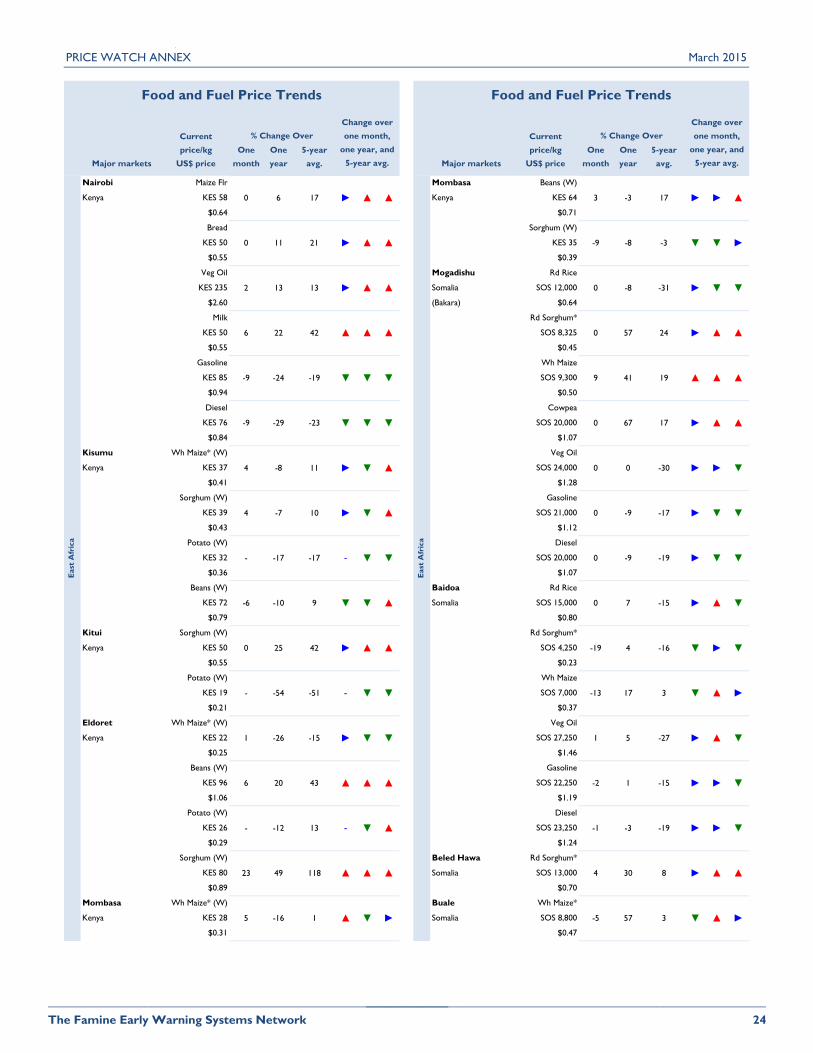
PRICE WATCH ANNEX March 2015
Current Current
price/kg One One 5-year price/kg One One 5-year
Major markets US$ price month year avg. Major markets US$ price month year avg.
Nairobi Maize Flr Mombasa Beans (W)
Kenya KES 58 Kenya KES 64
$0.64 $0.71
Bread Sorghum (W)
KES 50 KES 35
$0.55 $0.39
Veg Oil Mogadishu Rd Rice
KES 235 Somalia SOS 12,000
$2.60 (Bakara) $0.64
Milk Rd Sorghum*
KES 50 SOS 8,325
$0.55 $0.45
Gasoline Wh Maize
KES 85 SOS 9,300
$0.94 $0.50
Diesel Cowpea
KES 76 SOS 20,000
$0.84 $1.07
Kisumu Wh Maize* (W) Veg Oil
Kenya KES 37 SOS 24,000
$0.41 $1.28
Sorghum (W) Gasoline
KES 39 SOS 21,000
$0.43 $1.12
Potato (W) Diesel
KES 32 SOS 20,000
$0.36 $1.07
Beans (W) Baidoa Rd Rice
KES 72 Somalia SOS 15,000
$0.79 $0.80
Kitui Sorghum (W) Rd Sorghum*
Kenya KES 50 SOS 4,250
$0.55 $0.23
Potato (W) Wh Maize
KES 19 SOS 7,000
$0.21 $0.37
Eldoret Wh Maize* (W) Veg Oil
Kenya KES 22 SOS 27,250
$0.25 $1.46
Beans (W) Gasoline
KES 96 SOS 22,250
$1.06 $1.19
Potato (W) Diesel
KES 26 SOS 23,250
$0.29 $1.24
Sorghum (W) Beled Hawa Rd Sorghum*
KES 80 Somalia SOS 13,000
$0.89 $0.70
Mombasa Wh Maize* (W) Buale Wh Maize*
Kenya KES 28 Somalia SOS 8,800
$0.31 $0.47
one year, and one year, and
5-year avg. 5-year avg.
East
Afr
ica
0 6 17 ► ▲
Food and Fuel Price Trends Food and Fuel Price Trends
% Change Over
Change over
% Change Over
Change over
one month, one month,
▼ ►
2 13 13 ► ▲ ▲ 0 -8
► ▲
0 11 21 ► ▲ ▲ -9 -8
▲
East
Afr
ica
3 -3 17 ►
-3 ▼
-31 ►
9 41 19 ▲
0 0 -30 ►
0 -9 -19 ►
-19 4 -16 ▼
▲ ▲
24 ► ▲ ▲
-9 -24 -19 ▼ ▼ ▼
▼ ▼
6 22 42 ▲ ▲ ▲ 0 57
► ▼4 -8 11 ► ▼ ▲
0 67 17 ► ▲ ▲-9 -29 -23 ▼ ▼ ▼
▼ ▼- -17 -17 - ▼ ▼
0 -9 -17 ► ▼ ▼4 -7 10 ► ▼ ▲
► ▼0 25 42 ► ▲ ▲
0 7 -15 ► ▲ ▼-6 -10 9 ▼ ▼ ▲
1 5 -27 ► ▲ ▼1 -26 -15 ► ▼ ▼
-13 17 3 ▼ ▲ ►- -54 -51 - ▼ ▼
-1 -3 -19 ► ► ▼- -12 13 - ▼ ▲
-2 1 -15 ► ► ▼6 20 43 ▲ ▲ ▲
-5 57 3 ▼ ▲ ►5 -16 1 ▲ ▼ ►
4 30 8 ► ▲ ▲23 49 118 ▲ ▲ ▲
__________________________________________________________________
The Famine Early Warning Systems Network
__________________________________________________________________
24

PRICE WATCH ANNEX March 2015
Current Current
price/kg One One 5-year price/kg One One 5-year
Major markets US$ price month year avg. Major markets US$ price month year avg.
Buale Cowpea Galkayo Rd Rice
Somalia SOS 34,500 Somalia SOS 16,000
$1.85 $0.86
Merka Cowpea Rd Sorghum*
Somalia SOS 17,575 SOS 12,000
$0.94 $0.64
Qorioley Rd Rice Cowpea
Somalia SOS 14,000 SOS 22,000
$0.75 $1.18
Wh Maize* Garowe Rd Rice
SOS 7,000 Somalia SOS 15,000
$0.37 $0.80
Rd Sorghum Bossasso Rd Rice
SOS 6,000 Somalia SOS 14,000
$0.32 $0.75
Veg Oil Burao Rd Rice
SOS 27,000 Somalia SLSH 5,000
$1.44 $0.73
Gasoline Rd Sorghum*
SOS 22,500 SLSH 3,000
$1.20 $0.44
Diesel Wh Maize
SOS 18,500 SLSH 4,000
$0.99 $0.58
Lugh Wh Maize* Veg Oil
Somalia SOS 12,000 SLSH 12,000
$0.64 $1.74
Rd Sorghum Gasoline
SOS 8,000 SLSH 6,500
$0.43 $0.94
Beled Weyne Rd Sorghum* Diesel
Somalia SOS 9,000 SLSH 5,600
$0.48 $0.81
Dhusamareb Rd Rice Hargeisa Rd Rice
Somalia SOS 20,000 Somalia SLSH 5,000
$1.07 $0.73
Rd Sorghum* Togwajale Wh Sorghum*
SOS 17,000 Somalia SLSH 3,500
$0.91 $0.51
Veg Oil Juba Sorghum*
SOS 55,000 South Sudan SSP 3.68
$2.94 -
Gasoline Maize
SOS 28,000 SSP 3.18
$1.50 -
Diesel Wheat Flr
SOS 30,000 SSP 7.75
$1.60 -
El Dhere Cowpea Aweil Sorghum*
Somalia SOS 12,000 South Sudan SSP 4.14
$0.64 -
one year, and one year, and
5-year avg. 5-year avg.
East
Afr
ica
24 50 73 ▲ ▲
Food and Fuel Price Trends Food and Fuel Price Trends
% Change Over
Change over
% Change Over
Change over
one month, one month,
▲ ▲
0 0 -15 ► ► ▼ 7 22
► ▼
-27 9 -15 ▼ ▲ ▼ 20 20
▲
East
Afr
ica
0 0 -30 ►
9 ▲
-19 ▲
0 0 -21 ►
0 0 3 ►
0 0 3 ►
-3 -18 -5 ►
► ▼
-23 ► ▼ ▼
-8 32 -22 ▼ ▲ ▼
▲ ▼
5 19 1 ▲ ▲ ► 4 -5
► ►7 1 -20 ▲ ► ▼
0 0 9 ► ► ▲-4 9 -20 ► ▲ ▼
► ►9 9 4 ▲ ▲ ►
0 0 13 ► ► ▲-3 -15 -25 ► ▼ ▼
▼ ▼3 0 - ► ► -
-4 -7 7 ► ▼ ▲33 -11 -24 ▲ ▼ ▼
0 13 32 ► ▲ ▲6 6 -4 ▲ ▲ ►
0 0 2 ► ► ►0 0 -23 ► ► ▼
-11 11 31 ▼ ▲ ▲0 40 5 ► ▲ ▲
3 -21 11 ► ▼ ▲0 0 -10 ► ► ▼
4 23 62 ► ▲ ▲9 60 -29 ▲ ▲ ▼
0 29 34 ► ▲ ▲0 15 0 ► ▲ ►
__________________________________________________________________
The Famine Early Warning Systems Network
__________________________________________________________________
25
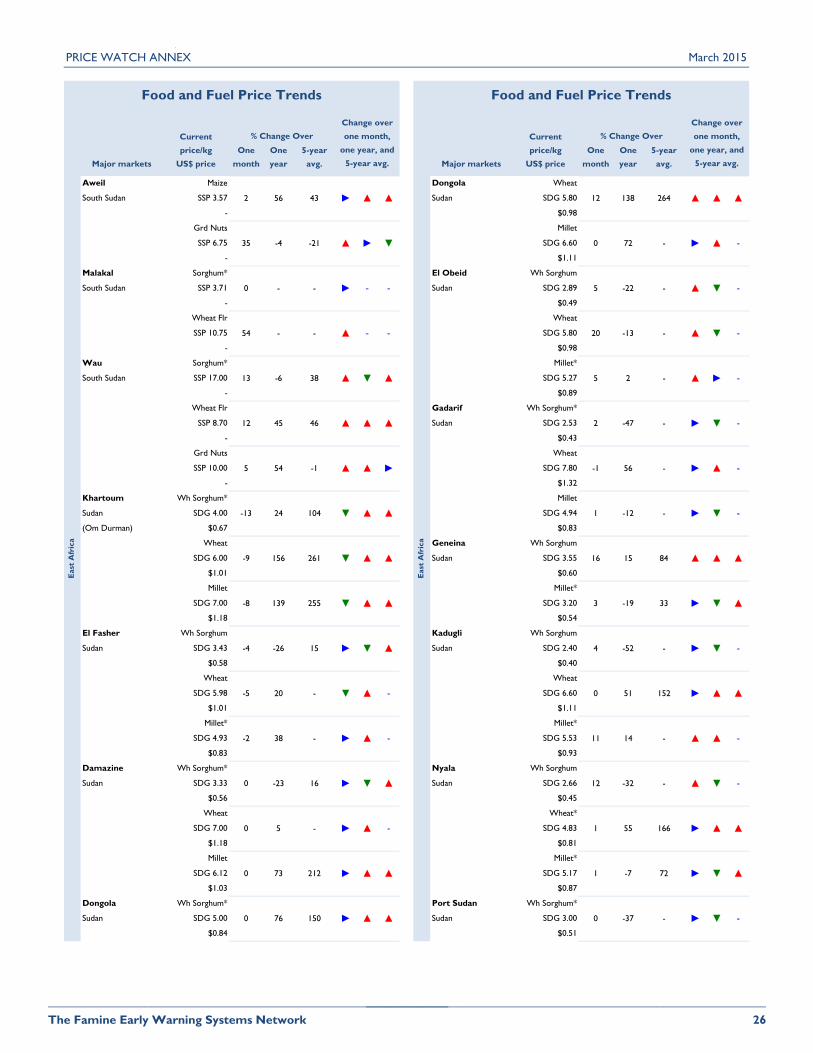
PRICE WATCH ANNEX March 2015
Current Current
price/kg One One 5-year price/kg One One 5-year
Major markets US$ price month year avg. Major markets US$ price month year avg.
Aweil Maize Dongola Wheat
South Sudan SSP 3.57 Sudan SDG 5.80
- $0.98
Grd Nuts Millet
SSP 6.75 SDG 6.60
- $1.11
Malakal Sorghum* El Obeid Wh Sorghum
South Sudan SSP 3.71 Sudan SDG 2.89
- $0.49
Wheat Flr Wheat
SSP 10.75 SDG 5.80
- $0.98
Wau Sorghum* Millet*
South Sudan SSP 17.00 SDG 5.27
- $0.89
Wheat Flr Gadarif Wh Sorghum*
SSP 8.70 Sudan SDG 2.53
- $0.43
Grd Nuts Wheat
SSP 10.00 SDG 7.80
- $1.32
Khartoum Wh Sorghum* Millet
Sudan SDG 4.00 SDG 4.94
(Om Durman) $0.67 $0.83
Wheat Geneina Wh Sorghum
SDG 6.00 Sudan SDG 3.55
$1.01 $0.60
Millet Millet*
SDG 7.00 SDG 3.20
$1.18 $0.54
El Fasher Wh Sorghum Kadugli Wh Sorghum
Sudan SDG 3.43 Sudan SDG 2.40
$0.58 $0.40
Wheat Wheat
SDG 5.98 SDG 6.60
$1.01 $1.11
Millet* Millet*
SDG 4.93 SDG 5.53
$0.83 $0.93
Damazine Wh Sorghum* Nyala Wh Sorghum
Sudan SDG 3.33 Sudan SDG 2.66
$0.56 $0.45
Wheat Wheat*
SDG 7.00 SDG 4.83
$1.18 $0.81
Millet Millet*
SDG 6.12 SDG 5.17
$1.03 $0.87
Dongola Wh Sorghum* Port Sudan Wh Sorghum*
Sudan SDG 5.00 Sudan SDG 3.00
$0.84 $0.51
one year, and one year, and
5-year avg. 5-year avg.
East
Afr
ica
2 56 43 ► ▲
Food and Fuel Price Trends Food and Fuel Price Trends
% Change Over
Change over
% Change Over
Change over
one month, one month,
▲ -
0 - - ► - - 5 -22
▲ ▲
35 -4 -21 ▲ ► ▼ 0 72
▲
East
Afr
ica
12 138 264 ▲
- ►
- ▲
5 2 - ▲
-1 56 - ►
16 15 84 ▲
4 -52 - ►
► -
- ▲ ▼ -
13 -6 38 ▲ ▼ ▲
▼ -
54 - - ▲ - - 20 -13
▲ -5 54 -1 ▲ ▲ ►
2 -47 - ► ▼ -12 45 46 ▲ ▲ ▲
▲ ▲-9 156 261 ▼ ▲ ▲
1 -12 - ► ▼ --13 24 104 ▼ ▲ ▲
▼ --4 -26 15 ► ▼ ▲
3 -19 33 ► ▼ ▲-8 139 255 ▼ ▲ ▲
11 14 - ▲ ▲ --2 38 - ► ▲ -
0 51 152 ► ▲ ▲-5 20 - ▼ ▲ -
1 55 166 ► ▲ ▲0 5 - ► ▲ -
12 -32 - ▲ ▼ -0 -23 16 ► ▼ ▲
0 -37 - ► ▼ -0 76 150 ► ▲ ▲
1 -7 72 ► ▼ ▲0 73 212 ► ▲ ▲
__________________________________________________________________
The Famine Early Warning Systems Network
__________________________________________________________________
26
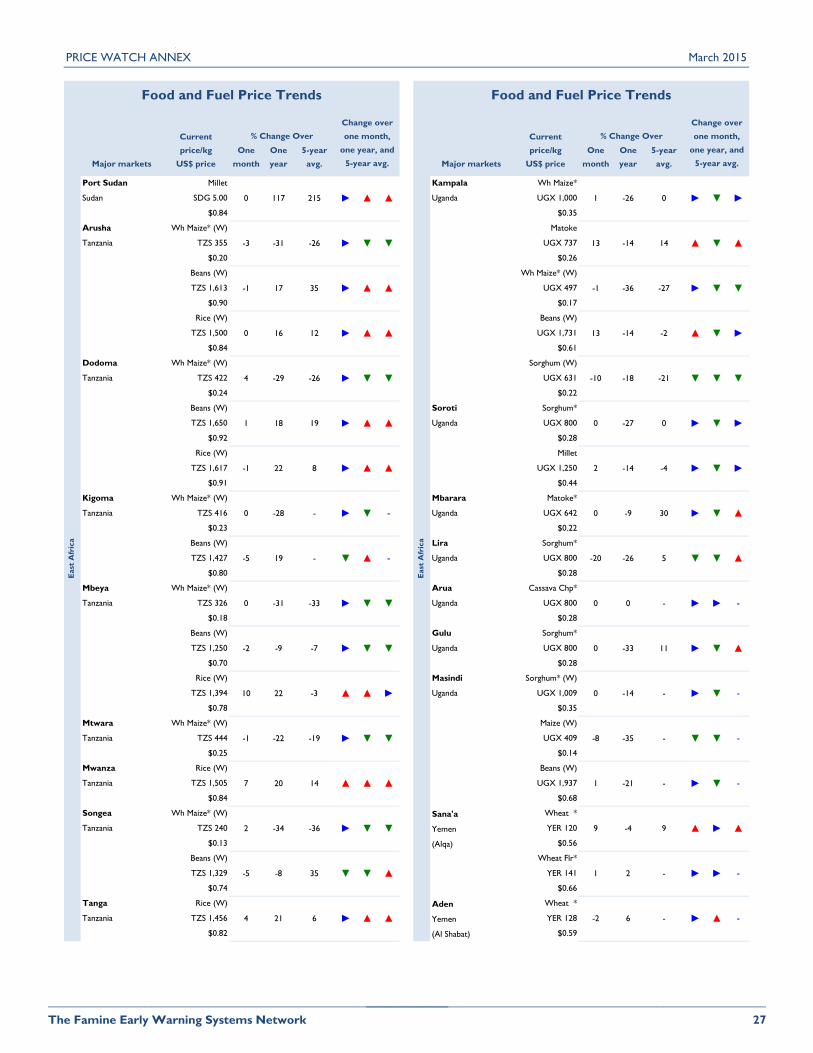
PRICE WATCH ANNEX March 2015
Current Current
price/kg One One 5-year price/kg One One 5-year
Major markets US$ price month year avg. Major markets US$ price month year avg.
Port Sudan Millet Kampala Wh Maize*
Sudan SDG 5.00 Uganda UGX 1,000
$0.84 $0.35
Arusha Wh Maize* (W) Matoke
Tanzania TZS 355 UGX 737
$0.20 $0.26
Beans (W) Wh Maize* (W)
TZS 1,613 UGX 497
$0.90 $0.17
Rice (W) Beans (W)
TZS 1,500 UGX 1,731
$0.84 $0.61
Dodoma Wh Maize* (W) Sorghum (W)
Tanzania TZS 422 UGX 631
$0.24 $0.22
Beans (W) Soroti Sorghum*
TZS 1,650 Uganda UGX 800
$0.92 $0.28
Rice (W) Millet
TZS 1,617 UGX 1,250
$0.91 $0.44
Kigoma Wh Maize* (W) Mbarara Matoke*
Tanzania TZS 416 Uganda UGX 642
$0.23 $0.22
Beans (W) Lira Sorghum*
TZS 1,427 Uganda UGX 800
$0.80 $0.28
Mbeya Wh Maize* (W) Arua Cassava Chp*
Tanzania TZS 326 Uganda UGX 800
$0.18 $0.28
Beans (W) Gulu Sorghum*
TZS 1,250 Uganda UGX 800
$0.70 $0.28
Rice (W) Masindi Sorghum* (W)
TZS 1,394 Uganda UGX 1,009
$0.78 $0.35
Mtwara Wh Maize* (W) Maize (W)
Tanzania TZS 444 UGX 409
$0.25 $0.14
Mwanza Rice (W) Beans (W)
Tanzania TZS 1,505 UGX 1,937
$0.84 $0.68
Songea Wh Maize* (W) Sana'a Wheat *
Tanzania TZS 240 Yemen YER 120
$0.13 (Alqa) $0.56
Beans (W) Wheat Flr*
TZS 1,329 YER 141
$0.74 $0.66
Tanga Rice (W) Aden Wheat *
Tanzania TZS 1,456 Yemen YER 128
$0.82 (Al Shabat) $0.59
one year, and one year, and
5-year avg. 5-year avg.
East
Afr
ica
0 117 215 ► ▲
Food and Fuel Price Trends Food and Fuel Price Trends
% Change Over
Change over
% Change Over
Change over
one month, one month,
► ▼ ►
-3 -31 -26 ► ▼ ▼
▲
East
Afr
ica
1 -26 0
13 -14 14
-1 -36 -27 ► ▼ ▼
0 16 12 ► ▲
▲ ▼ ▲
-1 17 35 ► ▲ ▲
-21 ▼ ▼ ▼
1 18 19 ► ▲
▼ ►
4 -29 -26 ► ▼ ▼ -10
▲ 13 -14 -2 ▲
0 -28 - ► ▼
▼ ►
-1 22 8 ► ▲ ▲ 2
▲ 0 -27 0 ►
▼ 0 0 - ►
-26 5 ▼ ▼ ▲
0 -31 -33 ► ▼
▼ ▲
-5 19 - ▼ ▲ - -20
- 0 -9 30 ►
-1 -22 -19 ► ▼ ▼ -8
► 0 -14 - ►
-33 11 ►
10 22 -3 ▲ ▲
-2 -9 -7 ► ▼ ▼ 0
▼ ▼
▼ -
2 -34 -36 ► ▼ ▼ 9
▲ 1 -21 - ►7 20 14 ▲ ▲
6 - ► ▲ -
► -
4 21 6 ► ▲ ▲ -2
▲ 1 2 - ►-5 -8 35
▲ ► ▲
-35 - ▼ ▼ -
▼ -
▼ ▲
► -
-14 -4 ► ▼ ►
-18
-4 9
__________________________________________________________________
The Famine Early Warning Systems Network
__________________________________________________________________
27
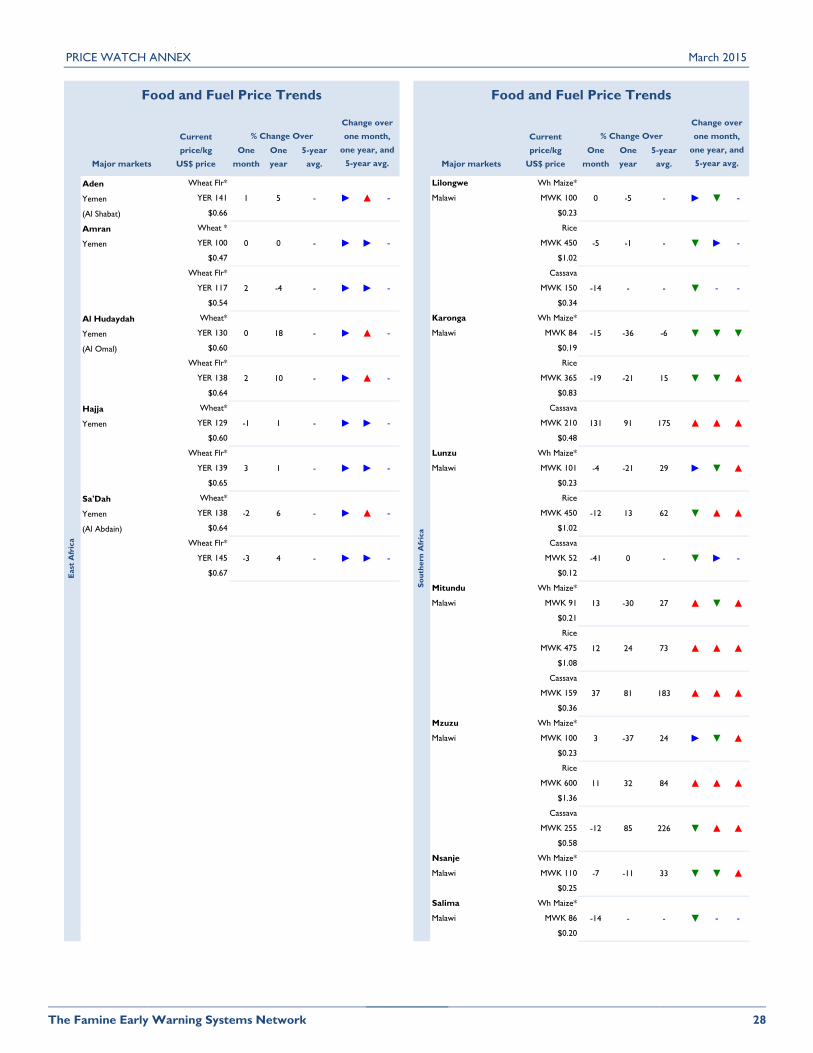
PRICE WATCH ANNEX March 2015
Current Current
price/kg One One 5-year price/kg One One 5-year
Major markets US$ price month year avg. Major markets US$ price month year avg.
Aden Wheat Flr* Lilongwe Wh Maize*
Yemen YER 141 Malawi MWK 100
(Al Shabat) $0.66 $0.23
Amran Wheat * Rice
Yemen YER 100 MWK 450
$0.47 $1.02
Wheat Flr* Cassava
YER 117 MWK 150
$0.54 $0.34
Al Hudaydah Wheat* Karonga Wh Maize*
Yemen YER 130 Malawi MWK 84
(Al Omal) $0.60 $0.19
Wheat Flr* Rice
YER 138 MWK 365
$0.64 $0.83
Hajja Wheat* Cassava
Yemen YER 129 MWK 210
$0.60 $0.48
Wheat Flr* Lunzu Wh Maize*
YER 139 Malawi MWK 101
$0.65 $0.23
Sa'Dah Wheat* Rice
Yemen YER 138 MWK 450
(Al Abdain) $0.64 $1.02
Wheat Flr* Cassava
YER 145 MWK 52
$0.67 $0.12
Mitundu Wh Maize*
Malawi MWK 91
$0.21
Rice
MWK 475
$1.08
Cassava
MWK 159
$0.36
Mzuzu Wh Maize*
Malawi MWK 100
$0.23
Rice
MWK 600
$1.36
Cassava
MWK 255
$0.58
Nsanje Wh Maize*
Malawi MWK 110
$0.25
Salima Wh Maize*
Malawi MWK 86
$0.20
% Change Over
Change over
% Change Over
Change over
one month, one month,
Food and Fuel Price Trends Food and Fuel Price Trends
one year, and one year, and
5-year avg. 5-year avg.
1 5 - ► ▲
2 10 - ► ▲ -
0 18 -
-5 -1 - ▼ ► -
-14 - - ▼ - -
-15 -36
0 0 - ► ► -
-
So
uth
ern
Afr
ica
0 -5 - ►
-3 4 - ► ► -
► ▲ -
2 -4 - ► ► -
-2 6 - ► ▲ -
3 1 - ► ► -
-1 1 - ► ► -
3 -37 24 ► ▼
32 84 ▲ ▲
-7 -11 33 ▼ ▼ ▲
East
Afr
ica
226 ▼ ▲ ▲
11
--14 - - ▼ -
-12 85
▲
▲
▼ -
-6 ▼ ▼ ▼
13 -30 27
-19 -21 15 ▼ ▼ ▲
131 91 175 ▲ ▲ ▲
-4 -21 29 ► ▼ ▲
-12 13 62 ▼ ▲ ▲
-41 0 - ▼ ► -
▲ ▼ ▲
12 24 73 ▲ ▲ ▲
37 81 183 ▲ ▲ ▲
__________________________________________________________________
The Famine Early Warning Systems Network
__________________________________________________________________
28
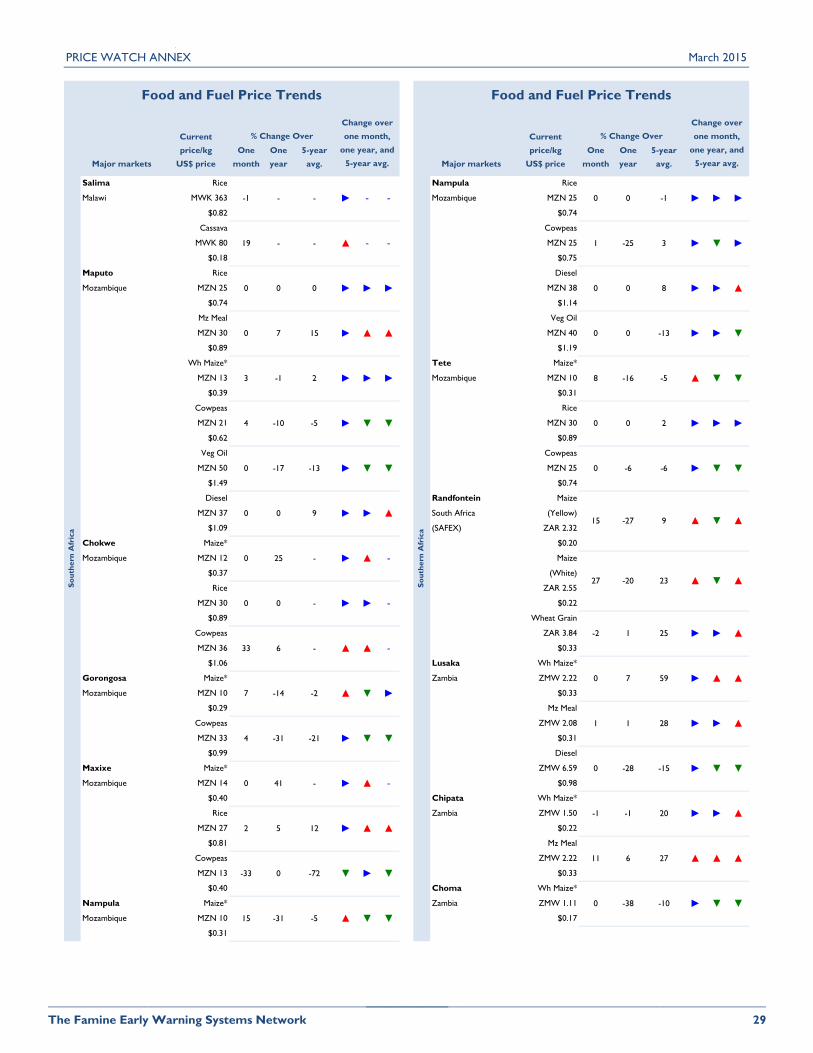
PRICE WATCH ANNEX March 2015
Current Current
price/kg One One 5-year price/kg One One 5-year
Major markets US$ price month year avg. Major markets US$ price month year avg.
Salima Rice Nampula Rice
Malawi MWK 363 Mozambique MZN 25
$0.82 $0.74
Cassava Cowpeas
MWK 80 MZN 25
$0.18 $0.75
Maputo Rice Diesel
Mozambique MZN 25 MZN 38
$0.74 $1.14
Mz Meal Veg Oil
MZN 30 MZN 40
$0.89 $1.19
Wh Maize* Tete Maize*
MZN 13 Mozambique MZN 10
$0.39 $0.31
Cowpeas Rice
MZN 21 MZN 30
$0.62 $0.89
Veg Oil Cowpeas
MZN 50 MZN 25
$1.49 $0.74
Diesel Randfontein Maize
MZN 37 South Africa (Yellow)
$1.09 (SAFEX) ZAR 2.32
Chokwe Maize* $0.20
Mozambique MZN 12 Maize
$0.37 (White)
Rice ZAR 2.55
MZN 30 $0.22
$0.89 Wheat Grain
Cowpeas ZAR 3.84
MZN 36 $0.33
$1.06 Lusaka Wh Maize*
Gorongosa Maize* Zambia ZMW 2.22
Mozambique MZN 10 $0.33
$0.29 Mz Meal
Cowpeas ZMW 2.08
MZN 33 $0.31
$0.99 Diesel
Maxixe Maize* ZMW 6.59
Mozambique MZN 14 $0.98
$0.40 Chipata Wh Maize*
Rice Zambia ZMW 1.50
MZN 27 $0.22
$0.81 Mz Meal
Cowpeas ZMW 2.22
MZN 13 $0.33
$0.40 Choma Wh Maize*
Nampula Maize* Zambia ZMW 1.11
Mozambique MZN 10 $0.17
$0.31
27 -20 23 ▲ ▼ ▲
-2 1 25 ► ► ▲
15 -27 9 ▲ ▼ ▲
Food and Fuel Price Trends Food and Fuel Price Trends
% Change Over
Change over
% Change Over
Change over
one month, one month,
So
uth
ern
Afr
ica
15 -31 -5
0 -1
-25 3
one year, and one year, and
5-year avg. 5-year avg.
So
uth
ern
Afr
ica
0 7 15 ► ▲
► ▼ ►
0 0 0 ► ► ► 0
► ► ►
19 - - ▲ - - 1
-1 - - ► - - 0
0 -17 -13 ► ▼ ▼
▲ ▼ ▼
4 -10 -5 ► ▼ ▼ 0
▼
3 -1 2 ► ► ► 8 -16 -5
▲ 0 0 -13 ► ►
0 0 - ► ► -
0 25 - ► ▲ -
0 0 9 ► ► ▲
4 -31 -21 ► ▼ ▼
7 -14 -2 ▲ ▼ ►
33 6 - ▲ ▲ -
-33 0 -72 ▼ ► ▼
2 5 12 ► ▲ ▲
0 41 - ► ▲ -
0 8 ► ► ▲
▲ ▼ ▼
▼
0 7 59 ► ▲ ▲
0 2 ► ► ►
0 -6 -6 ► ▼
-1 -1 20 ► ► ▲
0 -28 -15 ► ▼ ▼
1 1 28 ► ► ▲
-38 -10 ► ▼ ▼
11 6 27 ▲ ▲ ▲
0
__________________________________________________________________
The Famine Early Warning Systems Network
__________________________________________________________________
29

PRICE WATCH ANNEX March 2015
Current Current
price/kg One One 5-year price/kg One One 5-year
Major markets US$ price month year avg. Major markets US$ price month year avg.
Choma Mz Meal Gwanda Wh Maize*
Zambia ZMW 2.09 Zimbabwe USD 0.29
$0.31 $0.29
Kabwe Wh Maize* Maize Flr
Zambia ZMW 1.78 USD 0.55
$0.27 $0.55
Mz Meal Masvingo Wh Maize*
ZMW 2.11 Zimbabwe USD 0.29
$0.32 $0.29
Kasama Wh Maize* Masvingo Maize Flr
Zambia ZMW 1.96 Zimbabwe USD 0.60
$0.29 $0.60
Kasama Mz Meal Bulawayo Wh Maize*
Zambia ZMW 2.19 Zimbabwe USD 0.34
$0.33 $0.34
Kitwe Wh Maize* Maize Flr
Zambia ZMW 1.92 USD 0.60
$0.29 $0.60
Mz Meal
ZMW 1.99
$0.30
Mansa Wh Maize*
Zambia ZMW 1.78
$0.27
Mz Meal
ZMW 2.13
$0.32
Mongu Wh Maize*
Zambia ZMW 2.22
$0.33
Mz Meal
ZMW 2.37
$0.35
Solwezi Wh Maize*
Zambia ZMW 1.67
$0.25
Mz Meal
ZMW 2.18
$0.33
Harare Wh Maize*
Zimbabwe USD 0.34
$0.34
Maize Flr
USD 0.60
$0.60
Diesel
USD 1.25
$1.25
Gasoline
USD 1.40
$1.40
one year, and one year, and
5-year avg. 5-year avg.
So
uth
ern
Afr
ica
10 15 25 ▲ ▲
Food and Fuel Price Trends Food and Fuel Price Trends
% Change Over
Change over
% Change Over
Change over
one month, one month,
► -
5 8 34 ▲ ▲ ▲ -14 0
▲ -
-2 -2 20 ► ► ▲ 0 0
▲
So
uth
ern
Afr
ica
0 20 - ►
- ►
- ▼
-3 1 24 ► ► ▲
► -
1 -10 16 ► ▼ ▲
11 -10 30 ▲ ▼ ▲
1 -1 21 ► ► ▲
-1 -16 19 ► ▼ ▲
0 -1 27 ► ► ▲
0 17 -9 ► ▲ ▼
-2 -9 20 ► ▼ ▲
-4 -9 5 ► ▼ ▲
3 15 23 ► ▲ ▲
0 -37 - ► ▼ -
-2 -10 7 ► ▼ ▲
0 -28 - ► ▼ -
0 -8 - ► ▼ -► -
10 -6 20 ▲ ▼ ▲
0 -1 27 ► ► ▲
0 0 - ►
__________________________________________________________________
The Famine Early Warning Systems Network
__________________________________________________________________
30
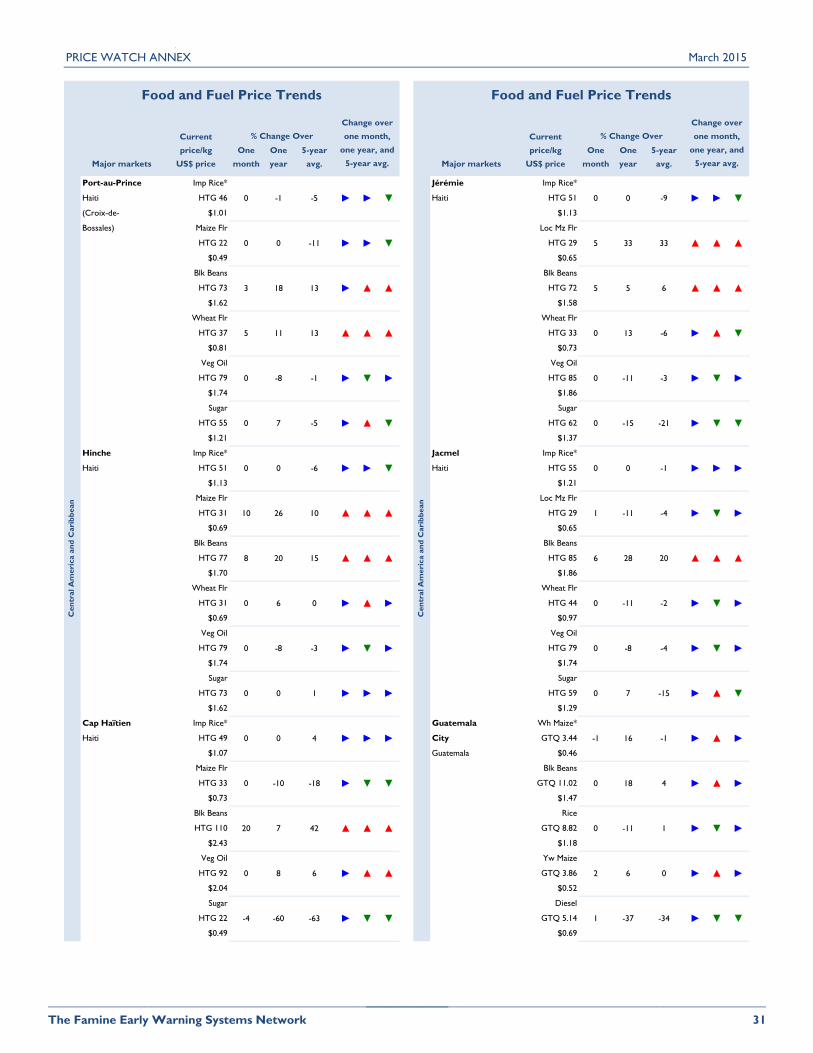
PRICE WATCH ANNEX March 2015
Current Current
price/kg One One 5-year price/kg One One 5-year
Major markets US$ price month year avg. Major markets US$ price month year avg.
Port-au-Prince Imp Rice* Jérémie Imp Rice*
Haiti HTG 46 Haiti HTG 51
(Croix-de- $1.01 $1.13
Bossales) Maize Flr Loc Mz Flr
HTG 22 HTG 29
$0.49 $0.65
Blk Beans Blk Beans
HTG 73 HTG 72
$1.62 $1.58
Wheat Flr Wheat Flr
HTG 37 HTG 33
$0.81 $0.73
Veg Oil Veg Oil
HTG 79 HTG 85
$1.74 $1.86
Sugar Sugar
HTG 55 HTG 62
$1.21 $1.37
Hinche Imp Rice* Jacmel Imp Rice*
Haiti HTG 51 Haiti HTG 55
$1.13 $1.21
Maize Flr Loc Mz Flr
HTG 31 HTG 29
$0.69 $0.65
Blk Beans Blk Beans
HTG 77 HTG 85
$1.70 $1.86
Wheat Flr Wheat Flr
HTG 31 HTG 44
$0.69 $0.97
Veg Oil Veg Oil
HTG 79 HTG 79
$1.74 $1.74
Sugar Sugar
HTG 73 HTG 59
$1.62 $1.29
Cap Haïtien Imp Rice* Guatemala Wh Maize*
Haiti HTG 49 City GTQ 3.44
$1.07 Guatemala $0.46
Maize Flr Blk Beans
HTG 33 GTQ 11.02
$0.73 $1.47
Blk Beans Rice
HTG 110 GTQ 8.82
$2.43 $1.18
Veg Oil Yw Maize
HTG 92 GTQ 3.86
$2.04 $0.52
Sugar Diesel
HTG 22 GTQ 5.14
$0.49 $0.69
20 15 ▲ ▲ ▲
0
one year, and one year, and
5-year avg. 5-year avg.
Cen
tral A
meri
ca a
nd
Cari
bb
ean
0 -1 -5 ► ►
Food and Fuel Price Trends Food and Fuel Price Trends
% Change Over
Change over
% Change Over
Change over
one month, one month,
▲ ▲
3 18 13 ► ▲ ▲ 5 5
► ▼
0
7 -5
-11 ► ► ▼ 5 33
▼
Cen
tral A
meri
ca a
nd
Cari
bb
ean
0 0 -9 ►
33 ▲
6 ▲
-6 ►
0 -15 -21 ►
1 -37 -34 ►
▲ ▼
0 -8 -1 ► ▼ ►
▲ ▲
5 11 13 ▲ ▲ ▲ 0 13
► ▲ ▼
0 -11 -3 ► ▼ ►
1 -11 -4 ► ▼ ►10 26 10 ▲ ▲ ▲
0 0 -1 ► ► ►
▼ ▼0
►0 -8 -3 ► ▼ ►
0 0 -6 ► ► ▼
0 -11 -2 ► ▼ ►0 6 0 ► ▲ ►
6 28 20 ▲ ▲ ▲8
0 -10 -18 ► ▼ ▼
0 0 4 ► ► ►
0 7 -15 ► ▲
-1 16 -1 ► ▲
18 4 ► ▲
0 0 1 ► ► ►
-4 -60 -63 ► ▼ ▼
0 8 6 ► ▲ ▲
20 7 42 ▲ ▲ ▲
▼
0 -8 -4 ► ▼
►
0 -11 1 ► ▼ ►
►
0
2 6 0 ► ▲ ►
▼ ▼
__________________________________________________________________
The Famine Early Warning Systems Network
__________________________________________________________________
31
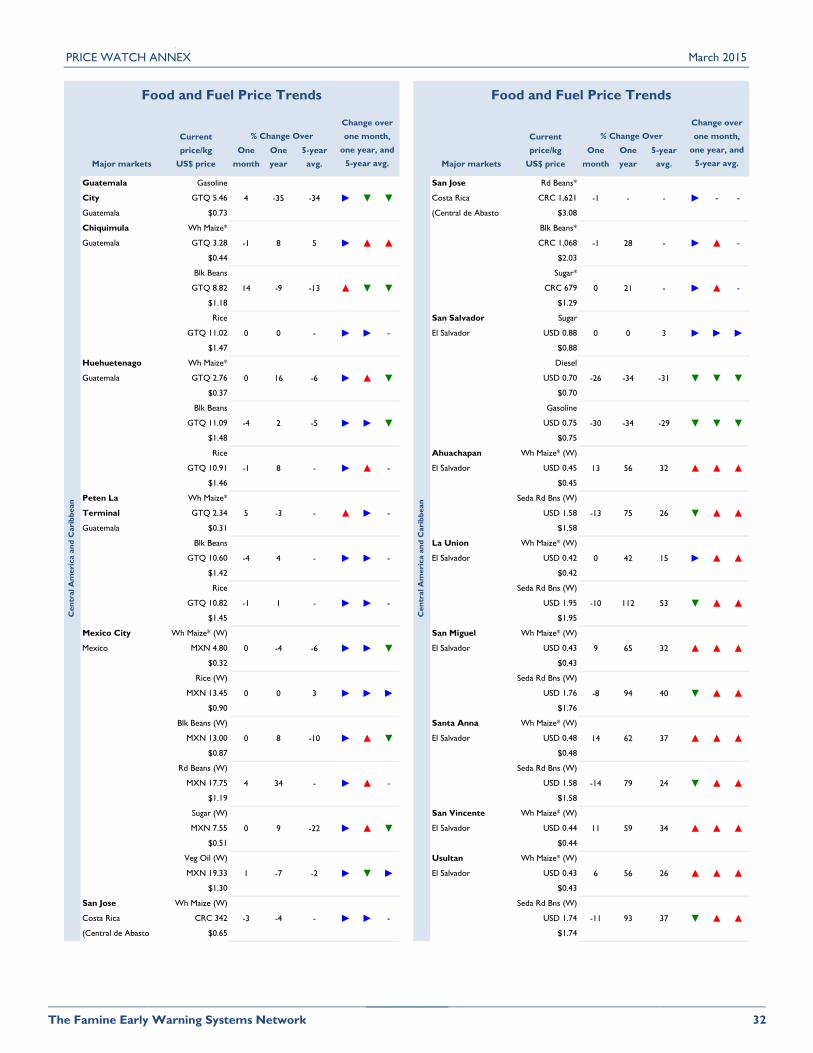
PRICE WATCH ANNEX March 2015
Current Current
price/kg One One 5-year price/kg One One 5-year
Major markets US$ price month year avg. Major markets US$ price month year avg.
Guatemala Gasoline San Jose Rd Beans*
City GTQ 5.46 Costa Rica CRC 1,621
Guatemala $0.73 (Central de Abasto $3.08
Chiquimula Wh Maize* Blk Beans*
Guatemala GTQ 3.28 CRC 1,068
$0.44 $2.03
Blk Beans Sugar*
GTQ 8.82 CRC 679
$1.18 $1.29
Rice San Salvador Sugar
GTQ 11.02 El Salvador USD 0.88
$1.47 $0.88
Huehuetenago Wh Maize* Diesel
Guatemala GTQ 2.76 USD 0.70
$0.37 $0.70
Blk Beans Gasoline
GTQ 11.09 USD 0.75
$1.48 $0.75
Rice Ahuachapan Wh Maize* (W)
GTQ 10.91 El Salvador USD 0.45
$1.46 $0.45
Peten La Wh Maize* Seda Rd Bns (W)
Terminal GTQ 2.34 USD 1.58
Guatemala $0.31 $1.58
Blk Beans La Union Wh Maize* (W)
GTQ 10.60 El Salvador USD 0.42
$1.42 $0.42
Rice Seda Rd Bns (W)
GTQ 10.82 USD 1.95
$1.45 $1.95
Mexico City Wh Maize* (W) San Miguel Wh Maize* (W)
Mexico MXN 4.80 El Salvador USD 0.43
$0.32 $0.43
Rice (W) Seda Rd Bns (W)
MXN 13.45 USD 1.76
$0.90 $1.76
Blk Beans (W) Santa Anna Wh Maize* (W)
MXN 13.00 El Salvador USD 0.48
$0.87 $0.48
Rd Beans (W) Seda Rd Bns (W)
MXN 17.75 USD 1.58
$1.19 $1.58
Sugar (W) San Vincente Wh Maize* (W)
MXN 7.55 El Salvador USD 0.44
$0.51 $0.44
Veg Oil (W) Usultan Wh Maize* (W)
MXN 19.33 El Salvador USD 0.43
$1.30 $0.43
San Jose Wh Maize (W) Seda Rd Bns (W)
Costa Rica CRC 342 USD 1.74
(Central de Abasto $0.65 $1.74
one year, and
- ► ▲ -
one year, and
5-year avg. 5-year avg.
Cen
tral A
meri
ca a
nd
Cari
bb
ean
4 -35 -34 ► ▼
Food and Fuel Price Trends Food and Fuel Price Trends
% Change Over
Change over
% Change Over
Change over
one month, one month,
▲ -
14 -9 -13 ▲ ▼ ▼ 0 21
- -
-1 8
▼
►
-30 -34 -29 ▼
-8 94 40 ▼
6 56 26 ▲
-11 93
-10 112 53 ▼
0 16 -6 ► ▲ ▼
▲ -
0 0 - ► ► - 0 0
5 ► ▲ ▲ -1 28
Cen
tral A
meri
ca a
nd
Cari
bb
ean
-1 - - ►
- ►
- ►
3
-4 2 -5 ► ► ▼
-26 -34 -31 ▼ ▼ ▼
-13 75 26 ▼ ▲ ▲5 -3 - ▲ ► -
13 56 32 ▲ ▲ ▲-1 8
▲ ▲-1 1 - ► ► -
0 42 15 ► ▲ ▲-4 4 - ► ► -
0 0 3 ► ► ►
9 65 32 ▲ ▲ ▲0 -4 -6 ► ► ▼
▲ ▲
4 34 - ► ▲ -
14 62 37 ▲ ▲ ▲0 8 -10 ► ▲ ▼
▼ ▲ ▲24
-3 -4 - ► ► -
1 -7 -2 ► ▼ ►
0 9 -22 ► ▲ ▼
▲ ▲
11
► ►
▼ ▼
37 ▼ ▲ ▲
59 34 ▲ ▲ ▲
-14 79
__________________________________________________________________
The Famine Early Warning Systems Network
__________________________________________________________________
32
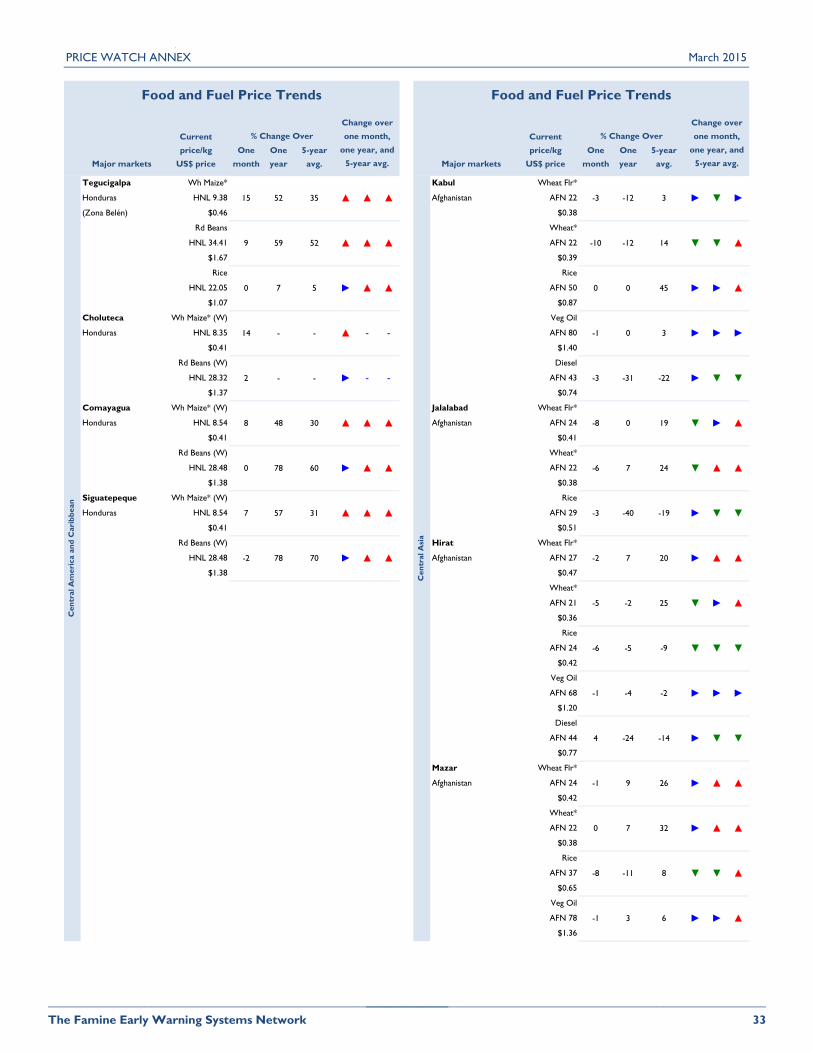
PRICE WATCH ANNEX March 2015
Current Current
price/kg One One 5-year price/kg One One 5-year
Major markets US$ price month year avg. Major markets US$ price month year avg.
Tegucigalpa Wh Maize* Kabul Wheat Flr*
Honduras HNL 9.38 Afghanistan AFN 22
(Zona Belén) $0.46 $0.38
Rd Beans Wheat*
HNL 34.41 AFN 22
$1.67 $0.39
Rice Rice
HNL 22.05 AFN 50
$1.07 $0.87
Choluteca Wh Maize* (W) Veg Oil
Honduras HNL 8.35 AFN 80
$0.41 $1.40
Rd Beans (W) Diesel
HNL 28.32 AFN 43
$1.37 $0.74
Comayagua Wh Maize* (W) Jalalabad Wheat Flr*
Honduras HNL 8.54 Afghanistan AFN 24
$0.41 $0.41
Rd Beans (W) Wheat*
HNL 28.48 AFN 22
$1.38 $0.38
Siguatepeque Wh Maize* (W) Rice
Honduras HNL 8.54 AFN 29
$0.41 $0.51
Rd Beans (W) Hirat Wheat Flr*
HNL 28.48 Afghanistan AFN 27
$1.38 $0.47
Wheat*
AFN 21
$0.36
Rice
AFN 24
$0.42
Veg Oil
AFN 68
$1.20
Diesel
AFN 44
$0.77
Mazar Wheat Flr*
Afghanistan AFN 24
$0.42
Wheat*
AFN 22
$0.38
Rice
AFN 37
$0.65
Veg Oil
AFN 78
$1.36
one year, and
Cen
tral A
meri
ca a
nd
Cari
bb
ean
15 52 35 ▲ ▲
Food and Fuel Price Trends Food and Fuel Price Trends
% Change Over
Change over
% Change Over
Change over
one month, one month,
▼ ▲
0 7 5 ► ▲ ▲ 0 0
▼ ►
9 59
▲
-22 ►
-6 7 24 ▼
-2 7 20 ►
-6 -5 -9 ▼
one year, and
5-year avg. 5-year avg.
2 - - ► - -
► ▲
14 - - ▲ - - -1 0
52 ▲ ▲ ▲ -10 -12
3 ► ► ►
0 78 60 ► ▲ ▲
-8 0 19 ▼ ► ▲8 48 30 ▲ ▲ ▲
▲ ▲
Cen
tral A
sia
-3 -12 3 ►
14 ▼
45 ►
-3 -31
-2 78 70 ► ▲ ▲
-3 -40 -19 ► ▼ ▼7 57 31 ▲ ▲ ▲
-5 -2 25 ▼ ► ▲
-1 -4 -2 ► ► ►
4 -24
-1 9 26 ► ▲ ▲
▲
-8 -11 8 ▼ ▼ ▲
-1 3 6 ► ► ▲
0 7 32 ► ▲
-14 ► ▼ ▼
▼ ▼
▲ ▲
▼ ▼
__________________________________________________________________
The Famine Early Warning Systems Network
__________________________________________________________________
33
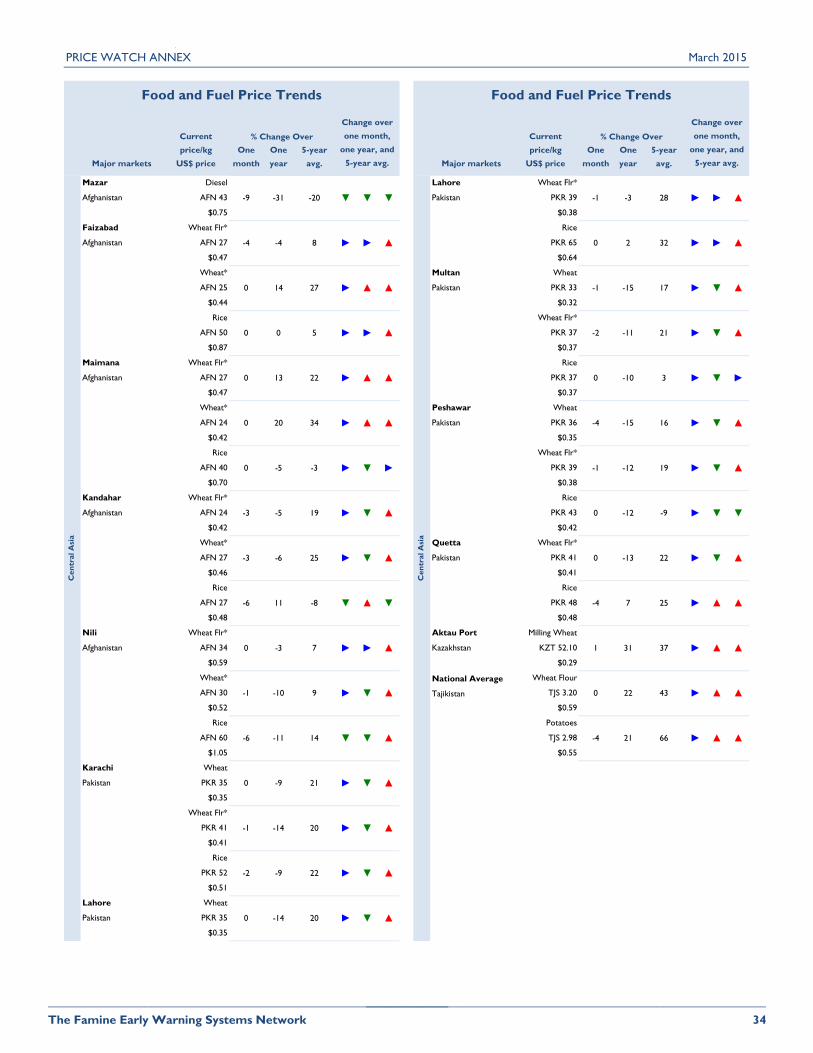
PRICE WATCH ANNEX March 2015
Current Current
price/kg One One 5-year price/kg One One 5-year
Major markets US$ price month year avg. Major markets US$ price month year avg.
Mazar Diesel Lahore Wheat Flr*
Afghanistan AFN 43 Pakistan PKR 39
$0.75 $0.38
Faizabad Wheat Flr* Rice
Afghanistan AFN 27 PKR 65
$0.47 $0.64
Wheat* Multan Wheat
AFN 25 Pakistan PKR 33
$0.44 $0.32
Rice Wheat Flr*
AFN 50 PKR 37
$0.87 $0.37
Maimana Wheat Flr* Rice
Afghanistan AFN 27 PKR 37
$0.47 $0.37
Wheat* Peshawar Wheat
AFN 24 Pakistan PKR 36
$0.42 $0.35
Rice Wheat Flr*
AFN 40 PKR 39
$0.70 $0.38
Kandahar Wheat Flr* Rice
Afghanistan AFN 24 PKR 43
$0.42 $0.42
Wheat* Quetta Wheat Flr*
AFN 27 Pakistan PKR 41
$0.46 $0.41
Rice Rice
AFN 27 PKR 48
$0.48 $0.48
Nili Wheat Flr* Aktau Port Milling Wheat
Afghanistan AFN 34 Kazakhstan KZT 52.10
$0.59 $0.29
Wheat* National Average Wheat Flour
AFN 30 Tajikistan TJS 3.20
$0.52 $0.59
Rice Potatoes
AFN 60 TJS 2.98
$1.05 $0.55
Karachi Wheat
Pakistan PKR 35
$0.35
Wheat Flr*
PKR 41
$0.41
Rice
PKR 52
$0.51
Lahore Wheat
Pakistan PKR 35
$0.35
1 31 37 ► ▲ ▲
►
-4 8 ► ► ▲
0
one year, and one year, and
5-year avg. 5-year avg.
Cen
tral A
sia
Food and Fuel Price Trends Food and Fuel Price Trends
% Change Over
Change over
% Change Over
Change over
one month, one month,
0 -9 21 ► ▼ ▲
Cen
tral A
sia
-9 -31 -20 ▼ ▼ ▼
-4
-6 25 ►
▲
0 13 22 ► ▲ ▲
0 20 34 ► ▲ ▲
14 27 ► ▲ ▲
0 0 5 ►
▼ ▲
-6 11 -8 ▼ ▲ ▼
0 -3
-5 -3 ► ▼ ►
7 ► ► ▲
-1 -10 9 ► ▼ ▲
-6 -11 14 ▼ ▼ ▲
0
-3 -5 19 ► ▼ ▲
-3
0 -14 20 ► ▼ ▲
-1 -14 20 ► ▼ ▲
-2 -9 22 ► ▼ ▲
-4 -15 16 ► ▼ ▲
-1 -12 19
▲
-4 21 66 ► ▲ ▲
▲ ▲
0
7 25 ►
-1 -3 28 ► ► ▲
0 2 32 ► ► ▲
-1 -15 17 ► ▼ ▲
22 43 ►
-2 -11 21 ► ▼ ▲
0 -10 3 ► ▼ ►
▲
► ▼ ▲
0 -12 -9 ► ▼ ▼
0 -13 22 ► ▼ ▲
-4
__________________________________________________________________
The Famine Early Warning Systems Network
__________________________________________________________________
34

PRICE WATCH ANNEX March 2015
Current Current
price/kg One One 5-year price/kg One One 5-year
Major markets US$ price month year avg. Major markets US$ price month year avg.
Gulf of Mexico Maize Aktau Port Milling Wheat
United States (Yellow No. 2) Kazakhstan KZT 52.10
USD 0.17 $0.29
$0.17 Black Sea Milling Wheat
Randfontein Maize (Average) USD 15.43
South Africa (Yellow) $0.24
(SAFEX) ZAR 2.32 Eastern States Wheat
$0.20 Australia (ASW)
Maize (standard) AUD 0.31
(White) USD 0.24
ZAR 2.55 Gulf of Mexico Wheat
$0.22 United States No. 2, Hard Red
WinterUp River Maize USD 0.25
Argentina ARS 1.55 $0.25
$0.18 Wheat
No. 2, Soft Red
WinterUSD 0.22
Bangkok Rice $0.22
Thailand (100% B) Randfontein Wheat Grain
THB 13.98 South Africa ZAR 3.84
$0.43 (SAFEX) $0.33
Rice Rouën Wheat
(A1 Super) France (Grade 1)
THB 10.76 EUR 0.19
$0.33 $0.22
Hanoi Rice St. Lawrence Wheat
Vietnam (5% broken) Canada (CWRS)
VND 7,070 CAD 0.35
$0.35 $0.28
Up River Wheat
Argentina (Trigo Pan)
Gulf of Mexico Sorghum ARS 2.09
United States (Yellow No. 2) $0.24
USD 0.23
$0.23
West Texas Crude Oil*
Intermediate (WTI
)
USD 50.61
Gulf of Mexico Soybeans United States $50.61
United States USD 0.24 Brent Crude Oil*
$0.24 Northern Sea USD 54.79
$54.79
Dubai Crude Oil*
Caribbean Sugar Persian Gulf USD 55.83
(Raw) $55.83
(Average) USD 0.32 *reported in $/bbl
$0.32
Food and Fuel Price Trends Food and Fuel Price Trends
% Change Over
Change over
% Change Over
Change over
one month, one month,
Inte
rnati
on
al
7 -50 -45 ▲ ▼ ▼
16 -48 -48
CRUDE OIL
Inte
rnati
on
al
-4 -17 -16 ► ▼ ▼
-5 -15 -18 ▼ ▼ ▼
▼ ▼
RICE
0 -8 -23 ► ▼-2
▲ ▼ ▼
▲ ▼ ▼
21 -45
one year, and
5-year avg.
MAIZE
27 -20 23 ▲
-1 -17 -30 ► ▼ ▼
▼
▼
-6 -10 -17 ▼ ▼ ▼
SOYBEANS
-7 -7 -8 ▼ ▼ ▼
15 -27 9 ▲ ▼ ▲
0 6 -26 ► ▲ ▼
▲
-3 -18 -27 ►
SUGAR
-5 -12 -36 ▼ ▼ ▼
-6 - -
-45
▼ - -
-5 -27 -20 ▼ ▼ ▼SORGHUM
-1 3 -6 ► ► ▼
WHEAT
1 31 37 ► ▲ ▲
-3 -14 - ► ▼ -
-7 -7 -8 ▼ ▼ ▼
251 ► ► ▲
-8 -21 -24 ▼ ▼ ▼
one year, and
5-year avg.
__________________________________________________________________
The Famine Early Warning Systems Network
__________________________________________________________________
35

FEWS NET
www.fews.net
Figure 4. Sorghum prices in West Africa (2010 - 2015)
Figure 6. Rice prices in West Africa (2010 - 2015)
Figure 7. Dry bean prices in East Africa (2010 - 2015) Figure 8. Sorghum prices in East Africa (2010 - 2015)
PRICE WATCH ANNEX 2 February 2015 Prices
Was
t A
fric
a
March 31, 2015
Figure 3. Millet prices in West Africa (2010 - 2015)
Figure 5. Maize prices in West Africa (2010 - 2015)
East
Afr
ica
Sources of prices in West Africa: Information System on agricultural markets (SIMA) Niger, Agricultural Market Observatory (OMA) Mali, Burkina Faso SONAGESS, Information System
market (SIM) in Senegal and FEWS NET.
The Famine Early Warning Systems Network (FEWS NET) monitors trends in staple food prices in countries vulnerable to foodd insecurity. The Price Watch Annex 2 provides prices
trends for key markets and staple foods monitored across FEWS NET countries and regions. The commodities with a reference (W) are wholesale prices. Otherwise, all reported prices
are retail.
0.00
0.25
0.50
0.75
Jan-1
0
Apr-
10
Jul-10
Oct
-10
Jan-1
1
Apr-
11
Jul-11
Oct
-11
Jan-1
2
Apr-
12
Jul-12
Oct
-12
Jan-1
3
Apr-
13
Jul-13
Oct
-13
Jan-1
4
Apr-
14
Jul-14
Oct
-14
Jan-1
5
Apr-
15
Moundou, Chad Solenzo, Burkina FasoSegou, Mali Maradi, Niger
Kaolak, Senegal
USD/kg
0.00
0.25
0.50
0.75
Jan-1
0
Apr-
10
Jul-10
Oct
-10
Jan-1
1
Apr-
11
Jul-11
Oct
-11
Jan-1
2
Apr-
12
Jul-12
Oct
-12
Jan-1
3
Apr-
13
Jul-13
Oct
-13
Jan-1
4
Apr-
14
Jul-14
Oct
-14
Jan-1
5
Apr-
15
Maradi, Niger Kano, Nigeria
Moundou, Chad Segou, Mali
Bobo Dioulasso, Burkina Faso
USD/kg
0.00
0.25
0.50
0.75
Jan-1
0
Apr-
10
Jul-10
Oct
-10
Jan-1
1
Apr-
11
Jul-11
Oct
-11
Jan-1
2
Apr-
12
Jul-12
Oct
-12
Jan-1
3
Apr-
13
Jul-13
Oct
-13
Jan-1
4
Apr-
14
Jul-14
Oct
-14
Jan-1
5
Apr-
15
Kano, Nigeria(W) Malanville, BeninBol, Chad Tamale, GhanaBobo Dioulasso, Burkina Faso
USD/kg
0.00
0.50
1.00
1.50
2.00
Jan-1
0
Apr-
10
Jul-10
Oct
-10
Jan-1
1
Apr-
11
Jul-11
Oct
-11
Jan-1
2
Apr-
12
Jul-12
Oct
-12
Jan-1
3
Apr-
13
Jul-13
Oct
-13
Jan-1
4
Apr-
14
Jul-14
Oct
-14
Jan-1
5
Apr-
15
Accra, Ghana Nouakchott, Mauritania*
Bamako, Mali Dakar, Senegal*
Monrovia, Liberia*
USD/kg
FEWS NET is a USAID-funded activity. The content of this report does not necessarily reflect the
view of the United States Agency for International Development or the United States Government.
0.00
0.20
0.40
0.60
0.80
1.00
1.20
1.40
1.60
1.80
2.00
Jan-1
0
Apr-
10
Jul-10
Oct
-10
Jan-1
1
Apr-
11
Jul-11
Oct
-11
Jan-1
2
Apr-
12
Jul-12
Oct
-12
Jan-1
3
Apr-
13
Jul-13
Oct
-13
Jan-1
4
Apr-
14
Jul-14
Oct
-14
Jan-1
5
Apr-
15
Gadaref, Sudan Baidoa, SomaliaJuba, South Sudan Kampala, Uganda (W)Dire Dawa, Ethiopia (W)
USD/kg
____________________* imported rice
0.00
0.30
0.60
0.90
1.20
1.50
Jan-1
0
Apr-
10
Jul-10
Oct
-10
Jan-1
1
Apr-
11
Jul-11
Oct
-11
Jan-1
2
Apr-
12
Jul-12
Oct
-12
Jan-1
3
Apr-
13
Jul-13
Oct
-13
Jan-1
4
Apr-
14
Jul-14
Oct
-14
Jan-1
5
Apr-
15
Arusha, Tanzania (W) Eldoret, Kenya (W)
Kigali City, Kimironko, Rwanda Masindi, Uganda (W)
USD/kg

PRICE WATCH ANNEX
Figure 12. Bean and cowpea prices in Southern Africa (2010 - 2015)
Figure 14. Dry bean prices in Central America (2010 - 2015)
Figure 10. Maize prices in deficit areas of East Africa (2010 - 2015)
East
Afr
ica
Figure 9. Maize prices in surplus areas of East Africa (2010 - 2015)
Figure 11. White maize prices in Southern Africa (2010 - 2015)
Cen
tral A
sia
March 2015
Figure 13. White maize prices in Central America (2010 - 2015)
So
uth
ern
Afr
ica
Sources of prices in East Africa: Food and Agriculture Market Information System (FAMIS) FSTS/FEWS NET in Somalia, Uganda Bureau of Statistics and Farmgain, Tanzania Ministry of
Industry, Trade and Marketing (MITM), Ethiopia Grain Trade Enterprise (EGTE), Ministry of Agriculture of Kenya, Arid Lands Resource Management Project (ALRMP), SIFSIA, WFP VAM and
Sources of prices in Southern Africa: Ministry of Agriculture, Irrigation, and Water Development of Malawi, Ministry of Industry, Trade and Marketing (MITM)) of Tanzania, Ministry of
Agriculture of Mozambique, Central Statistics Office of Zambia, SAFEX, WFP and FEWS NET.
0.00
0.25
0.50
0.75
1.00
1.25
Jan-1
0
Apr-
10
Jul-10
Oct
-10
Jan-1
1
Apr-
11
Jul-11
Oct
-11
Jan-1
2
Apr-
12
Jul-12
Oct
-12
Jan-1
3
Apr-
13
Jul-13
Oct
-13
Jan-1
4
Apr-
14
Jul-14
Oct
-14
Jan-1
5
Apr-
15
Jamame, Somalia Jijiga, EthiopiaMandera, Kenya Moyale, KenyaDire Dawa, Ethiopia (W)
USD/kg
0.00
0.50
1.00
1.50
2.00Ja
n-0
9
Apr-
09
Jul-09
Oct
-09
Jan-1
0
Apr-
10
Jul-10
Oct
-10
Jan-1
1
Apr-
11
Jul-11
Oct
-11
Jan-1
2
Apr-
12
Jul-12
Oct
-12
Jan-1
3
Apr-
13
Jul-13
Oct
-13
USD/kg
0.00
0.25
0.50
0.75
Jan-1
0
Apr-
10
Jul-10
Oct
-10
Jan-1
1
Apr-
11
Jul-11
Oct
-11
Jan-1
2
Apr-
12
Jul-12
Oct
-12
Jan-1
3
Apr-
13
Jul-13
Oct
-13
Jan-1
4
Apr-
14
Jul-14
Oct
-14
Jan-1
5
Apr-
15
Nampula, Mozambique Salima, MalawiChoma, Zambia Harare, ZimbabweMbeya, Tanzania (W) Randfontein, South Africa (W)
USD/kg
0.00
0.50
1.00
1.50
Jan-1
0
Apr-
10
Jul-10
Oct
-10
Jan-1
1
Apr-
11
Jul-11
Oct
-11
Jan-1
2
Apr-
12
Jul-12
Oct
-12
Jan-1
3
Apr-
13
Jul-13
Oct
-13
Jan-1
4
Apr-
14
Jul-14
Oct
-14
Jan-1
5
Apr-
15
Maputo, Mozambique** Dodoma, Tanzania (W)*
Arusha, Tanzania (W)* Nampula, Mozambique**
USD/kg
0.00
0.25
0.50
0.75Ja
n-1
0
Apr-
10
Jul-10
Oct
-10
Jan-1
1
Apr-
11
Jul-11
Oct
-11
Jan-1
2
Apr-
12
Jul-12
Oct
-12
Jan-1
3
Apr-
13
Jul-13
Oct
-13
Jan-1
4
Apr-
14
Jul-14
Oct
-14
Jan-1
5
Apr-
15
Eldoret, Kenya (W) Qorioley, SomaliaKampala, Uganda (W) Arusha, Tanzania (W)Bahir Dar, Ethiopia (W) Songea, Tanzania*
USD/kg
____________________* black beans** red beans
____________________* dry beans** cowpeas (mixed)
0.00
0.25
0.50
0.75
1.00
Jan-1
0
Apr-
10
Jul-10
Oct
-10
Jan-1
1
Apr-
11
Jul-11
Oct
-11
Jan-1
2
Apr-
12
Jul-12
Oct
-12
Jan-1
3
Apr-
13
Jul-13
Oct
-13
Jan-1
4
Apr-
14
Jul-14
Oct
-14
Jan-1
5
Apr-
15
Tegucigalpa, Honduras Guatemala City, Guatemala
Managua, Nicaragua San Salvador, El Salvador
Mexico City, Mexico
USD/kg
0.00
0.50
1.00
1.50
2.00
2.50
3.00
3.50
Jan-1
0
Apr-
10
Jul-10
Oct
-10
Jan-1
1
Apr-
11
Jul-11
Oct
-11
Jan-1
2
Apr-
12
Jul-12
Oct
-12
Jan-1
3
Apr-
13
Jul-13
Oct
-13
Jan-1
4
Apr-
14
Jul-14
Oct
-14
Jan-1
5
Apr-
15
Tegucigalpa, Honduras ** San Salvador, El Salvador **
Managua, Nicaragua ** San Jose, Costa Rica (W) **
Guatemala City, Guatemala (W) *
USD/kg
__________________________________________________________________
The Famine Early Warning Systems Network
__________________________________________________________________
37

PRICE WATCH ANNEX March 2015
Figure 16. Black bean prices in Haiti (2010 - 2015)
C
en
tral A
meri
ca a
nd
Cari
bb
ean
Figure 18. Wheat flour prices in Central Asia (2010 - 2015)Figure 17. Wheat grain prices in Central Asia (2010 - 2015)
Figure 15. Imported Rice Prices in Haiti (2010-2015)
Sources of prices in Central America and Caribbean: Coordination nationale de la sécurité alimentaire (CNSA) and FEWS NET, MAL, Dirección General de Economía Agropecuaria (DGEA),
Sistema de Información de Mercados Productos Agrícolas de Honduras (SIMPAH), Secretaria de Economia de Mexico, and Ministerio de Agricultura, Ganaderia y Alimentacion de Guatemala
(MAGA).
Sources of prices in Central Asia: Afghanistan, WFP and FEWS NET.
0.00
0.50
1.00
1.50
2.00
2.50Ja
n-1
0
Apr-
10
Jul-10
Oct
-10
Jan-1
1
Apr-
11
Jul-11
Oct
-11
Jan-1
2
Apr-
12
Jul-12
Oct
-12
Jan-1
3
Apr-
13
Jul-13
Oct
-13
Jan-1
4
Apr-
14
Jul-14
Oct
-14
Jan-1
5
Apr-
15
Jacmel Port-au-Prince HincheJérémie Cap-Haïtien
USD/kg
0.00
0.50
1.00
1.50
2.00
2.50
3.00
Jan-1
0
Apr-
10
Jul-10
Oct
-10
Jan-1
1
Apr-
11
Jul-11
Oct
-11
Jan-1
2
Apr-
12
Jul-12
Oct
-12
Jan-1
3
Apr-
13
Jul-13
Oct
-13
Jan-1
4
Apr-
14
Jul-14
Oct
-14
Jan-1
5
Apr-
15
Jacmel Port-au-Prince HincheJérémie Cap-Haïtien
USD/kg
0.00
0.25
0.50
0.75
1.00
Jan-1
0
Apr-
10
Jul-10
Oct
-10
Jan-1
1
Apr-
11
Jul-11
Oct
-11
Jan-1
2
Apr-
12
Jul-12
Oct
-12
Jan-1
3
Apr-
13
Jul-13
Oct
-13
Jan-1
4
Apr-
14
Jul-14
Oct
-14
Jan-1
5
Apr-
15
Mazar, Afghanistan Kabul, AfghanistanFaizabad, Afghanistan Tajikistan National AveragePeshawar, Pakistan
USD/kg
0.00
0.25
0.50
0.75
Jan-1
0
Apr-
10
Jul-10
Oct
-10
Jan-1
1
Apr-
11
Jul-11
Oct
-11
Jan-1
2
Apr-
12
Jul-12
Oct
-12
Jan-1
3
Apr-
13
Jul-13
Oct
-13
Jan-1
4
Apr-
14
Jul-14
Oct
-14
Jan-1
5
Apr-
15
Aktau Port, Kazakhstan (W) Kabul, AfghanistanMazar, Afghanistan Dushanbe, TajikistanLahore, Pakistan
USD/kg
__________________________________________________________________
The Famine Early Warning Systems Network
__________________________________________________________________
38