Price Transparency, Media and Informative Advertising transparency and informative... · Price...
47
Price Transparency, Media and Informative Advertising * Itai Ater § and Oren Rigbi † § Tel Aviv University and CEPR † Ben Gurion University, Israel Antitrust Authority and CESifo May 23, 2019 Abstract We study the effects of a regulation that required Israeli supermarkets to post online the prices of all items sold in their brick-and-mortar stores. Using a differences-in-differences research design and multiple complementary control groups, we show that prices have declined by 4% to 5% after the regulation, primarily in premium chains. Price dispersion has also dropped as chains adopted a uniform pricing strategy, setting similar prices across same-chain stores. To uncover the underlying mechanisms, we test predictions based on Robert and Stahl (1993). Consistent with these predictions we find that following the transparency regulation: (1) hard-discount chains extensively used ads stressing their low prices; (2) to gain credibility these ads referenced to price-comparison surveys which were frequently conducted by the media; (3) the use of media-based ads increased during weeks in which prices declined; (4) price-comparison websites that became available were hardly accessed by consumers. Our findings highlight the importance of the media in facilitating informative advertising, and the role of advertising in promoting competition. JEL: D83; L81; L66 Keywords: price advertising; consumer search; uniform pricing; multiproduct firms * Itai Ater is an associate professor of economics and strategy at the Coller school of management, Tel Aviv University. Oren Rigbi is a senior lecturer in the department of economics at Ben-Gurion University. We benefited from comments and suggestions of participants in several seminars and from the excellent help of the following research assistants: Amos Nitka, Jacques Cohen, Itamar Popliker, Dana Chap, Niv Malach, Daniel Padon, Or Avishay Rizi and Dor Lavie. Financial support by the Eli Hurvitz Institute of Strategic Management, Falk Institute for Economic Research, the Henry Crown Institute, the Coller Foundation and the Israeli Science Foundation (grant no. 568/17) are greatly acknowledged. Comments are welcome at [email protected] and [email protected] 1
Transcript of Price Transparency, Media and Informative Advertising transparency and informative... · Price...

Price Transparency, Media and Informative Advertising∗
Itai Ater§ and Oren Rigbi†
§Tel Aviv University and CEPR
†Ben Gurion University, Israel Antitrust Authority and CESifo
May 23, 2019
Abstract
We study the effects of a regulation that required Israeli supermarkets to post online
the prices of all items sold in their brick-and-mortar stores. Using a differences-in-differences
research design and multiple complementary control groups, we show that prices have declined
by 4% to 5% after the regulation, primarily in premium chains. Price dispersion has also
dropped as chains adopted a uniform pricing strategy, setting similar prices across same-chain
stores. To uncover the underlying mechanisms, we test predictions based on Robert and Stahl
(1993). Consistent with these predictions we find that following the transparency regulation:
(1) hard-discount chains extensively used ads stressing their low prices; (2) to gain credibility
these ads referenced to price-comparison surveys which were frequently conducted by the
media; (3) the use of media-based ads increased during weeks in which prices declined; (4)
price-comparison websites that became available were hardly accessed by consumers. Our
findings highlight the importance of the media in facilitating informative advertising, and the
role of advertising in promoting competition.
JEL: D83; L81; L66
Keywords: price advertising; consumer search; uniform pricing; multiproduct firms
∗Itai Ater is an associate professor of economics and strategy at the Coller school of management, Tel Aviv
University. Oren Rigbi is a senior lecturer in the department of economics at Ben-Gurion University. We benefited
from comments and suggestions of participants in several seminars and from the excellent help of the following
research assistants: Amos Nitka, Jacques Cohen, Itamar Popliker, Dana Chap, Niv Malach, Daniel Padon, Or
Avishay Rizi and Dor Lavie. Financial support by the Eli Hurvitz Institute of Strategic Management, Falk Institute
for Economic Research, the Henry Crown Institute, the Coller Foundation and the Israeli Science Foundation (grant
no. 568/17) are greatly acknowledged. Comments are welcome at [email protected] and [email protected]
1

1 Introduction
Information is an essential ingredient of efficient markets and perfect competition. In recent years,
lawmakers aiming to reduce prices in different markets have introduced price transparency regula-
tions that require firms to disclose their prices online. Such regulations typically take advantage of
the Internet as an effective, cheap means to disseminate price information. For instance, gasoline
prices in Germany, Italy, Australia, South Korea and Chile are now available online. Attempts
to curb health costs have also triggered regulations that require health care providers to disclose
online price information.1 In Argentina, Uruguay and Mexico, governments require food retailers
to post online the prices of many of the products that they sell.2 Despite the growing popularity
of price transparency regulations, little is known on their effects on market equilibrium outcomes,
such as price levels, price dispersion and advertising choices. Given that sales in brick-and-mortar
markets still account for about 85-90% of retail sales,3 one can expect that the adoption of on-
line price transparency regulations will further expand, making the study of the effects of such
regulations of interest to consumers, firms, and policy-makers alike.
In this paper, we begin to fill these gaps by studying the impact of a price transparency reg-
ulation in the Israeli food retail industry. The food retail industry is a meaningful domain in
which to begin unpacking the economic effects of price transparency regulations. First, consumers
spend about one-sixth of their disposable income on food, making the potential welfare impact of
such regulation considerably large. Second, analyzing choices by firms that sell thousands of prod-
ucts, like supermarkets, can be interesting from a theoretical perspective, especially since standard
theoretical models of consumer search and firm advertising consider single-product settings,
In 2011, social protests in Israel regarding, among other concerns, the high prices of food
ultimately culminated in the legislation of the Food Act in March 2014. According to the Food
Act, supermarket chains were required starting in May 2015 to post online the prices of each and
every item sold in their stores and to update these prices continuously. Independent websites
began to offer consumers free price comparison services shortly after. We take advantage of these
changes to study the impact of marketwide information on food prices, and to characterize the post-
transparency equilibrium. In doing so, we illustrate how pricing, advertising and consumer search
choices are linked and can be explained based on the equilibrium framework developed by Robert1In the US, www.wsj.com/articles/white-house-pushes-for-more-transparency-on-health-care-prices-11557945220
and worldwide, www.economist.com/business/2019/05/21/the-global-battle-over-high-drug-prices?cid1=cust/dailypicks/n/bl/n/20190521n/owned/n/n/dailypicks/n/n/NA/243352/n.
2In 2015, the Argentinian government forced retailers to submit daily prices for a basket of goods to be postedon a website that allows consumers to compare prices (see https://www.preciosclaros.gob.ar).
3According to the US Census Bureau, sales from e-commerce for U.S. retailers were $ 389.1 billion in 2016 -up 14.4 percent from $340.2 billion in 2015 - overall accounting for 8% of total retail sales. https://www.census.gov/content/dam/Census/library/publications/2018/econ/e16-estats.pdf In the UK, e-commerce turnover in2017 was 15.6 billion Eur - 13.65% increase from 2016 - overall accounting for 16.4% of total retail sales. See,https://ecommercenews.eu/ecommerce-in-uk-grew-to-e15-6-billion-in-2017/.
2

and Stahl (1993). To the best of our knowledge, this is the first study that uses an equilibrium
framework to explain how firms and markets respond to changes in advertising and search costs.
Obtaining better understanding how price transparency, advertising and search interact, and jointly
determine equilibrium outcomes is essential for the design of information-enhancing policies.
Any attempt to reliably identify the impact of transparency on prices must overcome several
challenges. First, it is necessary to obtain price data corresponding to the period before the change
in transparency, a period for which such data might not be readily available. A second challenge is
to control for additional factors, aside from transparency, that might affect pricing decisions (e.g.,
local competition, costs, seasonality). Because these factors may change over time, it is inherently
difficult to attribute changes in prices to a change in transparency over a given time period. Our
research design enables us to address these concerns. To address the first challenge, we exploited
the fact that the transparency regulation went into effect more than a year after it passed in the
parliament, and hired a survey firm to collect prices in physical stores over the course of that year.
The price data were collected at several points in time and covered multiple items sold in multiple
stores and chains throughout Israel. For the period after the regulation went into effect (the post-
transparency period), we collected data from one of the price comparison platforms that began to
operate after the transparency regulation became effective. To address the second, and perhaps
more concerning challenge, we rely on several distinct complementary control groups which enable
us to identify the effects of the transparency regulation. That is, the identification comes from
comparing changes in prices of “treatment” items whose prices became transparent only after the
regulation, against price changes in four distinct control groups, as follows.
The first control group consists of the same products included in the treatment group, but sold
in the online channels of the supermarket chains whose products are used in the analysis. These
items constitute a useful control group because their prices were transparent both before and after
the transparency regulation became effective. The second control group consists of products that
are sold in traditional stores and do not overlap with the products in our treatment group and
whose prices are periodically collected by the Israeli Consumer Council (ICC). The prices of these
products are often cited in the media and mentioned in chains’ ad campaigns as a reliable source
of price data. Thus, effectively, the ICC products constitute a set of items whose prices were
transparent before and after the transparency regulation went into effect. The third and fourth
control groups consist of products that overlap with the items in the treatment group, but are
sold in stores that were exempt from the transparency regulation: drugstores and mom-and-pop
grocery stores, respectively. Although each of the control groups might be subject to critique,
they complement one another, such that when taken together, they enable us to rule out many
alternative explanations for any effects observed. Notably, our analyses yield consistent results
3

across the four control groups, giving us confidence that the results indeed reflect the impact of
transparency on prices.
Our first set of results concerns the impact of transparency on price dispersion. We show that
prices within chains were diverse before the regulation, and that after prices became transparent
price dispersion dropped. In particular, we show that the drop in price dispersion was driven by
supermarket chains’ decision to adopt a uniform pricing strategy, setting identical prices across the
stores affiliated with a single chain. Figure 1 presents a time series of the average number of distinct
prices per item in the treatment group and for the first and second control groups, i.e., items that
were sold through chains’ online channels, and items in the ICC basket. According to the figure,
before the transparency regulation came into effect, the average number of distinct prices in each
of the two control groups was smaller than the number of distinct prices in the treatment group.
Quickly after the regulation went into effect, the differences between the treatment and the control
groups diminished. As we elaborate in Section 4.2 we claim that the decision to adopt uniform
pricing was driven by fairness or brand-image concerns, that were exacerbated once consumers
could easily observe the prices of similar items sold at different stores of the same chain. Next, we
examine the impact of transparency on price levels. Our results indicate that after the regulation
took effect, prices of items in the treatment group decreased 4 to 5 percent more than did the
prices of items in the various control groups. We also find that prices primarily decreased among
chains that were more expensive and in supermarkets that faced weaker local competition.4
The empirical findings regarding price levels and price dispersion suggest that the availability
of information facilitated by the transparency regulation was driving these changes. To uncover
the particular mechanisms through which information reached the market, we rely on the model
by Robert and Stahl (1993), who were the first to incorporate both price advertising and optimal
consumer search into one theoretical framework. Robert and Stahl characterize a unique price-
dispersion equilibrium in which a firm either charges high price that is not advertised, or sets a
lower price that is advertised. They further show that advertising will increase during periods in
which prices are set lower, and that in equilibrium consumers do not engage in search. To test these
predictions, we use detailed advertising data which includes, inter alia, the specific content of each
ad, the advertiser identity and the cost of each ad. We show that after prices became transparent,
hard-discount supermarket chains spent considerably more resources on ads that highlighted their
low prices, while other chains did not. In particular, we show that ads by hard-discount chains
specifically referenced to price-comparison surveys which were extensively conducted by the media
after the regulation. The media was conducting more price-comparison surveys after the regulation4In Online Appendix 1 we present additional results based on the heterogeneity analysis for the effect of trans-
parency. For instance, we find that prices of branded products fell more than private-label products, and that pricesof popular and cheaper goods fell less.
4

because the cost of implementing such surveys has fallen dramatically in light of the regulation.
Thus, hard-discount chains used price-surveys by the media to provide consumers with credible
information about prices. We also provide support to the other predictions of Robert and Stahl
(1993). We show that the use of media-based ads increased when prices decreased, and consumer
usage of the freely available price-comparison websites is limited. Thus, our findings indicate
that firm advertising was a key factor facilitating the more competitive environment in the post-
transparency period.
In his seminal paper, "The Economics of Information", Stigler (1961) highlighted consumer
search and firm advertising as two channels through which consumers obtain price information.
Subsequently, large literatures emerged on both consumer search and firm advertising 5 The rise of
the Internet and e-commerce provided researchers a unique opportunity to test the role of consumer
search. Somewhat surprisingly, this massive research effort ignored the second channel highlighted
by Stigler – that firms themselves could take advantage of the readily available information and
through advertising provide it to consumers.6 Our paper addresses this gap in the literature and
offers several contributions. First, we contribute to the advertising literature by illustrating how
supply-side incentives of advertisers change as prices become transparent, or alternatively when
the cost of informative advertising falls. In their survey, DellaVigna and Gentzkow (2010) mention
there are only two studies (Glazer (1981), Milyo and Waldfoegel (1999)) that exploit inter-temporal
variation in the cost of advertising to examine its impact on prices.7 Our study adds to this small
set of papers using a considerably larger set of products, and being able to better address concerns
regarding the selection of products being advertised. Perhaps more importantly, to the best of our
knowledge, we are the first that use an equilibrium framework to examine how market outcomes
change following the change in the cost of advertising. We are also the first to consider both both
the role of firm advertising and consumer search as two interrelated channels through which prices
are determined in equilibrium.
Second, our findings are valuable to understanding the effects of mandatory price disclosures,
which various countries have either adopted or consider to adopt. The outcome of such regulations
is ex-ante not clear given that transparency may also help firms to monitor their rivals’ prices and
facilitate tacit collusion (e.g., Green and Porter (1984), Rotemberg and Saloner (1986), Campbell
et al. (2005)). Furthermore, unlike the vast literature on voluntary price disclosure, typically
in online markets (e.g., Brown and Goolsbee (2002). Brynjolfsson and Smith (2000) and the5Related surveys are: Baye et al. (2006), Anderson and Renault (2016) for search; and Bagwell (2007) and
Renault (2015) for advertising.6In fact, recent papers have emphasized ways that firms can manipulate online information, trying to increase
consumer search costs. For instance, Ellison and Ellison (2009), Spiegler (2011). Allender et al. (2018).7Milyo and Waldfoegel (1999) investigate how removing a ban on advertising prices of alcohol products affected
prices. Glazer (1981) exploit a 1978 newspaper strike in New York which limited the availability of ads to examinethe effect on food prices. More recently, Dubois et al. (2017) develop a structural model to analyze the effects ofbanning advertising for potato chips, though without exploiting actual variation in the cost of advertising.
5

survey by Goldfarb and Tucker (2019)), very few studies examine the impact of mandatory price
disclosure. The distinction between voluntary and mandatory disclosure is important because
selection concerns regarding the decision to disclose prices, or which retailers decide to disclose their
prices can potentially bias the results. The few previous studies that examine the effect of price
transparency regulations focused on the gasoline markets, where retailers sell a single homogeneous
good. In particular, Luco (2019) uses price data before and after a price transparency regulation
required firms to post prices online. He finds that gasoline prices in Chile have increased after prices
become transparent, and obtains inconclusive evidence regarding price dispersion.8 In contrast to
these studies, this paper studies a marketwide online transparency regulation in the supermarket
industry, an industry that firms are typically larger than gasoline stations, advertise more, and
sell thousands of products. Our results on both price dispersion and price levels are different from
the results in the gasoline market, and we also highlight the role of advertising and the media as
important information channels.
Third, study adds to the media literature showing how it used by firms to gain credibility for
their ads, and how such decisions affect equilibrium prices. The importance of the media as a
reliable aggregator of data is likely more important for multi-product firms which cannot advertise
the prices of all the items that they sell.9 Furthermore, our findings that retailers use media
reports as a credible information source speak to the persuasive role of the media (DellaVigna
and Gentzkow (2010)). Fourth, recent research (e.g., DellaVigna and Gentzkow (Forthcoming),
Cavallo (2018)) has been exploring the prevalence of uniform pricing in various retail markets,
trying to explain why retailers prefer it over price discriminating across locations, as standard
theory predicts. Our findings, showing that retailers moved to setting similar prices in all stores
affiliated with the same chain shortly after prices became transparent, suggest that brand-image
concerns are likely driving this decision. Finally, recent studies in the macroeconomic literature
have explored the potential relationship between online markets and the frequency and magnitude
of price changes in traditional markets (Cavallo (2017), Gorodnichenko et al. (2018), Goolsbee and
Klenow (2018), Cavallo (2018)). One conjecture discussed in these papers is that the combination
of uniform pricing and the availability of online prices have contributed to low levels of inflation in
recent years in the US. Our findings offer the first evidence for a causal link between online price
transparency and price levels.10
8Two other studies that we are aware of that examine impact of transparency regulation in the retail gasolinemarket are: Rossi and Chintagunta (2016) who study the impact of mandatory highway signs on gasoline prices inItaly, and Montag and Winter (2019) who investigate the gasoline price transparency regulation in Germany. Alsorelated are Byrne and De Roos (2019) who use price data from a post-transparency period to study how gasolinestations coordinate their prices, Brown (Forthcoming) who study how the introduction of a website the reportsprices of medical imaging procedures in New Hampshire affects prices, and Albek et al. (1997) who use wholesalepost-transparency prices to study how prices of ready-mixed concrete changed.
9Loss leader pricing is another means to address such difficulties (e.g., Lal and Matutes (1994), Ellison (2005)).10Our study is also related to studies on the retail industry in general (Basker (2016), Hitsch et al. (2017)) and in
the supermarket industry in Israel and elsewhere (e.g., Hendel et al. (2017), Eizenberg et al. (2017), Matsa (2011),Pozzi (2013)).
6

The remainder of the paper is organized as follows. In Section 2 we provide the necessary
background on the Israeli food retail market. In Section 3 we discuss the data that we use, the
empirical methodology and the estimation results concerning prices. In Section 4 we derive testable
predictions for the mechanisms underlying our results and subsequently test these predictions. In
Section 5 we present robustness results. Section 6 concludes.
2 Institutional Background
The average household expenditure on food items in Israel in 2015 accounts for 16.3% of disposable
income.11 The Israeli retail food market is considered quite concentrated and was ranked 7th
among OECD countries according to the CR3 criterion (OECD (2013)). Herein we consider five
large Israeli supermarket chains. Shufersal, the largest chain in the country, operated 283 stores at
the end of 2014, and Mega, the second largest chain, operated 197 stores at the end of 2014. The
other chains we consider operated fewer stores at the end of 2014: Rami Levy, a hard-discount
chain, operated 27 large stores; Victory operated 28 stores and Yeinot Bitan operated 67 stores.
We selected these supermarket chains because of their substantial collective market share, 63% of
supermarkets sales in 2011, and because each of these chains also offers an online grocery service
(prices in the online segment are one of the control groups that we use). Online grocery sales
in Israel are growing but still account for only a small share of total food sales, about 3% in
the relevant period. In addition, sales of private label items are growing but still account for a
relatively small fraction of total grocery sales in the Israeli food market, about 5% in 2014.12 The
Israeli Antitrust law was enforced rather strictly over the relevant time period. For instance, in
2013 Shufersal’s CEO was sentenced for 2 months jail time for violating terms set by the antitrust
authority for not-blocking a merger in 2005 between two supermarket chains.13
Food prices in Israel had been rising fast between 2005 and 2011.14 A main driver for the
rise in prices was a worldwide increase in commodity prices. However, other factors, such as
increased concentration among food retailers and suppliers and removal of price regulations, also
contributed to this trend. The steep rise in prices was a main driver behind the social protests that
took place in Israel in the summer of 2011 (Hendel et al. (2017)). It is often said that, following
the social protests, Israeli consumers became more price-conscious and more likely to search for11http://www.cbs.gov.il/statistical/mb158h.pdf12The market description relies on various sources, such as financial reports, reports by government agen-
cies and media coverage. For instance, see the Analysis by the Ministry of Finance of prices in the Is-raeli retail food: https://mof.gov.il/chiefecon/economyandresearch/doclib/skiracalcalit_20180429.pdf andhttps://www.storenext.co.il/wp-content/uploads/2016/01/Summary-of-2015-English.pdf.
13https://en.globes.co.il/en/article-1000536001.14According to the Kedmi Committee report, the cumulative annual growth rate of food prices between was 5%,
compared with 2.1% increase for the period January 2000 to September 2005, and compared with 3.2% in OECDcountries for the same period. See page 8 in http://economy.gov.il/publications/publications/documents/kedmireport2012.pdf.
7
low-priced items. One measure that likely captures the change in the competitive food retail
landscape before and after the social protests is the gross profits of the two largest supermarket
chains, Shufersal and Mega. In the second quarter of 2011, before the summer protests, the gross
profit percentages of Shufersal and Mega were 26.6 percent and 27.5 percent, respectively. In
contrast, in the second quarter of 2014, the two chains’ gross profit percentages fell to 23 percent
and 24.9 percent, respectively. Moreover, during the same time period, the hard-discount chains
were able to increase their market shares. Following the change in the competitive landscape and
other managerial issues, Mega, the second largest chain, faced profound financial difficulties. In
June 2016, towards the end of our sample (i.e., July 2016), the Israeli antitrust authority allowed
Yeinot Bitan, another large chain, to purchase Mega. A direct consequence of Israel’s 2011 social
protests was the formation of a special committee on food prices (the Kedmi Committee). Following
the recommendations of the committee and a long legislation process, in March 2014 the Israeli
parliament passed the “Food Act”. A primary component of the new legislation was a transparency
clause requiring each chain to upload real-time price information on all products sold in all its stores
to a publicly available database.15
During the legislation process of the transparency regulation and soon afterwards, managers
of supermarket chains, politicians, and academics voiced concerns regarding the effectiveness of
the new regulation. The head of the economic committee in the Israeli parliament, MP Professor
Avishay Braverman remarked “I am not convinced that transparency will result in good news.
I hope that prices will go down in the process, though I doubt it and hope to be wrong.“16
In an op-ed, Prof. Yossi Spiegel called on the government “to reconsider the mass experiment
that consumers are subjected to.”17 Perhaps more surprising was that supermarket chains also
opposed the transparency regulation on the ground that it may help chains coordinate prices at
the detriment of consumers. For instance, Itzik Aberkohen, the CEO of Shufersal said that “there
is a concern that transparent prices will be used as a platform to coordinate prices under the law”.
Likewise, Eyal Ravid, CEO of Victory argued that online transparency would facilitate collusion.18
On May 20, 2015, the transparency clause went into effect, and retailers began uploading
price data to dedicated websites. Given that the raw price data uploaded by each chain were15The regulation requires each supermarket chain to upload to a designated website files containing informa-
tion about prices and promotions for each product sold in each store. The files are updated on a daily basis ifno price changes have occurred, and within an hour if a price change has occurred during the day. The Min-istry of Economy and Industry lists on its website links to the designated website of each of the chains. See,http://economy.gov.il/Trade/ConsumerProtection/Pages/PriceTransparencyRegulations.aspx. In the OnlineAppendix, we added a translation of the transparency regulations, detailing the structure and the updatingprotocols of each file that the chains need to submit. The Israeli Food Law has two additional components.These components came into effect in January 2015, several months before the transparency regulation. Giventhe different timing of these changes and the control groups that we use, we do not think that these changespose a threat to our identification. Foe more details on the Food Law see https://www.fas.usda.gov/data/israel-tel-aviv-tidbits-development-israel-s-agriculture-and-food-sector-2
16See http://www.globes.co.il/news/article.aspx?did=1000921890. Interestingly, in his academic career,Braverman published an important study on consumer search (Braverman (1980)).
17See http://www.themarker.com/opinion/1.2506245.18https://www.themarker.com/markerweek/1.2288058.
8

not easy to use, independent websites began making the data more accessible to consumers.
During August 2015, websites began providing “beta“ versions of price comparison services for
food items sold in brick-and-mortar retail food stores across Israel. Information from personal
communications indicates that food retailers and suppliers also obtained data from these web-
sites. As of 2016, three websites offered food price comparison services: MySupermarket.co.il,
Pricez.co.il and Zapmarket.co.il. Figures 1 and 2 in the online Appendix present photos
taken from Mysupermarket.co.il. Figure 1 shows a price comparison of a single item and Figure
2 shows a price comparison of a basket consisting of 42 items. The different websites offer visitors
several features such as the option to follow a fixed grocery list and use the same address when they
return to the website. Despite initial hopes, however, these websites failed to attract considerable
traffic.
3 Data, Empirical Strategy and Results
Identifying causal effects of transparency on prices is a challenging task for several reasons. First,
such an endeavor requires an exogenous shock to the level of transparency. In the absence of such
a shock, it would be difficult to argue that a change in transparency is the source of observed price
changes. Furthermore, if price transparency is endogenously determined by firms, then selection
is another valid concern. That is, the firms that choose to advertise their prices, and the products
they choose to advertise may not be representative of all firms or all products. This selection
issue is likely to bias the analysis of the effect of transparency. Second, given that an exogenous
shock to transparency has taken place, identifying the impact of this shock requires data from both
before and after the regulation. Collecting post-transparency data is likely to be straightforward;
however, obtaining data from a period in which such information was not readily available is likely
to be more complex. Third, pricing decisions take into account various factors, such as cost, local
competition and seasonality. These factors may very well change alongside changes in transparency.
Thus, to identify the impact of transparency on prices one needs to account for potential changes
in other determinants of pricing decisions that might have taken place concurrently with the
implementation of the transparency regulation. Finally, supermarkets offer a challenging setting
for the study of pricing decisions, as they sell thousands of items, which may all be subject to
different pricing considerations. Accordingly, to obtain a reasonable estimate of the overall impact
of transparency on prices, it is necessary to investigate a large sample of items. Our data and
differences-in-differences research design, discussed in detail below, offer a unique opportunity to
address these empirical challenges.
In what follows we discuss the various sources for the price data used for the treatment group
9

and the control groups. We also discuss the limitations of these control groups and how, we think,
the use of multiple control groups mitigates these concerns. After describing the data, we provide
additional details on the estimation and sources of identification.
3.1 Data and descriptive statistics
We collected price data for a treatment group of products, as well as for four control groups of
products. We supplemented these price data with rich post-transparency data that correspond to
a larger array of products and stores, in addition to data on local competition and on products’
characteristics. These data will be primarily used to examine the effects of transparency on price
dispersion and price levels. After describing the price data, we discuss the data sources on adver-
tising expenditures and on usage of the price-comparison websites, which we use in subsection 4.1
to examine the potential channels underlying our results.
3.1.1 Price data
Treatment group: The treatment group comprises 69 products sold in 61 stores located in 27
different cities and operated by the 5 supermarkets chains under consideration. Figure 3 in the
Online Appendix shows the locations of these stores across Israel. The products in the treatment
group belong to several product categories (e.g., dairy products, drinks, prepared meals, household
cleaning, health and beauty) and different price levels. We did not include meat and produce items
in the treatment group because the quality of these goods might differ considerably across stores.
Our reliance on a large set of items and stores mitigates concerns that the price changes are driven
by unobserved local trends or changes that are relevant to specific type of products. During the
pre-transparency period, we used a market survey firm to collect the prices of these items. The
data collection by the market survey firm was carried out during the last week of the following 8
months: July, August, September, October and December 2014, and February, March and April
2015. Post-transparency prices for these products and stores were obtained on a weekly basis from
one of the price comparison websites.19
Figure 2 presents a time series of the average basket price for each of the five supermarket
chains in our data, for the year prior to the regulation and in the year after. As can be observed
in the figure, there is a declining trend in prices. In addition, chains’ average prices seem to have
converged after prices became transparent. The figure can also be used to rank the five chains
according to basket price. The prices of the basket at the two largest chains: Mega and Shufersal
are higher than at the other chains; in particular, the basket price at Rami Levy, the hard-discount19A potential concern with the data that we use is that we rely on two different data sources for the pre and the
post periods. In Section 5.1 we address this concern. For instance, we rely on data from the Israeli Census (CBS)for the pre- and post- time periods and show that our results are qualitatively similar.
10
chain, is the cheapest. The patterns observed in the figure might be driven by other factors besides
price transparency. To take these factors into account, we collected data on four control groups of
products described below.
Control group 1: products sold online. The first control group relies on the fact that each of the
chains we consider also offers an online retail service. The prices of products available through these
online channels were transparent both before and after the transparency regulation. Unlike prices
at brick-and-mortar stores, which were typically determined locally and varied across stores (even
within a single chain), prices of items sold online are determined at the national level and are not
dependent on the customer’s location. Since July 2014 we have been collecting on a weekly basis
the prices of all the items included in the treatment group but sold online through the websites
of each of the five grocery chains. The prices were collected from an online platform that allowed
consumers to compare and purchase grocery items from the various chains that offered an online
grocery service. Figure 4 in the Online Appendix shows a screenshot from the online platform,
where consumers can compare and choose among the online retailers. Figure 3 presents a time
series of the total price of a basket of items in the treatment group and a time series of a basket
of items sold online, starting in July 2014 and ending in July 2016; each data point represents the
average across all stores in the respective group. The figure reveals that prices online are generally
cheaper than the prices of the same items sold in brick-and-mortar stores. Importantly, we also see
that the price gap between online and traditional stores diminished after May 2015, when prices
in traditional stores became transparent.
Control group 2: ICC products. This control group comprises 38 products sold in hundreds of
stores throughout Israel, whose prices are collected by the ICC, the largest consumer organization
in Israel. These products do not overlap with the products in our treatment group. We obtained
the ICC’s monthly reports of the products’ prices for the period between July 2014 and July
2015, and for the post-transparency period we obtain the price data from the price comparison
website. Importantly, the 61 treatment-group supermarkets, i.e. the stores where the market
survey firm visited, are a subset of the stores from which the ICC collected the price data. The
prices of the products in the ICC basket are frequently cited in media reports informing consumers
about the prices of food items. For instance, a TV program called “Saving Plan”, one of the top-
rated programs in Israel, devoted a weekly segment to updating the public about the ICC’s price
collection and comparison initiative. In addition to the media reports, supermarket chains often
mentioned the ICC reports as a credible reference point when advertising their own low prices.
Mega, the second-largest supermarket chain, dedicated about 40% of its advertising budget in 2014
to ads mentioning the ICC price comparison initiative. Finally, the ICC website offered a weekly
comparison of basket prices across the stores visited. Accordingly, it is reasonable to assume that
11

supermarket chains and consumers are well aware of the price of items collected by the ICC, or
in other words, that the prices of these items were already transparent before the regulation went
into effect.20 Figure 4 presents a time series of six items from the treatment group and a time
series of six comparable items from the control group 2. In other words, each product in one group
has a close substitute in the other group. For instance, a 200- gram jar of Nescafé Taster’s Choice
instant coffee, included in the ICC group, is matched to a 200- gram jar of Jacobs Kronung Coffee
(another quality brand of instant coffee), included in the treatment group. Similarly, we match a
700- ml bottle of Hawaii shampoo in the ICC group to a 700-ml bottle of Crema Nourishing Cream
Wash in the treatment group.21 In this figure, we observe that pre-transparency prices of products
in the control group ICC and in the treatment behave quite similarly. Furthermore, after prices
became transparent, prices of items in the treatment group declined substantially more than did
the items in the ICC group.
Control group 3: products sold at Super-Pharm. The third control group comprises 28 products
sold at 32 stores affiliated with Super-Pharm, the largest drugstore chain in Israel. These items
provide a useful control group because drugstore chains were exempt from the Food Act and were
not available for sale online.22 The prices at Super-Pharm stores were collected by our RAs at two
points before the transparency regulation law came into effect — in late October 2014 and in late
April 2015— and at two points in the post-transparency period — in late October 2015 and in late
April 2016. Given that drugstores do not sell the full array of products sold in supermarkets, we
do not have full overlap between items in the treatment group and the items in the Super-Pharm
control group.
Control group 4: products sold in small grocery stores. Our fourth control group includes 12
products, whose prices were collected by the Central Bureau of Statistics from both mom-and-pop
grocery stores and supermarkets across Israel; the mom-and-pop grocery stores, like drugstores,
were not subject to the transparency regulation. Given the small number of items in the latter
group, unavailable information (e.g., on the identity of the specific supermarket chain in which
the products were sold at, advertising expenditures, and the week during the month in which the
prices were collected) and confidentiality concerns, we cannot use this group in all of our analyses.
Thus, we present results corresponding to this control group only in the robustness section. Table
1 presents summary statistics for the number of products and observations in the treatment group
and in the first three control groups. Table XX in Online Appendix 2 provides more details on the20More details on the items in the ICC control group are described in Ater and Gerlitz (2017). We found further
suggestive evidence that the ICC basket prices can serve as a reasonable transparent control group when we examinethe change in the ICC basket price after the ICC began collecting the prices of these items. In particular, the priceof the basket of ICC items declined substantially few months after the ICC began collecting and advertising theseprices. See Figure 5 in the Online Appendix.
21The choice of these pairs also follows from a more systematic measure of distance across product characteristics.22Starting in July 2017, drugstore chains also became subject to the transparency regulation. In Table 1 of Online
Appendix 2 we present regression results demonstrating that prices at Super-Pharm declined soon after its pricesbecame transparent.
12

products associated with the treatment and each of the control groups.
Additional data for the price analyses. Most of our analyses rely on the data collected for the
treatment and control groups, as elaborated above. After the transparency regulation went into
effect, the price collection became less cumbersome; therefore, for this period, we were able to obtain
from a price comparison website more expansive and finer-grained data for further investigation.
Specifically, we use weekly reports on the prices of nearly 355 products sold in 589 stores of
the 5 chains, including the chains’ online stores. The 355 products include the treatment group
products and other items, such as private-label goods. In addition to obtaining price data, we
also constructed measures of local competition. These measures are based on the number of
supermarkets operated by rival chains within a certain distance of a given store.
3.1.2 Advertising and Price-comparison websites data
We use the following data on advertising and access to the price comparison websites to explore
the roles of firm advertising and consumer search in driving the changes in prices.
Advertising data. To explore the relationship between advertising and prices, we collected ad-
level data for the five supermarket chains in our data. These data, collected from ‘Ifat‘, the leading
Israeli company for tracking and monitoring advertising, contain detailed data on advertising
content and expenditures for the time period from July 2014 to June 2016. For each ad, we
have the following information: the name of the ad campaign, the advertising retail chain; the
date that the ad was posted; media channel used (e.g., television, newspapers, radio, Internet), a
classification of the ad into promotion/image classification, the expenditure on each ad based on
list prices, and the ad itself. We further viewed all the ads and classified the ads based on whether
they include a reference to media coverage, particularly price surveys carried by a media outlet.
We define such ads as “media-based” ads. Figures 5 and 6 contain examples of newspaper ads that
refer to specific price comparison surveys conducted by the media. Figure 6 in Online Appendix
2 includes an example of a promotional ad, yet one that does not mention any particular media
source.
Price comparison websites data. To examine the usage of the price-comparison websites we
obtained from Similarweb, a digital market intelligence company, data on the number of viewers and
the total number of pages viewed on each of the three websites that were offering price comparison
services during the relevant time period (MySupermarket.co.il, Pricez.co.il and ZapMarket.co.il).
These data, at the monthly level, cover the time period from July 2014 to July 2016. Data on the
number of visitors are available for MySupermarket and for Pricez also in the pre-transparency
period, because MySupermarket’s main business is in the online grocery segment, and Pricez offered
a price comparison service based on consumer reports.
13
3.2 Empirical strategy
The graphical illustration presented in figures 3 and 4 suggests that the mandatory disclosure of
prices resulted in lower prices. Nevertheless, the figures do not account for time and item specific
changes that may have occurred over the relevant time period. In this section, we elaborate on
our identification strategy, which enables us to argue why these preliminary findings indeed reflect
the effects of price transparency. To identify the effect of transparency, we compare the price
changes in the treatment group before and after the regulation took effect, with the corresponding
changes in each of the control groups. A significant difference between a change in the treatment
group and a change in the control group can potentially be attributed to the effect of transparency.
Importantly, while concerns can be raised regarding the validity of each of the control groups, the
use of the other control groups helps to mitigate these concerns. For instance, a difference between
the treatment group and control group 1 (i.e., the online channel) might actually be a result of an
unobserved change that took place in the online segment at the time the transparency regulation
took effect. Control group 2 — comprising the ICC items that were sold in the same traditional
store as items in the treatment group — is not vulnerable to this concern. Similarly, a difference
between control group 2 (ICC products) and the treatment group — which includes different
products — might be related to intertemporal changes in the marginal costs of the products that
the two groups contain, rather than to changes in transparency. Control groups 1, 3 and 4 are not
susceptible to this concern, as they contain the same items as the treatment group. Finally, one
might be concerned that our results using control group 3 (drugstore prices) are biased because
the transparency regulation changed the level of competition between supermarket chains and
drugstores. Yet, using control group 2 which focuses on different items sold in the same store
is less vulnerable to this concern. In the robustness section we present additional findings that
further show that such concerns are unlikely to affect our results. More generally, the use of
different control groups, and the fact that we obtain similar results using these alternative control
groups, provides confidence that our estimates are indeed driven by the transparency regulation
rather than by other changes in the market.
3.2.1 Price dispersion
Our first specification focuses on the relationship between transparency and price dispersion. To
capture changes in price dispersion, we aggregate the price-store-date data to the product-date
level and in some specifications to the product-chain-date level. We use three measures of price
dispersion: the number of distinct prices that a given product i is sold for in a given period t, the
coefficient of variation of a given product i in a given time period t, and the percentage price range
of a given product i in a given time period t. In each regression, we compare the treatment group
14
to a single control group. Formally, we estimate the following equation:
yit = µi + γt + β ×Aftert × Treatmentit + εit (1)
where the dependent variable is one of the three measures of price dispersion. The After indicator
equals one if the time period t in which the product’s prices were collected is after May 2015 (when
the transparency regulation took effect), and zero otherwise. The Treatment indicator takes the
value of one for observations in the treatment group, and zero for observations in the control group.
The equation also includes fixed effects for the product and for the time period in which the prices
were collected. The product fixed effects capture time-invariant characteristics of each item, such
as its mean cost of production. The time period fixed effects capture the impact of seasonality on
pricing and other regulatory changes that might have affected chains’ costs and pricing decisions.
We also accommodate the possibility of pricing trends that may vary across items by incorporating
linear product-specific time trends. Standard errors are clustered at the product level. In some
specifications, we verify that the results are similar if we add the number of times that a price
of a certain product was recorded in each period s a control variable. The coefficient of interest,
β captures the change in price dispersion in the treatment group of items after prices became
transparent relative to the corresponding change in dispersion in the control group.
3.2.2 Price levels
We use the following difference-in-differences specification to identify the impact of transparency
on price levels:
log(pist) = µi + ηs + γt + β ×Aftert × Treatmentis + εist (2)
In this specification an observation is a product-store-date tuple, and the dependent variable
is the log(price) of product i sold in store s in week t. To control for other factors that potentially
affect prices we also include time period (γt), store (ηs) and item (µi) fixed effects. The weekly fixed
effects capture the impact of seasonality on pricing and other regulatory changes that might have
affected chains’ costs and pricing decisions. For instance, the value-added tax in Israel dropped
from 18 to 17 percent in October 2015 and the minimum wage in Israel increased in April 2016.
These changes have likely affected retail chains’ pricing decisions. Yet, such an effect on pricing
should be captured by the week fixed effects. The store fixed effects capture time-invariant local
competition conditions and the socio-demographic characteristics of local customers. Note that
the estimation does not separately include a treatment variable as it is subsumed by the other
fixed effects (e.g., the product fixed effects subsume the treatment variable when using the ICC
15

control group and the chain fixed effects subsume the treatment variable when using the drugstore
control group). Finally, we cluster the standard errors at the store level.
The main parameter of interest is β which is the coefficient on the interaction between the
After and the Treatment indicators in equation 2. The identifying assumption is that the only
systematic difference between the control groups and the treatment group is the amount of price-
related information available to consumers before the law took effect. Per our discussion above
regarding the use of the different control groups, and given that the treatment and control groups
contain a substantial number of products in several categories, with overlapping manufacturers
and different retailers, we believe that this is a reasonable assumption.
3.2.3 Additional specifications
We also examine whether transparency affected differently prices in chains or stores facing different
market environments. This is interesting by itself but also, as we elaborate in Section 4.1, one
of the predictions of the model by Robert and Stahl (1993) is that as search costs decline, the
prices at more expensive chains/stores will fall more than in other chains/stores. To do so, we
modify Eq. 2 in two ways. First, we interact the After ∗ Treatment variable in Eq. 2 with a
premium/discount indicator for the type of the supermarket chain (in Online Appendix 2 we repeat
this analysis with a chain-specific interaction term.) Second, we examine how the local market
conditions affected price levels in the wake of the transparency regulation. To do so, we interact
the After ∗ Treatment variable in Eq. 2 with a measure of local competition that we constructed
based on the number of other food retailers operating in the local market. We construct two such
measures. One is a binary variable indicating whether a store’s local environment is characterized
by high versus low competition (i.e., store concentration above versus below the median). The
other is a continuous measure of local competition. Notably, in this analysis we explore whether
stores that are affiliated with the same supermarket chain but face different local competitive
conditions respond differently to the transparency regulation. Thus, we compare pricing decisions
by same-chain brick-and-mortar stores, and therefore only use control group 2 (the ICC basket).
In separate analyses (described in more detail in Online Appendix 1) we also examine whether
price transparency differently affected the price levels of different types of products (e.g., private
label vs. branded products, cheap vs. expensive items and or more vs. less popular items). In
this analysis we rely on the prices of items collected only after the regulation went into effect, and
therefore include a much larger set of items and stores (355 items sold in 589 stores). In particular,
we re-estimate Equation 2 with interaction terms capturing different product characteristics, and
compare price changes of these items to those of a control group comprising the same products
sold online by the same chains, similar to control group 1 in the main analysis.
16
3.3 Estimation results on prices
3.3.1 Price dispersion
The regression results of Equation 1 are shown in Table 2. The table includes the estimates for each
of the three measures of price dispersion: the number of unique prices, the coefficient of variation
and the percentage price range. Each of the three columns includes not only the point estimate
of the parameter of interest but also the average value of the dependent variable. Although the
magnitude of the transparency effect varies across dispersion measures and control groups, the
results indicate that following the transparency regulation had an economically and statistically
significant negative effect on price dispersion. For instance, in columns 1-3 we observe that, after
the transparency regulation went into effect, the number of distinct prices charged for a product
in a given time period decreased by 8 to 16 distinct prices, depending on the control group that
we use. This decrease is quite substantial, given that the average number of distinct prices for a
product in the pre-transparency period was between 16 to 19. In Table 2 in Online Appendix 2, we
present the estimation results of a specification that captures the effect on the number of unique
prices for each of the chains. The table reveals significant effect for each of the chains, suggesting
that no single chain is responsible for the results shown in Table 2.
3.3.2 Price levels
Table 3 presents the regression results of Equation 2, which reflects the effect of mandatory dis-
closure of prices on price levels. The point estimates of the main parameter of interest are roughly
similar across the three control groups and indicate that after the transparency regulation went
into effect prices in traditional supermarkets decreased by 4 to 5 percent relative to the prices in
the control groups.2324
Table 4 presents the point estimates obtained for a modification of Equation 2 that simul-
taneously estimates the transparency effect, once we distinguish between premium and discount
supermarket chains. The regression results illustrate that the reduction in prices attributed to the
transparency regulation took place among the premium chains. For the discount chains we do not
find strong evidence that prices decreased after the transparency regulation went into effect. Table
5 in Online Appendix 1 presents the results when we include a chain-specific interaction variable.
We find that the effect of the transparency was large and negative for the chains that set relatively23We also estimated the same equation using subsets of the treatment group and of control group 2 (the ICC
group), namely the “comparable baskets” of goods discussed above (see Figure 4). We obtain similar qualitativeresults (presented in Table 3 in Online Appendix 2). We also obtain similar estimates when price promotions aretaken into account (see Table 4 in Online Appendix 2).
24Note that the regression analysis assumes equal weights to all the products. As we show in our analysis inOnline Appendix 1, the prices of more popular products have declined less than less popular products. Accordingly,the impact on consumers’ actual spending may have been smaller than the estimates reported in the table.
17

high prices and considerably smaller for the chains that set relatively low prices (see the ranking of
the total basket price, shown in figure 2). Table 5 presents the results of an analysis that explores
whether the effect of transparency on prices depends on the nature of competition a store faces in
the local market. Column 1 presents the results of a specification in which competition is captured
by a binary variable reflecting whether the market in which the focal store is operating is more
(or less) concentrated than the median degree of concentration. Column 2 presents the results of
a second specification, which imposes a linear effect of local market concentration on the effect
of transparency on prices. The regression results suggest that the changes in prices following the
transparency regulation were greater in stores that enjoyed market power in their local market.
This result might be driven by chains’ decision to set similar prices across stores.
Our findings regarding price levels and price dispersion indicate that the increased availability
of price information in the post-transparency period was driving the changes in prices. Yet, the
exact channel through which consumers obtained this information is unclear. In the next section,
we explore the potential mechanisms underlying these results and highlight the important roles
of the media and informative advertising in driving these changes. To do so, we derive testable
predictions based on Robert and Stahl (1993), and subsequently test these predictions. We also
stress that our findings above, that examine how the change in information affect price levels and
price dispersion are also consistent with the predictions of their model.
4 Mechanisms
In this section we examine the role of informative advertising in driving our results, and show how
our findings can be rationalized based on an equilibrium framework. Next, we also discuss why
fairness concerns explain retailers’ decision to adopt a uniform pricing strategy.
4.1 The media, informative advertising and prices
4.1.1 Theoretical framework and testable predictions
Robert and Stahl (1993) were the first to consider optimal consumer search and informative ad-
vertising in one framework.25 They characterize a unique, symmetric price-dispersion equilibrium,
for an environment where firms sell a homogeneous good, consumers are aware of firms’ existence,
and learn about their prices through either costly search or from exposure to ads. Bagwell (2007)
notes that their model fits an established industry, where similar products are sold in different
stores (like the supermarket industry). Although the model considers firms that sell one good25Butters (1977) consider advertising and search in his model, but does not model optimal search. Theoretical
papers that consider both channels are: Janssen and Non (2008), Janssen and Non (2009) Wang (2017), and Boardand Lu (2018). For a simplified version of the model by Robert and Stahl, see Renault (2015).
18

while our setting involves multiproduct firms, as we further explain below we view the media as
an intermediary which can aggregate price information on multiple items into one “representative“
price. In the model, firms simultaneously choose prices and advertising levels, where depending
on the level of advertising chosen endogenously by the firms, some consumers are exposed to ads
(informed consumers) while other are not (uninformed ads). The model generates the following
testable predictions:
Hypothesis 1 (H1): The use of informative advertising will increase as costs of providing it falls.
As we elaborate below, following the transparency regulation the Israeli media covered the topic
of retail food prices comprehensively, reporting price comparison surveys for hundreds of products
and stores. As the media coverage expanded, hard-discount chains (which received favorable media
coverage in these price-surveys) were able to undertake advertising campaigns that mentioned the
price surveys conducted by the media. Thus, the transparency regulation reduced the media’s
cost of covering supermarket prices, and indirectly facilitated the use of informative advertising
by chains. Notably, because supermarkets sell thousands of products in each store, traditional
price advertising can be less effective and consumers may suspiciously view ads for only a subset
of items (Rhodes (2014)). The use of the media as a third-party certifier addresses this concern
and facilitates informative advertising campaigns.
Hypothesis 2 (H2): In equilibrium, chains that set high prices will not use informative adver-
tising. In contrast, chains that set low prices will use informative advertising.
Hypothesis 3 (H3): In equilibrium, chains setting low prices will use informative advertising
more in periods in which prices are lower.
The intuition for H2 follows from the fact that chains that set high prices sell only to uninformed
consumers and prefer to set high prices. In contrast, low-price firms want to inform consumers
about their prices and will therefore invest in informative advertising. Furthermore, because the
marginal benefit of informative advertising is greater during periods that prices are lower (say,
holiday seasons), we expect H3 to hold. This latter hypothesis further the potential of informative
advertising for enhancing price competition.
Hypothesis 4 (H4): In equilibrium, consumer search is limited.
H4 follows from the use of informative advertising by low-price chains and from pricing decisions
by the high-price non-advertising chains. Ads provide relevant information for the consumers who
get exposed to these ads and hence discourage search by these consumers. In addition, consumers
who are not exposed to ads will not continue to search after visiting a store because high-price
chains set prices at a level that dissuade subsequent search. At those price levels, consumers
19

are indifferent between buying and incurring a cost of searching further. A related implication
of the model is that following a reduction in search cost, high-price firms will set lower prices
aiming to discourage consumers from searching further. In Table 4 we showed that this is the
case. The no-search prediction arises in other standard search cost models for homogeneous goods.
Introducing some product or consumer heterogeneity often leads to some level of consumer search
in equilibrium.
4.1.2 The media
For many years now, the Israeli media has been actively involved in supporting pro-market agen-
das, criticizing attempts to gain market power and denouncing price increases. News outlets report
regularly on consumer issues, typically taking a pro-consumer point of view. Following the social
protests in 2011 and the cottage cheese boycott, media coverage of the food market became sub-
stantial and influential. In 2012, for instance, TheMarker, a prominent business newspaper in
Israel, selected Rami Levy, the man who owns and manages the hard-discount chain Rami Levy
(the third largest supermarket chain in Israel) as the most influential figure in Israel in that year.
Three years later, on Israel’s Independence day in 2015, Rami Levy received one of the most pres-
tigious national symbols, along the inventors of the application Waze and the developers of the
Iron Dome defense system.26 The media seems to embrace its role in highlighting market-related
concerns: The year 2017, was the first in which a reporter covering consumer issues has won the
Israel’s Journalists’ Association’s prestigious life-time achievement award.
The Israeli media coverage of consumer-related topics also involves comparisons of prices across
different supermarket stores. Before the transparency regulation, these comparison were also com-
mon but were limited in scope as reporters had to physically visit stores and wander through the
aisles to find the price of each product. After the regulation went into effect, the costs of collecting
and comparing prices dropped significantly, providing the media with ample opportunities to re-
port on price differences across numerous stores and products, much more than before prices were
transparent. For instance, on April 7, 2016, the news site Ynet, the most popular Israeli website in
Israel, published a comprehensive price comparison across dozens of supermarket stores through-
out the country. The comparison, based on information from Pricez.co.il, included information
from 18 geographic regions; for each region, the names and the addresses of the three stores that
offered the cheapest basket were reported. The number of items included in the basket varied
across regions, ranging between 130 and 210.27 On January 12, 2016, Channel 2 News, Israel’s26www.haaretz.com/israel-celebrates-67th-independence-day-1.535423527See http://www.globes.co.il/news/article.aspx?did=1001108062 and http://www.yediot.co.il/articles/
0,7340,L-4858377,00.html for additional examples. Price comparisons are also highlighted in local media, inaddition to national media: For instance, the local newspaper of Petach Tikva, the fifth largest city in Israel,used a price comparison platform to report on the supermarkets with the cheapest prices in Petach Tikva. Seehttps://goo.gl/YsVT9a
20

most popular news program, ran a 4.5-minute item on a new price competition among supermar-
ket chains in the city of Modi’in.28 In this case, too, the reporter used the Pricez mobile app to
compare prices across supermarket chains. Another example of the role of the media relates to the
merger between two large supermarket chains: Mega and Yeinot Bitan. The merger took place in
June 2016, towards the end of our data collection period. In this case, TheMarker, reported prices
at the merged chains before versus after the merger, and compared them against the corresponding
price differences at another supermarket chain that did not take part in the merger. TheMarker
used price data from one of the price comparison platforms and repeated this exercise a few weeks
after the merger and then again a few months after the merger.29
4.1.3 Multi-product retailers, media-based advertising and prices
Supermarkets sell thousands of items in each store and therefore cannot price advertise all the
items sold in their stores. Advertising the prices of only a subset of items may also be ineffective
if consumers realize these prices do not represent well the prices of other items they desire. How
then the extensive media coverage can help retailers use advertising to inform consumers about
food prices? We argue that price-comparison surveys conducted by the media provided hard-
discount chains an opportunity to mention these surveys in their ads as a credible, unbiased
source of information for their low prices. We build on this insight and use detailed data on all
ads by supermarket chains to classify ads that specifically mention media price-surveys reports
as ”media-based advertising”. Figures 5 and 6 show examples of ads in which chains referred to
price-comparison surveys conducted by a popular newspaper, a TV channel and a radio station.
Not surprisingly, the advertising chain was ranked as having the cheapest basket in the respective
media survey. We use the timing of these media-based ads, the identity of the advertising chains,
and the monetary cost of these ads to generate our variable of interests in the empirical analysis.
Figure 7 presents the expenditures on media-based advertising for the year before and for the
year after the transparency regulation came into effect, divided into the hard-discount chain in our
sample and the other chains combined. As can be seen in Figure, after the transparency regulation
the expenditures by the hard discount chain increased significantly. In contrast, the combined
expenditures on media-based ads by the 4 other supermarket chains practically disappeared once
prices became accessible online. Regression results presented in column 1 of Table 6 confirm
these patterns, showing that the expenditures on media-based ads by Rami Levy sharply increased
relative to the expenditures by other supermarket chains. These results support H1 and H2.
In column 2 in the table we provide a falsification test, showing expenditures on promotional
ads (i.e., ads mentioning specific price promotions) by Rami Levy did not increase relative to28www.mako.co.il/news-channel2/Channel-2-Newscast-q1_2016/Article-996f23598873251004.htm.29See www.themarker.com/advertising/1.3006498 and www.themarker.com/advertising/1.3116830.
21

expenditures on such ads by the other retailers. In other words, this analysis suggests that the
increase in media-based ads is not driven by an aggregate change in advertising spending but
rather by a change in spending devoted to media-based ads. According to H3, the use of media-
based advertising increases during periods in which prices are lower. Thus, we should find a
negative relationship between prices and spending on media-based ads. Figure 8 illustrates this
negative relationship well. According to the figure, as spending on media-based ads by the hard-
discount chain increased the negative estimated effect of transparency on the prices grew larger.
As can be seen in the figure, this negative relationship is even more pronounced when we use
promotional prices instead of regular prices. In figure . .in Online Appendix 2 we show that
this negative relationship holds also when we use the average prices of the basket instead of the
monthly regression coefficients. Furthermore, this relationship also holds when we estimate a
treatment intensity version of Equation 2, replacing the transparency indicator in the original
specification with a standardized measure of expenditures on media-based ads by Rami Levy in
a given month. We present the results in column 3 in Table ??. Thus, the results support H3
indicating that expenditures on media-based ads increase at times that prices fall.
4.1.4 Usage of price-comparison websites
We now turn to examine the role of consumer search as another channel through which consumers
may have gained price information. According to H4 consumers in equilibrium do not actually
search. Admittedly, it is difficult to show that consumers do not engage at all in search. Never-
theless, we believe we can show that the use of the price-comparison websites that became freely
available after the transparency regulation is limited.
To make this point, we first rely on a survey conducted by an Israeli consumer organization,
asking a representative sample of consumers on their search habits in retail markets. According to
survey, only 4% of respondents have accessed the price-comparison website in the year preceding the
survey. We also obtain qualitatively similar patterns when we use data, described in subsection
3.1.2, on the actual usage of the three price-comparison websites. In particular, the monthly
average number of unique visitors to Pricez.co.il and Zapmarket.co.il between October 2015 and
July 2016 was 21,414, and 16,992 respectively.30 These figures combined account for about 2% of
the number Israeli households. It is likely that some of those who accessed these websites used
to search in stores in the pre-transparency period. Thus, these numbers may even overstate the
increase in search activity for food prices. To increase consumer traffic to these websites, the
Ministry of Economy supported a large TV advertising campaign, and announced a competition30Mysupermarket.co.il, the third price-comparison website, offers as its main business an online grocery service so
we cannot disentangle customers who visit MySuperMarket to shop online (e.g., at Shufersal online) from visitorswho want to obtain price information in traditional stores. Yet, we note that the average number of total visitors toMySupermarket has marginally declined from 182k in the year preceding the regulation to 176K in the year after.
22

among price-comparison websites, in which the first and second prizes (175k and 75k New Israeli
Shekels) will be given to websites that will have more than 300K and 75k monthly users.31 Despite
these efforts and initiatives, they have failed to deliver sustained traffic into the price-comparison
websites.32 Conversations we had with insiders at both Pricez.co.il and Myspurmarket.co.il further
indicate that traffic to their price comparison websites is quite negligible. To make a living, these
websites offer market participants BI services which are based on the price data that they generate.
Thus, consistent with H4 we can conclude that consumer search activity is rather limited in the
post-transparency period.
4.2 Brand-image concerns and uniform pricing
Recent papers show that retail chains often set similar prices for items sold in very different
locations (e.g., Cavallo et al. (2014), DellaVigna and Gentzkow (Forthcoming)). These findings
are counter-intuitive given that standard economic models predict that pricing decisions should
take into account local consumer and market conditions. DellaVigna and Gentzkow (Forthcoming)
discuss potential explanations for uniform pricing, and highlight fixed costs of managerial decisions
and brand-image concerns as two primary explanations.33
Our setting is useful to shed further light on the reasons why retailers adopt uniform pricing,
and underscore the relationship between transparency, uniform pricing and brand-image concerns.
In particular, we propose that brand-image concerns best explain the effect of transparency on
the decision of each chain to adopt a nearly uniform pricing policy. That is, retailers reduced the
number of unique prices they set for each product because they were concerned that consumers
would find price differences across same-chain stores to be unfair, and that a public outcry would
take place if consumers observed that chains were engaging in that practice. Rotemberg (2011)
offers a theoretical framework that takes into account fairness into firms’ pricing decisions.
There are several reasons why we think that brand-image or fairness concerns are driving
retailers’ decision to adopt uniform pricing. First, such concerns were an integral part of the
public debate regarding retail food prices in Israel in the relevant time period. Many media
reports denounced the fact that a chain sets different prices for similar products sold in different
stores. Such media reports often emphasized that prices in stores located in rural and poorer
areas are more expensive than prices of the same items sold in stores in affluent areas.34 Echoing31The Israeli media also promoted the use of the price comparison platforms: in December 2015, the Israeli Internet
Association, together with Google and the Israeli Fair Trade Authority, launched a competition for the developmentof the best food price comparison application. See http://www.globes.co.il/news/article.aspx?did=1001056276and http://www.globes.co.il/news/article.aspx?did=1001074618.
32For more details, see https://www.calcalist.co.il/articles/0,7340,L-3751446,00.html.33Interestingly, Stigler (1961) also mentions the practice of uniform pricing and suggests that lowering consumer
search is another potential reason for the use of uniform pricing.34For instance, in April 2014, TheMarker surveyed prices of several items at different Shufersal stores and found
that prices in the periphery are substantially higher than in the center. www.themarker.com/consumer/1.2291031.
23

the critique, shortly before the transparency regulation came into effect, a legislative attempt
requiring food retailers to set the same price in all stores of the same chain nearly passed in the
Israeli parliament.35 Retail chains tried to address the public critique by attributing the price
differences to higher transportation costs to rural areas and by announcing that they would reduce
the price differences.36 Conversations we had with retailers also confirm that the decision to set
uniform pricing was driven by the public discontent. Finally, Hendel et al. (2017) also provide
evidence that the price-setting by Israeli food retailers, particularly following the social protest in
2011, takes into account potential negative public backlash.
5 Robustness
5.1 Measurement errors and grocery stores as a control group
Our regression analysis indicates that after the transparency regulation went into effect, prices of
items in the treatment group fell 4-5 percent more than did the prices of items in the different
control groups. A potential concern with our results is that they might have been affected by
the changes in the sources of data used for the analysis. In particular, the source of data for
the treatment group and the ICC control group in the pre-transparency period were a market
survey firm and the ICC, respectively. After the regulation, the data for these groups came from
a price comparison website.37 Thus, if there are systematic measurement errors associated with
one of these methodologies then our results are potentially biased. In particular, if (due to the
collection method) the prices recorded in the treatment group during the pre-transparency period
were systematically higher than the actual prices, then our results are potentially biased upward
(in absolute values).
To address this concern, we obtained data collected by the Israeli Central Bureau of Statistics
(“CBS”) for the same time period as our main analysis. We obtained data on the prices of 39
items, which are regularly collected by the CBS to construct the Israeli consumer price index.
Importantly, the methodology to collect the prices of these items did not change over the relevant
time period. The CBS data include, for each item, a product identifier, price, store identifier, city
name, the month in which the price was collected, and an indication of whether the store belongs
to a supermarket chain or is a mom-and-pop grocery store. For confidentiality, these data do not
include a specific address, chain affiliation or exact date. Thus, we cannot directly compare this
data set with the other sources of data that we use. Nevertheless, we can use the CBS data to
examine how the regulation affected prices in supermarkets (which were subject to the regulation)35http://www.ynet.co.il/articles/0,7340,L-4252811,00.html and www.knesset.gov.il/protocols/data/
rtf/kalkala/2012-07-24-02.rtf.36E.g., https://www.themarker.com/advertising/1.1613349.37For the Super-Pharm and online control groups the same data sources were used before and after the regulation.
24

relative to prices in mom-and-pop grocery stores (which were not subject to the regulation). Out
of the 39 products, 27 products are products that are included in the ICC basket. Thus, we
first focus on the remaining 12 products, and estimated Equations 1 and 2. The results of these
analyses, which are presented in Table 7, indicate that after the transparency regulation went into
effect, both price dispersion and price levels decreased to a greater extent in supermarket chains
than in mom-and-pop grocery stores. The magnitude of the estimated effect on prices is 1.9%.
If we restrict attention to the 8 items, for which there are on average more than 10 observations
per month, we obtain an estimated effect of 2.2%. Given that the sample of items used in this
analysis is a small subset of the products that we used in the main analysis, we view these results
as providing additional support for the findings presented in the main analysis.
The price data obtained from the CBS for the 27 products which are included in the ICC control
group are also useful because we can use them to indirectly test the validity of the ICC control
group. In particular, the rationale for using the prices of ICC products sold in supermarkets was
that these prices were transparent before and after the regulation. In contrast, the prices of these
products which were sold in grocery stores were not surveyed by the ICC and hence were non-
transparent both before and after the regulation. Accordingly, we can expect that the difference
in prices between supermarkets and grocery stores for these items should not significantly change
following the transparency regulation. Indeed, we do not find an effect (p-value = 0.64). Similarly,
we find a non-significant result if we again restrict attention to products for which we have more
than 10 observations per month. Using the prices in grocery stores as a control group is also useful
because, as we further discuss in Section 5.5, it seems unlikely that the owners of these small,
independent stores would have responded strategically to the transparency regulation by changing
their prices.
5.2 Different sampling frequencies
Another implication of using different data sources before and after the regulation concerns the
frequencies and particular timing that different data were collected. For instance, in the pre-
transparency period, prices of the items in the ICC control group were collected in the same month,
though not necessarily always on the same day. In contrast, in the post-transparency period, these
data were collected on the same day. This difference may mechanically lead to a higher number
of unique prices in the pre-transparency period for the ICC group compared with the number
of unique prices in the post-transparency period.38 To address this concern, we experimented
with different specifications in which we simulate the post-transparency period to also be at the
monthly level. For instance, for the post-transparency period we used price data for the treatment38For the treatment group, the prices in the pre-transparency period were collected in the last week of a given
month and almost always on the same day.
25

group only from the last week of the month (like in the pre-transparency period). Moreover, in
the specification using the ICC control group, we use price data from a randomly chosen week
in the post-transparency period. In other words, we make the pre- and post periods comparable
in terms of their data-collection frequencies. Likewise, for the online control group we use price
data collected in the last week of the month, similar to the treatment group. The results for these
different specifications, and for three different measures of price dispersion, are shown in Table 7
in Online Appendix 2. In all specifications, the qualitative results are unchanged.
5.3 Parallel time trends
The identifying assumption in a differences-in-differences research design is that the control and
treatment groups share the same time trend. Given the multiplicity of control groups used here, we
find it useful to graphically demonstrate that the control groups shares a similar time trend with
the treatment group. To this end, we estimated specifications using log(price) as the dependent
variables and also add month-specific effects for each specification (treatment group vs. control
group). The results are plotted in Figure 8 of Online Appendix 2. The figure demonstrates that
the treatment group time trend follow a similar time trend as the corresponding control group time
trend. Formally, we cannot reject the null hypothesis that the two time trends follow the same
pattern when using the online control group. We obtain similar qualitative results when using the
ICC control group.
5.4 Placebo tests
A potential threat to identification when using a differences-in-differences research design is the
possibility that the estimated effects are not driven by the treatment, but rather by other un-
observed factors. To address this concern, we conducted a placebo test by considering a sample
that started in July 2014 and ended in July 2015. We then re-estimated the regression in which
(log) price level is used as the dependent variable (Equation 2), defining a fictitious date for the
“effective” date of the transparency regulation. Since the treatment group was sampled eight times
in the (actual) pre-transparency period, and given that we want the placebo pre-regulation period
and the placebo post-regulation period to incorporate at least two data pulls each, we are left with
at most five possible points in time at which to set the fictitious regulation dates. We conducted
the test for both the online and the ICC control groups. The results, which show no significant
effect of the fictitious regulation, are presented in Table 8 of Online Appendix 2. These results
mitigate the concern that another event that occurred prior to the implementation of the regulation
explains our findings.
26

5.5 Strategic responses by prices in the control groups
Another potential concern with the interpretation of our findings is that prices of items in the
control groups may have reacted to the transparency regulation. For instance, if prices set by
Super Pharm (control group 3) or in chains’ online channel declined as a response to the decline
in prices in brick-and-mortar stores, then our results might be biased. Note, however, that this
would imply that our estimates using these control groups are a lower bound to the actual impact
of transparency.
If, however, following the transparency regulation Super-Pharm stores decided to target price-
insensitive consumers by raising prices, then our results may overstate the impact of the regulation.
While we believe that it is unlikely that Super-Pharm would raise its prices in the wake of a
regulation enabling consumers to more easily compare prices across different retailers, it is not
theoretically impossible. To address this concern, we classified Super-Pharm stores in our sample
as ‘close’ or ‘far’, according to their proximity to a supermarket store. We then checked whether
the price changes in ‘close’ Super-Pharm stores differed from the price changes in ‘far’ stores.
Arguably, if the above concern holds, we should expect prices in ‘close’ stores to rise more than
prices in ’far’ stores. The estimation results, presented in Table 9 in Online Appendix 2, provide no
evidence for such a relationship. Second, as mentioned in Section 5.1, we use prices of items sold in
individual grocery stores as an additional control group and find qualitatively similar results. This
analysis further suggests that our main results are not driven by a strategic response by Super-
Pharm. With regards to the concern about online prices, we also note that prices in traditional
stores have declined also in areas where online grocery services is very limited, further mitigating
this concern.
5.6 Anticipation of the policy change
One might be concerned that because the Food Act was enacted about a year before the trans-
parency regulation came into effect, supermarket chains might have lowered their prices before the
actual implementation of the regulation. We believe this concern is unfounded for several reasons.
First, the abrupt change in price dispersion that takes place shortly after the policy came into
effect strongly suggests that chains responded shortly after the regulation became effective (not
months before it was effective). Second, from a profit-maximizing perspective it is not obvious
why chains should set lower prices well before prices become transparent. Finally, if chains did set
lower prices well before the regulation came into effect then our estimates are potentially biased
downward.
27

6 Discussion and Concluding Remarks
Since the beginning of 2017 alone, several large retail chains, including Macy’s, JC Penney, Sears
and Payless ShoeSource have announced the closing of hundreds of brick-and-mortar stores and
the layoffs of many thousands of employees.39 This dismal trend of the retail market is often
attributed to the highly competitive digital age and the strength of online giants such as Amazon.
One important traditional retail market which seems relatively immune to this trend is the grocery
market, probably due to the unique characteristics of the products sold in grocery stores.
Amazon decision’s to purchase Whole Foods on June 2017 for $13.7 billion seems to suggest
that blending the online channel and the traditional retail food world can offer substantial com-
plementary benefits. For instance, it might result in traditional food stores voluntarily displaying
their prices online. Alternatively, government policies may require food retailers to post their
prices online. Will this information result in higher or lower food prices? Economic theory offers
mixed predictions. On the one hand, the availability of price information is essential for the ef-
ficient functioning of markets. On the other hand, several recent papers have shown that firms
may manipulate information to make it harder for consumers to find cheap alternatives. How
will then the rapid growth of the online market affect the traditional retail food market? What
are the implications of price transparency regulations on price levels, price dispersion and price
discrimination strategies?
In this paper, we study the impact of a price transparency regulation of food items sold in
Israeli traditional brick-and-mortar stores. While the impact of price information is at the core
of IO, to our knowledge, thus far hardly no studies were able to examine this issue empirically,
and those that have were typically limited in scope: they had to assume away selection issues and
have not considered firms’ advertising response. Our analysis addresses this gap, using a large set
of price data from the Israeli supermarket industry in the period surrounding the implementation
of a mandatory transparency regulation. We first show that following the transparency regulation
supermarket chains adopted a uniform pricing strategy, setting the same price across different
stores affiliated with the chain, and that price levels have fallen. The decrease was particularly
pronounced in stores affiliated with more pricey chains or stores that faced weaker competition in
their local markets. Our estimates suggest that the magnitude of the effect of transparency on
prices is not trivial. Relying on the 5% price reduction estimate, we can use back-of-the envelope
calculations to assess consumer savings and firms’ revenue losses from the increased transparency.
In particular, we find that chains lost about 46 million dollars in revenue each month, and average
household saved about $27 per month (about 1.5% of the median wage in Israel in 2015).40.39See https://goo.gl/R8pyTJ40http://www.cbs.gov.il/statistical/mb158h.pdf
28

We further highlight the important role of the media and media-based advertising in generating
these price reductions. We show that hard discount chains extensively relied in their ad campaigns
on price surveys conducted by the media as an objective and reliable source of information. These
ad campaigns were used especially during time periods in which prices were lower. Remarkably,
our findings provide strong support to the theoretical model by Robert and Stahl (1993) who were
the first to incorporate optima consumer search and advertising into one framework. We are not
aware of previous empirical studies that jointly examine the effects of search cost and advertising.
While our findings may support the adoption of similar transparency policies, we also stress
that our analysis focuses on a relatively short time period, and that the results regarding the
change in prices may change in the long run. Furthermore, information disclosure requirements
have the potential to affect other decisions made by the firms. For instance, transparency can
also potentially improve retailers‘ bargaining power vis-a-vis suppliers. In addition, transparency
may affect the frequency at which retailers adjust their prices, their price promotion strategies or
product availability. The change in the competitive landscape may also result in exit of inefficient
chains and consolidation. We leave these issues for future research.
References
Svend Albek, Peter Mollgaard, and Per B. Overgaard. Government-assisted oligopoly coordination?
a concrete case. Journal of Industrial Economics, 45:429–453, 1997.
William Allender, Jura Liaukonyte, Sherif Nasser, and Timothy J Richards. Price fairness and
strategic obfuscation. Available at SSRN 2780170, 2018.
Simon P Anderson and Régis Renault. Handbook of Game Theory and Industrial Organization,
chapter on firm pricing with consumer search. 2016.
Itai Ater and Omri Gerlitz. Round prices and price rigidity: Evidence from outlawing odd prices.
Journal of Economic Behavior and Organization, 144:188–203, 2017.
Kyle Bagwell. Handbook of industrial organization, volume 3, chapter The Economic Analysis of
Advertising, pages 1701–1844. North-Holland, 2007.
Emek Basker, editor. Handbook on the Economics of Retailing and Distribution. Edward Elgar
Publishing, 2016.
Michael R. Baye, John Morgan, and Patrick Scholten. Economics and Information Systems
(Handbooks in Information Systems), volume 1, chapter Information, Search, and Price Dis-
persion, pages 323–376. Emerald Group Publishing Limited, 2006.
29

Simon Board and Jay Lu. Competitive information disclosure in search markets. Journal of
Political Economy, 126(5):1965–2010, 2018.
Avishay Braverman. Consumer search and alternative market equilibria. Review of Economic
Studies, 47(3):487–502, 1980.
Jeffrey R. Brown and Austan Goolsbee. Does the internet make markets more competitive? evi-
dence from the life insurance industry. Journal of Political Economy, 110:481–507, 2002.
Zach Y Brown. Equilibrium effects of health care price information. Review of Economics and
Statistics, Forthcoming.
Erik Brynjolfsson and Michael D. Smith. Frictionless commerce? a comparison of internet and
conventional retailers. Management Science, 46(4):563–585, 2000.
Gerard R Butters. Equilibrium distributions of sales and advertising prices. The Review of
Economic Studies, 44(3):465–491, 1977.
David P Byrne and Nicolas De Roos. Learning to coordinate: A study in retail gasoline. American
Economic Review, 109(2):591–619, 2019.
Colin Campbell, Ray Gautam, andWaleed A. Muhanna. Search and collusion in electronic markets.
Management Science, 3(51):497–507, 2005.
Alberto Cavallo. Are online and offline prices similar? evidence from large multi-channel retailers.
American Economic Review, 1(107):283–303, 2017.
Alberto Cavallo. More amazon effects: Online competition and pricing behaviors, 2018.
Alberto Cavallo, Brent Neiman, and Roberto Rigobon. Currency unions, product introductions,
and the real exchange rate. Quarterly Journal of Economics, 129(2):529–595, 2014.
Stefano DellaVigna and Matthew Gentzkow. Persuasion: empirical evidence. Annu. Rev. Econ., 2
(1):643–669, 2010.
Stefano DellaVigna and Matthew Gentzkow. Uniform pricing in u.s. retail chains. Quartely Journal
of Economics, Forthcoming.
Pierre Dubois, Rachel Griffith, and Martin O’Connell. The effects of banning advertising in junk
food markets. The Review of Economic Studies, 85(1):396–436, 2017.
Alon Eizenberg, Saul Lach, and Merav Yiftach. Retail prices in a city. Working paper, 2017.
Glenn Ellison. A model of add-on pricing. The Quarterly Journal of Economics, 120(2):585–637,
2005.
30

Glenn Ellison and Sara Fisher Ellison. Search, obfuscation, and price elasticities on the internet.
Econometrica, 77(2):427–452, 2009.
Amihai Glazer. Advertising, information, and prices—a case study. Economic Inquiry, 19(4):
661–671, 1981.
Avi Goldfarb and Catherine Tucker. Digital economics. Journal of Economic Literature, 57(1):
3–43, 2019.
Austan D Goolsbee and Peter J Klenow. Internet rising, prices falling: Measuring inflation in a
world of e-commerce. In AEA Papers and Proceedings, volume 108, pages 488–92, 2018.
Yuriy Gorodnichenko, Viacheslav Sheremirov, and Oleksandr Talavera. Price setting in online
markets: Does it click? Journal of European Economic Association, (16):1764–1811, 2018.
Edward J. Green and Robert H. Porter. Noncooperative collusion under imperfect price informa-
tion. Econometrica, 52(1):87–100, 1984.
Igal Hendel, Saul Lach, and Yossi Spiegel. Consumers’ activism: The cottage cheese boycott. Rand
Journal of Economics, 48(4):972–1003, 2017.
Günter J Hitsch, Ali Hortacsu, and Xiliang Lin. Prices and promotions in us retail markets:
Evidence from big data. Working paper, 2017.
Maarten CW Janssen and Marielle C Non. Advertising and consumer search in a duopoly model.
International Journal of Industrial Organization, 26(1):354–371, 2008.
Maarten CW Janssen and Marielle C Non. Going where the ad leads you: On high advertised
prices and searching where to buy. Marketing Science, 28(1):87–98, 2009.
Rajiv Lal and Carmen Matutes. Retail pricing and advertising strategies. Journal of business,
pages 345–370, 1994.
Fernando Luco. Who benefits from information disclosure? the case of retail gasoline. American
Economic Journal: Microeconomics, 11(2):277–305, 2019.
David A. Matsa. Competition and product quality in the supermarket industry. Quarterly Journal
of Economics, 126(3):1539–1591, 2011.
Jeffrey Milyo and Joel Waldfoegel. The effect of price advertising on prices: Evidence in the wake
of 44 liquormart. American Economic Review, 89(5):1081–1096, 1999.
Felix Montag and Christoph Winter. Transparency against market power. Working paper, 2019.
31

OECD. Competition issues in the food chain industry. https://www.oecd.org/daf/
competition/CompetitionIssuesintheFoodChainIndustry.pdf, 2013.
Andrea Pozzi. The effect of internet distribution on brick-and-mortar sales. RAND Journal of
Economics, 3(44):569–583, 2013.
Régis Renault. Advertising in markets. In Handbook of Media Economics, volume 1, pages 121–204.
Elsevier, 2015.
Andrew Rhodes. Multiproduct retailing. The Review of Economic Studies, 82(1):360–390, 2014.
Jacques Robert and Dale O Stahl. Informative price advertising in a sequential search model.
Econometrica, pages 657–686, 1993.
Federico Rossi and Pradeep K. Chintagunta. Price transparency and retail prices: Evidence from
fuel price signs in the italian motorway. Journal of Marketing Research, 53(3):407–423, 2016.
Julio J Rotemberg. Fair pricing. Journal of the European Economic Association, 9(5):952–981,
2011.
Julio J. Rotemberg and Garth Saloner. A supergame-theoretic model of price wars during booms.
American Economic Review, 76(3):390–407, 1986.
Ran Spiegler. Bounded Rationality and Industrial Organization. Oxford University Press, 2011.
George J. Stigler. The economics of information. Journal of Political Economy, 69(3):213–225,
1961.
Chengsi Wang. Advertising as a search deterrent. RAND Journal of Economics, 48(4):949–971,
2017.
32
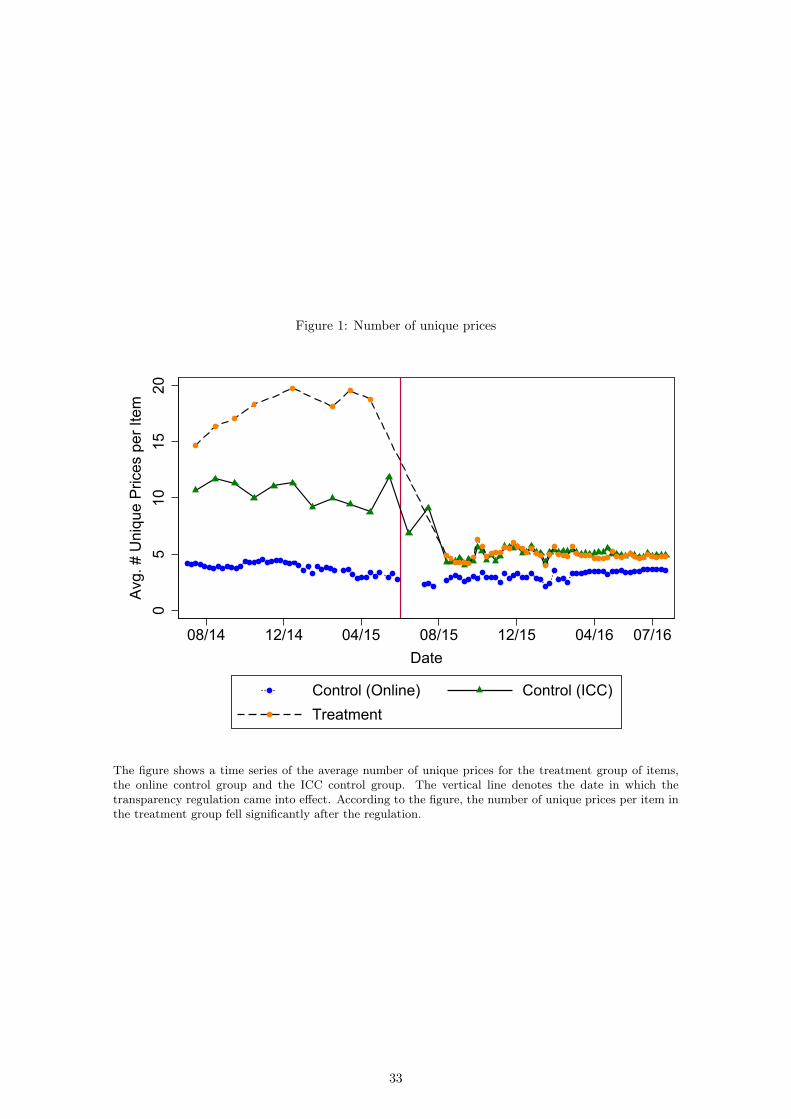
Figure 1: Number of unique prices
05
1015
20A
vg. #
Uni
que
Pric
es p
er It
em
08/14 12/14 04/15 08/15 12/15 04/16 07/16Date
Control (Online) Control (ICC)Treatment
The figure shows a time series of the average number of unique prices for the treatment group of items,the online control group and the ICC control group. The vertical line denotes the date in which thetransparency regulation came into effect. According to the figure, the number of unique prices per item inthe treatment group fell significantly after the regulation.
33

Figure 2: Retailer-specific basket price
900
1000
1100
Bas
ket P
rice
(NIS
)
08/14 12/14 04/15 08/15 12/15 04/16 07/16Month
Mega ShuferSal VictoryYeinot Bitan Rami Levy
The figure shows a time series of the total basket price for each of the five food retailers. The verticalline denotes the date in which the transparency regulation came into effect. A basket consists of 58 items.Monthly basket price is the sum of items average price, where the average is taken over the retailers’ stores.Missing price are imputed. The figure suggests that both price dispersion and price levels have decreasedafter prices became transparent.
34

Figure 3: Basket price in the online control and the treatment groups
750
800
850
900
950
Bas
ket P
rice
(NIS
)
08/14 12/14 04/15 08/15 12/15 04/16 07/16Month
Control Items (Online) Treatment Items
The figure shows a time series of the total basket price, divided into the online (control group) channeland the brick-and-mortar (treatment group) channel. The vertical line denotes the date in which thetransparency regulation came into effect. In each channel, prices are averaged across stores and chainsand missing prices are imputed. The figure shows that throughout the period the online basket is cheaperthan the same basket purchased in the traditional channel. Yet, the difference between the two channelsdiminishes after the prices in traditional stores become transparent. Similar patterns are observed whenwe use log(price) instead of price levels.
35

Figure 4: Comparable basket price
6575
8595
Bask
et P
rice
(NIS
)
08/14 12/14 04/15 08/15 12/15 04/16 07/16Month
Control Items (ICC) Treatment Items
The figure shows a time series of the total basket price for two baskets. One basket consists of six ICCcontrol items and the other consists of six close substitutes items from the treatment group. For instance,a 200- gram jar of Nescafé Taster’s Choice instant coffee, included in the ICC group, is matched to a 200-gram jar of Jacobs Kronung Coffee (another quality brand of instant coffee), included in the treatmentgroup. Similarly, we match a 700- ml bottle of Hawaii shampoo in the ICC group to a 700-ml bottleof Crema Nourishing Cream Wash in the treatment group. The figure shows that before prices in thetreatment group became transparent, the two baskets exhibited similar patterns, and after prices becametransparent the difference between the expenditures on the two baskets diminished.
36

Figure 5: An example of media-based advertising (1)
The figure shows an example of an ad by the hard-discount chain Rami Levy in which the chain stresses itoffers the cheapest basket in Israel. The ad specifically refers to two price-comparison surveys conductedby the media, One by the newspaper Yediot Aharonot (on September 4, 2015) and a second pre-holidaysurvey by TV channel 2.
37

Figure 6: An example of media-based advertising (2)
The Yeinot Bitan supermarket chain ad includes two references to comparisons of sales expenditures atsupermarket chains which was conducted by a national radio station and a leading online news portal. Inboth examples, Yeinot Bitan offers the cheapest option.
38

Figure 7: Spending on media-based ads by hard-discounters and other supermarket chains
The figure shows (in blue) the monthly expenditures on media-based ads by Rami Levy, the largest harddiscount chain in Israel, and (in red) the combined monthly expenditure on media-based ads by the othersupermarket chains (1$ ≈ 3.5NIS). The vertical line corresponds to the date in which the transparencyregulation became effective. The Figure shows that after the transparency regulation, expenditures onmedia-based ads increased for the hard discount chain and practically disappeared for the other chains.Similar patterns arise if we use the share of media-based ads out of total expenditures on ads.
39

Figure 8: Media-based ads and prices
The figure shows the relationship between informative advertising and prices. The solid green line corre-sponds to the monthly spending on media-based ads by the hard-discount chain (as shown on the rightvertical axis). The dash/blue and dotted/red lines correspond to monthly regression coefficients of a regres-sion that uses the online control channel to capture the effect of transparency on regular and promotionalprices, respectively. We present the magnitude of these coefficients on the left vertical axis. The verticalline corresponds to the date in which the transparency regulation became effective. The Figure shows aclear negative relationship between spending on media-based ads by the HD chain and change in prices.Similar patterns arise if we use the mean basket price instead of the average treatment effect.
40

Tab
le1:
Descriptive
Statistics
41

Tab
le2:
The
Effe
ctof
Price
Transpa
rencyon
Price
Dispe
rsion
#Uniqu
ePrices
Stan
dard
Deviation
/Avg
.PercentageRan
ge(100∗
Pm
ax−P
min
Pm
ax
)
(1)
(2)
(3)
(4)
(5)
(6)
(7)
(8)
(9)
After*T
reatment
-10.881∗
∗-8.103
∗∗-15.920∗
∗-0.101
∗∗-0.053
∗∗-0.083
∗∗-27.396∗
∗-12.481∗
∗-32.962∗
∗
(0.549)
(0.812)
(1.700)
(0.011)
(0.012)
(0.024)
(1.679)
(2.436)
(6.300)
WeekF.E.
XX
XX
XX
XX
XItem
F.E.
XX
XX
XX
XX
XLin.
Item
Tim
eTrend
XX
XX
XX
XX
XCon
trol
Group
Online
ICC
Supe
rPha
rmOnline
ICC
Supe
rPha
rmOnline
ICC
Supe
rPha
rmDep.Var.Average
Value
16.265
17.317
19.097
0.211
0.211
0.209
55.006
55.642
57.742
R2
0.785
0.804
0.833
0.392
0.627
0.471
0.488
0.736
0.635
N9636
6176
1525
9345
6120
1510
9636
6176
1525
The
unitof
observationin
columns
1,3,
4,6,
7&
9is
item
iin
date
tin
treatm
ent/controlgrou
pThe
unitof
observationin
columns
2,5&
8is
item
iin
date
t
Tim
epe
riod
covered7/2014
-6/
2016
Errorsareclusteredby
item
∗p<
0.05,∗∗
p<
0.01
The
Tab
lepresents
theregression
resultsof
Equ
ation1usingthreediffe
rent
measuresof
pricedispersion
asthedepe
ndentvariab
le,an
deach
ofthethreecontrolgrou
ps(drugstores,on
linean
dIC
C).Weuseprices
colle
cted
intheyear
before
thetran
sparency
regu
lation
forthepre-tran
sparency
period
,and
prices
colle
cted
intheyear
after
theregu
lation
asou
rpo
st-transpa
rencyregu
lation
.Togetasenseof
themagnitude
ofthechan
gein
pricedispersion
follo
wingthetran
sparency
regu
lation
,wealso
repo
rttheaveragevalueof
thecorrespo
ndingde
pend
entvariab
le.Fo
rallthemeasuresof
pricedispersion
andforeach
ofthecontrolgrou
ps,wefin
dthat
pricedispersion
has
sign
ificantly
drop
pedafterprices
becametran
sparent.
42

Tab
le3:
The
Effe
ctof
Price
tran
sparen
cyon
Price
Levels
(1)
(2)
(3)
log(Price)
log(Price)
log(Price)
After*T
reatment
-0.051
∗∗-0.052
∗∗-0.040
∗∗
(0.008)
(0.005)
(0.014)
StoreF.E.
XX
XDateF.E.
XX
XItem
F.E.
XX
XLinear
Item
SpecificTim
eTrend
XX
XCon
trol
Group
Online
ICC
Supe
rPha
rmR
20.937
0.961
0.909
N186810
278228
58358
The
unitof
observationis
item
iin
storejin
time-pe
riod
t
Tim
epe
riod
covered7/2014
-6/2016
Errorsareclusteredby
store
∗p<
0.05,∗∗
p<
0.01
The
tablepresents
theregression
resultsof
Equ
ation2,
usingprices
colle
cted
during
theyear
before
theregu
lation
asthepre-tran
sparency
period
,an
dprices
colle
cted
during
theyear
aftertheregu
lation
asthepo
st-transpa
rencype
riod
.Eachcolumn
correspo
ndsto
adiffe
rent
controlg
roup
.The
resultsindicate
that
prices
have
declined
by4%
-5%
aftertheprices
intrad
itiona
lstores
becametran
sparent.
43

Tab
le4:
The
Effe
ctof
Price
Transpa
rencyon
Pricesin
DifferentRetailers.
(1)
(2)
(3)
log(Price)
log(Price)
log(Price)
Premium:After*T
reatment
-0.061
∗∗-0.058
∗∗-0.045
∗∗
(0.008)
(0.006)
(0.014)
Discoun
t:After*T
reatment
-0.015
-0.026
∗∗0.011
(0.009)
(0.007)
(0.015)
P-V
al:Premium
Retailers
=Discoun
tRetailers
0.000
0.000
0.000
StoreF.E.
XX
XDateF.E.
XX
XItem
F.E.
XX
XLinear
Item
SpecificTim
eTrend
XX
XCon
trol
Group
Online
ICC
Supe
rPha
rmR
20.937
0.961
0.909
N186810
278228
58358
The
unitof
observationis
item
iin
storejin
date
t
Tim
epe
riod
covered7/2014
-6/2016
Errorsareclusteredby
stores
∗p<
0.05,∗∗
p<
0.01
The
Tab
lepresents
theregression
resultsof
aversionof
Equ
ation2in
which
thepo
st-transpa
rencyindicatoris
interacted
withasupe
rmarkettype
dummy(premium/d
iscoun
t).Asshow
nin
thetable,
theregression
results(for
each
ofthecontrolg
roup
s)suggestthat
prices
have
sign
ificantly
declined
forthelarge,
prem
ium
chains
andha
veno
tchan
gedforthediscou
ntchains.Weob
tain
qualitativelyresultswhenpe
rformingthisan
alysisat
thechain-specific
level.
44

Tab
le5:
The
Effe
ctof
Price
Transpa
rencyon
Prices,
byDegreeof
Com
petition
(1)
(2)
log(Price)
log(Price)
After*T
reatment-Lo
wCom
p.-0.059
∗∗
(0.006)
After*T
reatment-HighCom
p.:
-0.044
∗∗
(0.006)
After*T
reatment
-0.039
∗∗
(0.007)
After*T
reatment*Con
centration
-0.040
∗
(0.015)
StoreF.E.
XX
DateF.E.
XX
Item
F.E.
XX
Linear
Item
SpecificTim
eTrend
XX
Con
trol
Group
ICC
ICC
P-V
al:Lo
wCom
p=
HighCom
p.002
R2
0.962
0.962
N259557
259557
Con
centration
rang
esform
0to
1,with0be
ingpe
rfectcompe
tition
and1be
ingmon
opoly
The
10th,5
0th
and90th
percentilesof
concentrationare0.13,0.32
and0.45,respectively
The
unitof
observationis
item
iin
storejin
date
t
Tim
epe
riod
covered7/2014
-6/2016
Errorsareclusteredby
stores
∗p<
0.05,∗∗
p<
0.01
Inthistablewepresenttheregression
resultsof
aversionof
Equ
ation2in
which
weinteract
thepo
st-transpa
rencyindicatorwithameasure
ofthelocalcompe
tition
facedby
thesupe
r-marketstore.
Incolumn1,
thelocalcompe
tition
measure
isabina
ryvariab
leforhigh
orlow
compe
tition
,an
din
column2weuseacontinuo
usmeasure
oflocalcompe
tition
.Be-
causewewan
tto
compa
repricechan
gesacross
stores
that
belong
tothesamechainbu
tthat
face
diffe
rent
localc
ompe
tition
,weuseon
lytheIC
Ccontrolg
roup
.The
resultssuggest
that
prices
instores
that
facedweakerlocalc
ompe
tition
have
declined
morethan
stores
that
facedstrong
erlocalcompe
tition
.
45

Tab
le6:
Media-based
ads,
tran
sparency
andprices
%Media-based
ads
Media-based
ads(M
illionNIS)
log(Price)
(1)
(2)
(3)
(4)
HardDiscoun
t*After
48.846
∗∗∗
1.634∗
∗∗
(9.429)
(0.227)
HardDiscoun
tMedia-B
ased
Ads.Exp
.-0.013
∗∗∗
-0.018
∗∗∗
(0.004)
(0.004)
R2
0.789
0.808
0.937
0.930
N191
191
186810
186810
∗p<
0.1,∗∗
p<
0.05,∗∗
∗p<
0.01
Colum
ns1an
d2presentregression
resultsconcerning
thechan
gein
inform
ativead
vertisingafterthetran
sparency
regu
lation
.The
unit
ofob
servationisweek×
hard-discoun
tchaindu
mmy.
Incolumn1weusetheshareof
spending
onmed
ia-based
adsou
tof
totalspending
onad
s,while
incolumn2weusetheab
solute
spending
onthesead
s.The
resultsindicate
that
spending
bytheha
rd-discoun
tchains
onmedia-based
adsincreasedsign
ificantly
afterthetran
sparency
regu
lation
.These
resultssupp
ort(H
1)an
d(H
2).In
columns
3an
d4we
presentregression
resultsexam
iningtherelation
ship
betw
eenpricelevelsan
dtheuseof
inform
ativead
vertising.
The
unitof
observationis
item
iin
storejin
date
t.Colum
n3uses
regu
larprices
andin
column4weuseprom
otiona
lpricesas
thedepe
ndentvariab
le.In
both,we
estimateatreatm
entintensityversionof
Equ
ation2,
usingtheprices
ofitem
sin
theon
linechan
nelas
control.
The
intensityconsidered
isthemon
thly
absolute
spending
onmedia-based
ads.
The
regression
resultssupp
ort(H
3)an
dsuggestthat
media-based
adsweremore
heav
ilyused
intimepe
riod
sin
which
prices
weresetlower.
46

Tab
le7:
The
Effe
ctof
Price
Transpa
rencyon
Price
andPrice
Dispe
rsionusingCBSData
(1)
(2)
(3)
(4)
#Uniqu
ePrice
Stan
dard
Deviation
/Avg
.PercentageRan
ge(100∗
Pm
ax−P
min
Pm
ax
)log(Price)
After*T
reatment
-1.465
∗∗-0.042
∗∗-9.407
∗∗-0.022
∗∗
(0.288)
(0.004)
(0.726)
(0.007)
DateF.E.
XX
XX
Item
F.E.
XX
XX
Linear
Item
SpecificTim
eTrend
XX
XX
Con
trol
Group
Grocery
Stores
Grocery
Stores
Grocery
Stores
Grocery
Stores
Dep.Var.Average
Value
9.856
0.164
38.853
R2
0.832
0.905
0.778
0.975
N400
400
400
9472
The
unitof
observationin
columns
1-3is
item
iin
mon
tht
The
unitof
observationin
column4is
item
iin
storejin
mon
tht
Tim
epe
riod
covered7/2014
-6/
2016
Errorsareclusteredby
mon
thin
columns
1-3an
dby
storein
column4
∗p<
0.05,∗∗
p<
0.01
The
tablecontains
theregression
resultsusingsm
allgrocerystores,which
weresubject
tothetran
sparency
regu
lation
,as
anad
dition
alcontrolgrou
p,In
this
analysis,
werely
onpriceda
taob
tained
from
theIsraeliCentral
Bureauof
Statistics
on12
item
s.Werepe
atthean
alysis
featured
inTab
les2an
d3usingthethreemeasuresof
pricedispersion
(colum
ns1-3)an
dthepricelevel(colum
n4).The
resultsindicate
that
both
pricedispersion
andpricelevels
have
sign
ificantly
declined.
47