PRICE, DEMAND AND MARKET STRUCTURE FOR THE … · production or conclusive formation tests to be...
56
1 Marcelo S. Pinelli, Petrobras Downstream Planning Manager PRICE, DEMAND AND MARKET STRUCTURE FOR THE OIL INDUSTRY: Distillates in the driver’s seat or Gasoline resurgence ? Oxford Institute for Energy Studies – February 23 th
-
Upload
vuongkhuong -
Category
Documents
-
view
216 -
download
2
Transcript of PRICE, DEMAND AND MARKET STRUCTURE FOR THE … · production or conclusive formation tests to be...

1
Marcelo S. Pinelli, Petrobras Downstream Planning Manager
PRICE, DEMAND AND MARKET STRUCTURE FOR
THE OIL INDUSTRY: Distillates in the driver’s seat or
Gasoline resurgence ?
Oxford Institute for Energy Studies – February 23 th

2
DISCLAIMER
The presentation may contain forecasts about future events. Such forecasts merely reflect the
expectations of the Company's management. Such terms as "anticipate", "believe", "expect",
"forecast", "intend", "plan", "project", "seek", "should", along with similar or analogous
expressions, are used to identify such forecasts. These predictions evidently involve risks and
uncertainties, whether foreseen or not by the Company. Therefore, the future results of
operations may differ from current expectations, and readers must not base their expectations
exclusively on the information presented herein. The Company is not obliged to update the
presentation/such forecasts in light of new information or future developments.
The United States Securities and Exchange Commission permits oil and gas companies, in their
filings with the SEC, to disclose only proved reserves that a company has demonstrated by actual
production or conclusive formation tests to be economically and legally producible under existing
economic and operating conditions. We use certain terms in this presentation, such as oil and
gas resources, that the SEC’s guidelines strictly prohibit us from including in filings with
the SEC.
CAUTIONARY STATEMENT FOR US INVESTORS

3
OPEC’s oil price mismanagements
Weak Economic
Growth
Crude Oil Spare Capacity in High
Levels
Aggregate Demand
Reduction
Low Oil Prices Financial Speculation feedbacks the process
Geopolitical Factors
Brings Volatility to the
Process, Amplifying
Tendencies
New Refining
Units
FUNDAMENTALS REGARDING OIL MARKET STRUCTURE
Interest Rates
Dollar x Euro
Energetic Efficiency & Biofuel Markets

4
CRUDE OIL FUTURES AND MARKET STRUCTURE
Source: NYMEX
US
$/b
bl
5
25
45
65
85
105
125
jan
/01
jul/
01
jan
/02
jul/
02
jan
/03
jul/
03
jan
/04
jul/
04
jan
/05
jul/
05
jan
/06
jul/
06
jan
/07
jul/
07
jan
/08
jul/
08
jan
/09
jul/
09
jan
/10
jul/
10
jan
/11
jul/
11
jan
/12
jul/
12
jan
/13
US$/bbl nominais
5
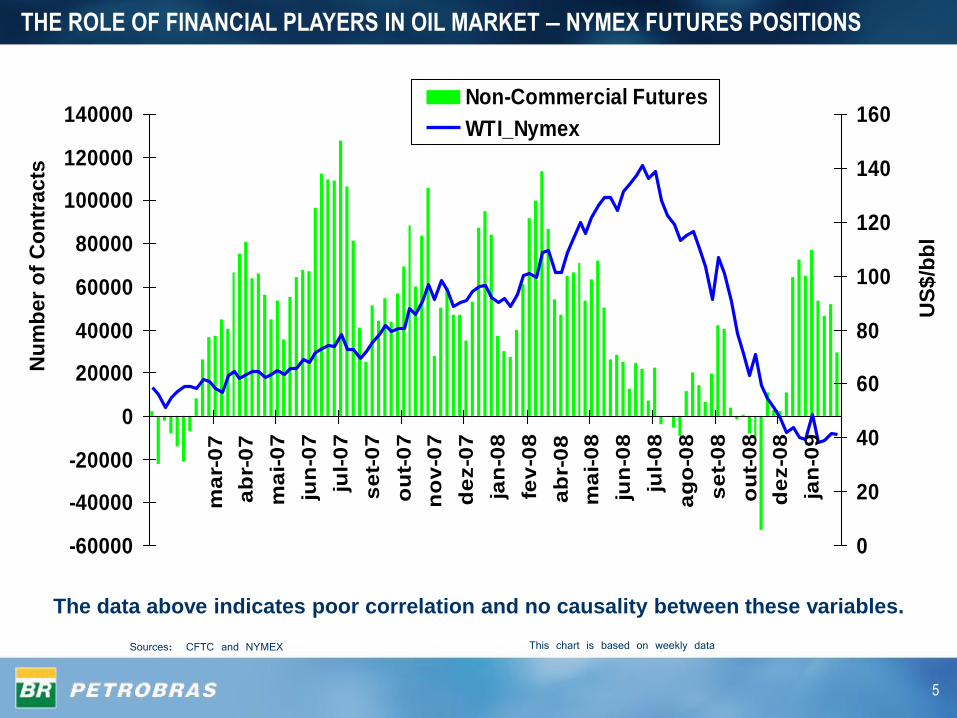
Sources: CFTC and NYMEX This chart is based on weekly data
The data above indicates poor correlation and no causality between these variables.
THE ROLE OF FINANCIAL PLAYERS IN OIL MARKET – NYMEX FUTURES POSITIONS
US
$/b
bl
Nu
mb
er
of
Co
ntr
acts
-60000
-40000
-20000
0
20000
40000
60000
80000
100000
120000
140000
ma
r-0
7
ab
r-0
7
ma
i-0
7
jun
-07
jul-
07
se
t-0
7
ou
t-0
7
no
v-0
7
de
z-0
7
jan
-08
fev
-08
ab
r-0
8
ma
i-0
8
jun
-08
jul-
08
ag
o-0
8
se
t-0
8
ou
t-0
8
de
z-0
8
jan
-09
0
20
40
60
80
100
120
140
160Non-Commercial Futures
WTI_Nymex

6
Source: Bloomberg and Platts* Granger’s causality tests were performed between these variables during this period
Among securities, the common stock of natural resource companies (such as gold, timber, and oil) is often considered an
inflation hedge because the value of the companies' assets should rise during a period of inflation.
From August 2007 to July 2008, Brent prices and Brent US$/bbl minus Brent Eur/bbl
spread have caused* the dollar/euro rate and a good correlation between these variables
is noticed from August 2007 to November 2008.
CRUDE OIL WAS USED AS A HEDGE AGAINST INFLATION, AND NOW ?
10
30
50
70
90
110
130
150
jan
/00
may/0
sep
/0
jan
/01
may/0
sep
/0
jan
/02
may/0
sep
/0
jan
/03
may/0
sep
/0
jan
/04
may/0
sep
/0
jan
/05
may/0
sep
/0
jan
/06
may/0
sep
/0
jan
/07
may/0
sep
/0
jan
/08
may/0
sep
/0
jan
/09
US$/bbl and Eur/bbl
0.0
0.2
0.4
0.6
0.8
1.0
1.2
1.4US$/Eur$Brent US$/bbl
Brent Eur/bbl
USD$/Eur$

7
RESERVE/PRODUCTION RATIO EVOLUTION
Source: BP Statistics 2008
1814
20
46
1822
53
82
24
31
1914
0
10
20
30
40
50
60
70
80
90
19 8 0 2 0 0 7
Total North America Total S. & Cent. America
Total Europe & Eurasia Total Middle East
Total Africa Total Asia Pacific
Years

8
0
10000
20000
30000
40000
50000
60000
70000
80000
900001965
1967
1969
1971
1973
1975
1977
1979
1981
1983
1985
1987
1989
1991
1993
1995
1997
1999
2001
2003
2005
2007
Total North America Total S. & Cent. AmericaTotal Europe & Eurasia Total Middle EastTotal Africa Total Asia Pacific
WORLD: OIL PRODUCTION EVOLUTION
Source: BP Statistics 2008
M bpdThousand bpd

9
0
10000
20000
30000
40000
50000
60000
70000
80000
900001965
1967
1969
1971
1973
1975
1977
1979
1981
1983
1985
1987
1989
1991
1993
1995
1997
1999
2001
2003
2005
2007
Total North America Total S. & Cent. AmericaTotal Europe & Eurasia Total Middle EastTotal Africa Total Asia Pacific
WORLD: OIL CONSUMPTION EVOLUTION
Source: BP Statistics 2008
M bpdThousand bpd
10
650.000
700.000
750.000
800.000
850.000
Jan Feb Mar Apr May Jun Jul Aug Sep Oct Nov Dec
Range 2003 - 2007
2007
2008
M bbl
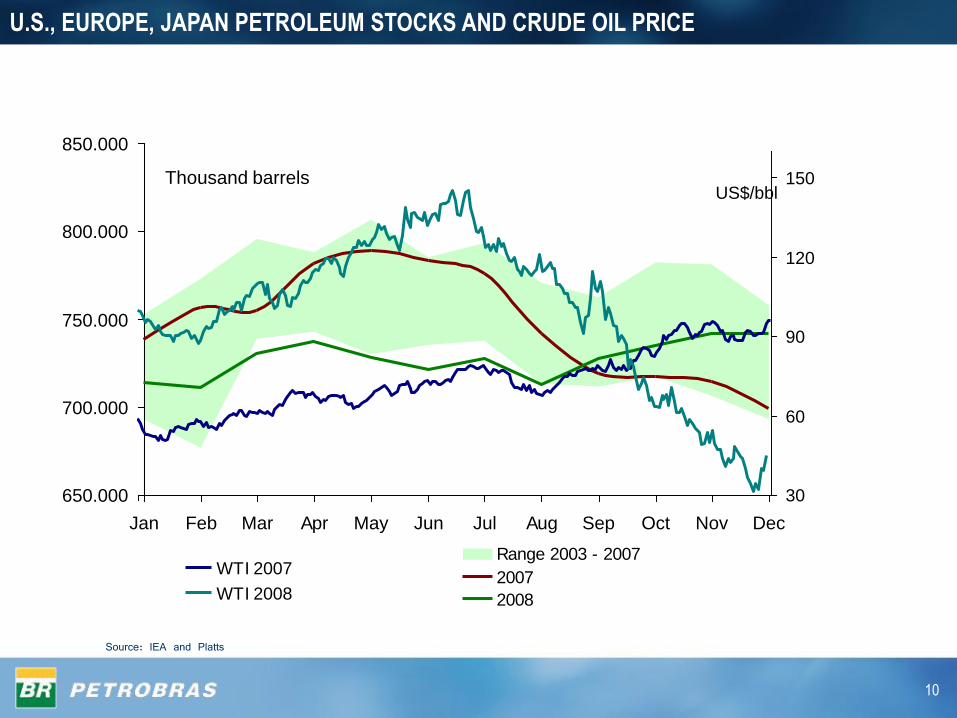
Source: IEA and Platts
U.S., EUROPE, JAPAN PETROLEUM STOCKS AND CRUDE OIL PRICE
30
60
90
120
150
WTI 2007
WTI 2008
US$/bblThousand barrels

11
Source: IEA
CONTRIBUTIONS TO OIL AND LIQUIDS DEMAND AND SUPPLY GROWTH
-2,000
-1,000
0
1,000
2,000
3,000
4,000
1995 1996 1997 1998 1999 2000 2001 2002 2003 2004 2005 2006 2007 2008
NON-OECD Demand
OECD Demand
M bpd
Oil and Liquids Demand
-2.000
-1.000
0
1.000
2.000
3.000
4.000
1995 1996 1997 1998 1999 2000 2001 2002 2003 2004 2005 2006 2007 2008
Non-OPEC 13
OPEC 13
M bpd
Oil and Liquids Supply
Thousand bpd
Thousand bpd

12
-600
-300
0
300
600
900
1,200
1,500
1,800
2,100
Growth Decline
-600
-300
0
300
600
900
1,200
1,500
1,800
2,100
Growth Decline
-600
-300
0
300
600
900
1,200
1,500
1,800
2,100
Growth Decline
Average 2003 - 2008 Year 2007 Year 2008
Source: IEA
M bpd
OIL AND LIQUIDS SUPPLY CHANGE
OECD OPEC 13 FSU Other Non-OPEC
M bpd M bpdThousand bpd Thousand bpd Thousand bpd

13
320
240
127
120
116
94
-1163
-79
-250-1
20
0
-10
00
-80
0
-60
0
-40
0
-20
0
0 20
0
40
0
60
0
China
Saudi Arabia
India
Brazil
Iran
Germany
Italy
Japan
United States
329
141
122
111
98
74
-49
-236
-191
-1
-12
00
-10
00
-80
0
-60
0
-40
0
-20
0
0 20
0
40
0
60
0
China
India
Brazil
Saudi Arabia
Iran
Canada
United States
United Kingdom
Japan
Germany
20082007
Source: IEA
OIL AND LIQUIDS DEMAND CHANGE
OECD
Non-OECD
OECD
Non-OECD
Thousand bpd
Thousand bpd

14
2008 WORLD DEMAND GROWTH: OECD vs NON OECD
Sources: IEA Oil Market Report
IEA forecast revisions for 2008 Oil and Liquids Demand Growth
-2,0
-1,5
-1,0
-0,5
0,0
0,5
1,0
1,5
2,0
2,5
Jan 2008
IEA Estimate
Mar 2008
IEA Estimate
Jun 2008
IEA Estimate
Sep 2008
IEA Estimate
Dec 2008
IEA Estimate
OECD Demand Non-OECD Demand Total Demand
MM bpdMillion bpd

15
WORLD: REGIONAL CONSUMPTION - BY PRODUCT GROUP
Source: BP Statistics 2008
0%
20%
40%
60%
80%
100%1965
1967
1969
1971
1973
1975
1977
1979
1981
1983
1985
1987
1989
1991
1993
1995
1997
1999
2001
2003
2005
2007
Light distillates Middle distillates Fuel oil Others

16
WORLD FINAL ENERGY CONSUMPTION BY SECTOR
Total Consumption ( %)
1980
Oil Consumption (%)
1980
2006
2006Source: IEA
Transport
25%
Industry
35%
Residential,
Services
and
Agriculture
40%
Transport
30%
Industry
30%
Residential,
Services
and
Agriculture
40%
Transport
56%
Industry
22%
Residential,
Services
and
Agriculture
40%
Transport
73%
Industry
11%
Residential,
Services and
Agriculture
40%
2007
2007
1980
1980

17
World Product Consumption – Light and Middle Distillates
Source: BP Statistics 2008
0
10.000
20.000
30.000
40.000
50.000
60.000
70.000
19851987
19891991
19931995
19971999
20012003
20052007
middle
light
Thousand bpd

18
Regional Demand - Light and Middle Distillates
Source: BP Statistics 2008
0
1.000
2.000
3.000
4.000
5.000
6.000
7.000
8.000
9.000
10.000
11.000
12.000
13.000
1985
1987
1989
1991
1993
1995
1997
1999
2001
2003
2005
2007
EUROPE Middle distillates
EUROPE Light distillates
0
2.000
4.000
6.000
8.000
10.000
12.000
14.000
16.000
18.000
1985
1987
1989
1991
1993
1995
1997
1999
2001
2003
2005
2007
US Middle distillates
US Light distillates
0
2.000
4.000
6.000
8.000
10.000
12.000
14.000
16.000
18.000
1985
1987
1989
1991
1993
1995
1997
1999
2001
2003
2005
2007
Asia Middle distillates
Asia Light distillates
Thousand bpd

19
0
2
4
6
8
10
12
North
America
US Europe FSU Middle
East
Africa Asia
Pacific
China Japan
MMbpd
2000
2001
2002
2003
2004
2005
2006
2007
1.3% 1.1% -2.5% 3.9% 5.4% 2.4% 3.5% 7.1% 0.4%CAGR
LIGHT DISTILLATES CONSUMPTION, 2000-2007
Million bpd
Source: BP Statistics 2008

20
Source: IEA and Platts
CrackSpread Gasoline = Unleaded USG – WTI
U.S., EUROPE, JAPAN GASOLINE STOCKS AND CRACKSPREAD GASOLINE USG MINUS WTI
290,000
310,000
330,000
350,000
370,000
Jan Feb Mar Apr May Jun Jul Aug Sep Oct Nov Dec
Range 2003 - 200720072008
M bbl
-20
0
20
40
60
80
100
Crack-Spread Gasoline 2007
Crack-Spread Gasoline 2008
US$/bbl
Thousand barrels

21
U.S. Finished Motor Gasoline Refinery Yield
Source: EIA DOE
40
41
42
43
44
45
46
47
48
49
jan fev mar abr mai jun jul ago set out nov dez
2005
2006
2007
2008
%

22
0.0
1.0
2.0
3.0
4.0
5.0
6.0
7.0
8.0
9.0
10.0
North
America
US Europe FSU Middle
East
Africa Asia
Pacific
China Japan
MMbpd
2000
2001
2002
2003
2004
2005
2006
2007
MIDDLE DISTILLATES CONSUMPTION, 2000-2007
1.1% 0.9% 2.0% 3.0% 3.9% 3.4% 2.3% 9.0% -2.7%CAGR
Million bpd
Source: BP Statistics 2008

23
Source: IEA and Platts
Crackspread Diesel = N2 Diesel USG - WTI
U.S., EUROPE, JAPAN DIESEL STOCKS AND CRACKSPREAD DIESEL USG MINUS WTI
270,000
300,000
330,000
360,000
390,000
Jan Feb Mar Apr May Jun Jul Aug Sep Oct Nov Dec
Range 2003 - 2007
2007
2008
M bbl
0
10
20
30
40
Crack-Spread Diesel 2007
Crack-Spread Diesel 2008
US$/bblThousand barrels

24
Diesel Prices
0
20
40
60
80
100
120
140
160
Jan-
00
May
-00
Sep
-00
Jan-
01
May
-01
Sep
-01
Jan-
02
May
-02
Sep
-02
Jan-
03
May
-03
Sep
-03
Jan-
04
May
-04
Sep
-04
Jan-
05
May
-05
Sep
-05
Jan-
06
May
-06
Sep
-06
Jan-
07
May
-07
Sep
-07
Jan-
08
May
-08
Sep
-08
Jan-
09
No.2 USG Waterborne Platts Mid
Gasoil 0.2%S NWE FOB Barges Platts Mid
Gasoil 0.5%S Singapore Platts Mid
(US$/BBL)
DIESEL PRICES

25
GASOLINE – DIESEL SPREADS
Gasoline - Diesel Spreads
-30
-20
-10
0
10
20
30
Jan-
00
Apr
-00
Jul-0
0
Oct-0
0
Jan-
01
Apr
-01
Jul-0
1
Oct-0
1
Jan-
02
Apr
-02
Jul-0
2
Oct-0
2
Jan-
03
Apr
-03
Jul-0
3
Oct-0
3
Jan-
04
Apr
-04
Jul-0
4
Oct-0
4
Jan-
05
Apr
-05
Jul-0
5
Oct-0
5
Jan-
06
Apr
-06
Jul-0
6
Oct-0
6
Jan-
07
Apr
-07
Jul-0
7
Oct-0
7
Jan-
08
Apr
-08
Jul-0
8
Oct-0
8
Jan-
09
USG NWE Sing
Hurricane
Gustav
(US$/BBL)

26
US PRODUCTS YIELDS: REFINERY MAXIMIZATION WAR !
20%
25%
30%
35%
40%
45%
jan/
05
mar
/05
mai
/05
jul/0
5
set/0
5
nov/
05
jan/
06
mar
/06
mai
/06
jul/0
6
set/0
6
nov/
06
jan/
07
mar
/07
mai
/07
jul/0
7
set/0
7
nov/
07
jan/
08
mar
/08
mai
/08
jul/0
8
set/0
8
nov/
08
Gasoline Diesel
Source: EIA/DOE

27
Diesel Engine Vehicle Market Shares in Western Europe and the United States, 1999-2007
Source: EIA.
(% of Total New Light-Duty Vehicle Sales)

28
While in Europe, diesel penetration
Source:
0,00%
10,00%
20,00%
30,00%
40,00%
50,00%
60,00%
70,00%
80,00%
1995
1996
1997
1998
1999
2000
2001
2002
2003
2004
2005
2006
2007
Petrol
Diesel
Trends in composition of new cars registered in the EU15
29
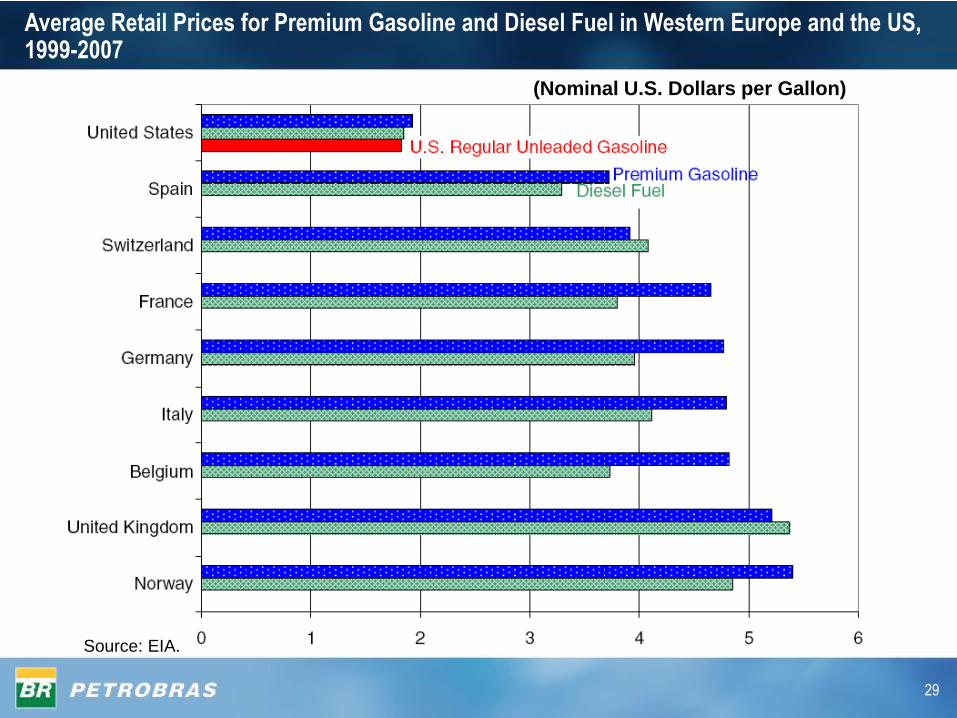
Average Retail Prices for Premium Gasoline and Diesel Fuel in Western Europe and the US, 1999-2007
Source: EIA.
(Nominal U.S. Dollars per Gallon)

30
0
10
20
30
40
50
60
70
80
90
1999 2000 2001 2002 2003 2004 2005 2006 2007
United States Western Europe Belgium France
Germany Italy Norway Spain
Switzerland United Kingdom
Diesel Engine Vehicle Market Shares in Western Europe and the United States, 1999-2007
Source: EIA.
(% of Total New Light-Duty Vehicle Sales)
31
0
50
100
150
200
250
300
350
400
jan/0
7
abr/
07
jul/07
out/07
jan/0
8
abr/
08
jul/08
out/08
-1000
-800
-600
-400
-200
0
200
400
600Consumption
Retail Prices
Wholesale Price
0
1.000
2.000
3.000
4.000
5.000
6.000
7.000
8.000
9.000
10.000
1994
1995
1996
1997
1998
1999
2000
2001
2002
2003
2004
2005
2006
2007
2008
0
50
100
150
200
250
300
350
Consumption
Retail Gasoline Price
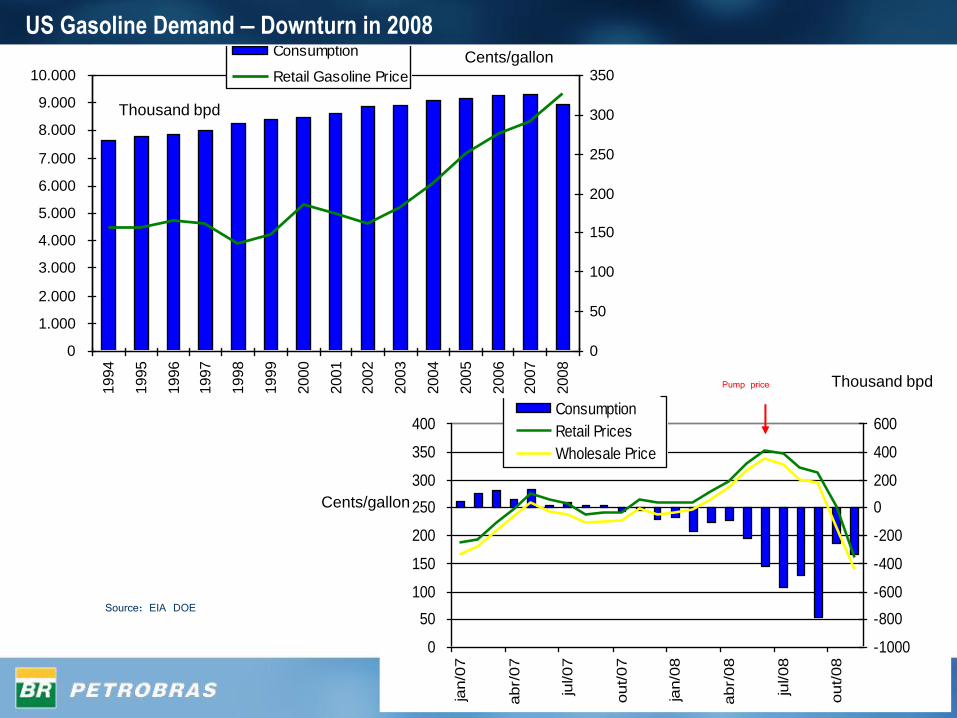
US Gasoline Demand – Downturn in 2008
Source: EIA DOE
Cents/gallon
Thousand bpd
Pump price
Cents/gallon
Thousand bpd

32
2.200
2.250
2.300
2.350
2.400
2.450
2.500
2.550
2.600
2.650
2.700
2.750
2.800
2.850
2.900
2.950
3.000
3.050
19951996
19971998
19992000
20012002
20032004
20052006
20072008
Vehicle-Distance Traveled - Americans are driving less…
Source: US Federal Highway Administration
Inflexion point
Billion Miles
33
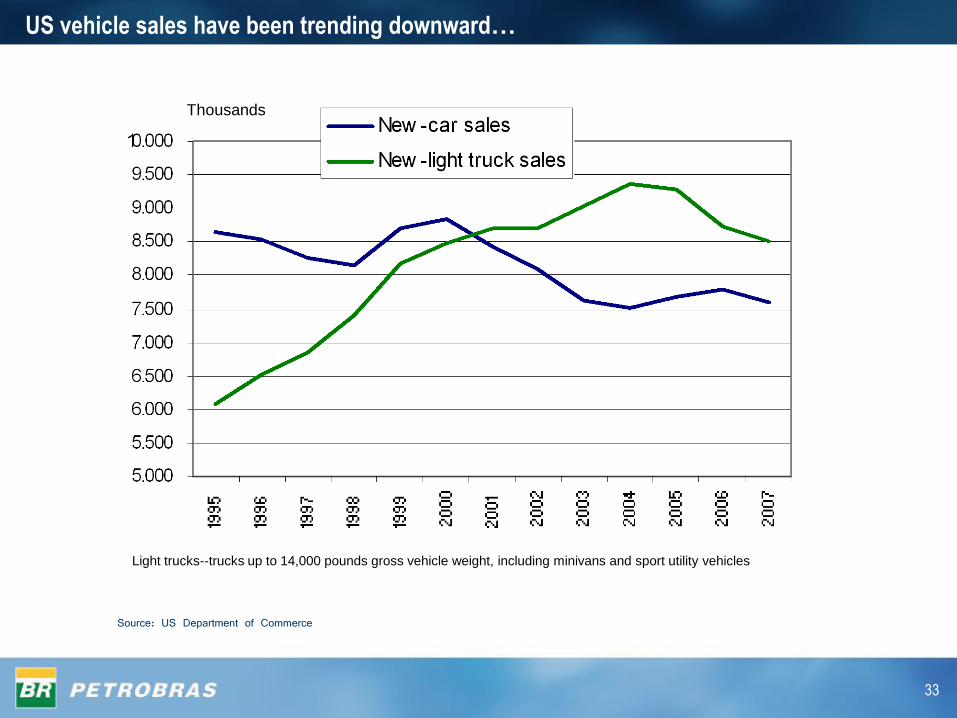
US vehicle sales have been trending downward…
Source: US Department of Commerce
Light trucks--trucks up to 14,000 pounds gross vehicle weight, including minivans and sport utility vehicles
Thousands

34
Source: EPA
Fuel Economy in US
*
* Light-duty trucks = sport utility vehicles or SUVs, vans, and pickup
trucks with less than 8500 pounds gross vehicle weight ratings.
35
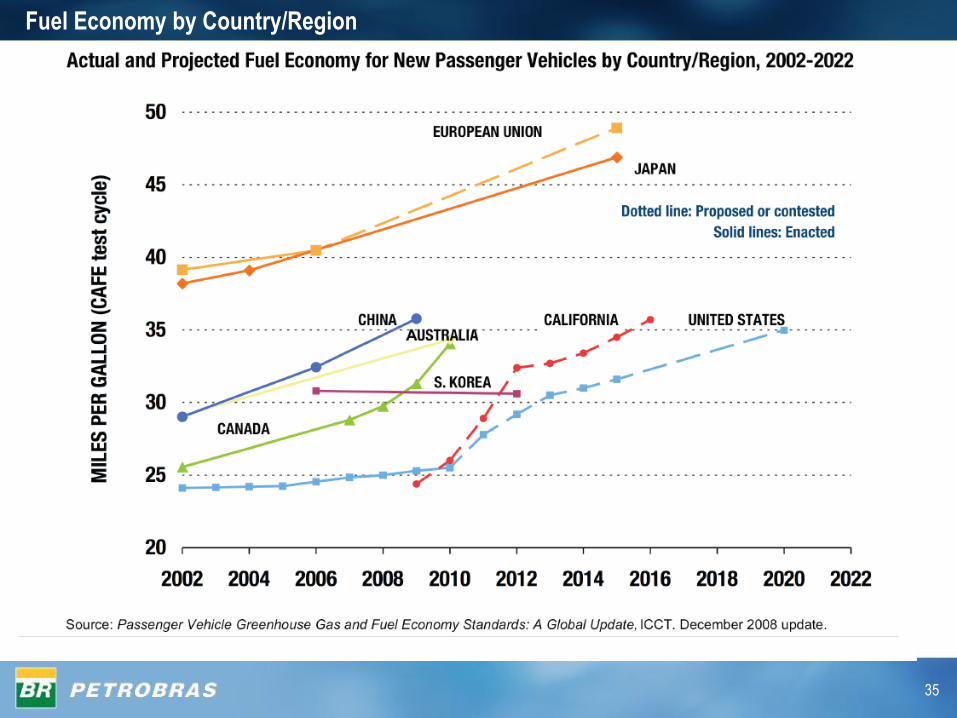
Fuel Economy by Country/Region
36
0.00
0.50
1.00
1.50
2.00
2.50
2006
2007
2008
2009
2010
2011
2012
2013
2014
2015
2016
2017
2018
2019
2020
mm
bp
d
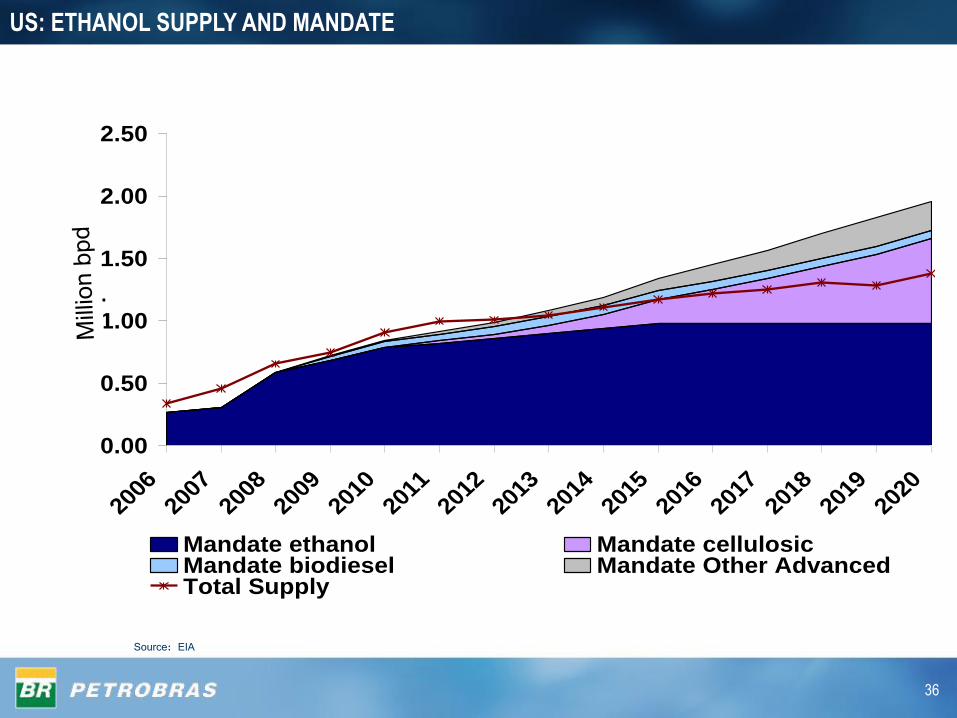
Mandate ethanol Mandate cellulosicMandate biodiesel Mandate Other AdvancedTotal Supply
US: ETHANOL SUPPLY AND MANDATE
Source: EIA

37
Total Aircraft deliveries from Airbus – 1992-2008
0
100
200
300
400
500
600
1992
1993
1994
1995
1996
1997
1998
1999
2000
2001
2002
2003
2004
2005
2006
2007
2008
Source: Airbus (1992-2008 Results).

38
Sources: Platts
Spread Crude Oil Light-Heavy = WTI – Maya
Spread Oil Products Light-Heavy = (Unleaded USG + N2 Diesel USG)/2 – Fuel Oil 3% USG
SPREADS LIGHT – HEAVY: THE COMPLEX REFINER ADVANTAGE
0
5
10
15
20
25
30
35
40
451
98
8
19
89
19
90
19
91
19
92
19
93
19
94
19
95
19
96
19
97
19
98
19
99
20
00
20
01
20
02
20
03
20
04
20
05
20
06
20
07
20
08
WTI - Maya Diesel & Gasoline - Fuel Oil
US$/BBL of 2008

39
0
5
10
15
20
25
30
35
1988
1989
1990
1991
1992
1993
1994
1995
1996
1997
1998
1999
2000
2001
2002
2003
2004
2005
2006
2007
2008
Margin WTI Cracking
Margin Maya Coking
US$/BBL of 2008
Sources: Platts
US Gasoline Downturn
Gross Refining Margins = Products prices minus crude oil
Margin WTI Cracking = USGC Margin of using WTI with cracking yields
Margin Maya Coking = USGC Margin of using Maya with coking yields
GROSS REFINING MARGINS AT US GULF COAST

40
67.163
0
2
4
6
8
10
12
- 10.000 20.000 30.000 40.000 50.000 60.000 70.000 80.000 90.000 100.000
Mbpd
Refi
nin
g M
arg
in Coking
Cracking
Topping
US$/bbl
71.868
0
2
4
6
8
10
12
- 10.000 20.000 30.000 40.000 50.000 60.000 70.000 80.000 90.000 100.000
Mbpd
Refi
nin
g M
arg
in Coking
Cracking
Topping
US$/bbl
GLOBAL MARGINAL REFINER 2002-2003
Average crude oil quality: 32 api, 1,2 S%, 0,9 TAN
Sources: OGJ, PIRA & Crude Oil Handbook 2002
2003
Topping
2002
Topping
Thousand bpd
Thousand bpd
41
75.677
0
2
4
6
8
10
12
- 10.000 20.000 30.000 40.000 50.000 60.000 70.000 80.000 90.000 100.000
Mbpd
Refi
nin
g M
arg
in Coking
Cracking
Topping
US$/bbl
76.131
0
2
4
6
8
10
12
- 10.000 20.000 30.000 40.000 50.000 60.000 70.000 80.000 90.000 100.000
Mbpd
Refi
nin
g M
arg
in Coking
Cracking
Topping
US$/bbl
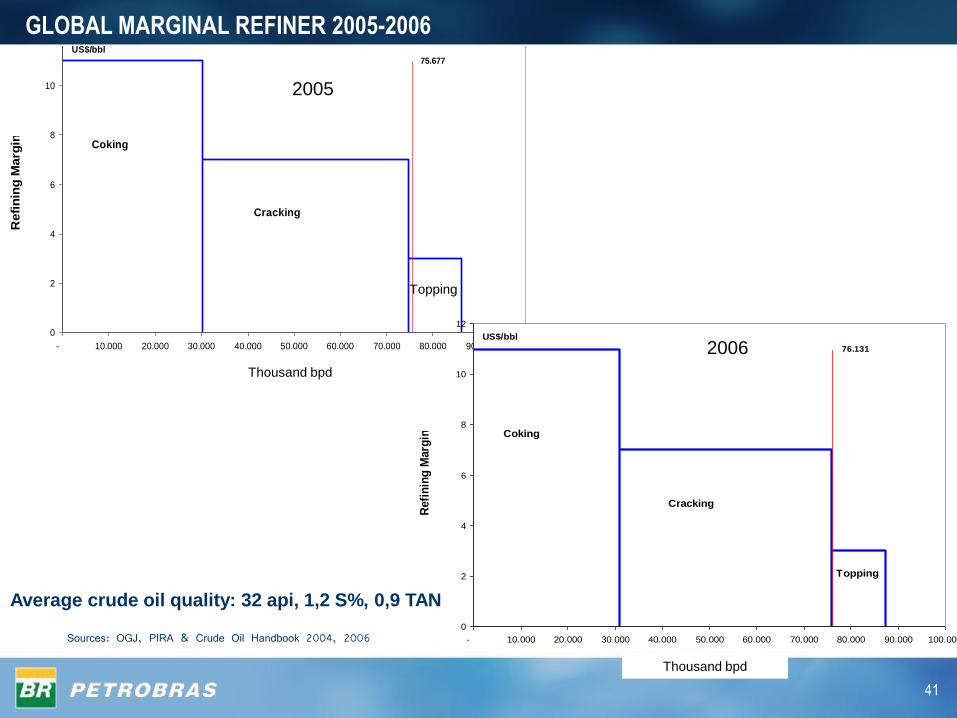
GLOBAL MARGINAL REFINER 2005-2006
Sources: OGJ, PIRA & Crude Oil Handbook 2004, 2006
2006
Topping
2005
Average crude oil quality: 32 api, 1,2 S%, 0,9 TAN
Thousand bpd
Thousand bpd

42
77.681
0
2
4
6
8
10
12
- 10.000 20.000 30.000 40.000 50.000 60.000 70.000 80.000 90.000 100.000
Mbpd
Refi
nin
g M
arg
in Coking
Cracking
Topping
US$/bbl
77.387
0
2
4
6
8
10
12
- 10.000 20.000 30.000 40.000 50.000 60.000 70.000 80.000 90.000 100.000
Mbpd
Refi
nin
g M
arg
in Coking
Cracking
Topping
US$/bbl
GLOBAL MARGINAL REFINER 2007-2008
Average crude oil quality: 32 api, 1,2 S%, 0,9 TAN
Sources: OGJ, PIRA & Crude Oil Handbook 2007, 2008
2008
2007
Topping
Topping
Thousand bpd
Thousand bpd

43
REFINERY CAPACITY PROFILE
Coking FCC Hydrocracking
Latin America
-
1,000
2,000
3,000
2004 2005 2006 2007 2008
6% 6% 5% 5% 22%
28% 28% 29% 28% 29%
66%67% 66% 66% 66%Africa
-
100
200
300
400
500
2004 2005 2006 2007 2008
27% 27% 29% 29%33%
11% 11% 17% 17% 14%
53%62% 62% 53% 54%
Middle East
-
500
1,000
1,500
2004 2005 2006 2007 2008
57% 57% 57% 52% 55%
9% 9% 9% 9% 7%
38%34% 34% 34% 40%
Asia
-
2,000
4,000
6,000
8,000
10,000
2004 2005 2006 2007 2008
19% 19% 21% 22%22%
17% 17% 18% 18% 19%
59%64% 64% 62% 60%
FSU
-
500
1,000
1,500
2004 2005 2006 2007 2008
13% 18% 17% 17% 19%
22% 20% 21% 21% 19%
62%65% 63% 62% 62%
North America
-
5,000
10,000
15,000
2004 2005 2006 2007 2008
17% 17% 17% 18% 18%
23% 23% 23% 23% 24%
59%60% 60% 60% 59%
Europe
-
1,000
2,000
3,000
4,000
5,000
2004 2005 2006 2007 2008
30% 30% 31% 32% 32%
9% 9% 9% 9% 10%
58%60% 60% 60% 59%
mbpd
Source: Pira
Thousand bpd

44
• Global demand for middle distillates has been growing faster than for gasoline over the lastdecade and is expected to continue to do so.
• This has gradually been reflected in the price differential between diesel and gasoline. Twofactors have exacerbated this trend: tightening sulfur specifications for diesel and growingethanol and NGL supplies which weigh on gasoline/naphtha prices.
• Developing countries have been a large source of incremental diesel demand over the pastfour years.
• Refiners have been maximizing their diesel yields to take advantage of superior margins forthe product. European refiners have less potential to increase distillate yields further as mostof the measures have already been taken, while US refiners have more potential as they havelong been focused on gasoline production.
• Middle distillate margins are expected to weaken in 2009 from the record levels reached in2007 and 2008, however they are not expected to collapse completely.
• Demand growth in 2009 is likely to be much weaker than in the recent past. The sharpcontraction in the OCDE economies has resulted in a reduction of trade and freightmovements. Thus, demand for diesel for trucking firms, railroads and agricultural sector is alsodown.
• Many of the large refining projects scheduled to come online over the next two years areconfigured to produce a large yield of middle distillates and thus there will be also pressurefrom the supply side.
• As refiners periodically need to rebalance the gasoline market and draw down inventories,many refineries may be forced to cut runs.
• Another argument for continued relatively tight middle distillate markets is that incrementalworld liquids production will be biased toward lighter liquids such as condensates and naturalgas liquids (NGLs). When refined into products, these NGLs yield mostly naphtha andgasoline–boiling range material, and relatively little middle distillates.
DIESEL MARKET - OVERVIEW

45
Crude Oil’s rally in 2007-2008 was caused by fundamentals, but amplified by
financial flows. Will they also amplify a plunge in prices ?
Strong Economic Growth from Non-OCDE countries;
A better classification for Non-commercial players is absolutely needed;
Loose monetary policy has played a role in shaping the Oil Market;
Upstream: tight now and tighter in the future;
Distillates in the Driver's Seat;
Refiners need to look for a stable and secure oil supply sources;
Complex and integrated refiner: good environment.
FINAL REMARKS

46
0
1000
2000
3000
4000
5000
6000
7000
8000
1965
1967
1969
1971
1973
1975
1977
1979
1981
1983
1985
1987
1989
1991
1993
1995
1997
1999
2001
2003
2005
2007
Argentina Brazil ColombiaEcuador Peru Trinidad & TobagoVenezuela Other S. & Cent. America
LATIN AMERICA: OIL PRODUCTION EVOLUTION
Source: BP Statistics 2008
M bpdThousand bpd

47
LATIN AMERICA: OIL CONSUMPTION EVOLUTION
Source: BP Statistics 2008
0
1000
2000
3000
4000
5000
6000
1965
1967
1969
1971
1973
1975
1977
1979
1981
1983
1985
1987
1989
1991
1993
1995
1997
1999
2001
2003
2005
2007
Argentina Brazil ChileColombia Ecuador PeruVenezuela Other S. & Cent. America
M bpdThousand bpd

48
LATIN AMERICA: REGIONAL CONSUMPTION - BY PRODUCT GROUP
Source: BP Statistics 2008
0%
20%
40%
60%
80%
100%1965
1967
1969
1971
1973
1975
1977
1979
1981
1983
1985
1987
1989
1991
1993
1995
1997
1999
2001
2003
2005
2007
Light distillates Middle distillates Fuel oil Others

49
25%
Sources: DOE (dez/08) and Brazil's National Petroleum Agency (ANP) (jan/09).
CONSUMER PRICES IN BRAZIL AND USA – GASOLINE AND DIESEL
39%
17%
19%
Crude Oil
Refining
Distribution & Marketing
Taxes
62%
16%
22%
Crude Oil
and Refining
Distribution & Marketingand Biodiesel (3%)
Taxes
DIE
SE
L
BrazilUS
56%
1%
24%
Crude Oil
Refining
Distribution & Marketing
Taxes
33%
17%
41%
Crude Oil
and Refining
Distribution & Marketing
Taxes
GA
SO
LIN
E
BrazilUS
9%Ethanol
25%
19%

50
Sources: Brazil's Mines & Energy (MME) Ministry
BRAZIL: DEMAND PROFILE EVOLUTION
0%
20%
40%
60%
80%
100%
19
70
19
72
19
74
19
76
19
78
19
80
19
82
19
84
19
86
19
88
19
90
19
92
19
94
19
96
19
98
20
00
20
02
20
04
20
06
DIESEL FUEL OIL GASOLINE LPG NAFTA JET OTHERS

51
0
500,000
1,000,000
1,500,000
2,000,000
2,500,000
3,000,000
3,500,000
2005 2006 2007 2008
GASOLINE FLEX FUEL ETHANOL DIESEL
BRAZIL: UNIT SALES OF VEHICLES – BY FUEL
Source: ANFAVEA
49% 74%82%
82%

52
GASOLINE
34 51 56 43 34 48 46 6441
2000 2001 2002 2003 2004 2005 2006 2007 2008
DIESEL
99 112 10964 45 36 51 70 89
2000 2001 2002 2003 2004 2005 2006 2007 2008
JET
15 20 17 6 2 6 12 15 25
2000 2001 2002 2003 2004 2005 2006 2007 2008
FUEL OIL
29
10984 102
12698 113
91 73
2000 2001 2002 2003 2004 2005 2006 2007 2008
BRAZIL: SUPPLY AND DEMAND BALANCES
Surplus Deficit
Sources: Brazil's National Petroleum Agency (ANP)
Thousand bpd

53
BRAZIL: ETHANOL EXPORTS
Source: ANP
-
500,000
1,000,000
1,500,000
2,000,000
2,500,000
3,000,000
3,500,000
4,000,000
1998 1999 2000 2001 2002 2003 2004 2005 2006 2007
m³
North America S. & Cent. America Europe Others

54
(Thousand bpd)
BRAZILIAN FAST GROWING DOMESTIC DEMAND…
1,906
3.3% p.a.
3.0% p.a.1,945
2,257
2,876
230 257
326 332 367 419
250 218255
24684 89118
179
738 783
901
1224
112
150
182 202
274
400
214208
107119
2007 2008E 2013E 2020E
Others
FO
Diesel
QAV
Naphta
Gasoline
LPG

55
Tighter especifications for Diesel and Jet Fuel;
Better perspectives for Ethanol market than Biodiesel;
Bunker fuel market is going to marine gasoil path ;
Lack new HCCs due to credit crunch;
Excellent perspectives for distillates in emerging economies considering a recovery
of the global economy;
Gasoil demand is less elastic than gasoline. Few substitutes for diesel in relation to
gasoline. These two factors provide a more resilient demand for the diesel slate.
OTHER IMPORTANT ISSUES TO BE CONSIDERED

56