PRICE COMPARISONS FOR PHARMACEUTICALS: …d1c25a6gwz7q5e.cloudfront.net/papers/154.pdfP.M. Danzon...
31
PRICE COMPARISONS FOR PHARMACEUTICALS: A REVIEW OF U.S. AND CROSS-NATIONAL STUDIES Patricia M. Danzon, Ph.D. The Wharton School University of Pennsylvania April 1999
Transcript of PRICE COMPARISONS FOR PHARMACEUTICALS: …d1c25a6gwz7q5e.cloudfront.net/papers/154.pdfP.M. Danzon...

PRICE COMPARISONS FOR PHARMACEUTICALS:A REVIEW OF U.S. AND CROSS-NATIONAL STUDIES
Patricia M. Danzon, Ph.D.The Wharton School
University of Pennsylvania
April 1999

P.M. DanzonPage 2 of 32July 14,1999
PRICE COMPARISONS FOR PHARMACEUTICALS:A REVIEW OF U.S. AND CROSS-NATIONAL STUDIES
EXECUTIVE SUMMARY
Several recent studies have been undertaken to determine whether pharmaceuticalmanufacturers are taking advantage of older Americans through price discrimination and, if so,whether this is part of the explanation for the high drug prices being paid by older Americans. 1
These studies attempt to measure price differentials for pharmaceuticals between different marketsegments within the US and between the US and Canada or Mexico. Specifically, these studiescollected data on retail prices for the 10 brand name, prescription drugs with the highest annual salesto seniors in 1997 under the Pennsylvania Pharmaceutical Assistance Contract for the Elderly(PACE). The retail prices for the 10 drugs were collected from a sample of 75 pharmacies in sevencongressional districts — 46 independent and 29 chain stores. In the domestic study, retail pharmacyprices to cash-paying customers for these 10 drugs were compared to Federal Supply Schedule (FSS)prices (hereafter, Minority Staff Domestic Report, 1998a).2 The FSS prices are interpreted as pricesto most favored customers, such as large insurance companies and HMOs. For the internationalcomparison, prices for the same 10 drugs were compared in retail pharmacies in a particularcongressional district in the US to retail prices in Canada and Mexico. The study for Maine(hereafter, Minority Staff International Report, 1998b) is illustrative of these cross-nationalcomparisons.3
The Minority Staff Domestic Report reached the following conclusions:
• For these 10 drugs, the average differential between the retail price to cash-paying customers andthe FSS price was 106 percent;
• The average price differential for other non-pharmaceutical consumer products was only 22
percent; • These differentials were attributed primarily to manufacturer pricing policies, not to drugstores.
The Minority Staff International Report for Maine concluded that:
• Average prices in Maine to customers who buy their own drugs are 72 percent higher than theaverage prices in Canada and 102 percent higher than the average prices in Mexico.
• Discounts to preferred customers in the US and abroad result in cost shifting to US retail
customers, including older Americans. 1 Prescription Drug Pricing in the United States: Drug Companies Profit at the Expense of Older Americans,Minority Staff Report, Committee on Government Reform and Oversight, US House of Representatives, September25, 1998.2 Ibid.3 Prescription Drug Pricing in the 1st Congressional District in Maine: An International Price Comparison. Prepared for Rep. Thomas A. Allen, Minority Staff Report, Committee on Government Reform and Oversight, USHouse of Representatives, October 24, 1998.
P.M. DanzonPage 3 of 32July 14,1999
After reviewing the methods and analysis in these two Reports, this study reaches thefollowing conclusions:
• The Minority Staff Reports are based on a small, nonrepresentative sample of products and useseriously flawed methodology. That leads to exaggerated estimates of the magnitude of the pricedifferences both between sectors in the US and between the US and Canada and Mexico.Moreover, the reasons for these differences are misinterpreted. These Reports therefore do notprovide a sound basis for policy prescriptions.
• The Minority Staff Domestic Report is further flawed because it is apples-to-oranges,
comparing prices at different levels of the distribution chain. It compares retail prices (pricescharged by pharmacies) to cash paying customers with ex-manufacturer prices (prices charged bymanufacturers) to federal customers. Retail prices reflect mark-ups charged by retail pharmaciesand wholesalers, in addition to the manufacturer price, whereas the FSS price is a manufacturer-level price. Retail prices overstate ex-manufacturer prices for this sector by roughly 25.7percent.
• Manufacturers are required by statute to give to the largest four federal customers a discount of
24 percent. This federal ceiling price (FCP) -- non-federal average manufacturer price minus 24percent -- effectively becomes the ceiling for the FSS price. My estimate, based on the limiteddata available, is that these two factors alone — distribution margins and statutorily required FCPdiscount -- account for a retail-to-FSS differential of at least 65 percent.
• The median retail-to-FSS differential in the Minority Staff sample is 86.5 percent. Of this, three-
fourths — or 65.4 percent -- can be explained solely by distribution markups and the statutorilymandated discounts. Adding an average discount to private customers of 10-15 percent wouldfully account for the median retail-to-FSS differential in the Minority Staff Reports of 86.5percent.
• The Minority Staff Reports use a small, unrepresentative sample, confined to 10 branded
prescription products with high sales volume, and excludes all generics. This sample is notrepresentative of the range of drugs purchased by US consumers, including the elderly. Rather, theReports appear to have sampled drugs which give atypically large discounts to nonfederalpurchasers. These drugs will therefore have atypically low FSS prices and atypically high retail-to-FSS differentials, because manufacturers are required to give their best price to the FSS.
• The Minority Staff Reports base their conclusions on the simple average differential for these 10
drugs, whereas appropriate price comparisons use a representative sample and weight the productsto reflect their relative importance in overall consumer budgets. An unweighted average of priceratios, as used by the Reports, violates standard principles of price comparisons and leads toresults that are extremely sensitive to the sample used.
• GAO (1994) found that the median best price discount to private customers was 14-15 percent
off the average manufacturer price, based on a study of the effects of the Medicaid best priceprovisions of the Omnibus Budget Reconciliation Act (OBRA 1990). Similarly, CBO (1996)found a weighted average best discount of 19 percent, based on a sample of roughly 800 brandname drugs. This is further evidence consistent with the conclusion here, that the Minority StaffReports exaggerate typical best price discounts to private customers, hence a fortiori exaggerate

P.M. DanzonPage 4 of 32July 14,1999
typical discounts to private customers. • The smaller (22 percent) retail-to-FSS differential found for other consumer products is readily
explained by several factors. First, manufacturers of innovator drugs are required by law to givethe four largest federal purchasers a discount of at least 24 percent off their average price toprivate purchasers. No such mandatory discount applies to other consumer products on the FSSschedule. Second, manufacturers of other products are free to choose whether or not to list theirproducts on the FSS, with no penalty for non-participation other than foregone opportunity forsales to federal purchasers who use the schedule. By contrast, pharmaceutical manufacturers arerequired to list their products on the FSS as a precondition for their products to be reimbursedunder the Medicaid program. Third, retail pharmacy mark-ups are likely to be higher for drugsthan for other consumer products that are subject to more competition from other retail outlets.
• The Minority Staff estimates that the average U.S.-Canada price differential is 72 percent. This
estimate is also seriously upward biased, for similar reasons of biased sample and inappropriatemethods. Our analysis of Canadian vs. US prices in 1992 (Danzon, 1996; Danzon and Kim,1998) concluded that Canadian prices are between 13 percent lower and 3 percent higher thanthe US, depending on the price index used. Our estimates were based on the full sample of allmatching compounds and use standard index number methods, hence are more robust than theMinority Staff estimates based on 10 drugs and unaccepted price index methods. The GAO(1992) study, which concluded that US prices were 32 percent higher than Canada and is cited bythe Minority Staff Reports, similarly used a small and unrepresentative sample and inappropriateindex methods.
• For Mexico, the only available more broad based evidence (NERA, 1998) suggests that prices are
significantly lower in Mexico than in most European countries. This is not surprising, in view ofMexico’s lower per capita income, weak patent protection before 1992 and even thereafter, andmore price sensitive customers.
• Price discounting to managed care in return for increased volume is not limited to pharmaceutical
manufacturers — it is common practice for hospitals, physicians, retail pharmacists, and othersuppliers to managed care purchasers. Like these other suppliers, pharmaceutical manufacturersgrant discounts to managed care and other customers who can move market share.
• Discounting to more price sensitive market segments is also common business practice in other
industries, as evidenced by senior discounts for movie theatres, early bird discounts forrestaurants, and advance purchase discounts on airlines. Such differential prices based on demandsensitivity can increase overall social welfare, particularly in the case of industries withsignificant joint fixed costs and low marginal costs, such as pharmaceuticals, airlines, restaurantsand movie theatres (Danzon, 1998).
• Charging different prices to different market segments does not imply cost shifting, contrary to
the assertion in these studies. Simply economics shows that a manufacturer who serves twoseparate markets rationally determines the price to charge in each of the two marketsindependently. If the markets are separate, giving a discount in one market does not affect theprice charged in the other market.
• If pharmaceutical manufacturers are required by law to charge the same price in all sectors, these
sectors are no longer independent. In this case, if a firm is required to give a best price discountto one sector equal to the lowest price given to the other sector, the result will be to increaseprices in the sectors that previously received the largest discounts. Such a price increase occurred

P.M. DanzonPage 5 of 32July 14,1999
after the enactment of OBRA 1990, which requires best price discounts for Medicaid. Between1991 and 1993, the median best price discount given to HMOs declined from 24 percent to 14percent, for group purchasing organizations (GPOs) the median best price discount declined from28 percent to 15 percent (GAO, 1994). Similarly, CBO (1996) found that the weighted averagebest price discount declined from 36.7 percent in 1991 to 19.3 percent in 1994.
• Appropriate insurance coverage for the elderly is an important policy issue. The evidence here
and from other sources suggests that coverage could best be provided through choice betweencompeting private sector health care plans, as in Medicare+Choice or the Federal EmployeeHealth Benefits Program. Many of these plans provide savings not only from discounts onmanufacturer prices but also savings on distribution margins and use of mail order, in addition toquality controls. GAO (1997) found that, of the savings to the Federal Employee Health BenefitProgram from use of a pharmacy benefit manager (PBM), roughly 50 percent of the estimated20-27 percent savings resulted from discounts achieved on distribution costs and only 21 percent(of the 20-27 percent) was due to manufacturer discounts. Simply providing an indemnitybenefit, through the traditional Medicare fee-for-service program, would exacerbate the problemof inelastic (price-insensitive) demand in the retail sector.
• The proposal in HR 664, to require sales to retail pharmacies at the lowest prices available to
federal government purchasers, is likely to result in higher prices to managed care and othernonfederal buyers, as occurred following OBRA 1990. Moreover, since this approach does notincrease the price-sensitivity of retail customers and does not require retail pharmacies to lowertheir prices, this approach does not assure that any reduction in ex-manufacturer prices accrues tocustomers as lower prices, rather than accruing to pharmacies as higher retail margins.
P.M. DanzonPage 6 of 32July 14,1999
PRICE COMPARISONS FOR PHARMACEUTICALS:A REVIEW OF U.S. AND CROSS-NATIONAL STUDIES
1. Introduction
Several recent studies have been undertaken to determine whether pharmaceuticalmanufacturers are taking advantage of older Americans through price discrimination and, if so,whether this is part of the explanation for the high drug prices being paid by older Americans. Thesestudies attempt to measure price differentials for pharmaceuticals between different market segmentswithin the US and between the US and Canada or Mexico. Specifically, these studies collected data onretail prices for the 10 patented, nongeneric drugs with the highest annual sales to seniors in 1997under the Pennsylvania Pharmaceutical Assistance Contract for the Elderly (PACE). In the domesticstudy, retail pharmacy prices to cash-paying customers for these 10 drugs were compared to FederalSupply Schedule (FSS) prices (Minority Staff Domestic Report, 1998a). The FSS is a price catalog forpurchases by federal agencies. The FSS prices are interpreted as prices to most favored customers,such as large insurance companies and HMOs. The retail prices for the 10 drugs were collected froma sample of 75 pharmacies in seven congressional districts — 46 independent and 29 chain stores. Forthe international comparison, prices for the same 10 drugs were compared in retail pharmacies in aparticular state in the US to retail prices in Canada and Mexico. The study for Maine is discussed here(Minority Staff International Report, 1998b).
The domestic Report concluded that for these 10 leading drugs, the average differentialbetween the retail price to cash-paying customers and the FSS price was 106 percent. The averageprice differential for other, non-pharmaceutical items sold in pharmacies was only 22 percent. Thesedifferentials were attributed primarily to manufacturer pricing policies, not to drugstores.
The international Report concluded that average prices in Maine to customers who buy theirown drugs are 72 percent higher than the average prices in Canada and 102 percent higher than theaverage prices in Mexico. Both the domestic and the international studies conclude that discounts topreferred customers in the US or abroad result in cost shifting to US retail customers, including olderAmericans.
The purpose of this study is to review two examples of these Minority Staff Reports, oneDomestic and one International. All the Reports use similar methods and reach similar conclusions. Hence this study applies to them all. The main conclusion here is that the Minority Staff Reports arebased on flawed methodology that leads to seriously upward biased estimates of the price differencesbetween sectors in the US and between the US and Canada and Mexico. Both Reports are based on asmall, unrepresentative sample of branded dugs; it also excludes generics. The Reports use methodsthat ignore standard principles of price indexes and lead to unreliable results. The domestic study isfurther biased by comparing prices at different stages of the distribution chain. It compares retailprices (prices charged by pharmacies) to cash paying customers with ex-manufacturer prices (pricescharged by manufacturers) to federal customers. Retail prices reflect mark-ups charged by retailpharmacies and wholesalers, in addition to manufacturer prices, whereas the FSS price is amanufacturer-level price. The resulting estimates of the magnitude of the price differences bothwithin the US and between the US and Canada and Mexico are seriously upward biased. The Reportsignore other evidence from two studies based on much larger samples — GAO (1994) and CBO (1996)— which show median best price discounts of 14-15 percent and weighted average best price discounts

P.M. DanzonPage 7 of 32July 14,1999
of roughly 19 percent. Further, the Reports focus on pharmaceuticals, ignoring the fact thatdiscounting is common for all medical services sold to managed care and is also common in otherindustries. The competitive benefits to consumers from discounting are also ignored.
In this paper, Section 2 summarizes standard principles for measuring price differences forpharmaceuticals. Section 3 reviews the domestic retail-to-FSS comparison (Minority Staff Report,1998a). Section 4 reviews the comparison of US prices with prices in Canada and Mexico (MinorityStaff Report, 1998b). Section 5 discusses the economic basis for discounting in health care in generaland pharmaceuticals in particular, including the cost-shifting argument. Section 6 comments brieflyon policy implications.
2. Measuring Price Differences for Pharmaceuticals: General Principles
The Minority Staff Reports violate basic principles for performing price comparisons. Thecomparison of prices between different markets, different countries or different time periods posesmethodological challenges that have been addressed in extensive economic literature on priceindexes.4 (certain widely accepted principles for price comparisons are applied by the US Bureau ofLabor Statistics in its calculation of price indexes, and by the analogous statistical agencies in mostother countries.)
2.1 Sample Selection
In order to draw valid conclusions about the average price level for drugs to consumers indifferent markets, the sample must include a representative market basket of the drugs consumed.This can be achieved by taking a random sample or stratified random sample. Where the comparisonis between two quite different markets — say, the US and Mexico -- the sample should be selected tobe representative of both markets under comparison.
Life Cycle. In the case of pharmaceuticals, it is important to draw products from allstages of their product life, since prices can vary significantly over the life of a product and this life-cycle price profile differs across countries. For example, Berndt et al. (1993) found that the USproducer price index (PPI) for drugs was significantly upward biased due to disproportionaterepresentation of drugs in the middle years of their life cycle and under-representation of newproducts and generics. The sample should also be representative of the mix of dosage forms,strengths and packs for the products included, since the mix of forms and packs differs significantlyacross countries, reflecting regulatory, medical and cultural differences.
Generics A further requirement for a representative sample for pharmaceuticals is thatit include generics as well as branded originator compounds. Generics accounted for 46 percent ofscripts in the US in 1998, whereas generic penetration is lower in many other countries.5 Sincegenerics offer consumers a lower price alternative to branded products, the exclusion of genericsbiases upward the estimate of the average price level in a country with relatively high genericpenetration and relatively low generic prices, such as the US. A similar logic argues for includingover-the-counter (OTC) drugs, which do not require a doctor’s prescription, where these offer asubstitute for prescription products. Since both the market share and relative prices of generic and
4 See, for example, Diewert (1987) and references therein.5 The US figure is from IMS America. In particular, generic market share is negligibly small in countries with strictprice regulation for branded products, such as France and Italy.

P.M. DanzonPage 8 of 32July 14,1999
OTC products differ systematically across countries in ways that are related to the regulatory regime,valid conclusions about the effects of regulation on prices must be based on samples that includegenerics and OTCs.
Sample Selection Bias in the Minority Staff Reports The Minority Staff Reports are basedon a sample comprised of the ten patented, nongeneric drugs with the largest annual sales to olderAmericans in 1997, as reported by the Pennsylvania Pharmaceutical Assistance Contract for theElderly (PACE) program. PACE is a prescription drug assistance program for low-income seniors inPennsylvania. PACE has a formulary of covered drugs, which are presumably selected based in parton the size of the rebate offered to PACE by manufacturers.
This sample selection violates principles of random selection and is likely to besystematically biased for several reasons. Third, since the selection criterion is products with thehighest annual sales, by dollar value, not by number of prescriptions, the sample is biased towardsproducts with relatively high prices, other things equal.
Second, the selection criterion admits only patented drugs, even though generics account for46 percent of prescriptions countrywide. First, by focusing on leading products sold under a formularysuch as PACE, the sample is likely to consist disproportionately of mature products that tend to giverelatively large discounts. Simple economics predicts that manufacturers would give larger discountsto get on formulary for mature products that have several close competitors and are nearing the endof their patent life, than for newer products, particularly to a large formulary. CBO (1996) providessome evidence consistent with this. This conjecture, that this sample is biased towards products thatgive relatively large discounts, is supported by the evidence below. To the extent that this sample isbiased towards products that give atypically large discounts, the estimates of retail-to-FSS pricedifferentials for this sample overstate typical differentials, because large discounts to nonfederalpurchasers such as PACE lead to lower FSS prices, as described below.
2.2.Matching drugs across markets
Ideally, prices should be compared for products that are identical in all relevant respects inthe different markets -- same active ingredient, same manufacturer, same brand name, same dosageform, strength and packsize. In practice, a given compound is often produced by differentmanufacturers in different countries, due to licensing and generic entry; most products are available inseveral dosage forms, strengths and packsizes, which also differ across countries. Given thisheterogeneity in the product range, applying strict matching criteria excludes many products fromthe comparison and hence makes it unrepresentative. Thus there is a trade-off. If strictcomparability is required along all possible dimensions (chemical composition, manufacturer, dosageform, strength, pack-size) the sample of drugs that can be included in the comparison will be a verysmall and non-representative subset of the range of medicines that is available to consumers in eachcountry. In particular, the requirement of matching manufacturer or brand is counterproductive,because it limits the comparison to compounds sold internationally by subsidiaries of multinationalcompanies. It automatically excludes most generics and licensed products.
The preferred approach is therefore to compare the price of the molecule, computed as thevolume-weighted average of prices charged by all manufacturers of the compound, includingoriginator, licensees and generic manufacturers (Danzon and Kim, 1998). This implicitly assumesthat generics are perfect substitutes for the innovator brand. Although this assumption may be toostrong in some cases, it is less misleading than the assumption that generics are not substitutes, whichis implied by omitting generics from the comparison, as the Minority Staff has done. Indeed, treatinggenerics as perfect substitutes for brands is consistent with the reimbursement practices of most
P.M. DanzonPage 9 of 32July 14,1999
managed pharmacy benefit programs and Medicaid in the US and with public payers in Canada,Germany and the UK.
2.3 Retail vs. Wholesale vs. Manufacturer Price
In principle, prices for pharmaceuticals can be measured at three points on the distributionchain: the ex-manufacturer price is the price at which the manufacturer sells to the wholesaler; theex-wholesale price is the price at which the wholesaler sells to the retail pharmacy; and the retailprice is the price at which the pharmacy sells to the consumer. Thus the retail price differs from theex-manufacturer price due to the wholesale and retail distribution mark-ups. Value added taxes furtherwiden the gap in some countries. In practice, true transactions prices may not be readily observablebecause of discounts related to volume, cash payment, etc., and because manufacturer prices,wholesale and retail markups may differ by class of customer, product and location.
In general, because retail prices include significant distribution markups that differ acrossmarkets and between products within some markets, comparisons of retail prices do not provideaccurate measures of differences in ex-manufacturer prices. If comparisons are to be made at retailprice levels, as the International Report purports to do, then information on the wholesale and retailmargins is also required, if these retail price comparisons are to serve as a basis for valid inferencesabout differences in ex-manufacturer prices.
The Domestic Report is an apples-to-oranges comparison, because it compares retail pricesto cash customers with the FSS price which is an ex-manufacturer price. This is discussed in detail insection 3.1 below.
2.4 Price and Volume Measures
There are several possible measures of quantity for pharmaceuticals, each with acorresponding measure of price — for example, price per pack, price per pill or dose, price per dailydose, price per course of therapy, or price per gram of active ingredient. Since countries differ intheir range of dosage forms, packsizes, strengths etc., comparisons are sensitive to the unit ofmeasure used (see Danzon and Kim, 1998).
Moreover, a comparison that is based on price for a single strength/dosage form/pack sizethat is common in the US does not provide an accurate measure of price per course of therapy onaverage in the US or in the comparison countries, because price per pill and price per pack vary withpack size within and across countries. In particular, price per pill tends to decrease as packsizeincreases and price per gram tends to decrease with average strength. Some countries, including theUS and Canada, permit distribution in very large packs to pharmacists who then split the packs forretail distribution. Other countries which do not permit pharmacists to split packs have much smalleraverage packsize, which tends to mean higher price per pill, since price per pill is typically lower inlarger packs.
The Minority Staff Reports compare price for a single strength of a single form (tablets) andpack size that is supposedly typical for the US. The largest US packs, which have lowest price perpill, were apparently not used in these studies. For drugs that were included in the 1992 GAOcomparison of prices in the US and Canada, the Reports use the same pack; for drugs not included inthe 1992 GAO study, they used the dosage, form, and package size common in the years 1994through 1997. No information is given about how a price was estimated for the comparison

P.M. DanzonPage 10 of 32July 14,1999
countries if comparable packs were not available or were atypical. The 1992 GAO study used a largerpack size in Canada than in the US, which contributed to the upward biased estimates of US-Canadaprice differentials in that study. Similar bias probably applies to the Minority Staff Reports (1998a,b), but no information is given.
2.5 Standard Price Indexes: Weighting of products
Accurate comparison of the cost of medicines to consumers in different markets requiresweighting the prices of different products in the market basket to reflect their relative importance inoverall expenditures. When the relative importance of different medicines differs considerably acrosscountries, there is no unique best weighting scheme. The analyst should choose the weights mostappropriate to the context and question at issue.
The economic literature on price measurement has developed several standard price indexes,each of which reflects different assumptions and results in a different measures of cross-country pricedifferences. In the context of a bilateral international price comparison between, say, Canada and theUS as a base, the Laspeyres index weights each price by the volume of the US6. The Paasche indexuses Canadian weights. The Fisher index is the geometric mean of the Laspeyres and Paasche indexes.If the current policy question is, What would be the cost of medicines to US consumers if they facedCanadian prices?, then a Laspeyres index that uses US consumption weights is appropriate. Thisimplicitly assumes that US doctors and consumers would be unlikely to switch to Canadianconsumption patterns, even if faced with Canadian prices, at least in the short run.
The Minority Staff Reports base their conclusions on the simple average of the price ratios,expressed as a percentage of the lower price, for the 10 products. There is no weighting for volumedifferences. This unweighted average is inconsistent with basic principles of index numbers (seeDiewert, 1987). This simple average is extremely sensitive to the particular items in the sample. For example, in the 10 drug sample, if the two largest numbers are omitted, the average differentialdeclines from 106 percent to 83 percent. Conversely, if the calculation includes two other drugs forwhich differentials of 1,407 percent and 584 percent are reported, the average differential increasesfrom 106 percent to 254 percent! Clearly, the sample and methods used here do not provide a robustmeasure of average price differences.3. The US Retail vs. FSS ( Best Price ) Comparison
3.1 Retail vs. Ex-Manufacturer Prices
The Minority Staff Domestic Report (1998a) compares the retail pharmacy price, as ameasure of price to cash-paying customers, including seniors, to the Federal Supply Schedule (FSS)price, as a measure of best price to large insurance companies and HMOs . This comparison isinappropriate because these prices are at different levels of the distribution chain. The price to cashcustomers is a retail price, hence it reflects wholesale and retail markups on top of the manufacturerprice. By contrast, the FSS price is an ex-manufacturer price.7 The Minority Staff Report (1998a)acknowledges but dismisses this issue, arguing that pharmacies appear to have relatively small
6 The volume weight corresponds to the measure of price. For example, if the price measure is price per gram, thewieght is number of grams; if the price is price per dose, the weight is number of doses sold.7 The FSS prices are apparently reported net of a mandatory 0.5 percent Industrial Funding Fee that reimburses theVA for the costs of operating the Federal Supply Schedules Programs and recoups its operating costs from orderingactivities (U.S. Code Section 552.238.77).

P.M. DanzonPage 11 of 32July 14,1999
markups between the prices at which they buy prescription drugs and the prices at which they sellthem (p. 7). The Report cites two pieces of evidence to support this conclusion: The average retailprice for the ten most common drugs was only 4 percent higher than the published national AverageWholesale Price, and only 22 percent higher than the price available directly from one largewholesaler .
In fact, distribution markups are a significant contributor to the differences between retail andFSS prices. Contrary to the assertion in the Reports, the Average Wholesale Price (AWP) does notmeasure the average transactions price charged by wholesalers — the name is misleading. The AWP isa list price published by a pricing service. It serves as a benchmark from which pharmacyreimbursement and discounts are calculated, but actual average wholesale prices are significantly belowthe AWP. For example, a leading text on managed care states that managed care plans reimbursepharmacists at AWP minus 10-17 percent (Kongstvedt, 1996), which reflects the fact thatpharmacists can acquire products at prices substantially below AWP. Similarly, 1997 HMOreimbursement rates to network pharmacies used an average discount off AWP of 14.2 percent, witha range of 10-20 percent (Emron, 1998 Managed Care Pharmacy Director CUE Program). ThusAWP significantly overstates the price at which pharmacies can purchase drugs.
A more plausible measure of the retail markup is obtained using the 22 percent markup overprices charged by the single wholesaler (McKesson) sampled in the Report. Differences in ex-wholesale prices charged by different wholesalers are probably small, since the wholesale sector ishighly competitive. Thus a plausible assumption is that the 22 percent markup is representative ofthe average retail markup over the wholesale price. Consistent with this, a study of 5 leading drugs inMinnesota found that retail prices were 26 percent higher than pharmacies Wholesale AcquisitionCost. Thus the 22 percent retail markup used here may be conservative.
In addition, to obtain the ex-manufacturer price the wholesale margin must also be subtracted.This is typically roughly 2-4 percent of the average manufacturer s price (AMP).8 Using thesemeasures, if the average manufacturer s price (AMP) is 100, the ex-wholesale price is 103 and theretail price is 125.7 (100 x 1.03 x 1.22). Thus retail prices overstate the ex-manufacturer pricesrealized in the retail segment by roughly 25.7 percent.
3.2 The Federal Supply Schedule (FSS)
The federal supply schedule (FSS) for pharmaceuticals is a price catalog for purchases byfederal agencies, including the Department of Veterans Affairs (VA), the Department of Defense, thePublic Health Service, the Coast Guard and the Indian Health Service. The VA is the largest singlepurchaser, accounting for 71 percent of purchases from the pharmaceutical FSS in fiscal year 1996(GAO, 1997). It is also responsible for negotiating the FSS prices with drug manufacturers. Under theVeterans Health Care Act of 1992 (P.L. 102-585-sec.603), manufacturers of innovator drugs — singleand multiple source -- must make their products available on the FSS in order for their products to beeligible for reimbursement by Medicaid. Thus manufacturers face a significant economic penalty forfailure to participate in the FSS. This in turn gives the VA leverage in negotiating FSS prices.
Under GSA procurement regulations, the VA in negotiating prices for the FSS must seek aprice that represents the same discount off a drug s list price that the manufacturer offers its most-
8 The average manufacturer price AMP is typically roughly 2 percent below the manufacturer s list price, due todiscounts routinely given to wholesalers.

P.M. DanzonPage 12 of 32July 14,1999
favored nonfederal customer under comparable terms and conditions (GAO, 1997, p. 6, citing 48C.F.R. sec. 538.270). To determine this best price, manufacturers are required to submit acommercial sales practices (CSP) form, which provides information on prices, terms and conditions,by product, charged to different customers. Whether a particular customer is consideredcomparable to the VA may be subject to negotiation and depends on various factors, including the
terms and conditions of the commercial sale.
The Veterans Health Care Act also requires manufacturers of innovator drugs to sell theseproducts to four agencies -- the VA, DOD, the Public Health Service and the Indian Health Service --at a discount of at least 24 percent off their non-federal average manufacturer price (NFAMP). Anexcess inflation rebate is also required, equal to the percentage by which the price increase for thisdrug has exceeded the CPI in the prior period. Thus the federal ceiling price (FCP) is equal toNFAMP x 0.76 x (1 — p), where p > 0 is the excess inflation rebate. The NFAMP is a weightedaverage price for all non-federal classes of trade for each dosage form and strength paid bywholesalers, net of any cash discounts and chargebacks given to wholesalers. Thus discounts to allprivate customers are reflected in the NFAMP if these discounts are given directly to wholesalers.Omitted from the NFAMP are rebates that are given directly to final purchasers, such as a rebategiven to a large HMO contingent on demonstrated market share performance. This mandatoryfederal ceiling price (FCP) discount applies to innovator products even after patent expiration.There is no FCP for generic products.
For innovator products, the FSS price may in theory be higher or lower than the FCP,depending on whether the best price to a comparable non-federal customer is less or greater than themandated FCP discount. However, if the FSS price exceeds the FCP, the VA, DOD, PHS and IndianHealth Service, which account for the great majority of FSS sales, would pay only the FCP. Thus theFCP tends to act as a ceiling on the FSS price. Thus, the FSS price tends to be the lower of: (1) thefederal ceiling price, which is NFAMP x 0.76 x (1 — p); or (2) the lowest price given to a comparablenonfederal purchaser.
The evidence from a recent GAO report indicates that, for the majority of originatorproducts, the FSS price is determined by the FCP mandated discount. In a review of FSS pricesrelative to FCP for Schedule Drugs as of September 30, 1996, GAO (1997) found that about 73percent of products -- mostly generics -- were not subject to FCP. Although these FCP-exemptproducts account for a large fraction of products (a product is a single dosage form/pack), theyaccount for only roughly 25 percent of sales to the VA. The remaining 27 percent of products,which account for about 75 percent of sales, are subject to FCP. These are the innovator productsthat are the subject of the Minority Staff Reports (1998a, b). Of these innovator products, 72percent percent (or 19.3 percent of all products) had an FSS price at or above the FCP, implying thatthe best price to private customers was less than the mandated FCP.9 Only 8 percent of products (28percent of innovator products) had FSS price below FCP, hence had best prices to private customersthat were lower than the mandated FCP, defined by a discount of 24 percent plus excess inflation offNFAMP. These products with FSS less than FCP were on average 52 percent below the NFAMP, asof Sept.30, 1996 (GAO, 1997, footnote 17).
Moreover, simple economics predicts that most private discounts are no greater than theminimum Medicaid-mandated discount of 15.1 percent off AMP, because any larger discount would
9 For most of these products with FSS above FCP (72 percent) the differential was less than 1 percent and probablydue to the fee for the VA s administration of the FSS (GAO, 1997, p. 15 and footnote 17).

P.M. DanzonPage 13 of 32July 14,1999
also have to be given to Medicaid. The Omnibus Budget Reconciliation Act of 1990 (OBRA) tried toreduce Medicaid s prescription drug costs by requiring that manufacturers give state Medicaidprograms a discount equal to the greater of: (1) a fixed percentage (12.5 percent in 1991-2, 15.7percent in 1993, 15.4 percent in 1994, 15.2 percent in 1995 and 15.1 percent thereafter) off theAverage Manufacturer Price (AMP) to wholesalers for distribution to the retail class of trade; and (2)the best price given to any private customer. This matching requirement greatly increases the costto manufacturers of giving discounts in excess of 15.1 percent to private customers. Giving adiscount greater than 15.1 percent to a private customer would increase net revenue only if theadditional private volume induced by the discount offset the lower price per unit on those privatesales and the loss of revenue due to lower price per unit on sales to Medicaid. Since Medicaid accountsfor 11 percent of sales on average, the Medicaid volume would usually be several times larger thanany incremental private volume induced by the discount, making such discounting in excess of 15.1percent off AMP rarely worthwhile.
The evidence from GAO (1994) and CBO (1996) is consistent with this prediction fromsimple economics, that requiring manufacturers to give their best price discount to Medicaid wouldreduce the discounts offered to private customers to the mandatory minimum discount of 15.1percent. In a study of the effects of OBRA 1990, GAO (1994) found that, between 1991 and 1993,the median best price discount given to HMOs declined from 24.4 percent to 14.2 percent; for grouppurchasing organizations (GPOs) the median best price discount declined from 27.8 percent to 15.3percent.10 Thus by the first quarter of 1993, the median best price discount to private managedpurchasers had fallen to about the minimum rebate required by OBRA of roughly 15 percent of AMP.Similarly, CBO (1996) found that the weighted average best price in a sample of roughly 800 brandname products declined from 36.7 percent in 1991 to 19.3 percent in 1994 (see Table 1). Althoughthis evidence is from 1993 and 1994, it is likely to be still relevant today, since the Medicaid bestprice provisions are unchanged.
CBO (1996) notes that best price discounts on some products may still exceed 15.1 percentfor several reasons. Larger discounts are more common for products with several competitors thanfor recently launched, single source products; for products with relatively small sales to Medicaid; andproducts to certain end users, such as academic medical centers.
The evidence that median best price discounts given to private customers are roughly 15percent of the average manufacturer price to the retail sector, hence much smaller than the 106percent average differential cited by the Minority Staff Reports, is further supported by estimates ofsavings achieved by pharmacy benefit management companies (PBMs). PBMs act on behalf ofinsurance companies, HMOs and self-insured employers to manage the pharmacy benefit. Thisincludes negotiating discounts on drug prices with drug manufacturers and discounts on retailpharmacy margins with pharmacies who participate in the network. In a study of the effect of PBMsfor the Federal Employee Health Benefit Program (FEHBP), GAO (1997a) estimated that PBMsreduced total pharmacy benefit costs by 20-27 percent, relative to what those costs would have beenwithout the PBM. Of this total saving, the share attributed to manufacturer discounts was at most 21percent, or 4-6 percent of total pharmacy benefit costs. A much larger share (52 percent of thesaving, or 10-14 percent of total costs) was attributed to retail and mail order pharmacy discounts;maximum allowable cost (MAC) reimbursement for multisource compounds was the third largest
10 The median is the midpoint of a distribution, such that half the observations fall below and half above thispoint.

P.M. DanzonPage 14 of 32July 14,1999
source of savings, yielding 14 percent of the total saving.11 These figures for the FEHBP are similarto conventional wisdom on savings from PBMs. These quite modest savings are further evidence thatthe Minority Staff estimate of manufacturer discounts of 106 percent is grossly exaggerated as ameasure of typical discounts.
These are several reasons why manufacturers may be willing, in some circumstances, toaccept an FSS price that is low relative to much of their private business for several reasons. First,they are required by law to offer their products on the FSS, if they wish to receive reimbursementfrom Medicaid. Thus the choice is between foregoing all VA, DOD and Medicaid reimbursement oraccepting the price offered for the FSS. Since Medicaid accounts for 11 percent of sales on averageand the FSS sales are an additional 1-2 percent, refusing listing on the FSS would entail a potentiallysignificant loss of sales for many products.12
Second, negotiating to resist a demand for a low FSS price is time consuming and costly, andmay not be a good investment of resources, as long as the FSS accounts for only 1-2 percent of saleson average. If sales at FSS prices were a larger fraction of total sales, manufacturers would surely bemore resistant to large discounts, as noted by several manufacturers during the debate over extendingthe FSS to state and local government purchasers (see GAO, 1997).
Third, many VA hospitals are affiliated with major medical centers and the VA is animportant training ground for young physicians. Roughly 47 percent of medical residents rotatethrough the VA/DOD each year (U.S. Medicine Inc., 1998 Federal Market Facts). Manufacturerswould rationally accept a relatively low price in such circumstances in order to assure widespread useof their drugs by these physicians in training, in the anticipation that these physicians would continueto use these products in their future careers. CBO (1996) argues that relatively large discounts may begiven to medical schools for similar reasons.
A Minority Staff study of 5 leading drugs in Minnesota (Minority Staff, 1999) reports a 124percent retail-to-federal price differential.13 For the federal price, this study used the lowest federalprice available. For 3 of the 5 drugs, this was the FSS price. For one drug the lowest price was the VAformulary price, and for another it was the VA s Blanket Pricing Agreement (BPA) price. Both theVA formulary and the BPA price are prices given in return for preferred status or volumeperformance. Not surprisingly, these are often lower than the FSS price.
3.3 Accounting for the Retail-to-FSS Differential
A simple calculation shows that the statutory 24 percent FCP discount and the retail andwholesale distribution margins account for a retail-to-FSS price differential of 65 percent. Adding ina discount to private customers of 15 percent raises the implied retail-to-FSS differential to 95percent. To see this, recall that the calculation above showed that if AMP is 100, retail price is125.7. Let us make the conservative assumptions that, because of minimal discounting to privatecustomers, the NFAMP is equal to AMP and that the FSS price is equal to the FCP price, with themandated minimum discount of 24 percent off NFAMP. Thus if NFAMP = AMP = 100, FSS is 76.
11 These figures are for the Blue Cross-Blue Shield Plan. The other two plans studied reported even smaller sharesof savings attributable to manufacturer discounts and larger shares attributable to retail and mail order pharmacydiscounts. 12 GAO (1997) reports FSS sales at 1.5 percent of total pharmaceutical sales in the US, citing data from IMS. 13 Prescription drug pricing report: Minnesota s 6th Congressional District. Minority Staff Report, Committee onGovernment Reform, US House of Representatives. April 5, 1999.

P.M. DanzonPage 15 of 32July 14,1999
With these conservative estimates, the implied retail-to-FSS markup is 65.4 percent (1.257 /0.76).Thus the combination of distribution markups and statutorily required discounts together account fora 65.4 percent differential between retail and FSS price (see figure 2).
Alternatively, if we assume an average discount to private payers of 15 percent off AMP,then NFAMP =.85AMP and the implied retail-to-FSS markup is 94.6 percent (1.257 / (0.76 x0.85)). If the average private discount is 10 percent, such that NFAMP = .9 AMP, then the impliedretail-to-FSS markup is 84 percent (1.257 / (0.76 x 0.9)). To the extent that FCP includes an excessinflation rebate, such that the statutory discount off NFAMP exceeds 24 percent, the retail-to-FSSdifferential attributable to solely to distribution margins and legally mandated discounts would belarger. Thus of the median retail-to-FSS differential in the Minority Staff sample of 86.5 percent,three-fourths of this — or 65.4 percent -- can be explained solely by distribution markups and thestatutorily mandated discounts. Adding an average discount to private customers of 10-15 percentwould fully account for the median retail-to-FSS differential in the Minority Staff Reports (see figure2).
In summary, for innovator products, manufacturers are required by law to give a federalceiling price (FCP) equal to 24 percent off the NFAMP plus any excess inflation rebate, or the bestprice given to a comparable customer, whichever is lower. For the majority (72 percent in 1996) ofinnovator products, the FSS price is greater or equal to the mandated FCP, implying that best pricesto most favored private customers are typically above or equal to the FCP. Distribution markups andthe legally mandated 24 percent FCP discount alone imply at least a 65.4 percent retail-to-FSSdifferential, more if there is an excess inflation factor. Adding a 10 percent average discount toprivate buyers implies a 84 percent retail-to-FSS differential . Keeping discounts to private customersno more than 15 percent of AMP would usually be an economically rational strategy, given theMedicaid best price requirement. The evidence (GAO, 1994) confirms that the median best pricediscount fell to roughly 15 percent, following OBRA 1990 as predicted by theory.
To the extent that the drugs in the Minority Staff Report have retail-to-FSS differentialslarger than the level that can be attributed, as shown above, to distribution markups, mandateddiscounts and private sector discounts of up to15 percent, there are at least two possibleexplanations. First, actual retail margins in the sample pharmacies may exceed the average estimateof 22 percent used here. Second, the drugs in the sample may be drawn disproportionately from the28 percent of products that have discounts in excess of the mandatory minimum 24 percent FCPdiscount. This would be consistent with the point made earlier, that by selecting the drugs that hadthe largest sales under the PACE program, the Minority Staff Reports sample disproportionatelyrepresents those drugs that give large discounts relative to other drugs. Thus this evidence tends toconfirm that this is not a random sample. Rather, the study appears to have sampled drugs that giveatypically large discounts, hence have atypically low FSS prices and atypically large retail-to-FSSdifferentials.
3.4 FSS prices for other commodities
The Minority Staff Report (1998a) compares the retail-to-FSS price differential forpharmaceuticals to the price differential on a selection of other consumer items. It concludes thatthe average differential for the other items is only 22 percent, compared to the estimated 106percent for pharmaceuticals.
There are several problems with this comparison. First, as noted above, manufacturers of
P.M. DanzonPage 16 of 32July 14,1999
originator drugs are required by law to give the four largest federal purchasers a discount of at least 24percent off their average price to private purchasers. No such mandatory discount applies to otherconsumer products on the FSS schedule. Second, manufacturers of other products are free to choosewhether or not to list their products on the FSS, with no penalty for non-participation other thanforegone opportunity for sales to federal purchasers who use the schedule. By contrast,pharmaceutical manufacturers are required to list their products on the FSS as a precondition for theirproducts to be reimbursed under the Medicaid program. Thus the penalty for not participating, at themandatory minimum 24 percent discount, is loss of revenue not only from these federal purchasersbut also from the Medicaid program, which accounts for a much larger fraction of sales.
Third, as noted above, the retail mark-ups are a significant fraction of the retail price forpharmaceuticals. Although I have no data on average retail markups for the other consumerproducts, I would expect them to be lower because there is greater competition between retail outletsin supplying other consumer products than in supplying drugs. Moreover, demand for drugs is likelyto be more inelastic than demand for other consumer goods, due to insurance coverage of some cash-paying customers, the essential nature of some drugs, and the fact that prescribing decisions are madeby physicians who are often uninformed or unconcerned about the relative prices of different drugs.Simple economics predicts that if demand for drugs is relatively inelastic, pharmacists wouldrationally charge higher markups on drugs than on other consumer items for which demand is moreelastic.
Given the mandatory FCP discount, the greater penalty on pharmaceutical manufacturers fornot participating in the FSS, and greater distribution markups on drugs, it is not surprising that theretail vs. FSS price differential is greater for pharmaceuticals than for other consumer products.
4. Comparisons with Canada and Mexico
The Minority Staff Report (1998b) compares prices for the same 10, brand nameprescription drugs in the US to prices at a sample of 4 pharmacies in three provinces of Canada andthree pharmacies in one town in Mexico. The Report finds that prices on average are 72 percenthigher in Maine than in Canada, 102 percent higher than in Mexico. It concludes that drugmanufacturers appear to be engaged in cost shifting. They charge low prices to consumers inCanada and Mexico and appear to make up the difference by charging far higher prices to seniorcitizens and other individual consumers in the United States.
There are several reasons why drug prices may be lower in Canada and Mexico. However, thisstudy is based on severely flawed methodology and seriously overestimates the actual averagedifferences.
4.1 Canada
Several factors may contribute to lower drug prices in Canada. First, there is lower exposureto product liability in Canada. Manning (1997) finds that this is a significant factor contributing tohigher prices in the US than Canada. Second, Canada s federal government controls prices of newproducts and post-launch price increases are not permitted to exceed the rate of increase of theconsumer price index (CPI). Third, until recently, these price controls operated under threat ofcompulsory licensing. If a manufacturer did not accept the government s price, the governmentcould force the manufacturer of a patented product to license a generic producer to manufacture theproduct even though this nullified the patent protection. Under NAFTA this compulsory licensing is

P.M. DanzonPage 17 of 32July 14,1999
no longer permitted. However, prices of products that were on the market under the compulsorylicensing regime could still be affected because restrictions on price increases would prevent a catch-up price increase. Fourth, in addition to these federal government controls, some provincialgovernments in Canada operate other control mechanisms, such as the reference price system inBritish Columbia, which may constrain prices below the price permitted by the federal controls.Fifth, retail distribution markups may be lower in Canada than in the cash sector in the US. Precisecomparisons are not possible because retail markups in Canada differ by province and by product.
Although these factors could lead to somewhat lower prices in Canada than in the US, theMinority Staff conclusion, that the average prices that senior citizens (in the US) must pay are 72percent higher than the average prices that Canadian consumers must pay is exaggerated because offlawed methods. First, it is based on a sample of only ten products, all brand name products that areleaders by dollar volume of US sales, hence selected to be relatively high priced, other things equal.The sample excludes all generics, although generics account for over 46 percent of scripts in the USand generic prices are relatively low in the US. The sample also excludes OTC products.
Second, the study generally used the same single dosage, form and package size used by the1992 GAO report comparing prices in the US and Canada, where available. For that study, if the USprice is for the pack of 100 but that pack was not available in Canada, the GAO computed a Canadianprice by linear imputation. For example, the price for a pack of 100 tablets was imputed by dividingthe Ontario government s price for a 1,000 pack by 10. Since in fact price per tablet is typicallylower in larger packs, this methodology results in systematic downward bias in estimates of Canadianprices relative to the U.S. No information is given on the selection of packsize for Mexico, but ifthe same linear imputation was used, then similar bias is likely. Moreover, the same linearimputations were apparently made for strength, which would further bias upward the estimates ofUS/Mexico differentials.
Third, the ten drugs are weighted equally, ignoring differences in market shares. As noted insection 2, these sample selection and weighting procedures are not robust and violate basic principlesof price indexes that are accepted and used not only by academics but also by the Bureau of LaborStatistics and similar statistically agencies in other countries. For example, since the differentials forindividual products range from 23 percent to 136 percent, the overall average is very sensitive toadding or deleting individual drugs from the sample.
The Minority Staff Report states that its finding, that retail prices are 72 percent higher inthe US than in Canada, is broadly consistent with the findings of other analysis. In 1992, GAOlooked at the prices that drug companies charge wholesalers for 121 prescription drugs and found thatthese prices were, on average, 32 percent higher in the US than in Canada. Since the 1992 studywas of ex-manufacturer prices and the 1998 study was of retail prices, if both purport to describe thesame market differentials as the Minority Staff Report, this would imply that retail pharmacymarkups add an additional 40 percentage points in the US compared to Canada! The Report does notcomment on this implication. It also does not comment on the fact that their 72 percent estimate ofthe differential is 125 percent higher than the GAO estimate of 32 percent, contrary to the claimthat the findings are broadly consistent. In fact, the differences between these two estimates arenot surprising. They further illustrate the sensitivity of comparisons to small and unrepresentativesamples, particularly when the comparison is based on an unweighted average, as was used in both ofthe 1998 Minority Staff Report and the 1992 GAO report.14
14 GAO (1992) reported the average price for the market basket in the US to its average price in Canada. It also
P.M. DanzonPage 18 of 32July 14,1999
In order to provide more reliable estimates of international price differences, we constructedprice indexes using standard index number methods applied to a fully comprehensive data on all drugsavailable in the US, Canada and several other major markets in 1992. Using US consumption patternsas the weights, and comparing price per dose, our estimates of foreign prices relative to the US are asfollows:15 Canada +3.0 percent; Germany + 27.3 percent; France — 29.9 percent; Italy —9.3 percent;Japan —7.7 percent; Switzerland +44.4 percent; Sweden + 8.9 percent and the UK —23.9 percent (seeTable 2). Note that these comparisons based on ex-manufacturer list prices do not reflect discountsto managed care, hospitals and government purchasers in the US. Thus these comparisons overstateaverage manufacturer prices in the US relative to the comparison countries.
A major conclusion of our analysis is that measures of international price differences forpharmaceuticals are very sensitive to the unit for measuring price, sample and weights used. Wecomputed the comparisons using price per gram as well as price per dose, using different samples anddifferent weighting schemes. For example, for Japan the estimates range from 28.2 percent higherthan the US, using price per gram and US weights, to 55.2 percent lower than the US, using price perdose and Japanese consumption weights. There is no single right number . However, theseestimates based on the full sample of products and packs, and using standard index number methodsare clearly more accurate than the GAO estimate which was based on an unweighted average of pricesfor 121 drugs, using a single pack per drug and omitting all generics. It is noteworthy that using thisdistorted sample and inappropriate methods, GAO (1992) estimated the US as 32 percent higher thanCanada (or Canada as 24 percent lower than the US), whereas using our fully representative sample,appropriate methods and US consumption weights indicated that Canada was 3 percent higher thanthe US based on price per dose, 13 percent lower based on price per gram (Danzon, 1996; Danzonand Kim, 1998. See also Table 2 below).
4.2 Mexico
Mexico is not an appropriate benchmark for price comparisons with the US for severalreasons. Mexico is at a less advanced stage of economic development, has lower real wages and percapita incomes, and lower prices for many goods and services. A recent study, The Health CareSystem in Mexico (NERA, 1998) reports Mexican average per capita GNP at US$3,670 in 1996 usingmarket exchange rates (US$7,660 at PPP exchange rates, that take into account differences in pricelevels between countries). Per capita expenditure on health care is estimated at 4.7 percent of GDPin 1997, or less than half the percentage spent by the US (13.5) from its much higher per capitaGDP (Anderson and Poulier, 1999). Per capita spending on health care was $391 in 1997 in Mexico,compared to $3,925 in the U.S. Medicines accounted for 28-32 percent of total health care spending(Nera 1998), a higher percentage than in most OECD countries, although comparable to other lessdeveloped countries. By comparison, in 1995 the proportion of health expenditure devoted topharmaceuticals was 8.5 percent in the US; 13.6 percent in Canada; 15.9 percent in the UK and 16.7percent in France (NERA, 1998, p. 77). reported the median of the price ratios.15 These comparisons are based on IMS data for single molecule drugs. The product is defined by molecule and 4-digit anatomical therapeutic category (MOL/ATC), regardless of manufacturer or brand name. The price for a multi-source molecule is the weighted average price over all manufacturers of that compound for a particular 4-digittherapeutic category. The indexes compare price per IMS standard unit, averaging over all packs, strengths anddosage forms of products in the molecule. The IMS standard unit is one tablet, one capsule, 10ml. of a liquid, etc.and is a rough proxy for a dose. This avoids bias that occurs if comparison is limited to a single pack. For moredetail, see Danzon (1996) and Danzon and Kim (1998).

P.M. DanzonPage 19 of 32July 14,1999
The NERA study points out that the range of pharmaceuticals is very different in Mexicothan the US and other developed countries. Anti-infectives ranked first by value in Mexico, whereasthey are about the fourth group in most developed countries. Cardiovasculars, which in 1996 were thetop selling group in developed countries, ranked only fifth in Mexico.
NERA reached the following conclusion on prices for pharmaceuticals in Mexico:
The construction of indices which allow accurate comparisons of pharmaceutical prices indifferent countries is a difficult task. However, it appears that prices in the private sector inMexico are lower than in most OECD countries and some support for this view can be shownby a simple comparison of average pack prices in Mexico and other countries. .Expressedin US$, even in 1995, Mexican prices were less than half European prices in 1993, althoughthe limits to the usefulness of such a calculation (e.g. it may be comparing the prices ofdifferent products or packages) should be acknowledged. (NERA, 1998, p. 84).
NERA correctly emphasizes that conclusions based on this price comparison are tentativebecause it does not standardize for product mix. Nevertheless, it does strongly suggest that Mexicanprices are low relative to a broad average of European prices, not just relative to US prices.
I would expect several factors to contribute to these lower prices in Mexico. First, as notedabove, average per capita income and average spending on health care are much lower in Mexicothan in the US. Second, Mexico did not enact patent protection for pharmaceuticals until the Ley dePatentes of 1991. However, this law did not apply patent protection to originator products alreadyon the market and did not provide for pipeline protection. Thus drugs registered prior to thelegislation remain subject to competition from copy products. Copy products are products whoseproduction could be prevented under the 1991 law, if this had been in effect. Copy products are thusdistinct from generics, which are legal copies introduced after patent expiration. According to NERA:Copy products are mainly a threat for the private sector: it is estimated that 95 percent of the
private market is made up of products that could potentially be copied. The potential or actualexistence of cheap copy products, which do not incur the costs of R&D and informationdissemination borne by originator products, makes demand for originator products more price elastic,which constrains the prices that originator firms would rationally charge.
Third, although in practice medicines are designated as either prescription or non-prescription (OTC) in Mexico, NERA reports that many prescription medicines are thought, inpractice, to be widely available without prescription. If so, price-sensitive consumers can moredirectly influence the choice between drugs than in a system such as the US, where the choicebetween prescription products is made primarily by physicians who may not know or be concernedabout product prices. To the extent that this direct consumer purchase of supposedly prescriptionproducts in Mexico is significant, this would be another factor making demand in the private marketin Mexico more price elastic than in the cash-paying market in the US. Consistent with this, there isanecdotal evidence that retail pharmacists in Mexico compete by offering products at prices belowthe maximum government price that is stamped on the box.
Given the lower income, government use of monopsony power, weaker patent protectionand more price-sensitive consumers in Mexico, it is not surprising that prices are lower. However,since the differentials range from 20 percent to 280 percent (or over 1,000 percent if one otherproduct is included), this small, unrepresentative and unweighted sample does not provide a basis forconclusions on average US/Mexico price differentials.
P.M. DanzonPage 20 of 32July 14,1999
5. The Growth of Price Discounting in Health Care
5.1 Discounting and Managed Care
In recent years, insurance coverage of medical care, including outpatient pharmaceuticals, hasundergone major changes in response to the demand for control of costs. In pharmaceuticals,managed pharmaceutical benefits are replacing the old world of unmanaged prescribing by physicians,in which patient co-payments were the main constraint on spending. Indeed, the management ofpharmacy benefits has spread more broadly than managed care for other health services, as thepharmacy benefit is often carved out and managed even within traditional fee-for-service healthplans.
A managed pharmaceutical care strategy is an efficient response of competitive markets tothe fundamental problem of health insurance. The purpose of insurance is to protect consumers fromthe financial burden of medical expense. But by insulating patients from costs, traditional insurancehas the unfortunate effect of making consumers and providers insensitive to costs. Unrestrictedinsurance thus tends to encourage overuse of medical services, driving up health spending. Theinevitable increase in insurance premiums is paid initially by employers and governments, butultimately these costs must be passed on to employees, consumers and taxpayers.
In response to the demand from consumers and payers for control over rising healthinsurance premiums, insurers compete by developing strategies that control costs in ways that areleast burdensome to patients. Under traditional indemnity insurance, patients and providers hadvirtually unlimited freedom of choice, while insurance passively paid the bill. The only constraint waspatient co-payment, which is a useful but limited cost control strategy. Co-payments operate byreducing the patient’s financial protection. But since financial protection is the reason whyconsumers buy insurance, co-payment reduces the value of the insurance product.
The key characteristic of managed care is the use of strategies other than co-payment tocontrol costs. With managed care, insurance is no longer a passive payment mechanism. Managedcare entities are actively involved in determining the type and terms of services eligible forreimbursement. Whereas traditional insurance targeted incentives to patients through co-paymentrequirements, managed care targets the incentives of providers. A fundamental managed care strategyis to contract with selected, cost-effective providers who agree to accept lower prices and othercontractual terms. Patients are encouraged or required to use these contract providers. Althoughpatients thus forego some freedom of choice, many find this less burdensome than achieving thesame degree of cost restraint through co-payments.
The application of managed care principles to pharmacy benefits entails the use of strategiessimilar to those used in managing other health services. Based on negotiations with the payer, thebenefit manager establishes a formulary of preferred drugs and a network of selected retailpharmacies. Through education, financial incentives and other strategies, physicians and patients areencouraged to use drugs on the formulary. HMOs, PBMs and other entities that managepharmaceutical benefits are able to negotiate discounted prices from manufacturers of drugs that arelisted on the formulary, because on-formulary drugs tend to gain market share relative to unlisteddrugs.16 Formularies can be used to encourage generic substitution (use of a low-cost source of multi-
˚16 The PBM is an intermediary that negotiates and manages the drug benefit, in return for a fee. In many cases the

P.M. DanzonPage 21 of 32July 14,1999
source drugs) and therapeutic interchange (substitution of a low-cost source among therapeuticallysimilar drugs, subject to permission from the prescribing physician). Similarly, patients areencouraged to use network pharmacies that agree to accept discounted margins. The patient thusgives up some freedom of choice in return for lower cost.
The great majority of managed pharmacy benefits use formularies and generic substitutionprograms. Although most generic substitution programs permit members to choose brand-name overgeneric drugs, the patient is typically required to pay the difference or a higher co-payment.Similarly, a higher co-payment may be required for an off-formulary product. Thus to compete withgenerics and with potential therapeutic substitutes, manufacturers of brand name drugs must offerdiscounts or rebates.17
Patients covered by managed care plans are encouraged or required to purchase their drugsfrom a network of contract pharmacies or through mail order. Network pharmacies agree to accept adiscounted retail margin in return for being in the network. Network participants can expect someincrease in volume that is greater, the more restrictive is the network. Network pharmacies aregenerally also required to have computer capability that permits on-line checking of the patient’sinsurance status, monitoring drug use to assure compliance and guard against incompatibilities, etc.
The strategies used for management of pharmacy benefits are thus similar to managed carestrategies for medical services in general. Network pharmacy providers and drug manufacturers agreeto accept lower prices in return for the higher volume that flows to preferred providers and suppliers.
The price discounts negotiated by the pharmacy benefit manager or HMO are ultimatelypassed on to consumers in the form of a lower overall insurance premium or lower co-payments, ormore comprehensive coverage, improved convenience and service, such as on-line verification ofinsurance status and direct billing of the insurance plan. This pass-through of the value of discountsto consumers is sometimes questioned, and indeed it is hard to measure directly. However the mosttelling evidence is the rapid growth of the share of pharmacy benefits that are managed. The growingmarket share of these plans implies that consumers are willing to accept the restrictions on choice inreturn for the cost savings.18 Far from being anti-competitive, price discounting is a competitivestrategy that benefits consumers.
5.2 Common Business Reasons for Price Discounting
Charging different prices to different consumers is a common business practice for manygoods and services, including hospital, physician, retail pharmacy and other medical services. Thereare several reasons for price discounts, including volume discounts to reflect economies of scale, andquality discounts, to reflect differences in service or convenience dimensions of a product or service.For example, restaurants offer early bird discounts to attract customers at a time of day that is lessconvenient for most customers and hence has lower opportunity cost to the restaurant owner.
Perhaps most common are price discounts that may be unrelated to the manufacturer’s costs
PBM does not directly buy drugs.17 For details of managed pharmacy benefit programs, see Novartis (1998).18 Nobel laureate George Stigler first suggested this "survivor" test for relative efficiency (Stigler, 1958). In anycompetitive market, firms whose product or service offers consumers greater value for money will tend to expand theirmarket share, at the expense of firms whose products offer consumers a less desirable trade-off between cost, qualityand convenience.

P.M. DanzonPage 22 of 32July 14,1999
but are driven by differences in price-sensitivity of consumers. Offering a lower price to customerswho are more price-sensitive is designed to increase sales to these customers, without reducingrevenues from the less price-sensitive customers. For example, senior citizen discounts arecommonly offered by movie-theaters, buses, restaurants and some retail pharmacies. Pricediscounting of pharmaceuticals and other medical services closely resembles the discounting to price-sensitive buyers that is widely accepted in so many other markets. It would therefore be anomalous todisallow differential pricing in pharmaceuticals while permitting it for innumerable other goods andservices, including other medical services. Note that a class of customers receives a discount if it ismore price sensitive than other customer classes. Age, student-status, time of day, etc. act as proxiesfor price sensitivity. Thus the business reason for the discounts is the same for pharmaceuticals andother services, even if the class of beneficiaries differ. Seniors are targeted as price sensitivecustomers for many services but not for drugs because it is the physicians, not the patient whotypically makes the product choice for drugs.
The Reports ignore the important economic distinction between discounts based on absolutevolume, which are typically based on scale economies, and discounts based on incremental volume,which are motivated by price elasticity. The rationale for discounts to managed care purchasers ofpharmaceuticals (and other medical services) is incremental volume, not absolute volume.Manufacturers offer discounts to HMO and pharmacy benefit managers in order for their drugs to befavored in the formulary, since formulary drugs tend to gain in market share relative to competitors.Thus discounting is a strategy to gain incremental sales and market share for the discounted drug.
By contrast, if the manufacturer were to offer discounts to one or more independentpharmacies, this might shift market share among pharmacies, if the discount is passed on as a lowerprice to customers, which is not guaranteed. But the discount would have no effect on themanufacturer’s total volume. Total volume sold of any drug depends largely on physicians’ prescribingpatterns, and these are minimally affected by discounted prices to pharmacists. Any increase involume for the manufacturer would require that patients perceive the lower price at the pharmacyand ask their physicians to switch them to the discounted drug. But most patients have littleinformation about the relative price of alternative drugs -- and may not care, if their co-payment is afixed amount per prescription, regardless of the price of the drug. Thus if the same discount wereoffered by a manufacturer to retail pharmacies who sell to the cash sector, this would not have thesame effect as the same discount given for incremental volume to a managed care purchaser who isthereby persuaded to give the product favored formulary status.
It has been suggested that pharmacists could influence physicians to shift their prescribingtowards specific drugs, just as HMOs and other pharmacy benefit managers do. However, suchswitching would be less subject to monitoring to protect the interests of patients. A managed careformulary typically must be approved by the health plan and plan sponsor, following careful reviewby the pharmacy and therapeutics (P&T) committee. This review explicitly attempts to makeappropriate trade-offs between lower cost to the plan and restricted choice for patients, taking intoaccount consumer preferences as reflected in market choices among health plans. Thus the influencethat managed care formularies have over prescribing patterns is exercised subject to market pressuresto assure reasonable quality of medical care and pass-through of savings to consumers. By contrast, ifa pharmacist were to induce a physician to switch to a specific drug, there is no objective review ofthe therapeutic merit of the switch and less assurance that the patient ultimately gets a lower price inreturn for switching.
5.3 Discounts Benefit Consumers
P.M. DanzonPage 23 of 32July 14,1999
Permitting price discounting benefits consumers in two ways. Most obvious is the benefit oflower prices. Sherer (1998) suggests that permitting discounting encourages competition between drugmanufacturers. Standard economic analysis of the welfare effects of price discounting concludes thatconsumers overall benefit if total sales volume increases, which is plausible in the case ofpharmaceuticals. More generally, the managed care revolution depends on the ability of health plansto negotiate discounted rates in return for shifting market share to network providers and suppliers,thereby increasing their volume. Selective contracting in return for price discounts is fundamental tocontrolling costs for hospital and physician services, as well as for pharmaceuticals.
Second, in the case of pharmaceuticals that incur significant costs of R&D, charging differentprices to different markets or countries is consistent with the most appropriate feasible (second bestoptimal) method of paying for the costs of R&D. R&D is a global joint cost that serves allconsumers, in all countries of the world that use the product. This R&D expense cannot be attributedto any single group rather than another. There is no presumption that the best way to recoup thiscost is for all consumers to pay equally. On the contrary, the theory of Ramsey pricing (Ramsey,1927) concludes that in such contexts, charging different prices to different consumers based ondemand elasticity is the most efficient way of covering the joint costs. The application of theseprinciples to price differentials with the US and between different countries is discussed in detail inDanzon (1998).
5.4 Discounting Does Not Imply Cost-Shifting
These studies make the argument, that discounting to some customers leads to higher pricesfor other customers. The source cited for this is a Standard and Poor s Report.19 But this argument isinconsistent with rational self-interested behavior on the part of a firm. Simple economic theoryshows that if a firm serves two separate customer groups, say A and B, that differ in their pricesensitivity, the firm would maximize its overall net revenue by charging different prices in the twomarkets. It would charge a higher price in the market that is less price-sensitive, say market A, otherthings being equal. If demand in market B now becomes more price sensitive, the firm will lower itsprice in that market. But the price to the less price-sensitive market A is unaffected -- indeed, toraise price to group A would actually reduce net revenue, since by assumption it had already set theprice to maximize net revenue in that market. By analogy, increased price-sensitivity in the managedcare market has led suppliers to offer discounts in that market, but this does not affect prices toother customers.
If the manufacturer is required to charge the same price in both markets, then the single pricewill be within the range of prices that would have been charged, had markets been separable. Theevidence from GAO (1994) and CBO (1996) confirms that for similar reasons, the OBRA 1990requirement that manufacturers give a "best price" discount to Medicaid equal to the largest discountgiven to any other private purchaser, led to a reduction in discounts available to HMOs and otherprivate purchasers (see Table 1 and Figure 2).
6. Policy Implications
Appropriate insurance coverage for the elderly is an important policy issue. Roughly two
19 Herman Saftlas, Standard and Poor s, Health Care: Pharmaceuticals, Industry Surveys 19-20. December 18,1997.

P.M. DanzonPage 24 of 32July 14,1999
thirds of seniors do have coverage, either through employer-sponsored or individually-purchasedMedigap coverage; through Medicaid, which covers out-of-pocket expense for seniors with lowincomes; or by choosing an HMO that offers drug benefits, under the Medicare Plus Choice program.A recent study (Health Affairs, 1999) reports that 35 percent of seniors do not have outpatient drugcoverage.
A full analysis of the issue of appropriate outpatient drug coverage for seniors is beyond thescope of this paper. However, if coverage is provided, the evidence here and from other sourcesmakes clear that this should not be simply indemnity coverage, which would make demand in thismarket segment even more inelastic and increase costs. A preferred approach is to give seniors thechoice between competing private-sector health plans that offer a managed pharmacy benefit, as inmany Medicare+Choice options or the Federal Employee Health Benefits Program. Compared totraditional indemnity coverage, a managed pharmacy benefit would yield savings not only fromdiscounts on manufacturer prices but also savings on retail distribution markups and use of mail order,in addition to quality control. As noted above, GAO (1997a) found that of the savings to the FederalEmployee Health Benefit Program from use of a PBM, roughly 50 percent resulted from discountsachieved on distribution costs.
There have been proposals that would extend to the Health Care Financing Administration(HCFA) the ability to contract directly with PBMs or to use other private sector best commercialpractices to provide prescription drugs to Medicare beneficiaries as an add-on to traditionalMedicare. Although this might seem logical, managed pharmacy benefits are more appropriatelyprovided as part of an integrated benefit, as in many private sector health plans. If a pharmacybenefit is simply added to traditional Medicare, it is likely to become one component of traditionalMedicare s current silo-budgeting approach to cost control. Each service component — hospitals,physicians, home-health, pharmacy etc. — would likely tend to be subject to separate budget controls,implemented by fee or price controls, which provides no incentive for providers to seek efficientintegration and mix of medical services.
Another alternative, which has been proposed in HR 664, is to require sales to the retailsegment at FSS prices. By increasing the volume of business at FSS prices but without increasing priceresponsiveness, this proposed approach is likely to result in higher prices to private managed careand to government customers who currently receive discounts, as occurred after enactment of theMedicaid best price provision. Note that this prediction is entirely consistent with the analysis insection 5.4. There it was argued, based on economic theory, that as long as the two market segments— the relatively price-inelastic retail sector and more price-elastic managed care/GPO sector — areseparate, the prices in the two markets are set separately, so giving a discount to the managedcare/GPO sector does not result in a price increase in the retail sector. By contrast, once the retailsector is required to get the same price as the FSS, which is already required to get at least the bestprice given to the managed care/GPO sector, the two markets are no longer separate. A pricediscount given to the managed care/GPO sector must be matched in the retail sector. A manufacturerwould now rationally charge a price based on the weighted average price elasticity in the two sectors.This will be above the previous price to the managed care/GPO sector. Hence tying the retail sectorto the FSS price will result in an increase in prices to managed care/GPO and federal and nonfederalpurchasers. This effect is likely to be large, because of the size of the large size of the retail sector.
The effect of requiring manufacturers to charge the same price in all market segments wasillustrated following the enactment of OBRA (1990), as discussed above. This law tried to reduceMedicaid s prescription drug costs by requiring that manufacturers give state Medicaid programsrebates based on the best price given to other purchasers. Between 1991 and 1993, the median best

P.M. DanzonPage 25 of 32July 14,1999
price discount given to HMOs declined from 24.4 percent to 14.2 percent; for group purchasingorganizations (GPOs) the median best price discount declined from 27.8 percent to 15.3 percent(GAO, 1994). Thus by the first quarter of 1993, the median best price discount to private managedpurchasers had fallen to about the minimum 15 percent rebate required by OBRA, as predicted bysimple economics (Figure 1).
Similarly, the losers from a requirement that retail customers be offered FSS prices would bemanaged care and other federal and nonfederal customers, who would face increased prices. Therestrictions on discounts could also reduce best price rebates to Medicaid and hence increase taxpayercosts of financing the Medicaid program. Pharmaceutical manufacturers would also lose in the shortrun, due to the loss of flexibility to adapt to the more complex market conditions that includemanaged and unmanaged customers. In the long run this would adversely affect incentives forinvestment in innovative products.
Moreover, there is no guarantee that any price decrease to pharmacists would be passed on toretail customers. Since demand in the unmanaged retail market is determined largely by physicians,who typically are unaware of prices charged by retail pharmacists, competition puts little pressureson pharmacists to pass on reductions in acquisition prices to the unmanaged, cash-paying patients.Consistent with this, pharmacists’ margins are often higher for generic drugs than for branded drugs,because they do not fully pass through the lower acquisition cost of generics. Thus a requirement thatretail customers be offered FSS prices would result in a loss to managed care and GPO patients thatwould almost certainly exceed any gain from lower prices to unmanaged retail customers.

P.M. DanzonPage 26 of 32July 14,1999
References
AARP Public Policy Institute and the Lewin Group. 1997. Out of Pocket Health Spending byMedicare Beneficiaries Age 65 and Older: 1997 Projections.
Anderson, G. and J-P. Poulfier. 1999. Health Spending Access and Outcomes: Trends in IndustrialCountries. Health Affairs 15(3): 178.
Berndt, Ernst R. 1994. "Uniform Pharmaceutical Pricing: An Economic Analysis." The AEI Press.Washington D.C.: American Enterprise Institute.
Berndt, Ernst R., Zvi Griliches and Joshua G Rosett. 1993. "Auditing the Producer Price Index: MicroEvidence from Prescription Pharmaceutical Preparations." Journal of Business and EconomicStatistics, vol.11, no. 3.
Danzon, Patricia M. 1998. Welfare Effects of Price Differentials for Pharmaceuticals in the US andthe EU. International Journal of the Economics of Business.
Danzon, Patricia M. 1996. The Uses and Abuses of International Price Comparisons inCompetitive Strategies in the Pharmaceutical Industry ed. R. Helms. Washington D.C. AEI Press.
Danzon, Patricia M. and Jeong D. Kim. 1998. International Price Comparisons forPharmaceuticals: Measurement and Policy Issues. PharmacoEconomics.
Davis, M., J. Poisal, G. Chulis, C. Zarabozo and B. Cooper. Health Affairs. 1999. Prescription DrugCoverage, Utilization and Spending among Medicaid Beneficiaries. Jan/Feb.
Diewert WE. 1987. Index Numbers. In The New Palgrave Dictionary of Economics, Eatwell J.,Milgate M. and P. Newman eds. New York: MacMillan.
Griliches Z, Cockburn I. 1996. Generics and new goods in pharmaceutical price indexes. In R.Helms ed. Competitive Strategies in the Pharmaceutical Industry. Washington D.C. AEI Press.
Kongstvedt, Peter R. 1996. The Managed Health Care Handbook 3rd. ed. Gaithersburg. Aspen.
Manning, R. 1997. Products Liability and Prescription Drug Prices in Canada and the UnitedStates. Journal of Law and Economics 40(1).
National Economics Research Associates (NERA). 1998. The Health Care System in Mexico London: Pharmaceutical Parters for Better Health Care.
Novartis. 1998. Pharmacy Benefit Report: Trends and Forecasts.
Saftlas, Herman, Standard and Poor s, Health Care: Pharmaceuticals, Industry Surveys 19-20.December 18, 1997.
Salomon Smith Barney. 1998. The Search for Value in Global Pharmaceuticals
U.S. Congressional Budget Office (CBO). 1996. How the Medicaid Rebate on Prescription Drugs

P.M. DanzonPage 27 of 32July 14,1999
Affects Pricing in the Pharmaceutical Industry. January 1996.
U.S. General Accounting Office (GAO). 1992. Prescription Drugs: Companies Typically ChargeMore in the United States than in Canada. GAO-HRD-92-110. Washington D.C.
U.S. General Accounting Office (GAO). 1994a. Prescription Drugs: Companies Typically ChargeMore in the United States than in the United Kingdom. Washington D.C. GAO/HEHS-94-29.
U.S. General Accounting Office (GAO). 1994b. Medicaid: Changes in Best Price for OutpatientDrugs Purchased by HMOs and Hospitals . Washington D.C. GAO/HEHS-94-194FS.
U.S. General Accounting Office (GAO). 1997a. Pharmacy Benefit Managers: FEHBP Plans Satisfiedwith Savings and Services, but Retail Pharmacies Have Concerns. GAO/HEHS-97-47.
U.S. General Accounting Office (GAO). 1997. Drug Prices: Effects of Opening Federal SupplySchedule for Pharmaceuticals are Uncertain. GAO/HEHS-97-60.
U.S. House of Representatives, Committee on Government Reform and Oversight, Minority StaffReport, Prescription Drug Pricing in the United States: Drug Companies Profit at the Expense ofOlder Americans, September 25, 1998.
U.S. House of Representatives, Committee on Government Reform and Oversight, Minority StaffReport, Prepared for Rep. Thomas A. Allen, Prescription Drug Pricing in the 1st CongressionalDistrict in Maine: An International Price Comparison. October 24, 1998.
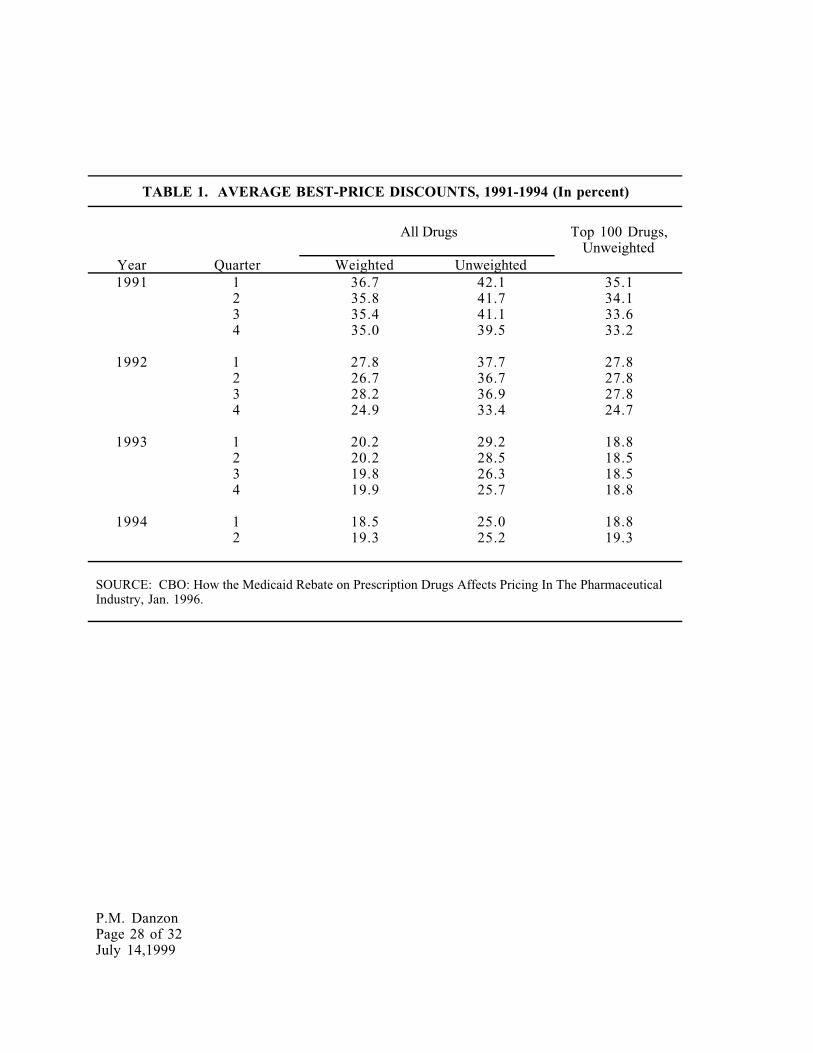
P.M. DanzonPage 28 of 32July 14,1999
TABLE 1. AVERAGE BEST-PRICE DISCOUNTS, 1991-1994 (In percent)
All Drugs Top 100 Drugs,Unweighted
Year Quarter Weighted Unweighted1991 1 36.7 42.1 35.1
2 35.8 41.7 34.13 35.4 41.1 33.64 35.0 39.5 33.2
1992 1 27.8 37.7 27.82 26.7 36.7 27.83 28.2 36.9 27.84 24.9 33.4 24.7
1993 1 20.2 29.2 18.82 20.2 28.5 18.53 19.8 26.3 18.54 19.9 25.7 18.8
1994 1 18.5 25.0 18.82 19.3 25.2 19.3
SOURCE: CBO: How the Medicaid Rebate on Prescription Drugs Affects Pricing In The PharmaceuticalIndustry, Jan. 1996.

P.M. DanzonPage 29 of 32July 14,1999
Table 2. Price Comparisons for All Matching Single-Molecule Drugs, 1992U.S. Weights
price/gram price/dose N
Canada -13.0 +3.0 458
Germany -2.8 +27.3 471
France -43.0 -29.9 412
Italy -26.1 -9.3 406
Japan +28.2 -7.7 396
Switzerland +4.9 +44.4 308
Sweden -18.9 +8.9 261
United Kingdom -32.2 -23.9 453
Source: Danzon, Patricia M. ΑThe Uses and Abuses of International Price Comparisons.≅ In Competitive Strategies in the Pharmaceutical Industry, edited by Robert B. Helms. Washington, D.C.: AEI Press, 1996.
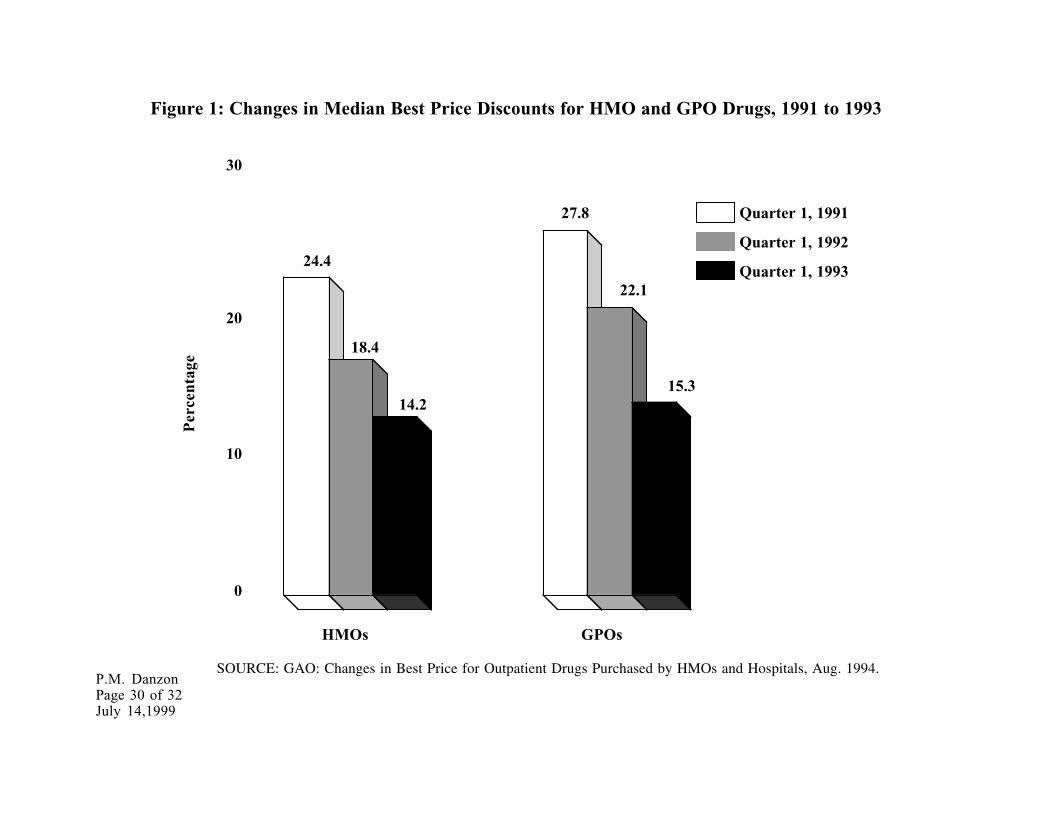
P.M. DanzonPage 30 of 32July 14,1999
Figure 1: Changes in Median Best Price Discounts for HMO and GPO Drugs, 1991 to 1993
HMOs GPOs
0
10
20
30
14.2
27.8
18.4
15.3
22.1
24.4
Per
cent
age
SOURCE: GAO: Changes in Best Price for Outpatient Drugs Purchased by HMOs and Hospitals, Aug. 1994.
Quarter 1, 1991
Quarter 1, 1992
Quarter 1, 1993

P.M. DanzonPage 31 of 32July 14,1999
3%
24%
3%
24%
10%
Figure 2. How Distribution Margins and MandatedDiscounts Contribute To Retail-to-FSS Ratio.
Retail
Wholesale
NFAMP
FCP/FSS
AMPAMP
125.7 125.7
103
100
76
=R 125.7F 76
= 1.654
68
A B
=R 125.7F 68.4
= 1.84
22% 22%