Price $98.47 October 21, 2015 (from $120.00) Equity Analyst … · By 2017, we think the online...
50
USD Prev. 2013A Prev. 2014A Prev. 2015E Prev. 2016E Rev. (MM) -- 7,872.0 -- 12,466.0 -- 17,001.0 22,904.0 24,196.0 EPS Non-GAAP Mar -- 0.12 -- 0.36 -- 0.42A -- -- Jun -- 0.19 -- 0.43 -- 0.50A -- -- Sep -- 0.25 -- 0.43 -- 0.50 -- -- Dec -- 0.31 -- 0.54 -- 0.62 -- -- FY Dec -- 0.87 -- 1.77 -- 1.97 2.68 2.78 FY P/EPS Non- GAAP 113.2x 55.6x 50.0x 35.4x Price Performance OCT-14 FEB-15 JUN-15 OCT-15 100 90 80 70 Target Change USA | Technology | Internet October 21, 2015 Facebook, Inc. (FB) Video Ads and Instagram - Facebook's Next Billion-Dollar Businesses EQUITY RESEARCH AMERICAS BUY Price target $130.00 (from $120.00) Price $98.47 Financial Summary Net Debt (MM): ($14,125.0) Cash/Share: $5.39 5 Yr. Rev. CAGR: 24.0% Market Data 52 Week Range: $99.24 - $72.00 Total Entprs. Value (MM): $286,503.9 Market Cap. (MM): $300,628.9 Shares Out. (MM): 3,053.0 Float (MM): 2,168.3 Avg. Daily Vol.: 32,975,148 Jefferies US Internet Team * Jefferies Equity Research [email protected] Brian Pitz * Equity Analyst (212) 336-7413 [email protected] Brian Fitzgerald * Equity Analyst (212) 284-2491 [email protected] Timothy O'Shea * Equity Associate (212) 284-3415 [email protected] Stan Velikov, CFA * Equity Associate (415) 229-1534 [email protected] Corey Werbelow * Equity Associate (212) 284-2191 [email protected] John Streppa, CFA * Equity Associate (212) 738-5794 [email protected] * Jefferies LLC Key Takeaway We are raising estimates and PT to $130 as we grow increasingly confident around key growth drivers especially Instagram, video ads, & the Audience Network. For Instagram we model base case revs of $531MM in '16, growing to $1.4B in '17. See our detailed analysis starting page 25. We also believe they will become a multi-billion dollar business for FB within the next two years as TV ad budgets shift online. Video ads: the perfect storm. As video consumption explodes across FB's massive user base, we think FB looks well positioned to capture an increasing portion of TV ad budgets as marketers migrate toward data-driven, highly-targeted online video ad campaigns. By '17, we think the online video ad opportunity could be worth ~$17B / year in the US alone. We think Facebook and YouTube look best positioned to capture the bulk of that spend. As such, we believe video ads will become a multi-billion dollar business for FB within the next two years. We are optimistic as Instagram opens up to all advertisers. With its beautiful visual layout & massive (400MM MAUs), highly engaged audience, Instagram looks like a natural ad platform to us. Importantly, Instagram ads will leverage FB's anonymized user data, which nearly ensures these ads will deliver a similar bang-for-your-buck as core FB mobile ads. Our base case 2016 Instagram rev estimate is $531MM, which we grow to $1.4B in 2017. See our analysis and detailed rev build starting p. 25. We are raising estimates as we grow increasingly confident around key go-forward growth drivers especially Instagram, video ads, and the Facebook Audience Network. Also, we note several other growth levers including WhatsApp, Messenger, Oculus, and a mix shift towards pricier ad formats over time (bottom funnel, video). 3Q checks suggest robust growth as expense levels remain the wild card. IgnitionOne noted FB continues to outpace the market in programmatic display during 3Q. Also, AdRoll noted its retargeting clients increased their ad spend on FB by 31% Y/Y, suggesting uptake of FB's Dynamic Product Ads (DPAs) could be robust as we head toward the holiday shopping season. For 3Q, we model $4.31B rev, $3.25B mobile rev, and $0.50 NG EPS vs. $4.37B, $3.24B, and $0.52 consensus, respectively. Valuation/Risks We raise our PT from $120 to $130 on optimism around key go-forward growth drivers. Our PT is based on a 10-year DCF (4% LTGR; 10% WACC). FB trades at ~16x our '16 Adj. EBITDA estimate vs. our 35% 3-year EBITDA CAGR. Risks: User declines. Jefferies does and seeks to do business with companies covered in its research reports. As a result, investors should be aware that Jefferies may have a conflict of interest that could affect the objectivity of this report. Investors should consider this report as only a single factor in making their investment decision. Please see analyst certifications, important disclosure information, and information regarding the status of non-US analysts on pages 46 to 50 of this report.
Transcript of Price $98.47 October 21, 2015 (from $120.00) Equity Analyst … · By 2017, we think the online...

USD Prev. 2013A Prev. 2014A Prev. 2015E Prev. 2016E
Rev. (MM) -- 7,872.0 -- 12,466.0 -- 17,001.0 22,904.0 24,196.0
EPS Non-GAAP
Mar -- 0.12 -- 0.36 -- 0.42A -- --
Jun -- 0.19 -- 0.43 -- 0.50A -- --
Sep -- 0.25 -- 0.43 -- 0.50 -- --
Dec -- 0.31 -- 0.54 -- 0.62 -- --
FY Dec -- 0.87 -- 1.77 -- 1.97 2.68 2.78
FY P/EPS Non-GAAP
113.2x 55.6x 50.0x 35.4x
Price Performance
OCT-14 FEB-15 JUN-15 OCT-15
100
90
80
70
Target Change
USA | Technology | Internet October 21, 2015
Facebook, Inc. (FB)Video Ads and Instagram - Facebook's NextBillion-Dollar Businesses
EQU
ITY R
ESEARC
H A
MERIC
AS
BUYPrice target $130.00
(from $120.00)Price $98.47
Financial SummaryNet Debt (MM): ($14,125.0)Cash/Share: $5.395 Yr. Rev. CAGR: 24.0%
Market Data52 Week Range: $99.24 - $72.00Total Entprs. Value (MM): $286,503.9Market Cap. (MM): $300,628.9Shares Out. (MM): 3,053.0Float (MM): 2,168.3Avg. Daily Vol.: 32,975,148
Jefferies US Internet Team *Jefferies Equity Research
[email protected] Pitz *
Equity Analyst(212) 336-7413 [email protected]
Brian Fitzgerald *Equity Analyst
(212) 284-2491 [email protected] O'Shea *
Equity Associate(212) 284-3415 [email protected]
Stan Velikov, CFA *Equity Associate
(415) 229-1534 [email protected] Werbelow *
Equity Associate(212) 284-2191 [email protected]
John Streppa, CFA *Equity Associate
(212) 738-5794 [email protected]
* Jefferies LLC
Key TakeawayWe are raising estimates and PT to $130 as we grow increasingly confidentaround key growth drivers especially Instagram, video ads, & the AudienceNetwork. For Instagram we model base case revs of $531MM in '16, growing to$1.4B in '17. See our detailed analysis starting page 25. We also believe theywill become a multi-billion dollar business for FB within the next two years asTV ad budgets shift online.
Video ads: the perfect storm. As video consumption explodes across FB's massive userbase, we think FB looks well positioned to capture an increasing portion of TV ad budgetsas marketers migrate toward data-driven, highly-targeted online video ad campaigns. By'17, we think the online video ad opportunity could be worth ~$17B / year in the US alone.We think Facebook and YouTube look best positioned to capture the bulk of that spend.As such, we believe video ads will become a multi-billion dollar business for FBwithin the next two years.
We are optimistic as Instagram opens up to all advertisers. With its beautiful visuallayout & massive (400MM MAUs), highly engaged audience, Instagram looks like a naturalad platform to us. Importantly, Instagram ads will leverage FB's anonymized user data,which nearly ensures these ads will deliver a similar bang-for-your-buck as core FB mobileads. Our base case 2016 Instagram rev estimate is $531MM, which we grow to$1.4B in 2017. See our analysis and detailed rev build starting p. 25.
We are raising estimates as we grow increasingly confident around key go-forwardgrowth drivers especially Instagram, video ads, and the Facebook Audience Network. Also,we note several other growth levers including WhatsApp, Messenger, Oculus, and a mixshift towards pricier ad formats over time (bottom funnel, video).
3Q checks suggest robust growth as expense levels remain the wild card.IgnitionOne noted FB continues to outpace the market in programmatic display during3Q. Also, AdRoll noted its retargeting clients increased their ad spend on FB by 31% Y/Y,suggesting uptake of FB's Dynamic Product Ads (DPAs) could be robust as we head towardthe holiday shopping season. For 3Q, we model $4.31B rev, $3.25B mobile rev, and $0.50NG EPS vs. $4.37B, $3.24B, and $0.52 consensus, respectively.
Valuation/RisksWe raise our PT from $120 to $130 on optimism around key go-forward growth drivers. OurPT is based on a 10-year DCF (4% LTGR; 10% WACC). FB trades at ~16x our '16 Adj. EBITDAestimate vs. our 35% 3-year EBITDA CAGR. Risks: User declines.
Jefferies does and seeks to do business with companies covered in its research reports. As a result, investors should be aware that Jefferies may have a conflictof interest that could affect the objectivity of this report. Investors should consider this report as only a single factor in making their investment decision.Please see analyst certifications, important disclosure information, and information regarding the status of non-US analysts on pages 46 to 50 of this report.

Table of Contents The Perfect Storm: Online Video Ads Page 3
Video Consumption on Facebook is Soaring -- Page 4
Early Video Ad Trends Look Encouraging – Page 5
New Immersive Video Formats – Page 8
Sizing the Video Advertising Opportunity – Page 15 Omnicom Advises Advertisers to Shift 10-25% of TV Ad-Dollars to Online Video – Page 17 Discussions with Media Firms to Produce Professional Videos for FB – Page 17
TV + Online Video Convergence: A Deeper Dive Page 18 A Bit of Background on Gross Rating Point (GRP) Definition and Calculations – Page 19
Traditional GRP to iGRP Translation – Page 20 Practical Example – Online Video Advertising – Page 21 What are the Near-Term Impacts? – Page 23
Instagram: A Picture Perfect Ad Platform Page 25
Sizing Instagram’s Revenue Opportunity – Page 25 Visualizing an Instagram Ad – Page 31
Facebook Audience Network Page 35 Instant Articles Bring High Quality Content Direct to the Mobile Feed Page 36 3Q Checks and Recent KPI Trends Page 38 Raising Estimates Page 40 Facebook Model Page 41 Comp Sheet Page 44
FB
Target Change
October 21, 2015
page 2 of 50 , Jefferies Equity Research, [email protected] US Internet Team
Please see important disclosure information on pages 46 - 50 of this report.

The Perfect Storm: Online Video Ads
Video usage on Facebook is soaring as (portions of) TV ad budgets shift online As video consumption explodes across Facebook’s massive user base, we think the
company looks well positioned to capture an increasing portion of TV ad budgets as
marketers migrate towards data-driven, highly-targeted online video ad campaigns.
From an advertiser’s perspective, FB offers a compelling video ad product defined by:
Massive reach: A global audience of ~900MM+ people each day. A mobile
Super Bowl in the US every single day.
High engagement: FB users are already viewing 4B videos per day.
A clean, well-lit environment: A brand-safe advertising environment.
Best-in-class user data and ad-tech stack: Advertisers can leverage
Facebook’s data-set to run targeted ad campaigns.
By 2017, we think the online video advertising opportunity will be worth ~$17B per year
in the US alone. We think Facebook and Google (YouTube) look best positioned to
capture a meaningful portion of this spend.
The implication here is that video ads should become a multi-billion dollar business for
Facebook within the next two years, with significant upside if TV ad budgets shift online
faster than expected.
Note this new revenue stream won’t be 100% incremental given video ads will displace
other, lower priced ads (as FB keeps ad-loads mostly stable).
We believe video ads will become a
multi-billion dollar business for
Facebook within the next two years.
FB
Target Change
October 21, 2015
page 3 of 50 , Jefferies Equity Research, [email protected] US Internet Team
Please see important disclosure information on pages 46 - 50 of this report.
Video Consumption on Facebook is Soaring
Five years ago, most of the content shared on Facebook was text, plus some photos.
Today it is mostly photos with some text and video.
Over time we expect video will continue to become a (much) more dominant form of
media consumed on Facebook. The numbers bear this out.
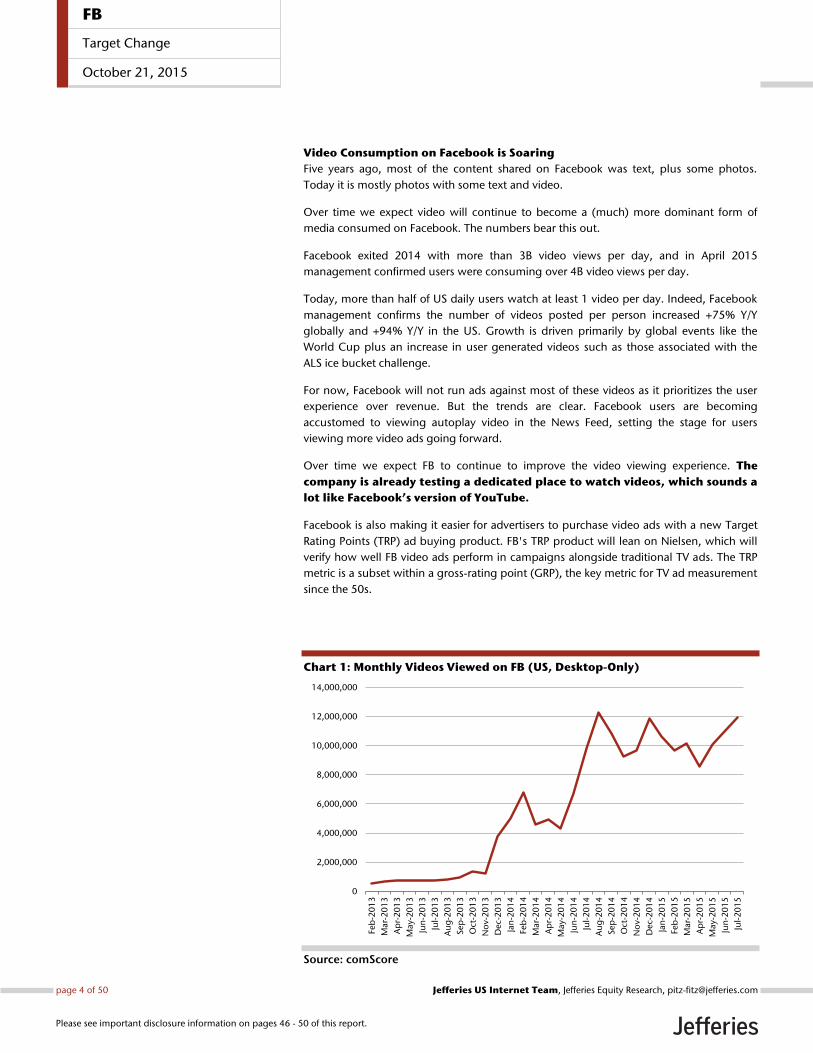
Facebook exited 2014 with more than 3B video views per day, and in April 2015
management confirmed users were consuming over 4B video views per day.
Today, more than half of US daily users watch at least 1 video per day. Indeed, Facebook
management confirms the number of videos posted per person increased +75% Y/Y
globally and +94% Y/Y in the US. Growth is driven primarily by global events like the
World Cup plus an increase in user generated videos such as those associated with the
ALS ice bucket challenge.
For now, Facebook will not run ads against most of these videos as it prioritizes the user
experience over revenue. But the trends are clear. Facebook users are becoming
accustomed to viewing autoplay video in the News Feed, setting the stage for users
viewing more video ads going forward.
Over time we expect FB to continue to improve the video viewing experience. The
company is already testing a dedicated place to watch videos, which sounds a
lot like Facebook’s version of YouTube.
Facebook is also making it easier for advertisers to purchase video ads with a new Target
Rating Points (TRP) ad buying product. FB's TRP product will lean on Nielsen, which will
verify how well FB video ads perform in campaigns alongside traditional TV ads. The TRP
metric is a subset within a gross-rating point (GRP), the key metric for TV ad measurement
since the 50s.
Chart 1: Monthly Videos Viewed on FB (US, Desktop-Only)
Source: comScore
0
2,000,000
4,000,000
6,000,000
8,000,000
10,000,000
12,000,000
14,000,000
Feb
-20
13
Mar-
20
13
Ap
r-2
01
3
May-
20
13
Jun
-20
13
Jul-
20
13
Au
g-2
01
3
Sep
-20
13
Oct
-20
13
No
v-2
01
3
Dec-
20
13
Jan
-20
14
Feb
-20
14
Mar-
20
14
Ap
r-2
01
4
May-
20
14
Jun
-20
14
Jul-
20
14
Au
g-2
01
4
Sep
-20
14
Oct
-20
14
No
v-2
01
4
Dec-
20
14
Jan
-20
15
Feb
-20
15
Mar-
20
15
Ap
r-2
01
5
May-
20
15
Jun
-20
15
Jul-
20
15
FB
Target Change
October 21, 2015
page 4 of 50 , Jefferies Equity Research, [email protected] US Internet Team
Please see important disclosure information on pages 46 - 50 of this report.

Early Video Ad Trends Look Encouraging
While Facebook’s video ad business is in the early stages, early trends look encouraging.
1) Per comScore, on a 3 month rolling basis (Apr – June 2015 vs. 2014), the number of
video ads on Facebook increased +649% Y/Y.
Additionally, the number of video ads viewed per user continues to rise. Currently,
users in the US (desktop only) view ~1.6 ads. This is a low number and should rise
over time; another growth lever.
Chart 2: Video Ads on Facebook (US, Desktop-Only)
Source: comScore
0
500
1,000
1,500
2,000
FB
Target Change
October 21, 2015
page 5 of 50 , Jefferies Equity Research, [email protected] US Internet Team
Please see important disclosure information on pages 46 - 50 of this report.

Chart 3: Video Ad Loads on Facebook (US, Desktop-Only)
Source: comScore
2) According to a Facebook-commissioned Nielsen study, Facebook users are
impacted by video ads even before viewing them for a full second. According to the
study:
Results show that from the moment a video ad was viewed (even before one
second), lift happened across ad recall, brand awareness and purchase
consideration. This means that even people who never watched the video but did
see the impression were still impacted by the ad. And, as expected, lift increased the
longer people watch the ad.
Exhibit 1: Example Facebook Video Ad Unit
Source: Nielsen
1.0
1.1
1.2
1.3
1.4
1.5
1.6
1.7
FB
Target Change
October 21, 2015
page 6 of 50 , Jefferies Equity Research, [email protected] US Internet Team
Please see important disclosure information on pages 46 - 50 of this report.
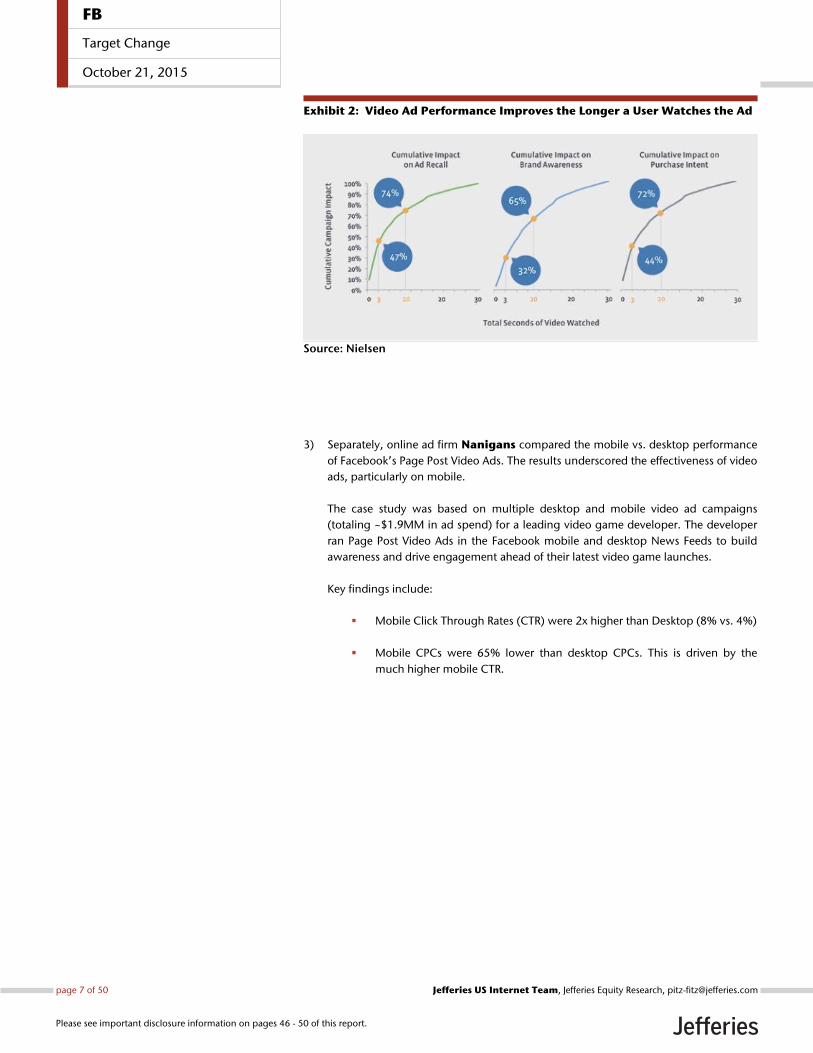
Exhibit 2: Video Ad Performance Improves the Longer a User Watches the Ad
Source: Nielsen
3) Separately, online ad firm Nanigans compared the mobile vs. desktop performance
of Facebook’s Page Post Video Ads. The results underscored the effectiveness of video
ads, particularly on mobile.
The case study was based on multiple desktop and mobile video ad campaigns
(totaling ~$1.9MM in ad spend) for a leading video game developer. The developer
ran Page Post Video Ads in the Facebook mobile and desktop News Feeds to build
awareness and drive engagement ahead of their latest video game launches.
Key findings include:
Mobile Click Through Rates (CTR) were 2x higher than Desktop (8% vs. 4%)
Mobile CPCs were 65% lower than desktop CPCs. This is driven by the
much higher mobile CTR.
FB
Target Change
October 21, 2015
page 7 of 50 , Jefferies Equity Research, [email protected] US Internet Team
Please see important disclosure information on pages 46 - 50 of this report.
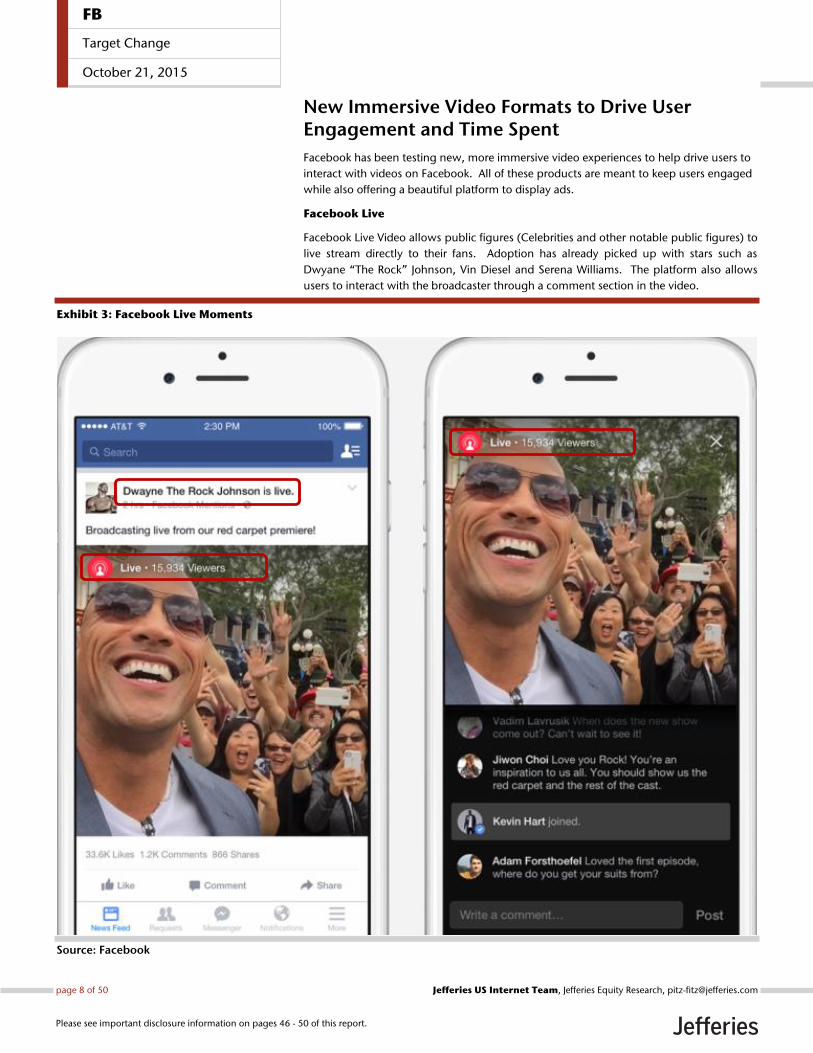
New Immersive Video Formats to Drive User Engagement and Time Spent
Facebook has been testing new, more immersive video experiences to help drive users to
interact with videos on Facebook. All of these products are meant to keep users engaged
while also offering a beautiful platform to display ads.
Facebook Live
Facebook Live Video allows public figures (Celebrities and other notable public figures) to
live stream directly to their fans. Adoption has already picked up with stars such as
Dwyane “The Rock” Johnson, Vin Diesel and Serena Williams. The platform also allows
users to interact with the broadcaster through a comment section in the video.
Exhibit 3: Facebook Live Moments
Source: Facebook
FB
Target Change
October 21, 2015
page 8 of 50 , Jefferies Equity Research, [email protected] US Internet Team
Please see important disclosure information on pages 46 - 50 of this report.

The NBA used Facebook Live to simulcast “NBA Real Training Camp” earlier in the year.
The first of its kind event highlighted the ability of brands to bring their content directly to
the consumers. The show had pre-season practice content and interviews with players,
coaches, and other team personnel. The stream happened at noon ET which the NBA said
was “perfect for this type of initiative. A large portion of your audience is going to be at
their computer or on their mobile phone or tablet.”
Exhibit 4: "NBA Real Training Camp"
Source: Facebook
FB
Target Change
October 21, 2015
page 9 of 50 , Jefferies Equity Research, [email protected] US Internet Team
Please see important disclosure information on pages 46 - 50 of this report.

360 Videos
Facebook has also revealed 360 Videos that allow the user to view a video from all angles
in their News Feed. Star Wars, Discovery, GoPro, and Lebron James have all published
360 videos. Similar to the YouTube product, the 360 videos allow an immersive
experience where users can explore their surroundings in a video by moving their device
around. Facebook envisions this as a product where friends can join their friends on a
vacation or discover new content from their favorite publishers. Vice News has even used
this feature to broadcast the news so users can have a real sense of what is happening.
The Facebook team worked closely with the Oculus team to develop this technology
which could hint at bringing more 360 degree content to the Oculus Rift (owned by
Facebook).
Exhibit 5: Facebook 360 Videos
Source: Facebook
FB
Target Change
October 21, 2015
page 10 of 50 , Jefferies Equity Research, [email protected] US Internet Team
Please see important disclosure information on pages 46 - 50 of this report.

Suggested Videos
Facebook is also testing new video delivery services such as Suggested Videos. Currently
being tested on iPhones, Suggested Videos allows users the ability to discover multiple
related videos after a video has been watched from the News Feed. Suggested Videos has
rolled out to iPhones globally and Facebook is starting to test ads within the experience.
This feature will help increase the amount of time that Facebook users are viewing videos.
Exhibit 6: Suggested Videos
Source: Facebook
FB
Target Change
October 21, 2015
page 11 of 50 , Jefferies Equity Research, [email protected] US Internet Team
Please see important disclosure information on pages 46 - 50 of this report.

Floating Video Displays – Videos for the Multi-tasker
Facebook has also been testing ways to allow the user to continue to consume his/her
favorite video content while also being able to continue to scroll through his/her news
feed. Floating videos will let users start watching a video and then place it in the top
corner of the screen to allow access to the rest of their News Feed.
Exhibit 7: Floating Videos
Source: Facebook
FB
Target Change
October 21, 2015
page 12 of 50 , Jefferies Equity Research, [email protected] US Internet Team
Please see important disclosure information on pages 46 - 50 of this report.

Videos- A Dedicated Page for Videos
Lastly, Facebook has also tested a dedicated page on Facebook exclusively for video
content. Videos from friends, pages a user follows, or videos a user has saved for later,
and other video publishers will be available for users on the page. This tool will be a
destination for users to discover, share, and like new video content and will serve as
another platform for Facebook to serve video ads on.
Exhibit 8: Dedicated Videos Page
Source: Facebook
FB
Target Change
October 21, 2015
page 13 of 50 , Jefferies Equity Research, [email protected] US Internet Team
Please see important disclosure information on pages 46 - 50 of this report.

New Tools For Publishers As Well
With these new video platforms, Facebook is also working on developing the tools for
publishers to understand how their content is being consumed. Page owners will now be
able to analyze the number of views and 30-second views across the entire page
(previously this was limited to a per video basis). Page owners will also be able to see
breakdowns of organic vs. paid, auto-played vs. clicked-to-play, and unique vs. repeat
views to gain insights into the Page’s audience. Publishers will also be able to examine
their top videos over a specific time period as well as have access to information such as
views, reach, and other helpful video metrics.
Exhibit 9: Facebook Video Insights
Source: Facebook
Exhibit 10: Top Video Insights
Source: Facebook
FB
Target Change
October 21, 2015
page 14 of 50 , Jefferies Equity Research, [email protected] US Internet Team
Please see important disclosure information on pages 46 - 50 of this report.

Sizing the Video Advertising Opportunity
The Online Advertising Industry is one of the fastest growing subsections of the
advertising ecosystem. According to our estimates, online video advertising spend is
expected to reach $10B+ in spend by 2015 (surpassing $17B by 2017) in the U.S
alone, or a 3 year CAGR of 35% (’13-’17) vs. 16% (’13-’17) for overall online
advertising spend.
Chart 4: US Online Video as a Percentage of the Overall Online Ad Spend ($B)
Source: Jefferies, Magna, IAB
$0
$10
$20
$30
$40
$50
$60
$70
$80
$90
$100
2010 2011 2012 2013 2014 2015 2016 2017
Total Online Advertising Spend Online Video
By 2017, we believe online video ads
will be a $17B / year opportunity in
the US alone.
FB
Target Change
October 21, 2015
page 15 of 50 , Jefferies Equity Research, [email protected] US Internet Team
Please see important disclosure information on pages 46 - 50 of this report.

Table 1: Jefferies US Online Advertising Model (includes mobile)
Source: Jefferies, IAB, eMarketer
Table 2: Facebook Video Advertising Revenue Estimates ($MM)
FB US Video Advertising 0 150 910 1,853 2,600
% YoY Growth - - 507% 104% 40%
FB Int’l Video Advertising 50 490 998 1,400
% YoY Growth - - 880% 104% 40%
TOTAL FB Video Advertising - 200 1,400 2,850 4,000
% YoY Growth - - 600% 104% 40%
Source: IAB, MagnaGlobal, Company Reports, Jefferies Estimates
2012A 2013A 2014A 2015E 2016E 2017E 13-17 CAGR
Search 18,039 20,726 23,201 26,541 30,252 34,160
growth Y/Y 15.9% 14.9% 11.9% 14.4% 14.0% 12.9% 13.3%
% of Total Spend 49.3% 48.4% 46.8% 46.1% 45.9% 45.8%
Banner + Rich Media + Sponsorship 10,802 12,398 13,650 15,343 16,971 18,385
growth Y/Y 16.8% 14.8% 10.1% 12.4% 10.6% 8.3% 10.4%
% of Total Spend 29.5% 29.0% 27.5% 26.7% 25.8% 24.7%
Banner 8,844 10,304 11,469 13,127 14,697 16,110
growth Y/Y 29.9% 16.5% 11.3% 14.5% 12.0% 9.6% 11.8%
% of Total Spend 24.2% 24.1% 23.1% 22.8% 22.3% 21.6%
Rich Media 1,113 1,328 1,438 1,497 1,582 1,604
growth Y/Y -15.4% 19.3% 8.3% 4.1% 5.7% 1.4% 4.8%
% of Total Spend 3.0% 3.1% 2.9% 2.6% 2.4% 2.2%
Sponsorship 845 766 744 720 692 671
growth Y/Y -24.6% -9.3% -2.9% -3.2% -3.8% -3.0% -3.2%
% of Total Spend 2.3% 1.8% 1.5% 1.3% 1.1% 0.9%
Video 3,453 5,145 7,295 9,903 13,050 16,856
growth Y/Y 32.5% 49.0% 41.8% 35.7% 31.8% 29.2% 34.5%
% of Total Spend 9.4% 12.0% 14.7% 17.2% 19.8% 22.6%
Classified (& auctions) 2,430 2,597 2,925 3,109 3,164 3,356
growth Y/Y -5.8% 6.9% 12.6% 6.3% 1.8% 6.1% 6.6%
% of Total Spend 6.6% 6.1% 5.9% 5.4% 4.8% 4.5%
Referrals/Lead Generation 1,689 1,749 2,355 2,533 2,373 1,753
growth Y/Y 11.0% 3.6% 34.6% 7.6% -6.3% -26.1% 0.1%
% of Total Spend 4.6% 4.1% 4.8% 4.4% 3.6% 2.4%
Email 156 165 149 144 99 75
growth Y/Y -26.8% 5.8% -9.9% -3.2% -31.3% -24.6% -18.0%
% of Total Spend 0.4% 0.4% 0.3% 0.3% 0.2% 0.1%
FB
Target Change
October 21, 2015
page 16 of 50 , Jefferies Equity Research, [email protected] US Internet Team
Please see important disclosure information on pages 46 - 50 of this report.

Omnicom CEO Advises Marketers to Shift 10-25% of TV Ad-Dollars to Online
Video
In late 2014, the CEO of ad-giant Omnicom’s media operations Daryl Simm advised
marketers to move 10% to 25% of TV ad dollars to online video. Omnicom oversees
~$54B of annual ad spend, including major brand campaigns from the likes of PepsiCo,
Visa, McDonald’s and Apple.
We believe this is yet more evidence we are approaching an inflection point where
meaningful chunks of TV ad budgets will begin to shift online, with Facebook being an
obvious beneficiary.
The offline-to-online shift will be driven by a surge in marketers’ desire for more
measurement around video ad campaigns. Measurement and accountability are the
hallmarks of online advertising, where advertisers can more easily calculate the ‘bang for
their advertising buck’.
Simm also said the amount of [high] quality online video is still an issue. In order for more
money to shift to online video, there is a need for even more premium and relevant
content. This brings us to our next point.
Facebook is Reportedly in Discussions With Several Media Firms to Produce
More Professional Short-Form Videos for the Social Network
According to a March 24 article in The Information, Facebook is in discussions with media
firms like Vice, The Onion and Vox Media to produce short-form video that will be
injected directly into users’ News Feeds.
The videos are expected to be rolled out later this year, and Facebook and its content
partners will be looking for advertisers to sponsor the videos in the coming weeks.
FB
Target Change
October 21, 2015
page 17 of 50 , Jefferies Equity Research, [email protected] US Internet Team
Please see important disclosure information on pages 46 - 50 of this report.
TV + Online Video Advertising Convergence – A Deeper Look at What is Driving the Trend
TV advertisers have been relatively slow to shift their ad spend dollars to online media due
to the inability to easily compare the effectiveness of campaigns across various
engagement points (online vs. TV). Traditionally, marketers use the concept of Gross
Rating Point (GRP) to measure the frequency and reach of their campaigns across
demographics. GRP is thus essentially a measure – an independent “exchange rate” – for
the buying/valuing of advertising. This “common currency” allows for the valuation,
comparison, acquisition and substitution (of inventory/impressions) across media types
and channels.
Various on-line ad providers have offered their own metrics arguing that they can offer
incredible granularity on their audience, but advertisers seemingly refuse to believe these
metrics unless they can be independently verified. YouTube has heard this message over
and over and in 2014 announced that they would be partnering with Nielsen to offer
Nielsen’s Online Campaign Ratings (OCR) on Google’s Preferred Videos. The goal is to
give marketers more actionable, open and transparent measurement of their
campaigns to demonstrate the effectiveness of an online video campaign.
Google will be using this along with Comscore’s validated Campaign Essentials (vCE) to
negotiate upfront deals with advertisers and agencies to market their wears on Google
Preferred channels.
Google bringing GRP-like measures to a digital, actionable item will be a powerful tool for
advertisers and publishers as they will be able to see the results of their campaign in real
time. This is a step toward better third party validation. And if an advertiser is not hitting
their intended audience, they can pivot the campaign in real-time rather than waiting
weeks for a report (for example, from a more traditional media platform). Additionally,
using a common language that the advertisers are accustomed to seeing should increase
the rate of adoption. This highlights Google’s strategy of promoting the top 5% of their
contributors in selected verticals and packaging them similar to how advertising is sold
(upfront with guaranteed audience/viewing) on television (Google’s Preferred initiative).
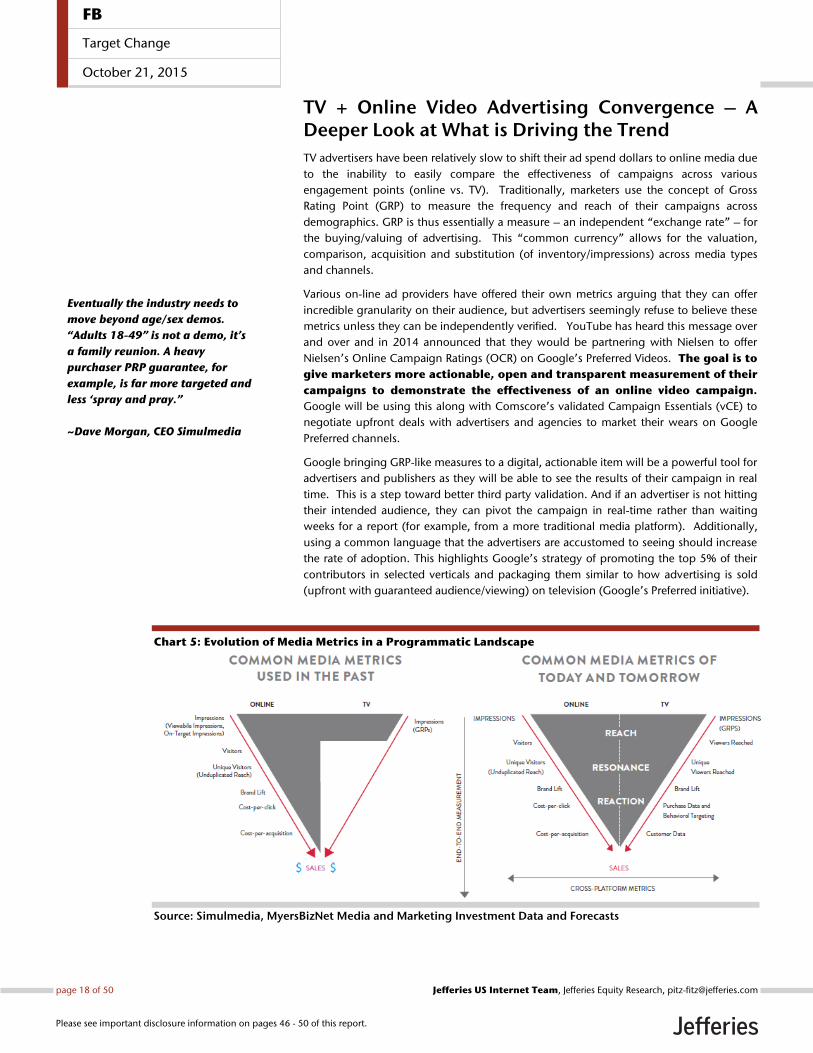
Chart 5: Evolution of Media Metrics in a Programmatic Landscape
Source: Simulmedia, MyersBizNet Media and Marketing Investment Data and Forecasts
Eventually the industry needs to
move beyond age/sex demos.
“Adults 18-49” is not a demo, it’s
a family reunion. A heavy
purchaser PRP guarantee, for
example, is far more targeted and
less ‘spray and pray.”
~Dave Morgan, CEO Simulmedia
FB
Target Change
October 21, 2015
page 18 of 50 , Jefferies Equity Research, [email protected] US Internet Team
Please see important disclosure information on pages 46 - 50 of this report.

Reaching specific audiences remains key for advertisers— and that means hitting the right
consumers, not just the most / largest audience. So there is a need for campaign-specific
ratings (“currencies”) standardized across platforms. Accordingly, OCR integration offers
metrics comparable to TV ratings – so all parties have the ability to observe an audience in
real-time and compare data across devices and platforms. As Dave Morgan from
Simulmedia points out -- the need for impact-based (vs reach-based) advertising
mechanisms will increasingly play a part in leading the convergence of TV and online.
A Bit of Background -- Gross Rating Point (GRP) Definition and Calculation
While GRP began as a manual process of multiplying the number of insertions with each
rating point and then summing them together to form GRP, a simpler formula has since
been developed -- GRP is an advertising measurement term used to express the size of an
audience reached by a specific media or schedule. Specifically, GRPs quantify impressions
as a percentage of the population reached (versus absolute numbers reached). Target
Rating Points (TRP) are also used in similar fashion, but focus on a more narrowly defined
target audience.
GRP is the sum of ratings achieved by a specific media vehicle or schedule. It measures the
total volume of delivery of an advertiser’s message to the target audience. The formula is:
GRP= Reach x Frequency x 100
where
Reach = Unique Target audience segment/Target Universe size -- The numerator
is the target audience reached (actual unduplicated impressions delivered); the
denominator is the universe size based on the total US population for that
specific target (i.e., the number of TV households tuned into a program / total
number of TV households)
Frequency = the number of times that the average household or person is
exposed to the advertising schedule (i.e., how many times the audience has the
opportunity to see a commercial)
The chart below illustrates GRP calculation, reach and frequency. Each home shows
which days the TV set was turned on during the time which a specific show was playing.
Each home represents 10% of the universe of 10 homes, therefore, each represents a 10
rating every time the show plays.
Chart 6: Sample GRP, Reach and Frequency Calculation
Source: Jefferies
M, ThM, T, W
T, W, FTh, FT W, Th
W, F
FB
Target Change
October 21, 2015
page 19 of 50 , Jefferies Equity Research, [email protected] US Internet Team
Please see important disclosure information on pages 46 - 50 of this report.

So the total GRP for this selected campaign can be calculated as follows:
Monday = 20 Rating
Tuesday = 30 Rating
Wednesday = 40 Rating
Thursday = 30 Rating
Friday = 30 Rating
Total GRP: 150
Reach: 70 (Viewing households/ Total TV households = 7/10 * 100 = 70)
Frequency: 2.14 (GRP/Reach = 150/70 = 2.143)
Alternatively, GRPs may be calculated as a specific number of impressions delivered to a
target universe as outlined in this formula:
GRP= (Target Impressions / Target Universe Size) x 100
For example, a sample GRP calculation using this Target Impressions formula:
Male 18-24 Impressions
US Population Male 18-24
GRP
23,512,500 15,675,000 = (23,512,500 / 15,675,000) x 100 = 150
Nielsen National People Meter further extended the rating originally based on HH to
individual, further allowing rating points to be assigned to different demographic
populations.
The widespread adoption of GRP allowed it to become the common currency for media
planning and reporting for TV commercials.
Traditional GRP to iGRP Translation
While still early days, Comscore’s vCE and Nielsen’s OCR provide data that may help
advertisers bridge the gap between offline and online media campaign weighted reach
metrics to compare the advertising strength of various media vehicles.
Comscore’s Campaign Essentials utilizes one million UVs (with 250,000 contributing to
demographic projections monthly). Validated CE (vCE) expanded upon CE in 2012,
incorporating impressions served to PCs, in-geo (country) and viewability and outlier
activities into score reporting. Though vCE is not universally applicable (especially for
pre-roll video due to iFrame limitations), it is widely accepted as a trusted third-party
reporting for impressions in target, UVs in target and average frequency – all necessary
components for computing iGRPs.
Nielsen holds the industry standard in TV rating and can be seen as the founder of TV
GRP. Online Campaign Ratings (OCR) were launched in 2011, originally leveraging
Facebook registrations calculated with the Nielsen multiplatform home panel for demo
reporting. Placement and geo reporting were added in 2012, and Nielsen currently
utilizes its access to more than 150 million privacy-protected registered users, directly
assigning actual demographics to 30-50% of campaign impressions. Nielsen’s strong tie
to traditional media planning has made OCR a highly demanded tool.
FB
Target Change
October 21, 2015
page 20 of 50 , Jefferies Equity Research, [email protected] US Internet Team
Please see important disclosure information on pages 46 - 50 of this report.

Chart 7: Nielsen OCR and comScore vCE Comparison
Source: BrightRoll, Nielsen, comScore
Online video advertisements are often compared to TV commercials, creating this
growing demand for the GRP metric to be applied to the new media form. Thus, iGRP
was adapted as:
Chart 8: iGRP Formula
Source: BrightRoll
Practical Example – Online Video Advertising
Let’s look at a practical example of delivering a 150 GRP campaign to US adults aged 18-
49. Holding the frequency constant, we see that based on Nielsen estimates the
campaign reach would be 92.3M Adults aged 18-49, and based on Comscore estimates
the reach would be 95.5M Adults aged 19-49. Total impressions for the Nielsen
campaign equal 197.8M (92.3M*2.143), while total impressions for the Comscore
campaign equal 204.7M (95.5M*2.143).
Chart 9: Calculating iGRP using Individuals
Source: Jefferies
Nielsen's Online Campaigns Ratings (OCR) comScore's validated Campaign Essentials (vCE)
MRC Accreditation Yes Yes
Demographic ProjectionsHas access to more than 150 million privacy-
protected registered users
1 Million UVs, 250K contributing to demographics on a
monthly basis
Impression Reporting "IMPRESSIONS" Verification and Viewability measures in place Only those that had the opportunity to be seen
Total US Population Estimates "UNIVERSE" 298,315,476 303,318,091
Cross-Platform MeasurementCross-Platform Campaign Ratings - TV, online and
tablets
validated Campaign Essentlials Multi-Platform - TV,
online, mobile, tablet
Campaign Reach Nielsen Population
A 18-49
Nielsen Total US Population Frequency A 18-49 GRP
92,286,261 131,846,305 298,315,476 2.143 150
Campaign Reach Comscore Population
A 18-49
Comscore Total US Population Frequency A 18-49 GRP
95,536,452 136,489,745 303,318,091 2.143 150
FB
Target Change
October 21, 2015
page 21 of 50 , Jefferies Equity Research, [email protected] US Internet Team
Please see important disclosure information on pages 46 - 50 of this report.
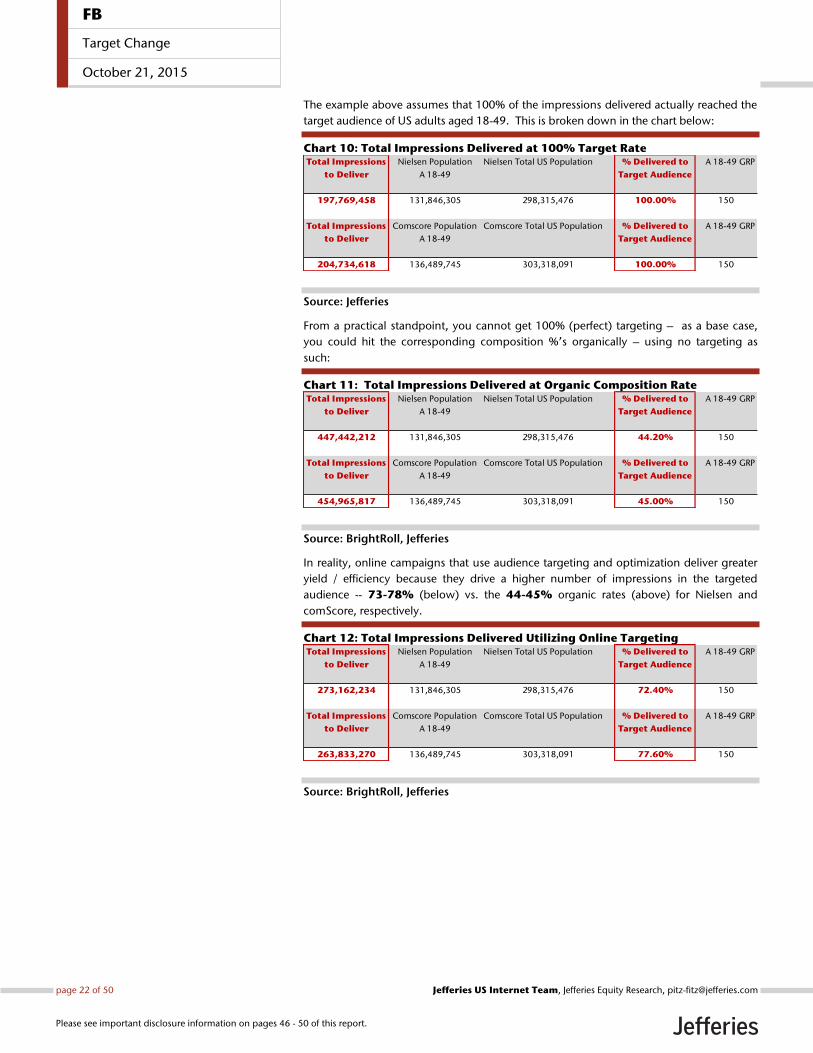
The example above assumes that 100% of the impressions delivered actually reached the
target audience of US adults aged 18-49. This is broken down in the chart below:
Chart 10: Total Impressions Delivered at 100% Target Rate
Source: Jefferies
From a practical standpoint, you cannot get 100% (perfect) targeting – as a base case,
you could hit the corresponding composition %’s organically – using no targeting as
such:
Chart 11: Total Impressions Delivered at Organic Composition Rate
Source: BrightRoll, Jefferies
In reality, online campaigns that use audience targeting and optimization deliver greater
yield / efficiency because they drive a higher number of impressions in the targeted
audience -- 73-78% (below) vs. the 44-45% organic rates (above) for Nielsen and
comScore, respectively.
Chart 12: Total Impressions Delivered Utilizing Online Targeting
Source: BrightRoll, Jefferies
Total Impressions
to Deliver
Nielsen Population
A 18-49
Nielsen Total US Population % Delivered to
Target Audience
A 18-49 GRP
197,769,458 131,846,305 298,315,476 100.00% 150
Total Impressions
to Deliver
Comscore Population
A 18-49
Comscore Total US Population % Delivered to
Target Audience
A 18-49 GRP
204,734,618 136,489,745 303,318,091 100.00% 150
Total Impressions
to Deliver
Nielsen Population
A 18-49
Nielsen Total US Population % Delivered to
Target Audience
A 18-49 GRP
447,442,212 131,846,305 298,315,476 44.20% 150
Total Impressions
to Deliver
Comscore Population
A 18-49
Comscore Total US Population % Delivered to
Target Audience
A 18-49 GRP
454,965,817 136,489,745 303,318,091 45.00% 150
Total Impressions
to Deliver
Nielsen Population
A 18-49
Nielsen Total US Population % Delivered to
Target Audience
A 18-49 GRP
273,162,234 131,846,305 298,315,476 72.40% 150
Total Impressions
to Deliver
Comscore Population
A 18-49
Comscore Total US Population % Delivered to
Target Audience
A 18-49 GRP
263,833,270 136,489,745 303,318,091 77.60% 150
FB
Target Change
October 21, 2015
page 22 of 50 , Jefferies Equity Research, [email protected] US Internet Team
Please see important disclosure information on pages 46 - 50 of this report.

What Are The Near-Term Impacts?
Media owners should continue to sell against classic GRP and cost-per-thousand (CPM)
metrics in the near term, but with better data & measurement tools shouldn’t we see the
adoption of more sophisticated, granular and immediate (maybe real-time) processes?
Media/video suppliers and aggregators would be able to commit to verifiable deliverables
across their total video reach -- cross-channel (and eventually cross media too – video,
display, search, mobile, TV, etc.). Enhanced measures of Return on Ad Spend (ROAS)
should follow, leading to truer performance-based advertising processes.
We continue to see evidence that brands are allocating a larger portion of their budgets
toward digital media. For example, Acura is launching its new TLX luxury sedan in the US
with a robust campaign that will allocate 30% of its budget toward digital. Importantly,
this campaign will not run a single ad on broadcast TV during prime-time. Of course, TV is
still a meaningful part of Acura’s marketing plan, accounting for more than half the
campaign’s budget. But Acura’s definition of TV is evolving to now include long-form,
high-quality content that will run on digital platforms (where the company’s ads will
complement the more traditional TV buys on cable channels like ESPN).
Exhibit 11: Acura Sponsored Web Series “Comedians in Cars Getting Coffee”
Source: YouTube
FB
Target Change
October 21, 2015
page 23 of 50 , Jefferies Equity Research, [email protected] US Internet Team
Please see important disclosure information on pages 46 - 50 of this report.

Within the context of measuring media advertising strength, we would also highlight that
video consumption habits continue to shift away from linear / live TV to “what you want”
/ “where you want” / “when you want”:
Time spent watching TV in America is at an all-time high, yet the majority of this time
continues to shift away from live programing. Viewers are increasingly watching TV on
their own schedule as opposed to the pre-determined air times of their favorite shows.
The chart below highlights a growing trend among premium cable shows; in 2006 nearly
70% of the audience for Dexter’s first season watched the show live, while the proportion
of live viewing for Homeland is now almost the mirror opposite. Showtime’s executive VP
of program planning, Kim Lemon, went so far to say that for some of Showtime’s Sunday
shows the debut live rating can be “only 15% of what the ultimate weekly number will
be.”
Chart 13: Evolution Away from Live TV
Source: Nielsen, Rentrak, qz.com (http://qz.com/237600/charts-how-we-watch-tv-now/)
FB
Target Change
October 21, 2015
page 24 of 50 , Jefferies Equity Research, [email protected] US Internet Team
Please see important disclosure information on pages 46 - 50 of this report.

Instagram: A Picture Perfect Ad Platform With its beautiful visual layout (photos and video) and a massive (400MM MAUs, larger
than Twitter), highly engaged audience, Instagram looks like a natural ad platform to us.
To date, Instagram’s ad load has been noticeably lower than core Facebook’s. But this is
about to change as Facebook recently opened Instagram to all advertisers. Instagram has
also unveiled the 30 second video ad available to advertisers. Thus, Instagram’s revenue
growth will now begin in earnest, and we are optimistic.
Importantly, Instagram ads leverage Facebook’s anonymized user data, which nearly
ensures these ads will deliver a similar bang-for-your-buck as Facebook’s core mobile
News Feed ads. And if we assume Instagram ads deliver similar ROI to Facebook’s core
mobile ads, advertiser demand should be robust.
To size the revenue opportunity, we compare Instagram’s user base to the core Facebook
mobile user base in terms of 1) the number of users across each geography, 2) ARPU, and
3) the expected ad load.
Our base case 2016 Instagram revenue estimate is $531MM, which we grow to $1.44B in
2017.
By 2019, we model Instagram revenue of $3.2B (generated from a global user base of
1.23B MAUs). For comparison, FB generated more than twice that amount of from a
similarly sized mobile user base in 2014. (2014 FB actual: $7.43B mobile rev from ~1.2B
mobile users).
Sizing Instagram’s Revenue Opportunity Based on Comps with Facebook’s
Core Mobile Business
1) First, we project Instagram’s Monthly Active Users per geography
through 2019.
Since Facebook acquired Instagram in April 2012 (for ~$1B cash + stock), user
levels have grown tenfold to 400 million MAUs.
This is roughly 31% as large as Facebook’s core mobile business, which has ~1.3
million MAUs and generated ~$7.43B in revenue in 2014.
Note when Facebook acquired Instagram it had only 30MM+ users; or only 6%
as large as Facebook’s 543MM mobile users at the time.
Our base case 2016 Instagram
revenue estimate is $531MM, which
we grow to 1.44B in 2017.
FB
Target Change
October 21, 2015
page 25 of 50 , Jefferies Equity Research, [email protected] US Internet Team
Please see important disclosure information on pages 46 - 50 of this report.

Chart 14: Instagram Monthly Active Users (MAUs) Continue to Rise
Source: Facebook
Importantly, we assume Instagram has similar user engagement levels to core
Facebook.
On its 4Q’14 earnings call, the company noted Instagram and Facebook
account for 20% of people’s time on mobile in the US. Third party data confirms
Instagram has very high engagement levels.
Facebook says 30% of Instagram’s users located in the US. For core Facebook,
about 15-18% of users are outside the US (and Canada).
Facebook has recently confirmed Instagram has 400MM monthly active users.
Also, management has previously stated that ~30% of users are located in the
US, where ad prices are highest.
For the remaining 70% of users, we assume 95MM are located in Europe,
105MM are located in Asia, and the remaining 90MM are in Rest of World.
Table 3: Facebook and Instagram Users by Geography
Facebook Core Instagram*
US & Canada 213 110
Europe 311 95
Asia 496 105
Rest of World 471 90
Total 1,491 400
Source: Facebook, Jefferies Estimates (* denotes an estimate)
The geographic mix is important because Facebook earns far more revenue per
user in North America than anywhere else. To underscore this point, the US and
Canada account for nearly half of revenue despite the fact they account for 15-
18% of total Facebook users.
0
50
100
150
200
250
300
350
400
450
Ap
r-1
2
Jun
-12
Au
g-1
2
Oct
-12
De
c-1
2
Feb
-13
Ap
r-1
3
Jun
-13
Au
g-1
3
Oct
-13
De
c-1
3
Feb
-14
Ap
r-1
4
Jun
-14
Au
g-1
4
Oct
-14
De
c-1
4
Feb
-15
Ap
r-1
5
Jun
-15
Au
g-1
5
FB
Target Change
October 21, 2015
page 26 of 50 , Jefferies Equity Research, [email protected] US Internet Team
Please see important disclosure information on pages 46 - 50 of this report.
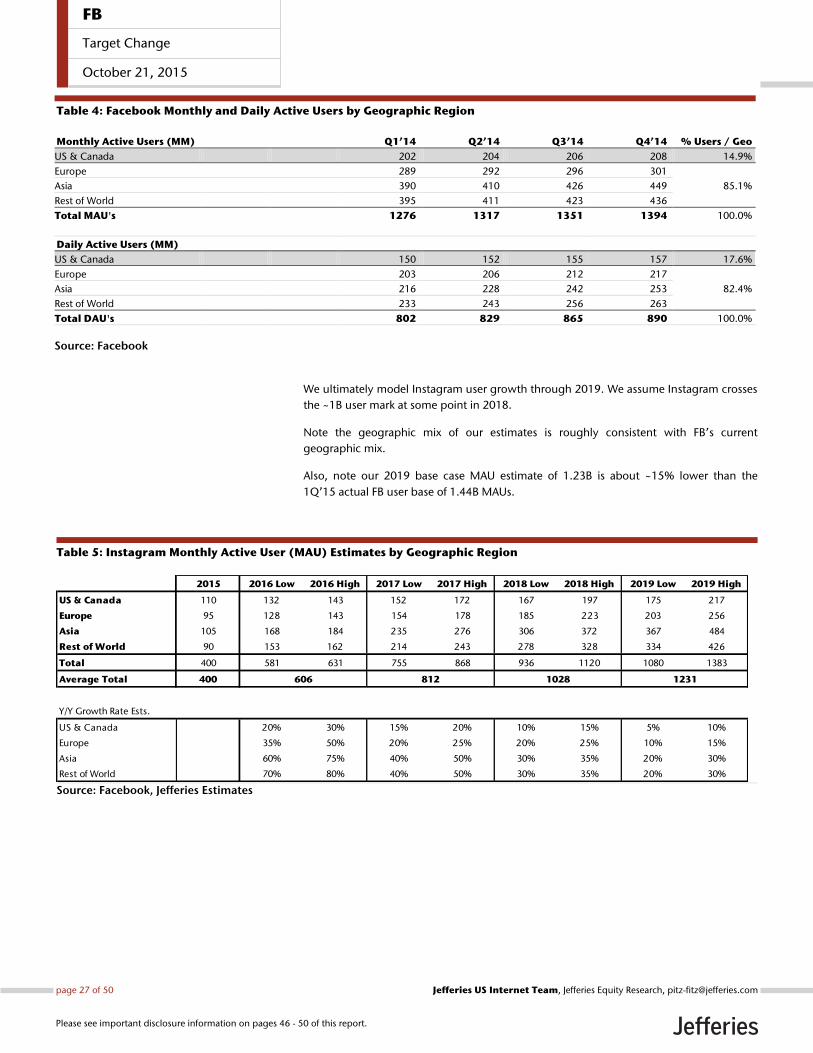
Table 4: Facebook Monthly and Daily Active Users by Geographic Region
Monthly Active Users (MM) Q1’14 Q2’14 Q3’14 Q4’14 % Users / Geo
US & Canada 202 204 206 208 14.9%
Europe 289 292 296 301
85.1% Asia 390 410 426 449
Rest of World 395 411 423 436
Total MAU's 1276 1317 1351 1394 100.0%
Daily Active Users (MM)
US & Canada 150 152 155 157 17.6%
Europe 203 206 212 217
82.4% Asia 216 228 242 253
Rest of World 233 243 256 263
Total DAU's 802 829 865 890 100.0%
Source: Facebook
We ultimately model Instagram user growth through 2019. We assume Instagram crosses
the ~1B user mark at some point in 2018.
Note the geographic mix of our estimates is roughly consistent with FB’s current
geographic mix.
Also, note our 2019 base case MAU estimate of 1.23B is about ~15% lower than the
1Q’15 actual FB user base of 1.44B MAUs.
Table 5: Instagram Monthly Active User (MAU) Estimates by Geographic Region
Source: Facebook, Jefferies Estimates
2015 2016 Low 2016 High 2017 Low 2017 High 2018 Low 2018 High 2019 Low 2019 High
US & Canada 110 132 143 152 172 167 197 175 217
Europe 95 128 143 154 178 185 223 203 256
Asia 105 168 184 235 276 306 372 367 484
Rest of World 90 153 162 214 243 278 328 334 426
Total 400 581 631 755 868 936 1120 1080 1383
Average Total 400
Y/Y Growth Rate Ests.
US & Canada 20% 30% 15% 20% 10% 15% 5% 10%
Europe 35% 50% 20% 25% 20% 25% 10% 15%
Asia 60% 75% 40% 50% 30% 35% 20% 30%
Rest of World 70% 80% 40% 50% 30% 35% 20% 30%
606 812 1028 1231
FB
Target Change
October 21, 2015
page 27 of 50 , Jefferies Equity Research, [email protected] US Internet Team
Please see important disclosure information on pages 46 - 50 of this report.

Chart 15: Instagram Monthly Active User (MAU) Projections (MM)
Source: Jefferies Estimates
2) Next, we model go-forward Facebook ARPU projections based off
historic actual results for core Facebook.
Ad prices continue to ramp quickly as FB’s mobile news feed ads command ever
higher prices. This is driven in part by 1) a mix shift towards lower-funnel
eCommerce / direct response oriented ad formats like DPAs and Mobile App
Install Ads and 2) more advertisers spending more money across a roughly fixed
number of ad impressions.
Over time we assume ad prices continue to rise across all geographies.
Table 6: Facebook ARPU Estimates by Geographic Region
Source: Facebook, Jefferies Estimates
0
200
400
600
800
1,000
1,200
1,400
1,600
2015 2016 2017 2018 2019
high
base
low
high
base
low
2016 Low 2016 High 2017 Low 2017 High 2018 Low 2018 High 2019 Low 2019 High
US & Canada $8.96 $9.35 $9.85 $10.75 $10.64 $11.82 $10.64 $12.41
Europe $3.95 $4.10 $5.53 $5.95 $6.63 $7.43 $7.30 $8.55
Asia $1.53 $1.59 $1.99 $2.15 $2.39 $2.68 $2.63 $3.08
Rest of World $1.04 $1.08 $1.24 $1.35 $1.43 $1.62 $1.57 $1.86
Y/Y Growth Rate Ests.
US & Canada 15% 20% 10% 15% 8% 10% 0% 5%
Europe 30% 35% 40% 45% 20% 25% 10% 15%
Asia 30% 35% 30% 35% 20% 25% 10% 15%
Rest of World 20% 25% 20% 25% 15% 20% 10% 15%
FB
Target Change
October 21, 2015
page 28 of 50 , Jefferies Equity Research, [email protected] US Internet Team
Please see important disclosure information on pages 46 - 50 of this report.

3) Third, we model go-forward Instagram ARPU projections by applying
a discount to core FB ARPU projections.
At first blush, it broadly makes sense that Instagram ad prices will be lower than
FB for several reasons. Over time we believe this gap will converge across all
geographies.
But in the US currently, we are seeing evidence that Instagram ad prices are
actually higher than for core FB, per Salesforce.com.
For the most part, Instagram ad pricing should be relatively similar to Facebook
over time, and our model assumes the gap narrows over time.
This rings true given both platforms leverage the same data, and both platforms
should have similar ad units (display, video). Additionally, Instagram will
leverage the same kinds of direct-response ads as core-FB, which have naturally
higher ad prices.
This will have a positive effect on ARPU over time.
See our Instagram ARPU assumptions below.
Table 7: Instagram ARPU Estimates by Geographic Region
Source: Facebook, Jefferies Estimates
2016 Low 2016 High 2017 Low 2017 High 2018 Low 2018 High 2019 Low 2019 High
US & Canada $8.96 $9.81 $9.85 $11.28 $10.64 $11.82 $10.64 $12.41
Europe $2.96 $3.49 $4.42 $5.05 $5.64 $7.06 $6.93 $8.55
Asia $0.61 $0.79 $1.19 $1.72 $1.91 $2.28 $2.36 $3.08
Rest of World $0.31 $0.22 $0.43 $0.54 $0.86 $1.21 $1.26 $1.58
Instagram ARPU Discount vs. Core FB
US & Canada 0% -5% 0% -5% 0% 0% 0% 0%
Europe 25% 15% 20% 15% 15% 5% 5% 0%
Asia 60% 50% 40% 20% 20% 15% 10% 0%
Rest of World 70% 80% 65% 60% 40% 25% 20% 15%
FB
Target Change
October 21, 2015
page 29 of 50 , Jefferies Equity Research, [email protected] US Internet Team
Please see important disclosure information on pages 46 - 50 of this report.

4) Finally, we model go-forward Instagram revenue projections based
on ad load as a percentage of core FB.
Our base case 2016 Instagram revenue estimate is $531MM, which we grow to
$1.44B in 2017.
By 2019, we model Instagram revenue of $3.2B (generated from a global user
base of 1.23B MAUs). For comparison, FB generated more than twice that
amount of from a similarly sized mobile user base in 2014. (2014 FB actual:
$7.43B mobile rev from ~1.2B mobile users).
Table 8: Instagram Revenue Estimates by Geographic Region
Source: Facebook, Jefferies Estimates
Chart 16: Instagram Annual Revenue Projections ($MM)
Source: Jefferies Estimates
2016 Low 2016 High 2017 Low 2017 High 2018 Low 2018 High 2019 Low 2019 High
US & Canada $296 $491 $822 $1,259 $1,066 $1,516 $1,399 $2,156
Europe $76 $149 $204 $360 $417 $865 $563 $985
Asia $10 $29 $56 $142 $146 $297 $260 $597
Rest of World $5 $7 $9 $26 $60 $139 $126 $270
Total $387 $676 $1,092 $1,787 $1,688 $2,817 $2,349 $4,007
Average Total
Ad Load as % of FB
US & Canada 25% 35% 55% 65% 60% 65% 75% 80%
Europe 20% 30% 30% 40% 40% 55% 40% 45%
Asia 10% 20% 20% 30% 25% 35% 30% 40%
Rest of World 10% 20% 10% 20% 25% 35% 30% 40%
$3,178$2,253$1,440$531
$0
$500
$1,000
$1,500
$2,000
$2,500
$3,000
$3,500
$4,000
$4,500
2016 2017 2018 2019
high
base
low
FB
Target Change
October 21, 2015
page 30 of 50 , Jefferies Equity Research, [email protected] US Internet Team
Please see important disclosure information on pages 46 - 50 of this report.

Visualizing an Instagram Ad
Below is an example of an Instagram Ad utilizing the carousel image format. The user first
sees the image with ad copy informing the user on the product. The user can than scroll
to see additional images and is promted with a “Learn More” button. Users can also
“Like” and “Comment” on the ad providing interaction and engagement. Kinetic Social,
a social marketing firm, has stated that on Facebook carousel ads can increase traffic to
sites by as much as 10x more than static ads. The ads also get about 1% click-thru rate
while non-carousel ads get 0.1% and the best mobile banner ads get 0.5%
Exhibit 12: Tiffany & Co. CT60 Watch Collection Advertisement on Instagram (Four Pages, Carousel Format)
Source: Facebook
Tiffany & Co. Sponsored Post
Ad copy and hashtag:
Introducing the Tiffany CT60 watch collection. Inspired by New York, crafted in
Switzerland.#TiffanyNYMinute
4 page ad - swipe right for more info
51,688 likes1,147 comments
Clicking “Learn More” takes user to Tiffany web page with
product video
FB
Target Change
October 21, 2015
page 31 of 50 , Jefferies Equity Research, [email protected] US Internet Team
Please see important disclosure information on pages 46 - 50 of this report.
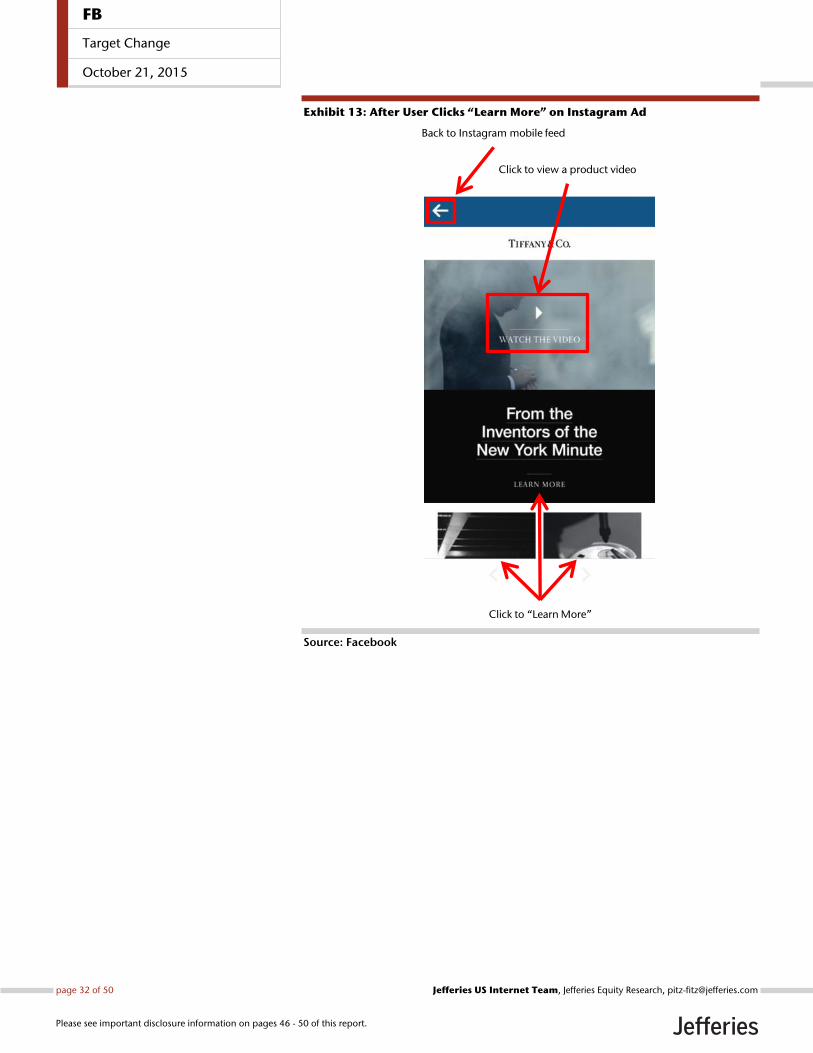
Exhibit 13: After User Clicks “Learn More” on Instagram Ad
Source: Facebook
Click to view a product video
Back to Instagram mobile feed
Click to “Learn More”
FB
Target Change
October 21, 2015
page 32 of 50 , Jefferies Equity Research, [email protected] US Internet Team
Please see important disclosure information on pages 46 - 50 of this report.

Instagram Auto-Play Video Ads
Instagram has also started to integrate auto-playing video ads in the user’s stream. Below
is an example of a Dewar’s ad featured in a user’s stream. The high quality video is
engaging and begins playing when the ad enters the stream similar to user generated
content. The user can then click on the video to enable sound (same as user generated
content). On certain video ads users can click “Watch More” which will redirect
the user to the brand’s web page.
Exhibit 14: Dewar’s Instagram Video Ad - Autoplay
Source: Instagram
FB
Target Change
October 21, 2015
page 33 of 50 , Jefferies Equity Research, [email protected] US Internet Team
Please see important disclosure information on pages 46 - 50 of this report.

App Install Ad on Instagram
Instagram has also allowed App Install Ads as seen below for Fan Duel. The user is
presented with the ad in stream including ad copy in the comment section. When the
user clicks on “Install Now” it redirects them to their devices app store
directly to the app’s download page.
Exhibit 15: Fan Duel App Install Ad on Instagram
Source: Instagram
FB
Target Change
October 21, 2015
page 34 of 50 , Jefferies Equity Research, [email protected] US Internet Team
Please see important disclosure information on pages 46 - 50 of this report.

Growth Driver #3: Facebook Audience Network Serving Ads in 3rd Party Mobile Apps
As the app economy grows, Facebook continues to roll out products designed to appeal
to app developers. The newest product is called the Audience Network, which is designed
to help apps generate revenue by running small Facebook ads. The network was
announced in April 2014, and opened up to all advertisers in October.
App developers are already working closely with Facebook. The company’s Mobile App
Install Ads, which help apps to acquire new users, have been a smash hit since they were
launched.
Facebook does not break out the revenue contribution from Mobile App Install Ads, but it
likely accounted for a large chunk of FB’s $7.4B mobile business (2014 actual).
With the Facebook Audience Network, developers can now work with Facebook for both
user acquisition / distribution (Mobile App Install Ads) and monetization (Facebook
Audience Network). We think this is a powerful one-two punch, with both products
complimenting each other nicely. We think developers will see plenty of utility from the
Audience Network.
Exhibit 16: Facebook Audience Network Ad from the Popular “2048” App
Source: Facebook, Jefferies
Facebook AudienceNetwork
“Banner Ad” Format
As Facebook limits the ad-load on its
own core app, the Audience
Network is an easy way to serve
more ads over time (without ruining
the user experience).
FB
Target Change
October 21, 2015
page 35 of 50 , Jefferies Equity Research, [email protected] US Internet Team
Please see important disclosure information on pages 46 - 50 of this report.

‘Instant Articles’ Bring High-Quality Content Direct to FB’s Mobile News Feed In May, Facebook introduced Instant Articles, a new tool for publishers to deliver articles
directly inside the user’s mobile news feed.
For the initial rollout, Facebook partnered with nine of the biggest websites in the world
like The New York Times, The Guardian, BBC News, National Geographic and Buzzfeed.
Already, publishers like Conde Nast, Hearst, Time Inc., CNN and Bustle have expressed
interest in participating as Facebook opens the service to more publishers over time.
Instant Articles furthers the company’s ambitions to be a one-stop-shop for the discovery
and consumption of content. Additionally, this content will bring premium, brand-safe ad
inventory directly into users’ mobile News Feeds.
Instant Articles uses FB’s photo and video technology to serve these same articles up to
10x faster than standard web articles, which are (by far) the slowest loading content type
on Facebook.
Facebook has introduced new features like tilt-to-pan photos, auto-play video, embedded
video captions, and interactive maps. By publishing direct to Facebook, publishers can
create slick looking, interactive mobile articles that still retain the brand’s look and feel.
Publishers will have full control over advertising.
There are two primary options for monetization.
First, the publisher can manage their own inventory on the Instant Articles platform. In
this scenario, the publisher keeps 100% of ad revenue and also receives readership data
from Facebook.
Most of Facebook’s early partners have selected this option.
Second, the publisher can elect for Facebook to handle the ad placements. In this
scenario, Facebook would take a ~30% revenue share. The ads can be customized to align
with the look and feel of the publisher’s other content, and will leverage FB’s massive data
set.
The influx of content will bring premium, brand-safe ad inventory directly
into users’ mobile News Feeds.
Over time Instant Articles should drive an influx of premium, brand safe-content directly
in the Facebook mobile News Feed. This in-turn gives Facebook the ability to sell high-
priced brand ads against each Instant Article.
Importantly, Instant Articles will be integrated directly into the Facebook Audience
Network.
FB
Target Change
October 21, 2015
page 36 of 50 , Jefferies Equity Research, [email protected] US Internet Team
Please see important disclosure information on pages 46 - 50 of this report.
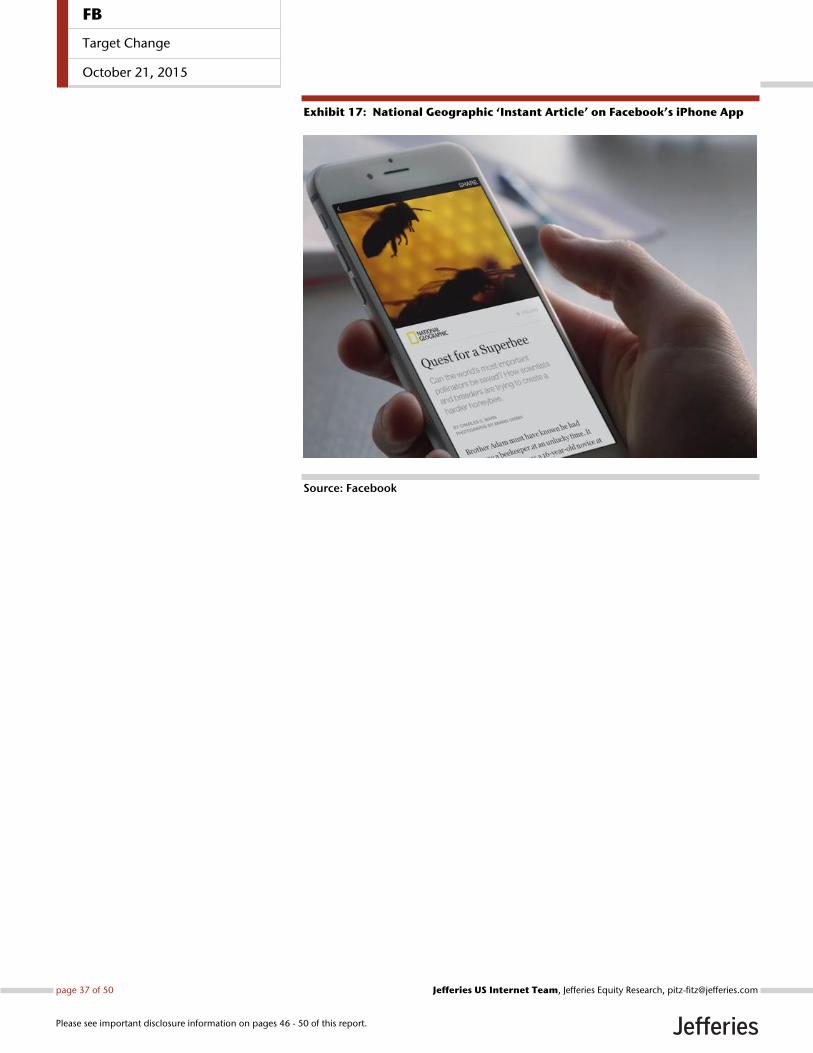
Exhibit 17: National Geographic ‘Instant Article’ on Facebook’s iPhone App
Source: Facebook
FB
Target Change
October 21, 2015
page 37 of 50 , Jefferies Equity Research, [email protected] US Internet Team
Please see important disclosure information on pages 46 - 50 of this report.
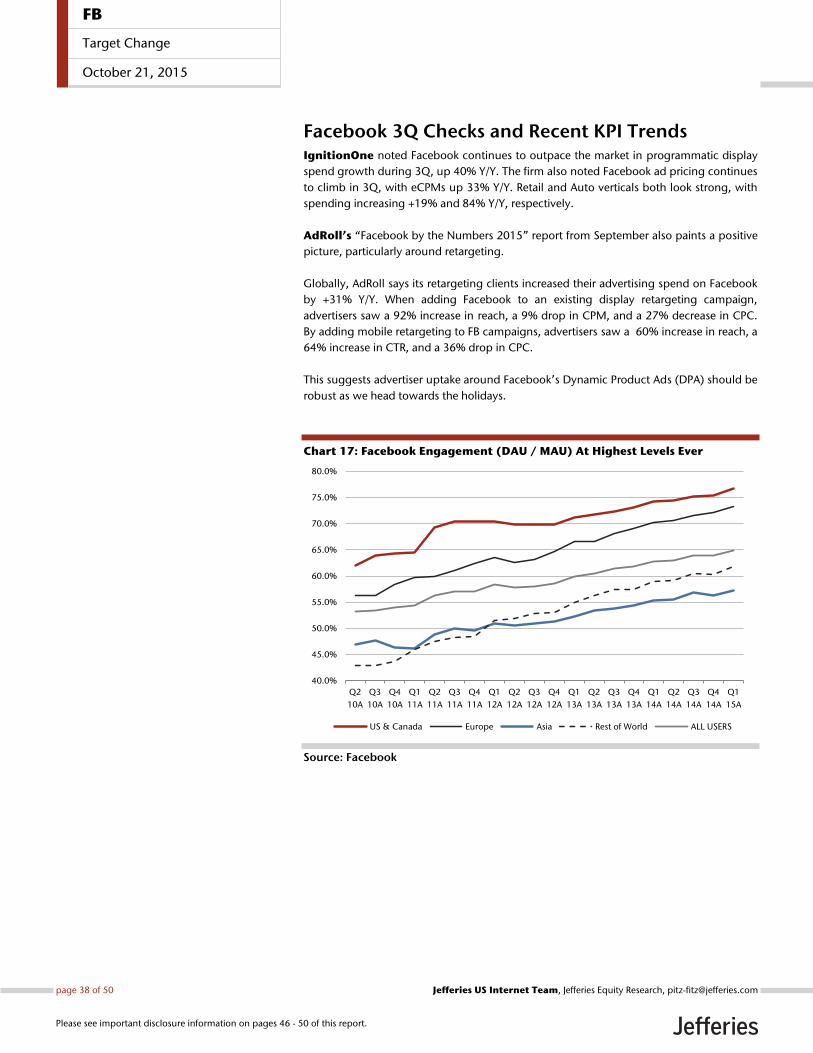
Facebook 3Q Checks and Recent KPI Trends IgnitionOne noted Facebook continues to outpace the market in programmatic display
spend growth during 3Q, up 40% Y/Y. The firm also noted Facebook ad pricing continues
to climb in 3Q, with eCPMs up 33% Y/Y. Retail and Auto verticals both look strong, with
spending increasing +19% and 84% Y/Y, respectively.
AdRoll’s “Facebook by the Numbers 2015” report from September also paints a positive
picture, particularly around retargeting.
Globally, AdRoll says its retargeting clients increased their advertising spend on Facebook
by +31% Y/Y. When adding Facebook to an existing display retargeting campaign,
advertisers saw a 92% increase in reach, a 9% drop in CPM, and a 27% decrease in CPC.
By adding mobile retargeting to FB campaigns, advertisers saw a 60% increase in reach, a
64% increase in CTR, and a 36% drop in CPC.
This suggests advertiser uptake around Facebook’s Dynamic Product Ads (DPA) should be
robust as we head towards the holidays.
Chart 17: Facebook Engagement (DAU / MAU) At Highest Levels Ever
Source: Facebook
40.0%
45.0%
50.0%
55.0%
60.0%
65.0%
70.0%
75.0%
80.0%
Q2
10A
Q3
10A
Q4
10A
Q1
11A
Q2
11A
Q3
11A
Q4
11A
Q1
12A
Q2
12A
Q3
12A
Q4
12A
Q1
13A
Q2
13A
Q3
13A
Q4
13A
Q1
14A
Q2
14A
Q3
14A
Q4
14A
Q1
15A
US & Canada Europe Asia Rest of World ALL USERS
FB
Target Change
October 21, 2015
page 38 of 50 , Jefferies Equity Research, [email protected] US Internet Team
Please see important disclosure information on pages 46 - 50 of this report.

Chart 18: Quarterly Revenue ($MM) per Geographic Region
Source: Facebook
Chart 19: Monthly Active Users (MM) per Geographic Region
Source: Facebook
0
200
400
600
800
1000
1200
1400
1600
1800
2000
Q2
10A
Q3
10A
Q4
10A
Q1
11A
Q2
11A
Q3
11A
Q4
11A
Q1
12A
Q2
12A
Q3
12A
Q4
12A
Q1
13A
Q2
13A
Q3
13A
Q4
13A
Q1
14A
Q2
14A
Q3
14A
Q4
14A
Q1
15A
US & Canada Europe Asia Rest of World
50
100
150
200
250
300
350
400
450
500
Q2
10A
Q3
10A
Q4
10A
Q1
11A
Q2
11A
Q3
11A
Q4
11A
Q1
12A
Q2
12A
Q3
12A
Q4
12A
Q1
13A
Q2
13A
Q3
13A
Q4
13A
Q1
14A
Q2
14A
Q3
14A
Q4
14A
Q1
15A
US & Canada Europe Asia Rest of World
FB
Target Change
October 21, 2015
page 39 of 50 , Jefferies Equity Research, [email protected] US Internet Team
Please see important disclosure information on pages 46 - 50 of this report.
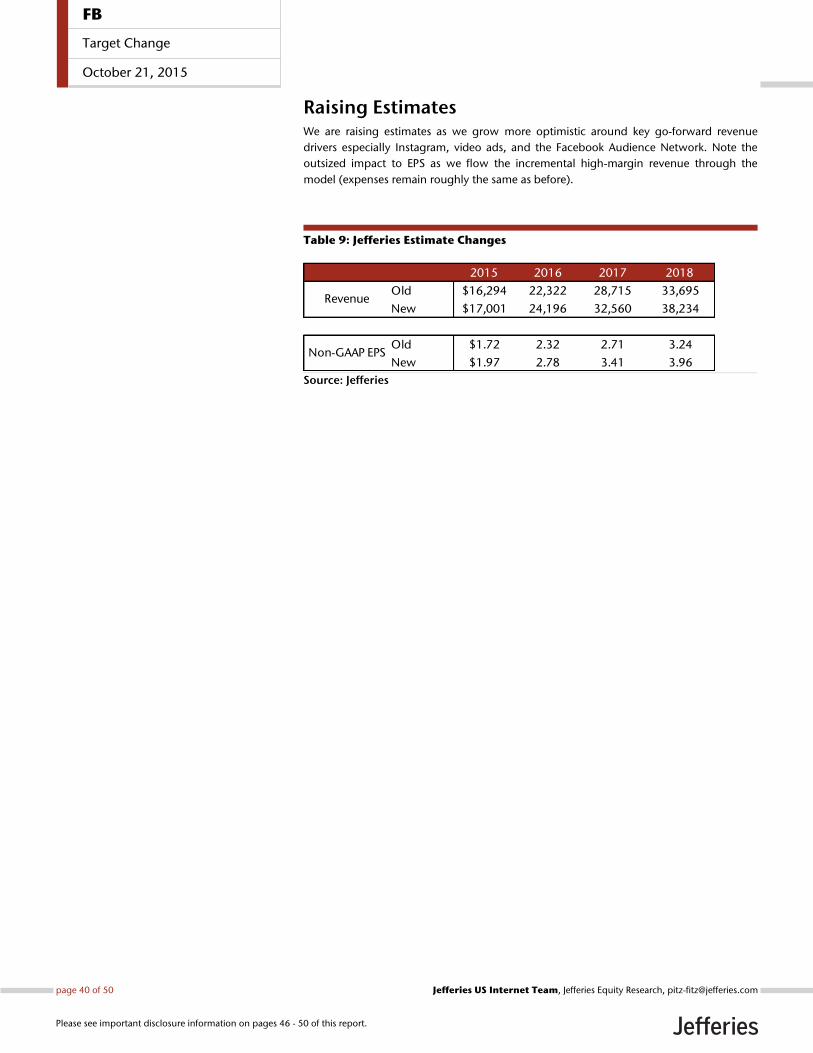
Raising Estimates We are raising estimates as we grow more optimistic around key go-forward revenue
drivers especially Instagram, video ads, and the Facebook Audience Network. Note the
outsized impact to EPS as we flow the incremental high-margin revenue through the
model (expenses remain roughly the same as before).
Table 9: Jefferies Estimate Changes
Source: Jefferies
2015 2016 2017 2018
Old $16,294 22,322 28,715 33,695
New $17,001 24,196 32,560 38,234
Old $1.72 2.32 2.71 3.24
New $1.97 2.78 3.41 3.96Non-GAAP EPS
Revenue
FB
Target Change
October 21, 2015
page 40 of 50 , Jefferies Equity Research, [email protected] US Internet Team
Please see important disclosure information on pages 46 - 50 of this report.
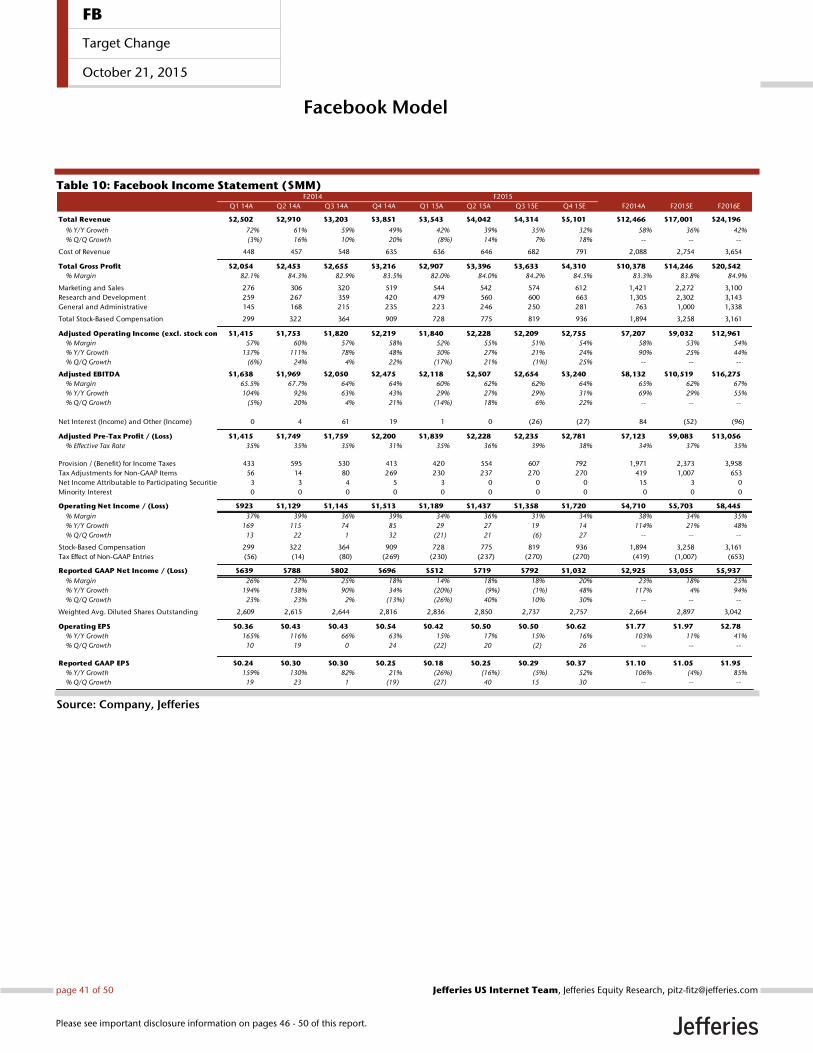
Facebook Model
Table 10: Facebook Income Statement ($MM)
Source: Company, Jefferies
Q1 14A Q2 14A Q3 14A Q4 14A Q1 15A Q2 15A Q3 15E Q4 15E F2014A F2015E F2016E
Total Revenue $2,502 $2,910 $3,203 $3,851 $3,543 $4,042 $4,314 $5,101 $12,466 $17,001 $24,196
% Y/Y Growth 72% 61% 59% 49% 42% 39% 35% 32% 58% 36% 42%
% Q/Q Growth (3%) 16% 10% 20% (8%) 14% 7% 18% -- -- --
Cost of Revenue 448 457 548 635 636 646 682 791 2,088 2,754 3,654
Total Gross Profit $2,054 $2,453 $2,655 $3,216 $2,907 $3,396 $3,633 $4,310 $10,378 $14,246 $20,542
% Margin 82.1% 84.3% 82.9% 83.5% 82.0% 84.0% 84.2% 84.5% 83.3% 83.8% 84.9%
Marketing and Sales 276 306 320 519 544 542 574 612 1,421 2,272 3,100
Research and Development 259 267 359 420 479 560 600 663 1,305 2,302 3,143
General and Administrative 145 168 215 235 223 246 250 281 763 1,000 1,338
Total Stock-Based Compensation 299 322 364 909 728 775 819 936 1,894 3,258 3,161
Adjusted Operating Income (excl. stock comp.)$1,415 $1,753 $1,820 $2,219 $1,840 $2,228 $2,209 $2,755 $7,207 $9,032 $12,961
% Margin 57% 60% 57% 58% 52% 55% 51% 54% 58% 53% 54%
% Y/Y Growth 137% 111% 78% 48% 30% 27% 21% 24% 90% 25% 44%
% Q/Q Growth (6%) 24% 4% 22% (17%) 21% (1%) 25% -- -- --
Adjusted EBITDA $1,638 $1,969 $2,050 $2,475 $2,118 $2,507 $2,654 $3,240 $8,132 $10,519 $16,275
% Margin 65.5% 67.7% 64% 64% 60% 62% 62% 64% 65% 62% 67%
% Y/Y Growth 104% 92% 63% 43% 29% 27% 29% 31% 69% 29% 55%
% Q/Q Growth (5%) 20% 4% 21% (14%) 18% 6% 22% -- -- --
Net Interest (Income) and Other (Income) 0 4 61 19 1 0 (26) (27) 84 (52) (96)
Adjusted Pre-Tax Profit / (Loss) $1,415 $1,749 $1,759 $2,200 $1,839 $2,228 $2,235 $2,781 $7,123 $9,083 $13,056
% Effective Tax Rate 35% 35% 35% 31% 35% 36% 39% 38% 34% 37% 35%
Provision / (Benefit) for Income Taxes 433 595 530 413 420 554 607 792 1,971 2,373 3,958
Tax Adjustments for Non-GAAP Items 56 14 80 269 230 237 270 270 419 1,007 653
Net Income Attributable to Participating Securities 3 3 4 5 3 0 0 0 15 3 0
Minority Interest 0 0 0 0 0 0 0 0 0 0 0
Operating Net Income / (Loss) $923 $1,129 $1,145 $1,513 $1,189 $1,437 $1,358 $1,720 $4,710 $5,703 $8,445
% Margin 37% 39% 36% 39% 34% 36% 31% 34% 38% 34% 35%
% Y/Y Growth 169 115 74 85 29 27 19 14 114% 21% 48%
% Q/Q Growth 13 22 1 32 (21) 21 (6) 27 -- -- --0
Stock-Based Compensation 299 322 364 909 728 775 819 936 1,894 3,258 3,161
Tax Effect of Non-GAAP Entries (56) (14) (80) (269) (230) (237) (270) (270) (419) (1,007) (653)
Reported GAAP Net Income / (Loss) $639 $788 $802 $696 $512 $719 $792 $1,032 $2,925 $3,055 $5,937
% Margin 26% 27% 25% 18% 14% 18% 18% 20% 23% 18% 25%
% Y/Y Growth 194% 138% 90% 34% (20%) (9%) (1%) 48% 117% 4% 94%
% Q/Q Growth 23% 23% 2% (13%) (26%) 40% 10% 30% -- -- --
Weighted Avg. Diluted Shares Outstanding 2,609 2,615 2,644 2,816 2,836 2,850 2,737 2,757 2,664 2,897 3,042
Operating EPS $0.36 $0.43 $0.43 $0.54 $0.42 $0.50 $0.50 $0.62 $1.77 $1.97 $2.78
% Y/Y Growth 165% 116% 66% 63% 15% 17% 15% 16% 103% 11% 41%
% Q/Q Growth 10 19 0 24 (22) 20 (2) 26 -- -- --
Reported GAAP EPS $0.24 $0.30 $0.30 $0.25 $0.18 $0.25 $0.29 $0.37 $1.10 $1.05 $1.95
% Y/Y Growth 159% 130% 82% 21% (26%) (16%) (5%) 52% 106% (4%) 85%
% Q/Q Growth 19 23 1 (19) (27) 40 15 30 -- -- --
F2014 F2015
FB
Target Change
October 21, 2015
page 41 of 50 , Jefferies Equity Research, [email protected] US Internet Team
Please see important disclosure information on pages 46 - 50 of this report.

Table 11: Facebook Revenue Build ($MM)
Source: Company, Jefferies
Table 12: Facebook Balance Sheet ($MM)
Source: Company, Jefferies
Q1 14A Q2 14A Q3 14A Q4 14A Q1 15A Q2 15A Q3 15E Q4 15E F2014A F2015E F2016E
Total Revenue $2,502 $2,910 $3,203 $3,851 $3,543 $4,042 $4,314 $5,101 $12,466 $17,001 $24,196
% Y/Y Growth 72% 61% 59% 49% 42% 39% 35% 32% 58% 36% 42%
% Q/Q Growth -3% 16% 10% 20% -8% 14% 7% 18% -- -- --
Advertising Revenue $2,265 $2,676 $2,957 $3,594 $3,317 $3,827 $4,110 $4,888 $11,492 $16,142 $23,406
% Y/Y Growth 82% 67% 64% 53% 46% 43% 39% 36% 65% 40% 45%
% Q/Q Growth -3% 18% 11% 22% -8% 15% 7% 19% -- -- --
% of Total Revenue 91% 92% 92% 93% 94% 95% 95% 96% 92% 95% 97%
Mobile Advertising Revenue $1,336 $1,659 $1,952 $2,480 $2,421 $2,909 $3,247 $3,959 $7,427 $12,536 $20,597
% Y/Y Growth 258% 153% 122% 100% 81% 75% 66% 60% 136% 69% 64%
% Q/Q Growth 8% 24% 18% 27% -2% 20% 12% 22% -- -- --
% of Advertising Revenue 59% 62% 66% 69% 73% 76% 79% 81% 65% 78% 88%
Desktop Advertising Revenue $929 $1,017 $1,005 $1,114 $896 $918 $863 $929 $4,065 $3,606 $2,809
% Y/Y Growth 7% 8% 10% 1% -4% -10% -14% -17% 6% -11% -22%
% Q/Q Growth -16% 10% -1% 11% -20% 3% -6% 8% -- -- --
% of Advertising Revenue 41% 38% 34% 31% 27% 24% 21% 19% 35% 22% 12%
Payments and Other Revenue $237 $234 $246 $257 $226 $215 $204 $213 $974 $858 $790
% Y/Y Growth 11% 9% 13% 7% -5% -8% -17% -17% 10% -12% -8%
% Q/Q Growth -2% -1% 5% 4% -12% -5% -5% 4% -- -- --
% of Total Revenue 9% 8% 8% 7% 6% 5% 5% 4% 8% 5% 3%
F2014 F2015
Q1 14A Q2 14A Q3 14A Q4 14A Q1 15A Q2 15A Q3 15E Q4 15E F2014A F2015E F2016E
Cash & Cash Equivalents $2,998 $4,384 $8,999 $4,315 $3,419 $5,123 $5,631 $6,848 4,315 6,848 $16,753
Marketable Securities 9,631 9,572 5,251 6,884 8,994 9,002 9,002 9,002 6,884 9,002 9,002
Accounts Receivable 1,006 1,190 1,363 1,678 1,508 1,815 1,937 2,291 1,678 2,291 3,258
Deferred Income Taxes 0 0 0 0 0 0 89 111 0 111 80
Prepaid Expenses and Other Current Assets 425 411 502 793 1,083 1,011 968 1,058 793 1,058 1,581
Current Assets $14,060 $15,557 $16,115 $13,670 $15,004 $16,951 $17,628 $19,310 $13,670 $19,310 $30,675
Property and Equipment 3,074 3,334 3,703 3,967 4,619 4,955 5,373 5,959 3,967 5,959 5,789
Long-Term Investments 0 0 0 0 0 0 0 0 0 0 0
Goodwill 0 0 0 0 0 0 0 0 0 0 0
Intangible Assets 1,682 1,672 3,929 21,910 21,779 21,630 21,630 21,630 21,910 21,630 21,630
Long-Term Deferred Income Taxes 0 0 0 0 0 0 0 0 0 0 0
Other Long-Term Assets 212 206 441 637 605 594 228 249 637 249 861
Total Assets $19,028 $20,769 $24,188 $40,184 $42,007 $44,130 $44,859 $47,147 $40,184 $47,147 $58,955
Accounts Payable $85 $146 $120 $176 $129 $139 $120 $139 176 139 $246
Platform Partners Payable 188 176 208 202 189 182 0 0 202 0 82
Accrued Expenses & Other Current Liabilities 525 666 709 866 1,300 1,472 1,196 1,307 866 1,307 1,830
Deferred Revenue & Deposits 38 53 48 66 55 49 86 102 66 102 137
Current Portion of Capital Lease Obligations 201 173 149 114 73 39 39 39 114 39 39
Current Portion of Long-Term Debt 0 0 0 0 0 0 0 0 0 0 0
Total Current Liabilities $1,037 $1,214 $1,234 $1,424 $1,746 $1,881 $1,441 $1,587 $1,424 $1,587 $2,333
Long-Term Debt 0 0 0 0 0 0 0 0 0 0 0
Capital Lease Obligations 191 153 129 119 113 110 110 110 119 110 104
Other Long-Term Liabilities 1,063 1,056 1,587 2,545 2,647 2,687 2,278 2,489 2,545 2,489 4,458
Total Liabilities $2,291 $2,423 $2,950 $4,088 $4,506 $4,678 $3,829 $4,186 $4,088 $4,186 $6,896
Convertible Preferred Stock 0 0 0 0 0 0 0 0 0 0 0
Common Stock 0 0 0 0 0 0 0 0 0 0 0
Retained Earnings (Accumulated Deficit) 3,801 4,592 5,398 6,099 6,611 7,330 8,122 9,154 6,099 9,154 15,091
Additional Paid-In Capital 12,921 13,759 15,949 30,225 31,337 32,479 33,265 34,164 30,225 34,164 37,326
Accumulated Other Comprehensive Loss 15 (5) (109) (228) (447) (357) (357) (357) (228) (357) (357)
Shareholders' Equity $16,737 $18,346 $21,238 $36,096 $37,501 $39,452 $41,030 $42,961 $36,096 $42,961 $52,060
Liabilities & Shareholders' Equity $19,028 $20,769 $24,188 $40,184 $42,007 $44,130 $44,859 $47,147 $40,184 $47,147 $58,955
F2014 F2015
FB
Target Change
October 21, 2015
page 42 of 50 , Jefferies Equity Research, [email protected] US Internet Team
Please see important disclosure information on pages 46 - 50 of this report.

Table 13: Facebook Cash Flow Statement ($MM)
Source: Company, Jefferies
Table 14: Facebook DCF ($MM)
Source: Company, Jefferies
Q1 14A Q2 14A Q3 14A Q4 14A Q1 15A Q2 15A Q3 15E Q4 15E F2014A F2015E F2016E
Net Income $639 $788 $802 $701 $512 $719 $792 $1,032 $2,930 $3,055 $5,937
Depreciation 264 257 289 433 457 459 445 485 1,243 1,847 3,315
Amortization of Intangible Assets 0 0 0 0 0 0 0 0 0 0 0
Stock-Based Compensation 274 314 353 845 694 763 819 936 1,894 3,258 3,161
Tax Benefit from Stock Options 345 530 479 499 423 386 0 0 1,853 809 0
Excess Tax Benefit from Stock Options (348) (535) (482) (504) (417) (386) 0 0 (1,869) (803) 0
Deferred Taxes (1) (33) 4 (180) (223) (66) 0 0 (210) (289) 0
(Gain) / Loss on Sale of PP&E (13) 0 0 0 0 0 0 0 (13) 0 0
Other / Charges 9 (16) 1 2 0 1 0 0 (4) 1 0
Funds From Operations $1,169 $1,305 $1,446 $1,796 $1,446 $1,876 $2,056 $2,454 $5,824 $7,878 $12,413
(Inc.) Dec. in Accounts Receivable 105 (187) (182) (346) 84 (282) (122) (353) (610) (674) (968)
(Inc.) Dec. in Prepaid Expenses and Other Assets (4) 14 (55) (78) (43) (47) (47) (112) (123) (248) (492)
(Inc.) Dec. in Other Assets 16 2 (176) (58) (32) 7 366 (21) (216) 320 (612)
Inc. (Dec.) in Accounts Payable (10) 79 (57) 19 (15) 31 (19) 19 31 16 107
Inc. (Dec.) in Platform Partners Payables 7 (12) (17) (6) (13) (6) (182) 0 (28) (201) 82
Inc. (Dec.) in Accrued Expenses and Other Liabilities (27) 102 123 130 134 107 (276) 111 328 76 523
Inc. (Dec.) in Deferred Revenue & Deposits 0 15 (12) 7 (10) (7) 37 16 10 36 35
Inc. (Dec.) in Other Liabilities 26 23 178 119 149 201 (409) 211 346 152 1,969
Change in Net Working Capital $113 $36 ($198) ($213) $254 $4 ($652) ($129) ($262) ($523) $643
Cash Flow from Operations $1,282 $1,341 $1,248 $1,583 $1,700 $1,880 $1,404 $2,325 $5,562 $7,355 $13,057
Purchases of Property & Equipment (363) (469) (482) (517) (502) (549) (863) (1,071) (1,831) (2,985) (3,145)
Purchases of Marketable Securities (2,974) (1,508) (1,733) (2,889) (3,055) (2,505) 0 0 (9,104) (5,560) 0
Maturities and Sales of Marketable Securities 1,466 1,576 6,059 1,047 947 2,494 0 0 10,148 3,441 0
Acquisitions, Net of Cash Acquired 0 (19) (735) 199 (257) (25) 0 0 (555) (282) 0
Proceeds from Sales of PP&E 0 0 0 0 0 0 0 0 0 0 0
Change in Restricted Cash and Other (1) (2) (112) (4,456) 23 21 0 0 (4,571) 44 0
Net Cash Used in Investing Activities ($1,872) ($422) $2,997 ($6,616) ($2,844) ($564) ($863) ($1,071) ($5,913) ($5,342) ($3,145)
Debt Issuance / (Repayment) 0 0 0 0 0 0 0 0 0 0 0
Proceeds from / (Repurchase of) Stock 0 0 0 0 0 0 (33) (37) 0 (70) 0
Proceeds from Exercise of Stock Options 1 1 5 11 0 0 0 0 18 0 0
Proceeds from Sale and Lease-back Transactions 0 0 0 0 0 0 0 0 0 0 0
Principal Payments on Capital Lease Obligations (84) (66) (49) (44) (47) (44) 0 0 (243) (91) (6)
Excess Tax Benefit from Stock Options 345 535 482 434 418 386 0 0 1,796 804 0
Net Cash Provided by Financing Activities $262 $470 $438 $401 $371 $342 ($33) ($37) $1,571 $643 ($6)
Effect of Exchange Rate Changes 3 (3) (68) (52) (123) 46 0 0 (120) (77) 0
Inc. (Dec.) in Cash and Cash Equivalents ($325) $1,386 $4,615 ($4,684) ($896) $1,704 $508 $1,217 $1,100 $2,579 $9,905
Beginning Cash and Cash Equivalents 3,323 2,998 4,384 8,999 4,315 3,419 5,123 5,631 3,323 4,315 6,848
Ending Cash and Cash Equivalents $2,998 $4,384 $8,999 $4,315 $3,419 $5,123 $5,631 $6,848 $4,423 $6,894 $16,753
F2014 F2015
2015
2014A Q1 15A Q2 15A Q3 15E Q4 15E 2016E 2017E 2018E 2019E 2020E 2021E 2022E 2023E 2024E
Revenue $12,466 $3,543 $4,042 $4,314 $5,101 $24,196 $32,560 $38,234 $44,193 $51,119 $58,659 $67,340 $76,663 $87,300
% Y/Y Growth 58% 42% 39% 35% 32% 42% 35% 17% 16% 16% 15% 15% 14% 14%
EBITDA $8,132 $2,118 $2,507 $2,654 $3,240 $16,275 $21,696 $25,837 $30,390 $35,792 $41,862 $48,974 $56,844 $65,960
% Margin 65% 60% 62% 62% 64% 67% 67% 68% 69% 70% 71% 73% 74% 76%
% Y/Y Growth 69 29 27 29 31 55 33 19 18 18 17 17 16 16
Implied Taxes on Operations ($2,729) ($749) ($890) ($942) ($1,150) ($5,696) ($8,176) ($10,013) ($12,027) ($14,121) ($16,768) ($19,426) ($22,259) ($26,036)
% Effective Tax Rate 34% 35% 36% 36% 36% 35% 38% 39% 40% 39% 40% 40% 39% 39%
Capital Expenditures ($1,831) ($502) ($549) ($863) ($1,071) ($3,145) ($4,233) ($4,970) ($5,745) ($6,645) ($7,626) ($8,754) ($9,966) ($11,349)
% Y/Y Growth 34% 38% 17% 79% 107% 5% 35% 17% 16% 16% 15% 15% 14% 14%
Change in Net Working Capital ($262) $254 $4 ($652) ($129) $643 ($327) $130 ($277) ($145) ($331) ($363) ($501) ($603)
Tax Benefit from NOL Carryforwards 0 0 0 (17) (21) 0 0 0 0 0 0 0 0 0
Acquisitions Not Reflected on Balance Sheet / Shares-- -- -- 0 0 0 0 0 0 0 0 0 0 0
Unlevered Free Cash Flow $3,310 $1,121 $1,072 $180 $869 $8,077 $8,960 $10,984 $12,341 $14,880 $17,137 $20,431 $24,118 $27,972
NPV at 6/30/15 Valuation Date and 9.6% WACC -- -- $176 $830 $7,368 $7,462 $8,349 $8,563 $9,422 $9,906 $10,780 $11,616 $12,294
Perpetuity Growth Rate / Terminal Value at 9.6% WACC Implied Terminal Value / Terminal EBITDA Multiple
3.0% 3.5% 4.0% 4.5% 5.0% 9.4x 10.2x 11.2x 12.3x 13.8x
$618,121 $672,449 $736,564 $813,375 $907,064 $618,121 $672,449 $736,564 $813,375 $907,064
Median DCF Valuation at 6/30/15 Valuation Date WACC Equity Value per Share
NPV of Cash Flows and Terminal Value $382,276 8% $134 $142 $152 $165 $179
Plus: Net Cash 14,125 9% 124 131 141 152 165
Implied Equity Value $396,401 10% 114 121 130 140 152
Implied Fully Diluted Shares Outstanding (MM) 3,054 11% 106 112 120 129 140
Implied Equity Value per Share $130 12% 98 104 111 120 130
FB
Target Change
October 21, 2015
page 43 of 50 , Jefferies Equity Research, [email protected] US Internet Team
Please see important disclosure information on pages 46 - 50 of this report.
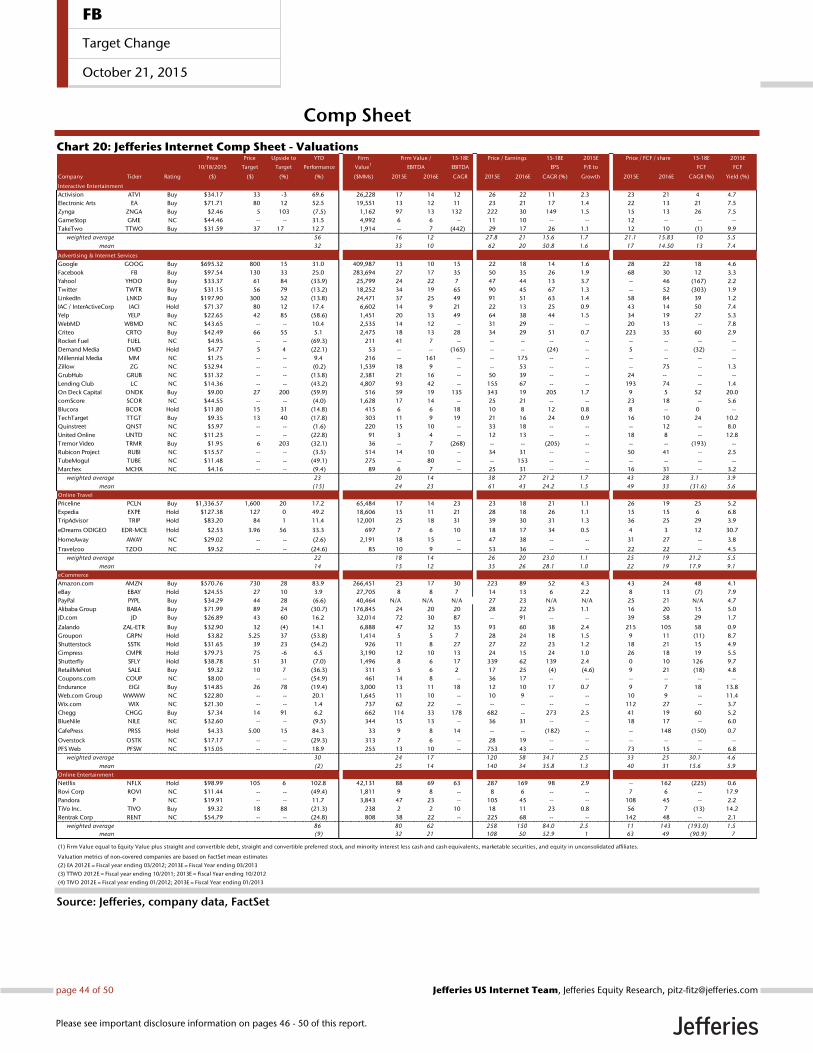
Comp Sheet
Chart 20: Jefferies Internet Comp Sheet - Valuations
Source: Jefferies, company data, FactSet
Price Price Upside to YTD Firm 15-18E 15-18E 2015E 15-18E 2015E
10/18/2015 Target Target Performance Value1
EBITDA EPS P/E to FCF FCF
Company Ticker Rating ($) ($) (%) (%) ($MMs) 2015E 2016E CAGR 2015E 2016E CAGR (%) Growth 2015E 2016E CAGR (%) Yield (%)
Interactive Entertainment
Activision ATVI Buy $34.17 33 -3 69.6 26,228 17 14 12 26 22 11 2.3 23 21 4 4.7
Electronic Arts EA Buy $71.71 80 12 52.5 19,551 13 12 11 23 21 17 1.4 22 13 21 7.5
Zynga ZNGA Buy $2.46 5 103 (7.5) 1,162 97 13 132 222 30 149 1.5 15 13 26 7.5
GameStop GME NC $44.46 -- -- 31.5 4,992 6 6 -- 11 10 -- -- 12 -- -- --
TakeTwo TTWO Buy $31.59 37 17 12.7 1,914 -- 7 (442) 29 17 26 1.1 12 10 (1) 9.9
weighted average 56 16 12 27.8 21 15.6 1.7 21.1 15.83 10 5.5
mean 32 33 10 62 20 50.8 1.6 17 14.50 13 7.4
Advertising & Internet Services
Google GOOG Buy $695.32 800 15 31.0 409,987 13 10 15 22 18 14 1.6 28 22 18 4.6
Facebook FB Buy $97.54 130 33 25.0 283,694 27 17 35 50 35 26 1.9 68 30 12 3.3
Yahoo! YHOO Buy $33.37 61 84 (33.9) 25,799 24 22 7 47 44 13 3.7 -- 46 (167) 2.2
Twitter TWTR Buy $31.15 56 79 (13.2) 18,252 34 19 65 90 45 67 1.3 -- 52 (303) 1.9
LinkedIn LNKD Buy $197.90 300 52 (13.8) 24,471 37 25 49 91 51 63 1.4 58 84 39 1.2
IAC / InterActiveCorp IACI Hold $71.37 80 12 17.4 6,602 14 9 21 22 13 25 0.9 43 14 50 7.4
Yelp YELP Buy $22.65 42 85 (58.6) 1,451 20 13 49 64 38 44 1.5 34 19 27 5.3
WebMD WBMD NC $43.65 -- -- 10.4 2,535 14 12 -- 31 29 -- -- 20 13 -- 7.8
Criteo CRTO Buy $42.49 66 55 5.1 2,475 18 13 28 34 29 51 0.7 223 35 60 2.9
Rocket Fuel FUEL NC $4.95 -- -- (69.3) 211 41 7 -- -- -- -- -- -- -- -- --
Demand Media DMD Hold $4.77 5 4 (22.1) 53 -- -- (165) -- -- (24) -- 5 -- (32) --
Millennial Media MM NC $1.75 -- -- 9.4 216 -- 161 -- -- 175 -- -- -- -- -- --
Zillow ZG NC $32.94 -- -- (0.2) 1,539 18 9 -- -- 53 -- -- -- 75 -- 1.3
GrubHub GRUB NC $31.32 -- -- (13.8) 2,381 21 16 -- 50 39 -- -- 24 -- -- --
Lending Club LC NC $14.36 -- -- (43.2) 4,807 93 42 -- 155 67 -- -- 193 74 -- 1.4
On Deck Capital ONDK Buy $9.00 27 200 (59.9) 516 59 19 135 343 19 205 1.7 9 5 52 20.0
comScore SCOR NC $44.55 -- -- (4.0) 1,628 17 14 -- 25 21 -- -- 23 18 -- 5.6
Blucora BCOR Hold $11.80 15 31 (14.8) 415 6 6 18 10 8 12 0.8 8 -- 0 --
TechTarget TTGT Buy $9.35 13 40 (17.8) 303 11 9 19 21 16 24 0.9 16 10 24 10.2
Quinstreet QNST NC $5.97 -- -- (1.6) 220 15 10 -- 33 18 -- -- -- 12 -- 8.0
United Online UNTD NC $11.23 -- -- (22.8) 91 3 4 -- 12 13 -- -- 18 8 -- 12.8
Tremor Video TRMR Buy $1.95 6 203 (32.1) 36 -- 7 (268) -- -- (205) -- -- -- (193) --
Rubicon Project RUBI NC $15.57 -- -- (3.5) 514 14 10 -- 34 31 -- -- 50 41 -- 2.5
TubeMogul TUBE NC $11.48 -- -- (49.1) 275 -- 80 -- -- 153 -- -- -- -- -- --
Marchex MCHX NC $4.16 -- -- (9.4) 89 6 7 -- 25 31 -- -- 16 31 -- 3.2
weighted average 23 20 14 38 27 21.2 1.7 43 28 3.1 3.9
mean (15) 24 23 61 43 24.2 1.5 49 33 (31.6) 5.6
Online Travel
Priceline PCLN Buy $1,336.57 1,600 20 17.2 65,484 17 14 23 23 18 21 1.1 26 19 25 5.2
Expedia EXPE Hold $127.38 127 0 49.2 18,606 15 11 21 28 18 26 1.1 15 15 6 6.8
TripAdvisor TRIP Hold $83.20 84 1 11.4 12,001 25 18 31 39 30 31 1.3 36 25 29 3.9
eDreams ODIGEO EDR-MCE Hold $2.53 3.96 56 33.3 697 7 6 10 18 17 34 0.5 4 3 12 30.7
HomeAway AWAY NC $29.02 -- -- (2.6) 2,191 18 15 -- 47 38 -- -- 31 27 -- 3.8
Travelzoo TZOO NC $9.52 -- -- (24.6) 85 10 9 -- 53 36 -- -- 22 22 -- 4.5
weighted average 22 18 14 26 20 23.0 1.1 25 19 21.2 5.5
mean 14 15 12 35 26 28.1 1.0 22 19 17.9 9.1
eCommerce
Amazon.com AMZN Buy $570.76 730 28 83.9 266,451 23 17 30 223 89 52 4.3 43 24 48 4.1
eBay EBAY Hold $24.55 27 10 3.9 27,705 8 8 7 14 13 6 2.2 8 13 (7) 7.9
PayPal PYPL Buy $34.29 44 28 (6.6) 40,464 N/A N/A N/A 27 23 N/A N/A 25 21 N/A 4.7
Alibaba Group BABA Buy $71.99 89 24 (30.7) 176,845 24 20 20 28 22 25 1.1 16 20 15 5.0
JD.com JD Buy $26.89 43 60 16.2 32,014 72 30 87 -- 91 -- -- 39 58 29 1.7
Zalando ZAL-ETR Buy $32.90 32 (4) 14.1 6,888 47 32 35 93 60 38 2.4 215 105 58 0.9
Groupon GRPN Hold $3.82 5.25 37 (53.8) 1,414 5 5 7 28 24 18 1.5 9 11 (11) 8.7
Shutterstock SSTK Hold $31.65 39 23 (54.2) 926 11 8 27 27 22 23 1.2 18 21 15 4.9
Cimpress CMPR Hold $79.73 75 -6 6.5 3,190 12 10 13 24 15 24 1.0 26 18 19 5.5
Shutterfly SFLY Hold $38.78 51 31 (7.0) 1,496 8 6 17 339 62 139 2.4 0 10 126 9.7
RetailMeNot SALE Buy $9.32 10 7 (36.3) 311 5 6 2 17 25 (4) (4.6) 9 21 (18) 4.8
Coupons.com COUP NC $8.00 -- -- (54.9) 461 14 8 -- 36 17 -- -- -- -- -- --
Endurance EIGI Buy $14.85 26 78 (19.4) 3,000 13 11 18 12 10 17 0.7 9 7 18 13.8
Web.com Group WWWW NC $22.80 -- -- 20.1 1,645 11 10 -- 10 9 -- -- 10 9 -- 11.4
Wix.com WIX NC $21.30 -- -- 1.4 737 62 22 -- -- -- -- -- 112 27 -- 3.7
Chegg CHGG Buy $7.34 14 91 6.2 662 114 33 178 682 -- 273 2.5 41 19 60 5.2
BlueNile NILE NC $32.60 -- -- (9.5) 344 15 13 -- 36 31 -- -- 18 17 -- 6.0
CafePress PRSS Hold $4.33 5.00 15 84.3 33 9 8 14 -- -- (182) -- -- 148 (150) 0.7
Overstock OSTK NC $17.17 -- -- (29.3) 313 7 6 -- 28 19 -- -- -- -- -- --
PFS Web PFSW NC $15.05 -- -- 18.9 255 13 10 -- 753 43 -- -- 73 15 -- 6.8
weighted average 30 24 17 120 58 34.1 2.5 33 25 30.1 4.6
mean (2) 25 14 140 34 35.8 1.3 40 31 15.6 5.9
Online Entertainment
Netflix NFLX Hold $98.99 105 6 102.8 42,131 88 69 63 287 169 98 2.9 -- 162 (225) 0.6
Rovi Corp ROVI NC $11.44 -- -- (49.4) 1,811 9 8 -- 8 6 -- -- 7 6 -- 17.9
Pandora P NC $19.91 -- -- 11.7 3,843 47 23 -- 105 45 -- -- 108 45 -- 2.2
TiVo Inc. TIVO Buy $9.32 18 88 (21.3) 238 2 2 10 18 11 23 0.8 56 7 (13) 14.2
Rentrak Corp RENT NC $54.79 -- -- (24.8) 808 38 22 -- 225 68 -- -- 142 48 -- 2.1
weighted average 86 80 62 258 150 84.0 2.5 11 143 (193.0) 1.5
mean (9) 32 21 108 50 52.9 1 63 49 (90.9) 7
Valuation metrics of non-covered companies are based on FactSet mean estimates
(2) EA 2012E = Fiscal year ending 03/2012; 2013E = Fiscal Year ending 03/2013
(3) TTWO 2012E = Fiscal year ending 10/2011; 2013E = Fiscal Year ending 10/2012
(4) TIVO 2012E = Fiscal year ending 01/2012; 2013E = Fiscal Year ending 01/2013
(1) Firm Value equal to Equity Value plus straight and convertible debt, straight and convertible preferred stock, and minority interest less cash and cash equivalents, marketable securities, and equity in unconsolidated affiliates.
Price / Earnings
Firm Value /
EBITDA
Price / FCF / share
FB
Target Change
October 21, 2015
page 44 of 50 , Jefferies Equity Research, [email protected] US Internet Team
Please see important disclosure information on pages 46 - 50 of this report.

Chart 21: Jefferies Internet Comp Sheet - Estimates
Source: Jefferies, company data, FactSet
Market Cap
10/18/2015
Company Ticker Rating ($MM) 2015E 2016E 2015E 2016E 2015E 2016E 2015E 2016E 2015E 2016E 2015E 2016E 2015 2016 Gross Operating
Interactive Entertainment
Activision ATVI Buy $26,752 4,609 5,242 4,655 5,006 1,555 1,851 1,609 1,840 1.33 1.54 1.34 1.56 1,145 1,261 68.3 31.9
Electronic Arts EA Buy $21,797 4,538 4,833 4,541 4,784 1,468 1,580 1,394 1,551 3.08 3.39 2.95 3.38 1,011 1,630 74.0 27.7
Zynga ZNGA Buy 2,261 799 867 705 793 21 168 12 90 0.01 0.08 (0.03) 0.04 150 170 71.6 1.1
GameStop GME NC 4,717 -- -- 9,603 9,944 -- -- 831 888 -- -- 3.87 4.38 391 -- -- --
TakeTwo TTWO Buy 3,335 1,209 1,708 1,432 1,696 (9) 285 171 264 1.09 1.83 1.01 1.65 282 330 41.4 (3.2)
Advertising & Internet Services
Google GOOG Buy 481,951 62,163 73,380 60,074 69,857 32,167 40,210 29,835 34,731 31.50 37.89 28.86 33.76 17,120 22,173 79.6 43.4
Facebook FB Buy 297,819 17,001 24,196 17,207 23,365 10,519 16,275 10,838 14,510 1.97 2.78 2.07 2.74 4,370 9,911 83.8 53.1
Yahoo! YHOO Buy 31,465 4,157 4,100 4,188 4,142 1,069 1,155 991 985 0.71 0.76 0.67 0.69 (1,883) 678 73.9 10.8
Twitter TWTR Buy 21,573 2,273 3,342 2,240 3,237 541 938 540 892 0.35 0.69 0.33 0.62 (122) 416 71.4 14.0
LinkedIn LNKD Buy 26,375 2,937 3,895 2,953 3,853 664 991 671 989 2.19 3.89 2.23 3.56 453 313 87.6 13.3
IAC / InterActiveCorp IACI Hold 6,515 3,189 3,438 3,216 3,507 477 717 485 662 3.20 5.44 3.10 4.11 153 482 73.4 9.4
Yelp YELP Buy 1,806 547 694 546 695 73 114 76 115 0.35 0.59 (0.15) 0.05 53 97 90.7 5.3
WebMD WBMD NC 1,641 -- -- 630 682 -- -- 188 211 -- -- 1.39 1.52 81 128 -- --
Criteo CRTO Buy 2,777 521 624 541 709 139 187 140 198 1.26 1.48 1.21 1.73 12 80 35.9 18.2
Rocket Fuel FUEL NC 216 -- -- 504 587 -- -- 5 28 -- -- (0.95) (0.61) (34) (6) -- --
Demand Media DMD Hold 95 130 150 131 145 (7) (9) (7) (7) (1.27) (0.97) (1.31) (1.30) 20 (12) 46.0 (33.0)
Millennial Media MM NC 247 -- -- 272 274 -- -- (24) 1 -- -- (0.20) 0.01 (29) (7) -- --
Zillow ZG NC 5,365 -- -- 666 841 -- -- 86 177 -- -- (0.05) 0.62 (26) 75 -- --
GrubHub GRUB NC 2,607 -- -- 364 469 -- -- 111 147 -- -- 0.63 0.81 111 129 -- --
Lending Club LC NC 5,388 -- -- 405 630 -- -- 52 116 -- -- 0.09 0.22 28 73 -- --
On Deck Capital ONDK Buy 689 248 383 247 338 9 28 8 27 0.03 0.48 0.02 0.37 81 138 58.5 0.6
comScore SCOR NC 1,791 -- -- 377 439 -- -- 94 115 -- -- 1.78 2.15 75 98 -- --
Blucora BCOR Hold 493 479 808 470 533 72 106 72 78 1.24 1.54 1.28 1.34 60 (478) -- 18.9
TechTarget TTGT Buy 339 119 135 118 134 28 34 27 34 0.44 0.60 0.39 0.50 22 34 74.4 11.5
Quinstreet QNST NC 269 -- -- 296 322 -- -- 15 23 -- -- 0.18 0.34 -- 21 -- --
United Online UNTD NC 169 -- -- 206 214 -- -- 35 36 -- -- 0.93 0.88 9 21 -- --
Tremor Video TRMR Buy 100 200 246 197 230 (4) 5 (6) 3 (0.21) (0.02) (0.37) (0.20) (8) (2) 40.5 (5.5)
Rubicon Project RUBI NC 688 -- -- 248 331 -- -- 37 52 -- -- 0.46 0.51 14 17 -- --
TubeMogul TUBE NC 397 -- -- 166 207 -- -- (6) 3 -- -- (0.23) 0.08 (22) (5) -- --
Marchex MCHX NC 155 -- -- 143 146 -- -- 15 12 -- -- 0.17 0.14 10 5 -- --
Online Travel
Priceline PCLN Buy 69,667 9,280 11,112 9,238 10,878 3,745 4,784 3,652 4,408 58.56 74.08 57.06 69.00 2,667 3,651 93.1 37.7
Expedia EXPE Hold 17,865 6,686 8,403 6,580 8,031 1,214 1,729 1,154 1,492 4.52 7.21 4.30 5.96 1,179 1,214 80.9 11.2
TripAdvisor TRIP Hold 12,459 1,541 1,928 1,540 1,878 484 667 488 615 2.13 2.81 2.07 2.59 350 489 95.9 25.6
eDreams ODIGEO EDR-MCE Hold 266 517 564 511 543 105 118 105 114 0.14 0.15 0.17 0.27 70 82 -- --
HomeAway AWAY NC 2,785 -- -- 500 579 -- -- 122 149 -- -- 0.62 0.77 90 105 -- --
Travelzoo TZOO NC 140 -- -- 132 135 -- -- 8 9 -- -- 0.18 0.26 6 6 -- --
eCommerce
Amazon.com AMZN Buy 270,816 107,119 127,057 105,914 126,552 11,459 15,792 10,430 13,607 2.56 6.41 1.62 4.89 6,236 11,194 33.4 2.7
eBay EBAY Hold 30,761 8,625 9,000 8,609 9,036 3,428 3,623 3,432 3,636 1.77 1.84 1.79 1.92 3,691 2,438 80.8 32.7
PayPal PYPL Buy 42,965 9,241 10,770 9,236 10,729 -- -- 2,481 2,884 1.23 1.48 1.25 1.49 1,729 2,011 -- --
Alibaba Group BABA Buy 187,811 14,519 18,433 14,416 18,699 7,373 8,964 7,394 9,491 2.55 3.21 2.49 3.06 11,853 9,473 67.7 28.3
JD.com JD Buy 36,766 27,761 38,832 28,492 39,747 442 1,081 26 462 (0.01) 0.29 (0.21) 0.03 935 636 13.3 (1.5)
Zalando ZAL-ETR Buy 8,053 3,089 3,688 3,310 4,101 148 212 165 245 0.36 0.55 0.41 0.64 37 76 45.3 3.6
Groupon GRPN Hold 2,674 3,165 3,415 3,177 3,509 295 305 290 337 0.14 0.16 0.13 0.19 312 233 44.5 5.5
Shutterstock SSTK Hold 1,279 428 536 426 519 83 119 83 108 1.16 1.44 1.17 1.50 70 62 60.2 16.3
Cimpress CMPR Hold 2,719 1,650 1,815 1,588 1,767 266 333 245 269 3.37 5.21 3.72 3.53 104 149 61.7 8.2
Shutterfly SFLY Hold 1,435 1,060 1,206 1,057 1,192 194 235 192 229 0.11 0.63 (0.15) 0.45 13 139 51.6 10.2
RetailMeNot SALE Buy 513 236 236 237 242 60 51 61 63 0.54 0.37 0.60 0.59 56 24 91.9 18.2
Coupons.com COUP NC 677 -- -- 261 320 -- -- 34 59 -- -- 0.22 0.46 -- -- -- --
Endurance EIGI Buy 1,969 754 863 752 853 235 280 267 313 1.28 1.55 1.26 1.56 224 271 60.6 27.1
Web.com Group WWWW NC 1,187 -- -- 557 581 -- -- 152 166 -- -- 2.40 2.68 117 133 -- --
Wix.com WIX NC 844 -- -- 203 271 -- -- 12 34 -- -- (1.33) (1.01) 8 31 -- --
Chegg CHGG Buy 729 311 302 306 283 6 20 4 24 0.01 (0.07) (0.04) 0.20 18 38 36.9 (3.5)
BlueNile NILE NC 383 -- -- 496 526 -- -- 24 26 -- -- 0.90 1.06 21 23 -- --
CafePress PRSS Hold 76 106 114 111 117 4 4 4 6 (0.11) (0.10) (0.18) (0.00) (9) 1 39.6 (2.9)
Overstock OSTK NC 430 -- -- 1,723 1,939 -- -- 44 53 -- -- 0.61 0.91 -- -- -- --
PFS Web PFSW NC 276 -- -- 199 243 -- -- 19 24 -- -- 0.02 0.35 4 19 -- --
Online Entertainment
Netflix NFLX Hold 42,341 6,777 8,430 6,787 8,706 481 607 493 603 0.35 0.58 0.20 0.31 (641) 262 32.2 2.2
Rovi Corp ROVI NC 991 -- -- 517 574 -- -- 195 231 -- -- 1.50 2.07 148 178 -- --
Pandora P NC 4,269 -- -- 1,182 1,451 -- -- 82 169 -- -- 0.19 0.45 39 93 -- --
TiVo Inc. TIVO Buy 951 452 507 478 498 108 135 121 143 0.53 0.85 0.31 0.52 17 135 62.3 23.6
Rentrak Corp RENT NC 858 -- -- 129 173 -- -- 21 37 -- -- 0.24 0.81 6 18 -- --
(1) All figures represent "Operating EPS", defined to excludes SBC and 1x items as per Mgmt, except the following companies which are GAAP: AMZN, AOL, NFLX, TIVO, VCLK
(2) FCF for non-covered companies are FactSet means
(3) EA 2012E = Fiscal year ending 03/2012; 2013E = Fiscal Year ending 03/2013
(4) TTWO 2012E = Fiscal year ending 3/2012; 2013E = Fiscal Year ending 3/2013
(5) TIVO 2012E = Fiscal year ending 01/2012; 2013E = Fiscal Year ending 01/2013
EPS1 ($)
Jefferies Estimate Consensus
FCF2 ($MM) 2015E Margin (%) Revenue ($MM)
Jefferies Estimate Consensus
EBITDA ($MM)
Jefferies Estimate Consensus
FB
Target Change
October 21, 2015
page 45 of 50 , Jefferies Equity Research, [email protected] US Internet Team
Please see important disclosure information on pages 46 - 50 of this report.
Company DescriptionFacebook, Inc. operates the world’s largest social network. The company builds tools that enable users to connect and communicate witheach other; enables developers to build social applications on Facebook or to integrate their Websites with Facebook; and offers products thatenable advertisers to engage with users. The company was founded in 2004 and is headquartered in Menlo Park, California.
Analyst Certification:I, Jefferies US Internet Team, certify that all of the views expressed in this research report accurately reflect my personal views about the subjectsecurity(ies) and subject company(ies). I also certify that no part of my compensation was, is, or will be, directly or indirectly, related to the specificrecommendations or views expressed in this research report.I, Brian Pitz, certify that all of the views expressed in this research report accurately reflect my personal views about the subject security(ies) and subjectcompany(ies). I also certify that no part of my compensation was, is, or will be, directly or indirectly, related to the specific recommendations or viewsexpressed in this research report.I, Brian Fitzgerald, certify that all of the views expressed in this research report accurately reflect my personal views about the subject security(ies) andsubject company(ies). I also certify that no part of my compensation was, is, or will be, directly or indirectly, related to the specific recommendationsor views expressed in this research report.I, Timothy O'Shea, certify that all of the views expressed in this research report accurately reflect my personal views about the subject security(ies) andsubject company(ies). I also certify that no part of my compensation was, is, or will be, directly or indirectly, related to the specific recommendationsor views expressed in this research report.I, Stan Velikov, CFA, certify that all of the views expressed in this research report accurately reflect my personal views about the subject security(ies) andsubject company(ies). I also certify that no part of my compensation was, is, or will be, directly or indirectly, related to the specific recommendationsor views expressed in this research report.I, Corey Werbelow, certify that all of the views expressed in this research report accurately reflect my personal views about the subject security(ies) andsubject company(ies). I also certify that no part of my compensation was, is, or will be, directly or indirectly, related to the specific recommendationsor views expressed in this research report.I, John Streppa, CFA, certify that all of the views expressed in this research report accurately reflect my personal views about the subject security(ies) andsubject company(ies). I also certify that no part of my compensation was, is, or will be, directly or indirectly, related to the specific recommendationsor views expressed in this research report.As is the case with all Jefferies employees, the analyst(s) responsible for the coverage of the financial instruments discussed in this report receivescompensation based in part on the overall performance of the firm, including investment banking income. We seek to update our research asappropriate, but various regulations may prevent us from doing so. Aside from certain industry reports published on a periodic basis, the large majorityof reports are published at irregular intervals as appropriate in the analyst's judgement.
Company Specific DisclosuresFor Important Disclosure information on companies recommended in this report, please visit our website at https://javatar.bluematrix.com/sellside/Disclosures.action or call 212.284.2300.
Explanation of Jefferies RatingsBuy - Describes securities that we expect to provide a total return (price appreciation plus yield) of 15% or more within a 12-month period.Hold - Describes securities that we expect to provide a total return (price appreciation plus yield) of plus 15% or minus 10% within a 12-month period.Underperform - Describes securities that we expect to provide a total return (price appreciation plus yield) of minus 10% or less within a 12-monthperiod.The expected total return (price appreciation plus yield) for Buy rated securities with an average security price consistently below $10 is 20% or morewithin a 12-month period as these companies are typically more volatile than the overall stock market. For Hold rated securities with an averagesecurity price consistently below $10, the expected total return (price appreciation plus yield) is plus or minus 20% within a 12-month period. ForUnderperform rated securities with an average security price consistently below $10, the expected total return (price appreciation plus yield) is minus20% or less within a 12-month period.NR - The investment rating and price target have been temporarily suspended. Such suspensions are in compliance with applicable regulations and/or Jefferies policies.CS - Coverage Suspended. Jefferies has suspended coverage of this company.NC - Not covered. Jefferies does not cover this company.Restricted - Describes issuers where, in conjunction with Jefferies engagement in certain transactions, company policy or applicable securitiesregulations prohibit certain types of communications, including investment recommendations.Monitor - Describes securities whose company fundamentals and financials are being monitored, and for which no financial projections or opinionson the investment merits of the company are provided.
Valuation MethodologyJefferies' methodology for assigning ratings may include the following: market capitalization, maturity, growth/value, volatility and expected totalreturn over the next 12 months. The price targets are based on several methodologies, which may include, but are not restricted to, analyses of marketrisk, growth rate, revenue stream, discounted cash flow (DCF), EBITDA, EPS, cash flow (CF), free cash flow (FCF), EV/EBITDA, P/E, PE/growth, P/CF,
FB
Target Change
October 21, 2015
page 46 of 50 , Jefferies Equity Research, [email protected] US Internet Team
Please see important disclosure information on pages 46 - 50 of this report.

P/FCF, premium (discount)/average group EV/EBITDA, premium (discount)/average group P/E, sum of the parts, net asset value, dividend returns,and return on equity (ROE) over the next 12 months.
Jefferies Franchise PicksJefferies Franchise Picks include stock selections from among the best stock ideas from our equity analysts over a 12 month period. Stock selectionis based on fundamental analysis and may take into account other factors such as analyst conviction, differentiated analysis, a favorable risk/rewardratio and investment themes that Jefferies analysts are recommending. Jefferies Franchise Picks will include only Buy rated stocks and the numbercan vary depending on analyst recommendations for inclusion. Stocks will be added as new opportunities arise and removed when the reason forinclusion changes, the stock has met its desired return, if it is no longer rated Buy and/or if it triggers a stop loss. Stocks having 120 day volatility inthe bottom quartile of S&P stocks will continue to have a 15% stop loss, and the remainder will have a 20% stop. Franchise Picks are not intendedto represent a recommended portfolio of stocks and is not sector based, but we may note where we believe a Pick falls within an investment stylesuch as growth or value.
Risks which may impede the achievement of our Price TargetThis report was prepared for general circulation and does not provide investment recommendations specific to individual investors. As such, thefinancial instruments discussed in this report may not be suitable for all investors and investors must make their own investment decisions basedupon their specific investment objectives and financial situation utilizing their own financial advisors as they deem necessary. Past performance ofthe financial instruments recommended in this report should not be taken as an indication or guarantee of future results. The price, value of, andincome from, any of the financial instruments mentioned in this report can rise as well as fall and may be affected by changes in economic, financialand political factors. If a financial instrument is denominated in a currency other than the investor's home currency, a change in exchange rates mayadversely affect the price of, value of, or income derived from the financial instrument described in this report. In addition, investors in securities suchas ADRs, whose values are affected by the currency of the underlying security, effectively assume currency risk.
Other Companies Mentioned in This Report• Activision Blizzard, Inc. (ATVI: $33.78, BUY)• Alibaba Group Holding Limited (BABA: $69.48, BUY)• Amazon.com, Inc (AMZN: $555.77, BUY)• Blucora Inc. (BCOR: $11.14, HOLD)• CafePress, Inc. (PRSS: $4.62, HOLD)• Chegg Inc. (CHGG: $7.01, BUY)• Cimpress N.V. (CMPR: $75.33, HOLD)• Criteo S.A. (CRTO: $42.73, BUY)• Demand Media, Inc. (DMD: $4.44, HOLD)• eBay, Inc. (EBAY: $24.21, HOLD)• eDreams ODIGEO SA (EDR SM: €2.35, HOLD)• Electronic Arts Inc. (EA: $72.79, BUY)• Expedia, Inc (EXPE: $129.14, HOLD)• Facebook, Inc. (FB: $98.47, BUY)• Google, Inc. (GOOG: $642.61, BUY)• Groupon (GRPN: $3.64, HOLD)• IAC / InterActiveCorp (IACI: $67.35, HOLD)• JD.com, Inc. (JD: $26.01, BUY)• LinkedIn Corporation (LNKD: $193.00, BUY)• Netflix, Inc. (NFLX: $97.96, HOLD)• On Deck Capital Inc. (ONDK: $9.26, BUY)• PayPal Holdings Inc. (PYPL: $33.83, BUY)• RetailMeNot Inc. (SALE: $9.27, BUY)• Shutterfly, Inc (SFLY: $39.94, HOLD)• Shutterstock (SSTK: $28.74, HOLD)• Take-Two Interactive Software, Inc. (TTWO: $31.76, BUY)• TechTarget, Inc. (TTGT: $9.18, BUY)• The Priceline Group Inc. (PCLN: $1,364.29, BUY)• TiVo Inc. (TIVO: $9.02, BUY)• Tremor Video, Inc. (TRMR: $1.85, BUY)• TripAdvisor (TRIP: $82.17, HOLD)• Twitter, Inc. (TWTR: $29.30, BUY)• Yahoo!, Inc. (YHOO: $31.12, BUY)• Yelp, Inc. (YELP: $22.39, BUY)• Zalando SE (ZAL GR: €30.59, BUY)• Zynga, Inc. (ZNGA: $2.37, BUY)
FB
Target Change
October 21, 2015
page 47 of 50 , Jefferies Equity Research, [email protected] US Internet Team
Please see important disclosure information on pages 46 - 50 of this report.

Distribution of RatingsIB Serv./Past 12 Mos.
Rating Count Percent Count Percent
BUY 1126 53.47% 311 27.62%HOLD 832 39.51% 168 20.19%UNDERPERFORM 148 7.03% 18 12.16%
FB
Target Change
October 21, 2015
page 48 of 50 , Jefferies Equity Research, [email protected] US Internet Team
Please see important disclosure information on pages 46 - 50 of this report.

Other Important DisclosuresJefferies Equity Research refers to research reports produced by analysts employed by one of the following Jefferies Group LLC (“Jefferies”) groupcompanies:United States: Jefferies LLC which is an SEC registered firm and a member of FINRA.United Kingdom: Jefferies International Limited, which is authorized and regulated by the Financial Conduct Authority; registered in England andWales No. 1978621; registered office: Vintners Place, 68 Upper Thames Street, London EC4V 3BJ; telephone +44 (0)20 7029 8000; facsimile +44 (0)207029 8010.Hong Kong: Jefferies Hong Kong Limited, which is licensed by the Securities and Futures Commission of Hong Kong with CE number ATS546; locatedat Suite 2201, 22nd Floor, Cheung Kong Center, 2 Queen’s Road Central, Hong Kong.Singapore: Jefferies Singapore Limited, which is licensed by the Monetary Authority of Singapore; located at 80 Raffles Place #15-20, UOB Plaza 2,Singapore 048624, telephone: +65 6551 3950.Japan: Jefferies (Japan) Limited, Tokyo Branch, which is a securities company registered by the Financial Services Agency of Japan and is a memberof the Japan Securities Dealers Association; located at Hibiya Marine Bldg, 3F, 1-5-1 Yuraku-cho, Chiyoda-ku, Tokyo 100-0006; telephone +813 52516100; facsimile +813 5251 6101.India: Jefferies India Private Limited (CIN - U74140MH2007PTC200509), which is licensed by the Securities and Exchange Board of India as a MerchantBanker (INM000011443), Research Analyst (INH000000701) and a Stock Broker with Bombay Stock Exchange Limited (INB011491033) and NationalStock Exchange of India Limited (INB231491037) in the Capital Market Segment; located at 42/43, 2 North Avenue, Maker Maxity, Bandra-KurlaComplex, Bandra (East) Mumbai 400 051, India; Tel +91 22 4356 6000.This material has been prepared by Jefferies employing appropriate expertise, and in the belief that it is fair and not misleading. The information setforth herein was obtained from sources believed to be reliable, but has not been independently verified by Jefferies. Therefore, except for any obligationunder applicable rules we do not guarantee its accuracy. Additional and supporting information is available upon request. Unless prohibited by theprovisions of Regulation S of the U.S. Securities Act of 1933, this material is distributed in the United States ("US"), by Jefferies LLC, a US-registeredbroker-dealer, which accepts responsibility for its contents in accordance with the provisions of Rule 15a-6, under the US Securities Exchange Act of1934. Transactions by or on behalf of any US person may only be effected through Jefferies LLC. In the United Kingdom and European EconomicArea this report is issued and/or approved for distribution by Jefferies International Limited and is intended for use only by persons who have, or havebeen assessed as having, suitable professional experience and expertise, or by persons to whom it can be otherwise lawfully distributed. JefferiesInternational Limited has adopted a conflicts management policy in connection with the preparation and publication of research, the details of whichare available upon request in writing to the Compliance Officer. Jefferies International Limited may allow its analysts to undertake private consultancywork. Jefferies International Limited’s conflicts management policy sets out the arrangements Jefferies International Limited employs to manage anypotential conflicts of interest that may arise as a result of such consultancy work. For Canadian investors, this material is intended for use only byprofessional or institutional investors. None of the investments or investment services mentioned or described herein is available to other personsor to anyone in Canada who is not a "Designated Institution" as defined by the Securities Act (Ontario). In Singapore, Jefferies Singapore Limited isregulated by the Monetary Authority of Singapore. For investors in the Republic of Singapore, this material is provided by Jefferies Singapore Limitedpursuant to Regulation 32C of the Financial Advisers Regulations. The material contained in this document is intended solely for accredited, expert orinstitutional investors, as defined under the Securities and Futures Act (Cap. 289 of Singapore). If there are any matters arising from, or in connectionwith this material, please contact Jefferies Singapore Limited, located at 80 Raffles Place #15-20, UOB Plaza 2, Singapore 048624, telephone: +656551 3950. In Japan this material is issued and distributed by Jefferies (Japan) Limited to institutional investors only. In Hong Kong, this report isissued and approved by Jefferies Hong Kong Limited and is intended for use only by professional investors as defined in the Hong Kong Securities andFutures Ordinance and its subsidiary legislation. In the Republic of China (Taiwan), this report should not be distributed. The research in relation tothis report is conducted outside the PRC. This report does not constitute an offer to sell or the solicitation of an offer to buy any securities in the PRC.PRC investors shall have the relevant qualifications to invest in such securities and shall be responsible for obtaining all relevant approvals, licenses,verifications and/or registrations from the relevant governmental authorities themselves. In India this report is made available by Jefferies India PrivateLimited. In Australia this information is issued solely by Jefferies International Limited and is directed solely at wholesale clients within the meaning ofthe Corporations Act 2001 of Australia (the "Act") in connection with their consideration of any investment or investment service that is the subject ofthis document. Any offer or issue that is the subject of this document does not require, and this document is not, a disclosure document or productdisclosure statement within the meaning of the Act. Jefferies International Limited is authorised and regulated by the Financial Conduct Authorityunder the laws of the United Kingdom, which differ from Australian laws. Jefferies International Limited has obtained relief under Australian Securitiesand Investments Commission Class Order 03/1099, which conditionally exempts it from holding an Australian financial services licence under theAct in respect of the provision of certain financial services to wholesale clients. Recipients of this document in any other jurisdictions should informthemselves about and observe any applicable legal requirements in relation to the receipt of this document.
This report is not an offer or solicitation of an offer to buy or sell any security or derivative instrument, or to make any investment. Any opinion orestimate constitutes the preparer's best judgment as of the date of preparation, and is subject to change without notice. Jefferies assumes no obligationto maintain or update this report based on subsequent information and events. Jefferies, its associates or affiliates, and its respective officers, directors,and employees may have long or short positions in, or may buy or sell any of the securities, derivative instruments or other investments mentioned ordescribed herein, either as agent or as principal for their own account. Upon request Jefferies may provide specialized research products or servicesto certain customers focusing on the prospects for individual covered stocks as compared to other covered stocks over varying time horizons orunder differing market conditions. While the views expressed in these situations may not always be directionally consistent with the long-term viewsexpressed in the analyst's published research, the analyst has a reasonable basis and any inconsistencies can be reasonably explained. This materialdoes not constitute a personal recommendation or take into account the particular investment objectives, financial situations, or needs of individualclients. Clients should consider whether any advice or recommendation in this report is suitable for their particular circumstances and, if appropriate,seek professional advice, including tax advice. The price and value of the investments referred to herein and the income from them may fluctuate. Pastperformance is not a guide to future performance, future returns are not guaranteed, and a loss of original capital may occur. Fluctuations in exchangerates could have adverse effects on the value or price of, or income derived from, certain investments. This report has been prepared independently ofany issuer of securities mentioned herein and not in connection with any proposed offering of securities or as agent of any issuer of securities. Noneof Jefferies, any of its affiliates or its research analysts has any authority whatsoever to make any representations or warranty on behalf of the issuer(s).Jefferies policy prohibits research personnel from disclosing a recommendation, investment rating, or investment thesis for review by an issuer prior
FB
Target Change
October 21, 2015
page 49 of 50 , Jefferies Equity Research, [email protected] US Internet Team
Please see important disclosure information on pages 46 - 50 of this report.

to the publication of a research report containing such rating, recommendation or investment thesis. Any comments or statements made herein arethose of the author(s) and may differ from the views of Jefferies.
This report may contain information obtained from third parties, including ratings from credit ratings agencies such as Standard & Poor’s. Reproductionand distribution of third party content in any form is prohibited except with the prior written permission of the related third party. Third party contentproviders do not guarantee the accuracy, completeness, timeliness or availability of any information, including ratings, and are not responsible forany errors or omissions (negligent or otherwise), regardless of the cause, or for the results obtained from the use of such content. Third party contentproviders give no express or implied warranties, including, but not limited to, any warranties of merchantability or fitness for a particular purpose oruse. Third party content providers shall not be liable for any direct, indirect, incidental, exemplary, compensatory, punitive, special or consequentialdamages, costs, expenses, legal fees, or losses (including lost income or profits and opportunity costs) in connection with any use of their content,including ratings. Credit ratings are statements of opinions and are not statements of fact or recommendations to purchase, hold or sell securities. Theydo not address the suitability of securities or the suitability of securities for investment purposes, and should not be relied on as investment advice.
Jefferies research reports are disseminated and available primarily electronically, and, in some cases, in printed form. Electronic research issimultaneously available to all clients. This report or any portion hereof may not be reprinted, sold or redistributed without the written consent ofJefferies. Neither Jefferies nor any officer nor employee of Jefferies accepts any liability whatsoever for any direct, indirect or consequential damagesor losses arising from any use of this report or its contents.
For Important Disclosure information, please visit our website at https://javatar.bluematrix.com/sellside/Disclosures.action or call 1.888.JEFFERIES
© 2015 Jefferies Group LLC
FB
Target Change
October 21, 2015
page 50 of 50 , Jefferies Equity Research, [email protected] US Internet Team
Please see important disclosure information on pages 46 - 50 of this report.