PREVISION - m-s-g.com
31
PREVISION Comprehensive Services for Online Surveys Mansour Fahimi, Ph.D. EVP & Chief Data Scientist September 22, 2020
Transcript of PREVISION - m-s-g.com

PREVISION
Comprehensive Services for Online Surveys
Mansour Fahimi, Ph.D.
EVP & Chief Data Scientist
September 22, 2020

Objectives
2
1. Demystifying nonprobability samples from online panels
and their pragmatic utilities.
2. Providing guidelines for nonprobability sample sourcing
selection, and enhancement options.
3. Making inferences from online survey data with
representational challenges.
4. Identifying and dealing with the limitations and hidden
hazards of samples from online panels.
5. Concluding remarks.

ImpactDecisive Implementation
IntelligenceInformed Interpretation
InformationData Refinements & Analytics
InputRepresentative Samples
First Big Picture – the path to measurable impact
3

Second Big Picture – avoiding weak links
4
Total Survey
Error
Errors of
Non-observation
Errors of
Observations
Errors of
Processing
Errors of
Reporting
Coverage
Sampling
Questionnaire
Data
Collection
Data
Compilation
Imputation
Weighting
Analytics
Interpretation

Sample Types & Characteristics
5
1. Probability Samples:
a. Availability of a sampling frame representative of the population
b. Every unit has a known and nonzero chance of selection
c. Calculable response rates
d. Estimable error margins
2. Nonprobability Samples:
1. Available sampling frames have unknown coverage properties
2. Sampling units do not have known selection probabilities
3. Response rates are inestimable and uninformative
4. Error margins are theoretically inestimable
5. Probability-based-ness:
6. Is a characteristic of samples
7. Online panels are sampling frames

The Magic of Inferential Statistics – theory
6
Target Universe
(N)Sample
(n)
Random
Selection
Inferred UniverseWeighting
𝑁
𝑛(𝑵)

The Magic of Inferential Statistics – practice
7
Target Universe
(N)
Sample
(n)
Respondents
(n*)
Ra
nd
om
No
nresp
on
se
Inferred Universe
(𝑵)

Magic of Inferential Statistics – 21st century
8
Sample
(n)
Respondents
(n*)
No
n-ra
nd
om
No
nresp
on
se
Inferred Universe
(෩𝑵)Some Universe
(N)

Probability vs. Nonprobability Samples
9
(𝑵)
0% 5% 10% 15% 20% 25%
Vacation with others
Happiness
Price sensitivity
Citizens influence politics
Item donation
Financial insecurity
Loneliness
Opinions hard to change
Watch TV with others
Others care about opinions
Enjoy surveys
Survey importance
Technophilia
Riskiness
Interested in news
Like shopping - online
Coupon use
Share opinions
Email frequency
Differences Between Weighted Estimates from Probability and Nonprobability Samples
Fahimi, M., F. Barlas, R. Thomas, and N. Buttermore (2015). Scientific Surveys Based on Incomplete Sampling Frames and High Rates of Nonresponse.
Survey Practice, Vol. 8, no 5, 2015, December Issue.

Probability vs. Nonprobability Samples
10
(𝑵)2.9%
4.6%
5.2%
4.4%
5.5%
5.1% 5.0%
6.9%
Probability Noprob_1 Noprob_2 Noprob_3 Noprob_4 Noprob_5 Noprob_6 Noprob_7
Average Absolute Error for 13 Survey Estimates
Source: MacInnis & Krosnick, et al. “The Accuracy of Measurements with Probability and Nonprobability Survey Samples:
Replication and Extension” 2019. Public Opinion Quarterly, 82(4).

Why Nonprobability Samples?
11
1. Challenges with probability samples for rare subgroups
2. Increasing cost & time requirements of probability samples
3. Growing rates of differential nonresponse
4. Proliferation of inexpensive data from “digital” sources
5. Interest in special data unattainable from structured surveys
6. Advantages of online panels with proper coverage:
a. Significant reduction in time and cost requirements
b. Improved geodemographic coverage
c. Convenience of survey participants
d. Robust to social desirability influences
e. Possibility for complex instruments

Online Samples
12
1. Samples from Online Panels:
a. A handful of small panels use quasi probability sampling for recruitment (Tier 1)
b. The vast majority rely on nonprobability sampling methods (Tier 2)
c. Often “fish” for unknown websurfers on the fly to partake in surveys
d. Most panel providers are aggregators that mix & match various panels
e. Very few have profile data for sample balancing
f. May not have the needed infrastructure for complex sampling
2. Blended Samples:
a. No online panel has known representation of the target population
b. Individual panels have varying undercoverage problems
c. Blending panels can reduce skews and provide a larger base for sample balancing
d. Allows stability for sample mix when surveys are repeated
e. Can mix samples from Tier 1 and Tier 2 panels (the right way)

Online Sampling no Alchemy
13
1. Be skeptical when you hear from any provider that says:
a. We can provide probability-based samples
b. We can provide fully representative samples
c. We cannot disclose/explain the composition of our panel
2. Be careful when you hear from any provider that says:
a. We can accommodate any quota balancing you need
b. We balance samples based on standard rules
c. We multi-source and do not frontload samples from our own panel
3. Navigating this murky market is not easy:
a. Oftentimes contacts are salespersons with limited sampling knowledge
b. Naively simple specifications can be very inadequate
c. Overzealous overengineering can quickly backfire

It is the .....
14
In a Turkish BazarWild Wild West

PreVision to the Rescue
15
1. Dealing with online panel providers takes experience:
a. Interacting and haggling with a long list of panel providers is not easy
b. We secure the best representative sample online panels can provide
2. Poor questions produce poor data:
a. Online questionnaire design has its own art & science
b. We provide consultation services for mobile-friendly questionnaires
3. Traditional geodemographic weighting is not enough:
a. Respondents from opt-in panels have skews beyond geodemographics
b. We provide weighting support specially designed for online surveys
4. Analysis of weighted data requires special skills and tools:
a. Standard methods produce misleading inferences
b. We provide “design-proper” methods for inferences and advanced analytics

Pillars of PreVision
16
Effective
Analytics
Pragmatic
Sample Balancing
Online-Friendly Questionnaire
Multivariate Calibration
Minimizing Total Survey Error

Pragmatic Sample Balancing
17
1. Highly-nested sample balancing can be:
a. Expensive
b. Impractical
c. Lead to creative shortcuts unbeknownst to researchers
2. Pragmatic sample balancing example:
a. Gender nested with age
b. Race-ethnicity
c. Geography
d. Education or Income
3. Leave finer balancing for weighting & calibration:
a. Needed profile data for granular sample balancing is never available
b. Multivariate alignments can only be achieved via weighting

Online-Friendly Questionnaire Design
18
1. The days of long and arduous questionnaires are over:
a. Over 50% of online respondents take surveys on smartphone or tablets
b. Panel members are more survey-savvy and often reject poor questionnaires
2. Poor questionnaires can:
a. Increase brake-off rates
b. Encourage speeding, straight-lining, and non-differentiating responses
3. Incentives go only so far:
a. As questionnaire length increases larger incentives will be needed
b. High incentives do not necessarily improve data quality and can attract “flies”
4. Need to include special questions for calibration:
a. Parsimonious set of differentiators
b. May need to include topic-specific questions as well
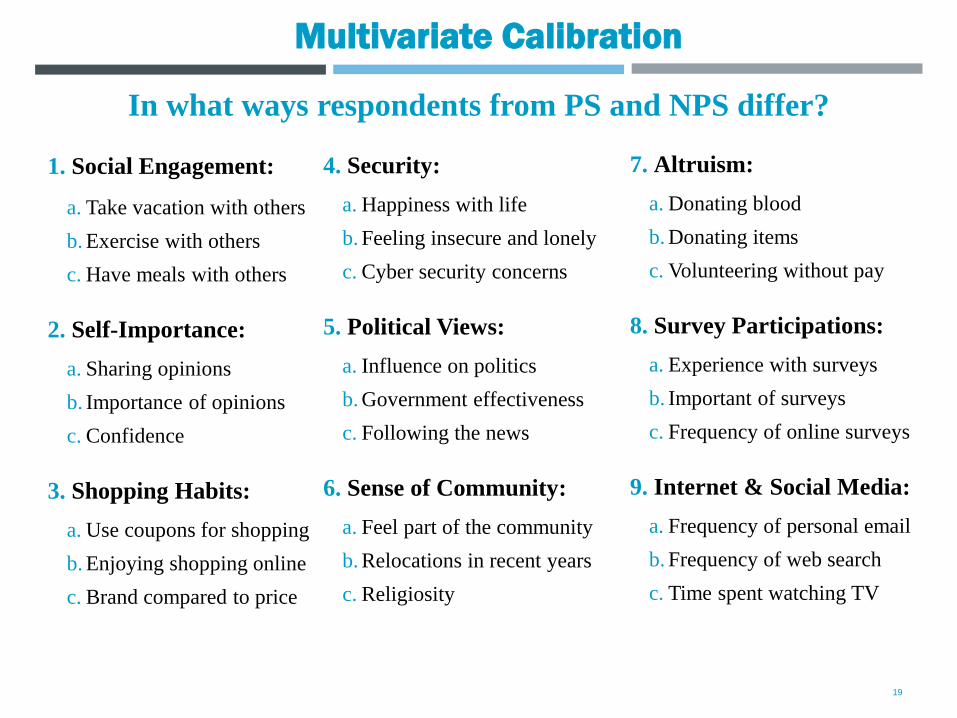
Multivariate Calibration
1. Social Engagement:
a. Take vacation with others
b. Exercise with others
c. Have meals with others
2. Self-Importance:
a. Sharing opinions
b. Importance of opinions
c. Confidence
3. Shopping Habits:
a. Use coupons for shopping
b. Enjoying shopping online
c. Brand compared to price
19
4. Security:
a. Happiness with life
b. Feeling insecure and lonely
c. Cyber security concerns
5. Political Views:
a. Influence on politics
b. Government effectiveness
c. Following the news
6. Sense of Community:
a. Feel part of the community
b. Relocations in recent years
c. Religiosity
7. Altruism:
a. Donating blood
b. Donating items
c. Volunteering without pay
8. Survey Participations:
a. Experience with surveys
b. Important of surveys
c. Frequency of online surveys
9. Internet & Social Media:
a. Frequency of personal email
b. Frequency of web search
c. Time spent watching TV
In what ways respondents from PS and NPS differ?

Probability vs. Nonprobability Samples
20
(𝑵)
0% 5% 10% 15% 20% 25%
Vacation with others
Happiness
Price sensitivity
Citizens influence politics
Item donation
Financial insecurity
Loneliness
Opinions hard to change
Watch TV with others
Others care about opinions
Enjoy surveys
Survey importance
Technophilia
Riskiness
Interested in news
Like shopping - online
Coupon use
Share opinions
Email frequency
Differences Between Weighted Estimates from Probability and Nonprobability Samples
Fahimi, M., F. Barlas, R. Thomas, and N. Buttermore (2015). Scientific Surveys Based on Incomplete Sampling Frames and High Rates of Nonresponse.
Survey Practice, Vol. 8, no 5, 2015, December Issue.

Multivariate Calibration
21
0%
8%
16%
24%
32%V
1V
2V
3V
4V
5V
6V
7V
8V
9V
10
V1
1V
12
V1
3V
14
V1
5V
16
V1
7V
18
V1
9V
20
V2
1V
22
V2
3V
24
V2
5V
26
V2
7V
28
V2
9V
30
V3
1V
32
V3
3V
34
V3
5V
36
V3
7V
38
V3
9V
40
V4
1V
42
V4
3V
44
V4
5V
46
V4
7V
48
V4
9V
50
V5
1V
52
V5
3V
54
V5
5V
56
V5
7V
58
V5
9V
60
V6
1V
62
V6
3V
64
V6
5V
66
V6
7V
68
V6
9V
70
V7
1V
72
V7
3V
74
Rel
ati
ve
Imp
ort
an
ce
Differentiators
Relative Importance of Significant Differentiators Between PS & NPS
CART TreeNet RandomForests MARS

Calibration Robustness & Parsimony
1. Time spent on the internet for personal use
2. Time spent watching television in a day
3. Propensity for being an early-adopter
4. Frequency of relocation
5. Frequency of expressing opinions online
6. Socioeconomic and geodemographic characteristics
22

Effective Analytics
1. All survey estimates are subject to uncertainty due to sampling error
2. Margin of error (MoE) approximates sampling uncertainty
3. Survey results can be interpreted properly considering their MoE
4. Characteristics of MoE:
a. Can only be approximated
b. Are estimates and should have their level of confidence
c. Are estimate-based and not survey-based
d. Are computable when the sample is probability-based
5. Weighting adjustments (calibration) increase MoE:
23
𝑼𝑾𝑬 =σ𝒊
𝑾𝒊 − ሜ𝑾 2
𝒏 − 1ሜ𝑾2

Common Approaches for Approximating MoE
1. Naïve: report estimates without any reference to sampling errors
2. Simplistic: report error margins as if the sample is simple random:
3. Approximation: recognize the sample is not representative and:
a. Compute weights to make the sample more representative
b. Compute effective sample size reflecting impact of weighting
c. Compute MoE and other inferential statistics using effective sample size
4. Practical: use survey procedures in SAS, SPSS, Stata, etc.
24
𝑬 = 𝟏. 𝟗𝟔 ×ෝ𝒑 𝟏 − ෝ𝒑
𝒏
𝑬∗ = 𝟏. 𝟗𝟔 ×ෝ𝒑 𝟏 − ෝ𝒑
𝒏𝑼𝑾𝑬
= 𝑬 × 𝑼𝑾𝑬

External Validity
25
Nonprobability Sample Balanced & Weighted
Nonprobability Sample Balanced & Calibrated
Balanced Nonprobability + Probability Samples Calibrated
Probability Sample Weighted
Probability Sample CalibratedHigh
External
Validity
Low
External
Validity
Nonprobability Sample Unbalanced & Weighted
Nonprobability Sample Unbalanced & Unweighted

Hazards of Online Surveys
Poor respondents:
❑ Speeders
❑ Straightliners
❑ Professional survey-takers
Fraudulent respondents:
❑ Bots
❑ Click Farms
26

Fraudulent Respondent Preventions
27
1. Upstream:
a. IP address; cookies; system and browser information
b. Remove duplicates
2. Midstream:
a. Verification attempts to identify some bots
b. Trap questions
11%13% 13% 13% 14% 14%
15% 16% 16% 16% 17% 17% 17% 17% 18% 18%
20%
1 2 3 4 5 6 7 8 9 10 11 12 13 14 15 16 17
Panel Provider
At Least One Trap Question Failure
Source: Thomas, R.K. (2014). Fast and furious or much ado about nothing? Sub-optimal respondent behavior and data quality. Journal of Advertising
Research Foundation, 54(1), 17-31.

Concluding Remarks – The Existing Divide
28
1. The times, they are a-changing:
a. Traditional methods have issues – coverage, nonresponse, and cost
b. Alternative methods are emerging and becoming more effective
c. Informational needs are evolving beyond the reach of structured surveys
2. Ultra right (market researchers):
a. Traditional survey research methods are obsolete
b. Data should be acquired digitally and through data fusion
c. Structured survey data miss key nuances such as POS information
3. Ultra left (survey researchers):
a. Nonprobability samples are void of inferential integrity
b. Market research methods are beneath survey research
c. Weighting can make up for the inadequacies of sample surveys

Concluding Remarks – Closing the Divide
29
1. The times, they are a-changing:
a. Business as usual will not work:
➢ Perfect coverage and high response rates are gone
➢ The days of lengthy surveys are over
b. Alternative methods and data sources are here to grow
2. Centrism:
a. Fundamental strengths of traditional methods need to be respected
b. Potential gains of alternative methods need to be recognized
c. Shortfalls of alternative methods should be dealt with transparently
d. Pragmatic alternatives are needed to support evolving informational needs:
➢ Shorter surveys based on defensible principals
➢ Supplementing survey data from ancillary sources

Concluding Remarks – Moving Forward
30
1. Survey research community is embracing online options:
a. Willingly or reluctantly forced by the shifting ground realities
b. Exiting panels may not address the needs of all surveys:
a. Panels that use probability sampling for recruitment are too small
b. Opt-in panels have representational issues and small for large survey
2. Emerging alternatives require thinking outside of the box:
a. Pragmatic & effective sampling
b. Parsimonious & effective instrumentation
c. Comprehensive & effective weighting adjustments
d. Proper & effective analytics
3. PreVision is developed to address the above:
a. Every step of the way along the survey path
b. Consultations and solutions as needed

Thank you …..
31
Mansour Fahimi, Ph.D.
EVP & Chief Data Scientist
Marketing Systems Group
215-620-2880