Prevalence Of Primary Non-Alcoholic Fatty Liver Disease In ...
57
ii PREVALENCE OF PRIMARY NON-ALCOHOLIC FATTY LIVER DISEASE IN BLACK AFRICANS WITH TYPE 2 DIABETES AT KENYATTA NATIONAL HOSPITAL. A DISSERTATION SUBMITTED IN PART FULFILMENT OF THE REQUIREMENT FOR THE DEGREE OF MASTER OF MEDICINE IN INTERNAL MEDICINE, UNIVERSITY OF NAIROBI. DR. KARANGA J. KIMANI 2013
Transcript of Prevalence Of Primary Non-Alcoholic Fatty Liver Disease In ...

ii
PREVALENCE OF PRIMARY NON-ALCOHOLIC
FATTY LIVER DISEASE IN BLACK AFRICANS WITH
TYPE 2 DIABETES AT KENYATTA NATIONAL
HOSPITAL.
A DISSERTATION SUBMITTED IN PART FULFILMENT OF THE REQUIREMENT
FOR THE DEGREE OF MASTER OF MEDICINE IN INTERNAL MEDICINE,
UNIVERSITY OF NAIROBI.
DR. KARANGA J. KIMANI
2013
iii
DECLARATION
I hereby declare that this is my original work and has not been presented for a degree in any
other university.
Signed .............................................................................Date.............................................
PRINCIPAL INVESTIGATOR,
DR JAMES KARANGA KIMANI,
MBChB (UoN)
RESIDENT, DEPARTMENT OF CLINICAL MEDICINE AND THERAPEUTICS

iv
This dissertation has been submitted for examination with our approval as supervisors.
Prof. E. O. Ogutu
Consultant Gastroenterologist
Associate Professor Of Medicine
Department Of Clinical Medicine & Therapeutics
University Of Nairobi
Signed ......................................................................................Date.........................
Dr. C. K. Onyambu
Consultant Radiologist
Lecturer
Department of Imaging & Radiation Medicine
University Of Nairobi
Signed ......................................................................................Date.........................
Prof. C. F. Otieno
Consultant Endocrinologist
Senior Lecturer
Department of Clinical Medicine & Therapeutics
University Of Nairobi
Signed ......................................................................................Date..........................

v
DEDICATION
I dedicate this dissertation to my loving wife and children.

vi
ACKNOWLEDGEMENTS
I offer my gratitude to the following people without whose contribution, this work would not
have been possible: My supervisors, Prof E. Ogutu, Prof. C. F. Otieno and Dr C. K. Onyambu
for their supervision, guidance and patience. Extra thanks go to Dr Onyambu and her colleagues
at the department of Diagnostic Imaging & Radiation Medicine for assistance with the liver
ultrasonography.
I extend my appreciation to the patients at the Diabetic Clinic of Kenyatta National Hospital who
agreed to participate in this study. I also do appreciate the staff at the diabetic clinic for their co-
operation and for according me time and space to enrol the study subjects, Dr S. A. Amwayi for
graciously assisting with data analysis, and the staff of KNH biochemistry laboratory who
performed the laboratory investigations.
To my family, friends and colleagues who encouraged me and urged me on during the research
period, I am grateful for the strength you gave me.

vii
LIST OF ABBREVIATIONS
AFLP – Acute fatty liver of pregnancy
ALP – Alkaline phosphatase
ALT – Alanine transaminase
AST – Aspartate transaminase
AZT – Zidovudine
BAAT Score – BMI, Age, ALT, Serum Triglyceride score
BMI – Body mass index
CCl4 – Carbon tetrachloride
CLD – Chronic liver disease
CT – Computed tomography
ddI – Didanosine
DDT – Dichlorodiphenyltrichloroethane
DM – Diabetes mellitus
FFA – Free fatty acids
Gamma GT – Gamma glutamyl- transpeptidase
HAIR score – Hypertension, ALT, IR score
HBV – Hepatitis B virus
HCV – Hepatitis C virus
HCC – Hepatocellular carcinoma
HDL – High density lipoprotein
HOMA – Homeostatic model assessment formula
INR – International normalisation ratio

viii
IR – Insulin resistance
KNH- Kenyatta National Hospital
LDL – Low density lipoprotein
LFT – Liver function test
MRI – Magnetic resonance imaging
NAFLD – Non- alcoholic fatty liver disease
NASH – Non- alcoholic steatohepatitis
NCEP – National Cholesterol Education Program
OGTT – Oral glucose tolerance test
OHA - Oral hypoglycaemic agents
PI – Principal Investigator
PTI – Prothrombin time index
QUICKI – Quantitative insulin sensitivity index check index
TGF beta – Tumour growth factor beta
TNF alpha – Tumour necrosis factor alpha
UON – University of Nairobi
U/S - Ultrasound
USA – United States of America

ix
Table of Contents DECLARATION ...................................................................................................................... iii
DEDICATION ............................................................................................................................v
ACKNOWLEDGEMENTS....................................................................................................... vi
LIST OF ABBREVIATIONS................................................................................................... vii
LIST OF FIGURES .................................................................................................................. xi
LIST OF TABLES ................................................................................................................... xii
ABSTRACT ........................................................................................................................... xiii
1.0 LITERATURE REVIEW ......................................................................................................1
1.1 INTRODUCTION .................................................................................................................1
1.2 NON ALCOHOLIC FATTY LIVER DISEASE (NAFLD) ...................................................2
1.3 PRIMARY NAFLD ..............................................................................................................2
1.4 SECONDARY NAFLD ........................................................................................................3
1.5 ADDITIONAL MECHANISMS OF LIVER INFLAMMATION ..........................................4
1.6 PREVALENCE OF NAFLD .................................................................................................5
1.7 DIAGNOSIS OF NAFLD .....................................................................................................6
1.8 LABORATORY FINDINGS.................................................................................................7
1.9 IMAGING STUDIES ............................................................................................................7
1.10 LIVER BIOPSY ..................................................................................................................8
1.11 BAAT (BMI, Age, ALT, serum Triglyceride score) ............................................................9
1.12 HAIR (Hypertension, ALT, IR score) ..................................................................................9
1.13 CLINICAL COURSE ........................................................................................................ 10
1.14 TREATMENT .................................................................................................................. 11
2.0 STUDY JUSTIFICATION .................................................................................................. 12
3.0 RESEARCH QUESTION ................................................................................................... 13
4.0 STUDY OBJECTIVES ....................................................................................................... 13
4.1 BROAD OBJECTIVE ......................................................................................................... 13
4.2 SPECIFIC OBJECTIVES .................................................................................................. 13
5.0 MATERIALS AND METHODOLOGY.............................................................................. 14
5.1 STUDY DESIGN ................................................................................................................ 14
5.2 STUDY POPULATION ...................................................................................................... 14
5.3 STUDY AREA.................................................................................................................. 14
5.4 SAMPLE SIZE................................................................................................................. 14

x
5.6 SCREENING AND RECRUITMENT................................................................................. 15
5.7 STATISTICAL ANALYSIS ............................................................................................... 16
5.8 ETHICAL CONSIDERATIONS ......................................................................................... 17
6.0 RESULTS ........................................................................................................................... 18
7.0 DISCUSSION ..................................................................................................................... 29
7.1 CONCLUSION ................................................................................................................... 31
7.2 STUDY LIMITATIONS ..................................................................................................... 31
7.3 RECOMMENDATIONS ..................................................................................................... 31
8. REFERENCES ..................................................................................................................... 32
APPENDIX I: STUDY PROFORMA ....................................................................................... 38
APPENDIX II: CALCULATION AND GRADING OF BODY MASS INDEX (BMI) (kg/m2):
................................................................................................................................................. 40
APPENDIX III :CONSENT EXPLANATION ......................................................................... 41
APPENDIX IV: CONSENT FORM .......................................................................................... 42
APPENDIX V: STUDY BUDGET ........................................................................................... 43
APPENDIX VI: ATP III CLASSIFICATION OF LDL, TOTAL AND HDL CHOLESTEROL
AND SERUM TRIGLYCERIDES (MMOL/L) ......................................................................... 44

xi
LIST OF FIGURES PAGE
Figure I: The ‘two- hit hypothesis’ ………………………….................………...........5
Figure II: Proposed schema of evaluation and decision
to do liver biopsy on suspected NAFLD patients….....................................11
Figure III: Recruitment flow chart ...............................................................................19
Figure IV: Prevalence of NAFLD in study population .................................................20
Figure V: Ultrasonographic grades of NAFLD in study subjects .................................21
Figure VI: Gender distribution of study subjects with NAFLD ...................................21
Figure VII: Distribution by age group of NAFLD status of
study subjects .............................................................................................23
Figure VIII: Deranged liver parameters in study subjects ............................................24
Figure IX: BMI categories of study subjects .................................................................25
Figure X: Increased waist circumference in study subjects............................................26
Figure XI: Blood pressure indices of study subjects.......................................................27
Figure XII: Lipid profiles of study subjects ...................................................................28

xii
LIST OF TABLES PAGE
Table I: Gender distribution of study population..................................................19
Table II: Bivariate analysis of deranged liver parameters of study population ....23
Table III: Bivariate analysis of elevated BMI in study subjects ..........................25
Table IV: Bivariate analysis of increased waist circumference in study subjects..26
Table V: Bivariate analysis of blood pressures in study subjects .........................27
Table VI: Bivariate analysis of lipid profiles in study subjects ............................29

xiii
ABSTRACT
Background: Non-alcoholic fatty liver disease (NAFLD) is increasingly being recognized as a
common disease in syndromes thought to have a patho-physiological basis in Insulin Resistance
(IR), especially in patients with type 2 diabetes. There is an associated risk of progressive liver
disease contributing to morbidity and mortality in such patients. Prevalence of this disease in
Kenyans with type 2 diabetes remains unknown. This study aimed to determine the
ultrasonographic prevalence of NAFLD in type 2 diabetics and correlate this with other known
predisposing factors.
Methods: This was a hospital-based cross-sectional study that evaluated 326 type 2 diabetic
patients (47±7 years) who were insulin-naïve and on treatment with Oral Hypoglycemic Agents
(OHAs), and with no history of alcohol consumption. Anthropometric measurements of Body
Mass Index (BMI), Blood Pressure (BP) and Waist Circumference (WC) were taken. Abdominal
(hepatic) ultrasonography, Lipid Profile Tests (LPTs) and Liver Function Tests (LFTs) were
performed. Data was recorded, entered into a data base and analyzed using statistical package
SPSS 17.0 program.
Results: 34.4% (n=112) of study subjects had NAFLD on Ultrasound (U/S) (95% CI of 29.3%-
39.8%), the most common grade being mild (n=67), followed by moderate (n=37) and severe
(n=8). Deranged LFTs, obesity, dyslipidemia and hepatomegaly were significantly associated
with NAFLD.
Conclusion: There was a high prevalence of NAFLD in study subjects, which was significantly
associated with deranged LFTs, obesity, dyslipidemia, and hepatomegaly.

1
1.0 LITERATURE REVIEW
1.1 INTRODUCTION
Fatty liver disease refers to the diffuse accumulation of neutral fat in form of triglycerides in
hepatocytes, and is an important clinical and pathological finding. Aetiologically, this arises
from alcohol consumption (alcoholic fatty liver disease) or from non-alcoholic causes (non-
alcoholic fatty liver disease/NAFLD).
NAFLD aetiologically occurs in two forms: primary and secondary.
In primary NAFLD, the aetiology remains unclear, though there is a strong association with the
metabolic syndrome or any of its components, suggesting Insulin Resistance (IR) could be key in
its aetiology.
Secondary NAFLD is strongly associated with possible underlying aetiological agents that
include toxins, certain medications and an array of clinical conditions.
Imaging techniques namely computed tomography (CT), ultra sound, and magnetic resonance
imaging (MRI) may demonstrate alterations suggestive of increased fat in the liver. This is
characteristically seen as a “bright liver” on ultrasound (1).
Fatty liver disease presents in two histological categories, macrovesicular and microvesicular.
Macrovesicular fatty liver is the commonest form, characterized by replacement of the
hepatocyte cytoplasm with one or two large fat globules that displace the nucleus to the
periphery of the cell, as demonstrated in haematoxylin and eosin (H/E) stained liver sections (1).
Some of the causes of this type of fatty liver include alcoholic liver disease, obesity, diabetes
mellitus, protein calorie malnutrition, drugs and hepatotoxins.
Microvesicular fatty liver is characterised by replacement of the cytoplasm by numerous small,
fat filled globules producing a foamy appearance without nuclear displacement. It is seen in
disorders of the urea cycle characterized by mitochondrial abnormalities and hyper-ammonaemia
(1, 2, 3). Causes include Reye’s syndrome, conditions associated with pregnancy (acute fatty
liver of pregnancy, pre-eclampsia, eclampsia), drugs and Jamaican vomiting sickness.
Alcoholic fatty liver disease arises from chronic consumption of alcohol, especially in doses >
30g/day, but can occur at lower doses. Alcohol decreases free fatty acid (FFA) beta oxidation in
hepatocytes leading to triglyceride accumulation and hepatic steatosis, which can then progress
to chronic hepatitis and ultimately hepatic fibrosis or cirrhosis (4).
Fatty liver disease is an important entity in view of its potential to progress to chronic liver
disease (CLD) (1, 2, 4).
2
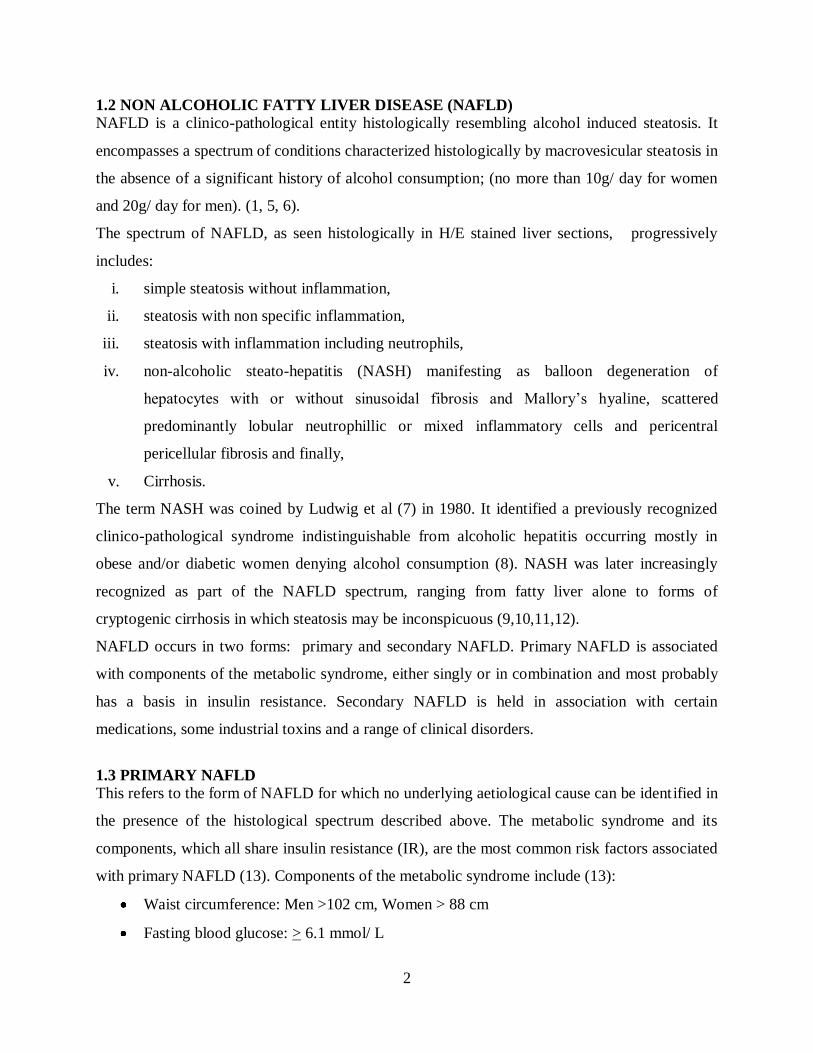
1.2 NON ALCOHOLIC FATTY LIVER DISEASE (NAFLD)
NAFLD is a clinico-pathological entity histologically resembling alcohol induced steatosis. It
encompasses a spectrum of conditions characterized histologically by macrovesicular steatosis in
the absence of a significant history of alcohol consumption; (no more than 10g/ day for women
and 20g/ day for men). (1, 5, 6).
The spectrum of NAFLD, as seen histologically in H/E stained liver sections, progressively
includes:
i. simple steatosis without inflammation,
ii. steatosis with non specific inflammation,
iii. steatosis with inflammation including neutrophils,
iv. non-alcoholic steato-hepatitis (NASH) manifesting as balloon degeneration of
hepatocytes with or without sinusoidal fibrosis and Mallory’s hyaline, scattered
predominantly lobular neutrophillic or mixed inflammatory cells and pericentral
pericellular fibrosis and finally,
v. Cirrhosis.
The term NASH was coined by Ludwig et al (7) in 1980. It identified a previously recognized
clinico-pathological syndrome indistinguishable from alcoholic hepatitis occurring mostly in
obese and/or diabetic women denying alcohol consumption (8). NASH was later increasingly
recognized as part of the NAFLD spectrum, ranging from fatty liver alone to forms of
cryptogenic cirrhosis in which steatosis may be inconspicuous (9,10,11,12).
NAFLD occurs in two forms: primary and secondary NAFLD. Primary NAFLD is associated
with components of the metabolic syndrome, either singly or in combination and most probably
has a basis in insulin resistance. Secondary NAFLD is held in association with certain
medications, some industrial toxins and a range of clinical disorders.
1.3 PRIMARY NAFLD
This refers to the form of NAFLD for which no underlying aetiological cause can be identified in
the presence of the histological spectrum described above. The metabolic syndrome and its
components, which all share insulin resistance (IR), are the most common risk factors associated
with primary NAFLD (13). Components of the metabolic syndrome include (13):
Waist circumference: Men >102 cm, Women > 88 cm
Fasting blood glucose: > 6.1 mmol/ L

3
Serum triglycerides: > 1.7 mmol/ L, or under fibrates
Serum HDL cholesterol: Men < 1mmol/ L, Women < 1.3 mmol/ L
Arterial blood pressure: > 130/ > 85 mmHg, or under pharmacologic treatment for
hypertension
Insulin Resistance
IR is defined as the ability of insulin to clear glucose from blood, also defined as insulin
sensitivity (15, 16). Innate sensitivity of any tissue to insulin is determined by genetic and
environmental factors. Genetic defects in the insulin receptor have been described in different IR
phenotypes (17).
Most clinical cases of IR are polygenic and may involve polymorphisms in different genes
involved in either insulin secretion or in mediating its effects. The metabolic state defined by IR
results from the complex interplay between pancreatic islet cells and the tissue targets of
insulin. Adipose tissue plays a key role in the genesis of IR and hepatic steatosis. Adipose tissue
is highly sensitive to plasma insulin concentration. A key defect in IR is the resistance of adipose
tissue to insulin mediated suppression of lipolysis. Recent evidence suggests that such a defect
exists in patients with either a fatty NAFLD (18).
Visceral adipose tissue is more resistant to insulin and exhibits greater lipolysis and produces
more FFA than adipose tissue in other sites. Increasing FFA concentration in portal blood
increases hepatic gluconeogenesis, decreases glucose utilisation and consequently increases
hepatic glucose output (19). This results in increased insulin secretion by the pancreatic islet
cells thereby maintaining normoglycemia. Progressive failure of insulin mediated suppression of
lipolysis raises FFA further, worsening hyperglycemia and producing a progressive fall in insulin
sensitivity until overt diabetes develops (20).
1.4 SECONDARY NAFLD
In this form of NAFLD, a possible underlying aetiological agent or condition is implicated or
held in association. Secondary NAFLD has been described in association with an array of causes
that include some medications, hepatotoxins, total parenteral nutrition, rapid weight loss, protein
calorie malnutrition, mitochondrialopathies, Wilson’s disease, Coeliac disease, Turner’s
syndrome and endocrinopathies (1,2,3).
4
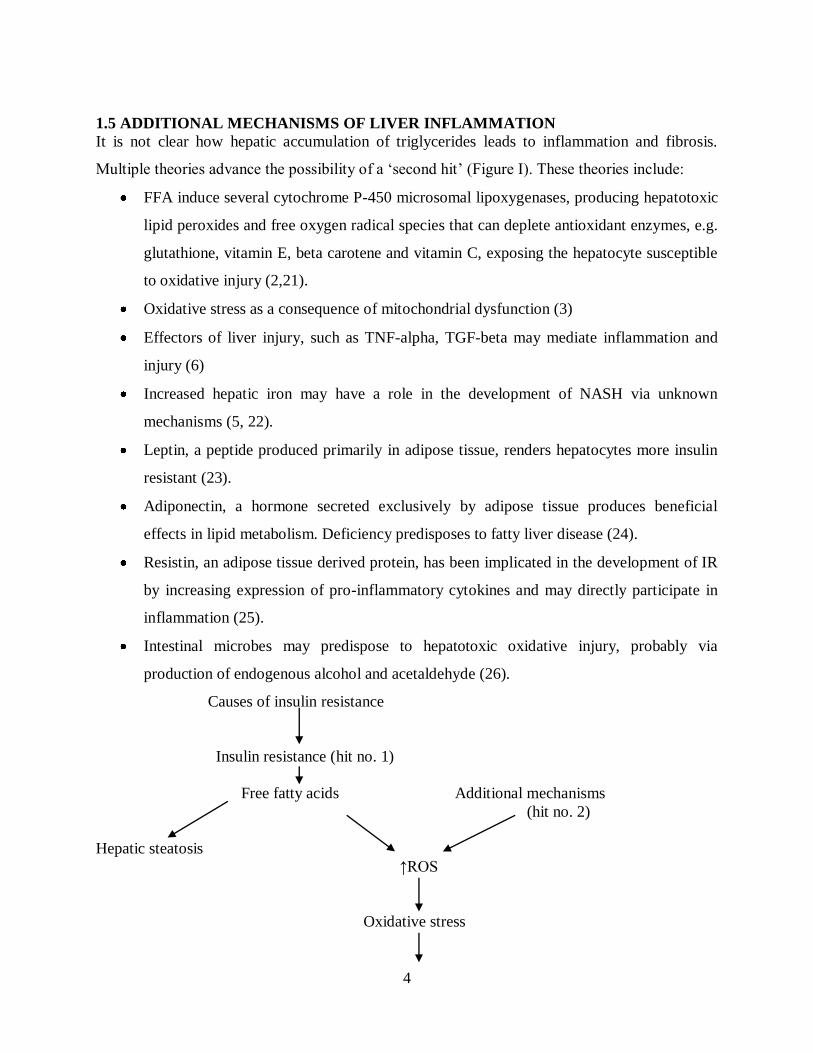
1.5 ADDITIONAL MECHANISMS OF LIVER INFLAMMATION
It is not clear how hepatic accumulation of triglycerides leads to inflammation and fibrosis.
Multiple theories advance the possibility of a ‘second hit’ (Figure I). These theories include:
FFA induce several cytochrome P-450 microsomal lipoxygenases, producing hepatotoxic
lipid peroxides and free oxygen radical species that can deplete antioxidant enzymes, e.g.
glutathione, vitamin E, beta carotene and vitamin C, exposing the hepatocyte susceptible
to oxidative injury (2,21).
Oxidative stress as a consequence of mitochondrial dysfunction (3)
Effectors of liver injury, such as TNF-alpha, TGF-beta may mediate inflammation and
injury (6)
Increased hepatic iron may have a role in the development of NASH via unknown
mechanisms (5, 22).
Leptin, a peptide produced primarily in adipose tissue, renders hepatocytes more insulin
resistant (23).
Adiponectin, a hormone secreted exclusively by adipose tissue produces beneficial
effects in lipid metabolism. Deficiency predisposes to fatty liver disease (24).
Resistin, an adipose tissue derived protein, has been implicated in the development of IR
by increasing expression of pro-inflammatory cytokines and may directly participate in
inflammation (25).
Intestinal microbes may predispose to hepatotoxic oxidative injury, probably via
production of endogenous alcohol and acetaldehyde (26).
Causes of insulin resistance
Insulin resistance (hit no. 1)
Free fatty acids Additional mechanisms
(hit no. 2)
Hepatic steatosis
↑ROS
Oxidative stress

5
Hepatocyte injury
Inflammation
Fibrosis
ROS: Reactive oxygen species
Figure I: The ‘two hit’ hypothesis
1.6 PREVALENCE OF NAFLD
True prevalence of NAFLD has been underestimated. This is evidenced by its incidental
discovery in patients being worked up for the metabolic syndrome or any of its components, and
without symptomatology for liver disease. Similar findings have been found in autopsies of
patients who died from non-hepatic causes. It is, however, likely to become more frequent
worldwide given the increasing diagnosis of major insulin resistance associated metabolic
disorders (27).
Most studies have used vigorous clinical and histological criteria focused on special subsets of
hospital based populations, mainly those with morbid obesity and those awaiting bariatric
surgery, with few general population studies to-date. Studies in these patient sub-groups are
prompted by the discovery of a high prevalence of fatty liver disease during the work up of such
patients (27). Currently, there is no data on prevalence of NAFLD in sub-Sahara Africa.
NAFLD has been reported in all age groups with the highest prevalence from ages 40-49. The
disease occurs with equal frequency in men and women. There is familial clustering, probably
reflecting clustering of type 2 DM and obesity (6).
In Britain, Underwood et al performed post-mortem examinations on healthy aircraft crew killed
in aircraft accidents and found NAFLD in 21% of the victims (28). A Scandinavian post-mortem
study performed on 503 consecutive road traffic accident victims by Hilden et al found NAFLD
prevalence of 24% (29).
1.2 – 9% of patients undergoing liver biopsy in different centres during work-up for abnormally
elevated liver enzymes and/or ultrasonographic fatty liver had NASH (30), and 15 – 39%
demonstrated the whole spectrum of NAFLD (31,32).
Nonomura et al, in a Japanese study performing hepatic ultrasonography in the general
population, detected hepatic steatosis in 23% of study subjects (31). A similar study by Lonardo
et al in Italy found an almost similar prevalence of 20% (33). Giovanni et al found a prevalence

6
of 69.5% in type 2 diabetic patients, detected by ultrasonography (34). In the Lonardo study, a
prevalence of 16.4% pertained to a control group, and increased to 75.8% in obese individuals.
The risk for NAFLD was 4.6 fold higher in obese persons with a BMI > 30kg/m2.
Two studies of patients undergoing bariatric sugery for morbid obesity found a prevalence of
NAFLD of 86% and 96%, whereas the prevelance of NASH was 24% and 25% (13,35).
A more recent meta-analysis analyzed data from the Third National Health and Nutrition
Examination, evaluating 15,676 USA adult individuals. Analysis of the data approximated 9.1
million USA individuals might have NAFLD as evidenced by unexplained elevated hepatic
transaminases, with significant association with the metabolic syndrome or its components (36).
Mofrad et al found the entire spectrum of NAFLD in individuals with normal ALT. Despite
elevated transaminases being common in NAFLD, a contrary finding does not rule out the
disease (37).
A meta-analysis of several studies on NAFLD estimates an overall prevalence of about 20%. An
ultrasonography study of 846 school children in Japan showed a 2.6 overall prevalence of fatty
liver with a strong correlation to BMI obesity indices (38).
In view of the above, population based studies would provide more accurate data regarding the
true prevalence of NAFLD.
1.7 DIAGNOSIS OF NAFLD
NAFLD is often asymptomatic. Suspicion is aroused by the incidental finding of abnormal
aminotransferases, or a “bright liver” on abdominal ultrasound in patients being worked up for
chronic disorders such as the metabolic syndrome or any of its components (39, 40, 41).
The most frequently encountered complaints include fatigue and malaise (40,41), as well as
vague and aching right upper quadrant discomfort, especially in children (40, 42, 43).
The most common clinically encountered sign is hepatomegally, reported in up to 50% of
subjects (7,40). Stigmata of chronic liver disease (CLD) are notably absent and only occur in
those patients who progress to late stage or decompensated cirrhosis. Acanthosis nigricans has
been described in children with NAFLD and is likely to be a cutaneous marker of IR as seen in a
study in obese Japanese children (44). Physical examination should include measurements of
basic anthropometry; height and weight to determine BMI, and waist circumference.

7
The gold standard for diagnosis of NAFLD, following clinical, biochemical and suspicious
imaging, is liver biopsy
1.8 LABORATORY FINDINGS
Aminotransferase levels can be up to five times normal, with ALT:AST >1. ALT levels tend to
be persistently abnormal, although fluctuations can occur, and some patients have normal ALT
levels (6). AST/ALT ratio < I is considered typical of NAFLD, though it may depend on severity
of the disease; inversion of this ratio is associated with fibrosis and progression of the disease
(43, 45).
Gamma GT is almost always elevated. ALP may also be variably increased up to twice the upper
limits of normal (7, 40).
LFTs such as serum albumin, bilirubin and prothrombin time, are usually normal unless cirrhosis
and liver failure are present. Ferritin has been reported elevated in 21 – 62% of patients, and
probably reflects the hepatic inflammatory process rather than increased iron stores (46, 47, 48).
In the absence of overt diabetes, evaluation of IR should be part of the diagnostic work up. This
is achieved by the Euglycemic hyperinsuinemic clamp method (49), Homeostatic Model
Assessment formula (HOMA)(50), Quantitative Insulin Sensitivity Check Index (QUICKI)(51)
or the 120 minute Oral Glucose Tolerance Test (OGTT)(52).
1.9 IMAGING STUDIES
Ultrasound (U/S), Computerised tomography (CT) and Magnetic Resonance Imaging (MRI) are
non- invasive imaging techniques that can identify hepatic steatosis. However, fibrosis and
steatosis may display similar appearance to liver fatty infiltration. Pre- and post-contrast
enhanced CT images have been recommended to diagnose hepatic steatosis, as this can better
discern fibrosis from steatosis (53).
However, it is impossible to differentiate the different histological forms of NAFLD on imaging
techniques as none can inform on the presence and degree of inflammation, necrosis or fibrosis
(54). Nevertheless, imaging, especially U/S, is a useful tool in screening, as it provides an entry
point for follow up, further diagnostic work up and probable intervention.
Ultrasonographic characteristics of fatty liver
Sonography of fatty infiltration may be varied depending on whether it is diffuse or focal.
Diffuse steatosis may be mild where minimal diffuse increase in hepatic echopattern is seen with
normal visualisation of the portal vein radicals and diaphragm. Moderate steatosis is seen as
moderate diffuse increase in hepatic echogenicity and slightly impaired visualisation of

8
intrahepatic vessels and diaphragm. Severe steatosis appears as marked increase in echogenicity
with poor or non-visualisation of hepatic vessels and diaphragm.
Focal fatty change will be seen as focal areas of increased hepatic echogenicity especially near
the porta hepatis.
CT scan can be used to confirm fatty infiltration of the liver and shows reduction in attenuation
with preserved liver architecture, with reversal of the normal liver- spleen differences. The liver
enhances homogenously on contrast in the presence of fatty liver disease.
MRI is the most sensitive and specific imaging modality for demonstrating hepatic steatosis. The
liver shows diffuse increase in signal intensity on T1W1 and T2W1 images (55).
Of the three imaging methods mentioned above, U/S is the least sensitive. However, the
advantages of U/S vis-à-vis MRI and CT scan in detection of fatty liver are:
It is far much cheaper, and therefore more readily affordable to patients
It is easier and much more faster to perform
The procedure is less strenuous to the patient
Does not expose the patient to radiation
It is more widely available and therefore can be used in screening patients in peripheral
hospitals
1.10 LIVER BIOPSY
Non invasive imaging techniques are unable to describe/analyse presence and degree of
hepatocyte injury, inflammation and fibrosis. A liver biopsy is necessary to establish the
diagnosis and stage of NAFLD.
Need for a liver biopsy is controversial in the absence of proven specific therapy for the NASH
component of NAFLD. However, it is the only reliable method of precisely diagnosing disease in
the absence of biomarkers, can grade and stage disease and provide prognostic information (56,
57, 58).
There is paucity of histological data on asymptomatic patients with persistently abnormal liver
enzyme abnormalities on which to base management decisions such as liver biopsy, and
hepatologists use their discretion to identify patients to biopsy. 150 asymptomatic patients with
elevated amino-transferases underwent liver biopsy in a recent Scandinavian study (59). Fibrosis
was observed in half the biopsies, 2% were cirrhotic and in a majority mild pericellular fibrosis
was seen, the clinical significance of which was unclear. Such findings may favour considering

9
performing biopsies in patients with elevated transaminases, albeit with the inclusion of a scoring
system to identify those most at risk of advanced NAFLD.
Despite lack of evidence, a recent review concluded that liver histology should be obtained in
such asymptomatic patients (60), and this was reinforced by a prospective study by Skelley and
colleagues (61) who studied 354 patients with persistently abnormal liver enzymes (more than
twice the upper limit of normal for greater than six months). Similar results obtained by Daniel
and colleagues (62) found NASH/NAFLD to be the most prevalent histological finding in up to
two thirds of the patients studied.
Recent evidence suggests that approximately one third of NAFLD patients progress to fibrosis,
and 20% will develop cirrhosis (40, 63, 64, 65). Accurate diagnosis of fibrotic liver disease may
expedite earlier intervention, which may prevent or delay progression to end stage liver disease.
As it is unfeasible and unethical to biopsy all patients suspected of NAFLD, it is necessary to
define groups that may benefit from a liver biopsy. These include candidates older than 45 years,
diabetic or obese, as two- thirds show advanced fibrosis (63). Recent data confirm that patients
with NAFLD and type II diabetes mellitus are more prone to develop cirrhosis with higher
mortality (64). A clinico-biological BAAT (BMI, Age, ALT, serum Triglyceride) score
combining BMI, age, ALT and triglycerides has been proposed to improve overweight patient
selection for liver biopsy (65).
Another clinicobiological score, HAIR, was devised for the severely obese to identify clinical
and/ or biochemical risk factors that might predict advanced forms of NAFLD. This score of 0-3
is calculated by adding hypertension, ALT and IR index (65).
1.11 BAAT (BMI, Age, ALT, serum Triglyceride score)
Calculated as the sum of categorical variables; BMI kg/m2 ( 28=1, <28=0), age ( 50=1,
<50=0), ALT ( 2XN=1, <2XN=0), and serum triglycerides ( 1.7mmol/L=1, <1.7=0).
Ranges of the score are from 0-4. Score of 0 or 1 suggests no septal fibrosis. A score of 1
indicates possible septal fibrosis and probably the need for a liver biopsy.
1.12 HAIR (Hypertension, ALT, IR score)
Hypertension=1, ALT >40IU = 1, IR >5.0 =1; Score > 2 likely to be associated with NASH.

10
The following schema has also been proposed for evaluation and decision to do liver biopsy on
suspected NAFLD patients:
Incidental LFT finding Fatty liver (US or CT)
↑ ALT
Rule out co- existent or alternate liver diseases
Evaluate for the metabolic syndrome and insulin resistance
Change of life-style: exercise, diet, complete abstinence
6 months
If aminotransferases still elevated
Propose and discuss liver biopsy
Figure II: Proposed schema of evaluation and decision to do liver biopsy on suspected
NAFLD patients.
1.13 CLINICAL COURSE
Natural history of NAFLD has not been fully established as few studies address long term follow
up. Progression might be dependent on severity of histological damage (66).
Pure steatosis seems to have the best prognosis. In one study, when followed up to 19 years,
only one of 12 patients showed progression to fibrosis (11), although another study in 49 patients
with fatty liver alone reported 2 (4%) who progressed to cirrhosis (69).

11
Compared with alcoholic liver disease, non alcoholic fatty liver disease alone seems to have a
benign clinical course without excess mortality, as seen in a Danish study that followed up 109
non-alcoholic and 106 alcoholic patients (67).
Evidence to estimate histologic progression is scarce. Six pooled published series followed up 76
NAFLD patients who underwent repeated liver biopsy during a follow up of 1.4 to 15.7 years. 22
(30%) showed liver damage progression, 36 (47%) had essentially no change and 18 (23%) had
improvement or resolution of liver injury. Progression from steatohepatitis to more advanced
fibrosis or cirrhosis was also recognised (68, 69).
In 295 patients on a mean follow up of 7 years, there were 14 (5%) liver related deaths
including one hepatocellular carcinoma (HCC). At the time of liver biopsy, cirrhosis was already
present in 7-16 % of patients (68, 70).
1.14 TREATMENT
There is no proven effective therapy for NASH. Modification of risk factors such as obesity,
hyperlipidemia, and poor diabetic control is generally recommended (Figure II). Trials are
ongoing for potential drug treatments to reduce inflammation and necrosis, mainly specific OHA
agents and some anti-oxidants (71).

12
2.0 STUDY JUSTIFICATION
There is an increasing global prevalence of syndromes associated with IR, namely type 2
diabetes, obesity, hypertension and dyslipidemia. These syndromes, especially type 2 diabetes,
are associated with primary NAFLD. Increasing prevalence of these syndromes, and in particular
the increasing prevalence of type 2 diabetes mellitus in Kenya and sub-Sahara Africa, will in all
likelihood result in a rising prevalence of NAFLD and its associated morbidity and mortality.
Population-based studies employing ultrasonography done so far in the Western world yield
NAFLD prevalence of between 16.4 -23%.
This study will serve as a baseline study. Currently, to the best of my knowledge, there is lack of
local and even regional data on the prevalence of NAFLD in association with its known risk
factors and hence no local guidelines in its prevention, diagnosis and management. In addition,
the data obtained from this study can be compared with results of other completed or ongoing
studies from other regions of the world. With increasing adoption of Western lifestyles and
urbanisation, the data collected in this study is likely to change in the future.

13
3.0 RESEARCH QUESTION
What is the prevalence of NAFLD and its associated risk factors in black African patients with
type 2 diabetes mellitus attending the Diabetic Clinic at KNH?
4.0 STUDY OBJECTIVES
4.1 BROAD OBJECTIVE
To determine the prevalence of NAFLD in type 2 diabetic patients attending Kenyatta National
Hospital Diabetic Clinic.
4.2 SPECIFIC OBJECTIVES
1. To determine the ultrasonographic prevalence of NAFLD in patients with type 2 diabetes
mellitus.
2. Document the prevalence of deranged liver function tests in type 2 diabetes mellitus
patients with NAFLD.
3. Document the prevalence of other components of the metabolic syndrome, namely,
obesity, hypertension and dyslipidemia in type 2 diabetic patients with NAFLD.

14
5.0 MATERIALS AND METHODOLOGY
5.1 STUDY DESIGN
This study was a hospital-based cross sectional descriptive study.
5.2 STUDY POPULATION
The study subjects were adults with type 2 DM attending the KNH Diabetic Clinic.
5.3 STUDY AREA
This study was carried out at the KNH Diabetic Clinic.
5.4 SAMPLE SIZE
The sample size (n) was determined using the following formula for prevalence study (Fisher,
1991) (72).
n = Z²P (1 – P)
d²
n = required minimum sample size
P = prevalence of ultrasonographic NAFLD in type 2 DM patients from the Giovanni et al study,
where it was found to be 69.5% (33).
d = level of precision (set at ± 5%).
Z = standard normal deviate corresponding to 95% level of confidence (1.96).
Therefore n = 1.96×1.96×0.695×0.305
0.05×0.05
N= 326
STUDY PERIOD
4th January 2010 – 23
rd May 2011.
5.5 SAMPLING TECHNIQUES
Consecutive sampling was done. All patients with type 2 DM who met the inclusion criteria,
agreed to participate in the study and gave informed consent were recruited by the Principal
Investigator (PI) until the sample size was achieved.
CASE DEFINITION
Patients older than 30years who had been reviewed by a consultant endocrinologist and
diagnosed to have type 2 DM attending the Diabetic Clinic in KNH, and on OHA or lifestyle
modification for control of elevated blood glucose, with no history of insulin therapy.
INCLUSION CRITERIA
Informed consent to participate in the study
Lifelong abstainer from alcohol consumption

15
Adult patients with a diagnosis of type 2 DM
EXCLUSION CRITERIA
Patients with prior serologic evidence of HBV or HCV in their clinic files at the time of
recruitment
Patients who had ever received insulin therapy
5.6 SCREENING AND RECRUITMENT
The Principal Investigator (PI) perused all the files of the patients attending the Diabetic Clinic.
Patients who, from their file history, met the inclusion criteria were taken to a separate room
where the PI introduced himself and explained the nature of the study.
Those who agreed to participate were recruited and detailed consent obtained. Data was obtained
by the PI using the following methods:
CLINICAL METHODOLOGY
Socio-demographic data was obtained and a full medical history taken.
A general physical examination was performed to look for stigmata of chronic liver
disease.
Blood pressure was measured with a mercury sphygmomanometer by applying the cuff
around the left arm and readings were expressed in millimetres of mercury (mmHg).
Waist circumference at the widest abdominal girth was measured using a tape measure
and readings expressed in centimetres (cm).
Examined for hepatomegaly, defined as a liver span in excess of 15 cm.
Measured height in metres (m) using a tape measure and weight in kilograms (kg)
without shoes and clothing using a weighing scale to determine and grade body mass
index (BMI) (Appendix II).
4ml of venous blood was drawn aseptically from the antecubital vein for lipid profile and
liver function tests and these were done at the Kenyatta National Hospital Biochemistry
laboratory.
16
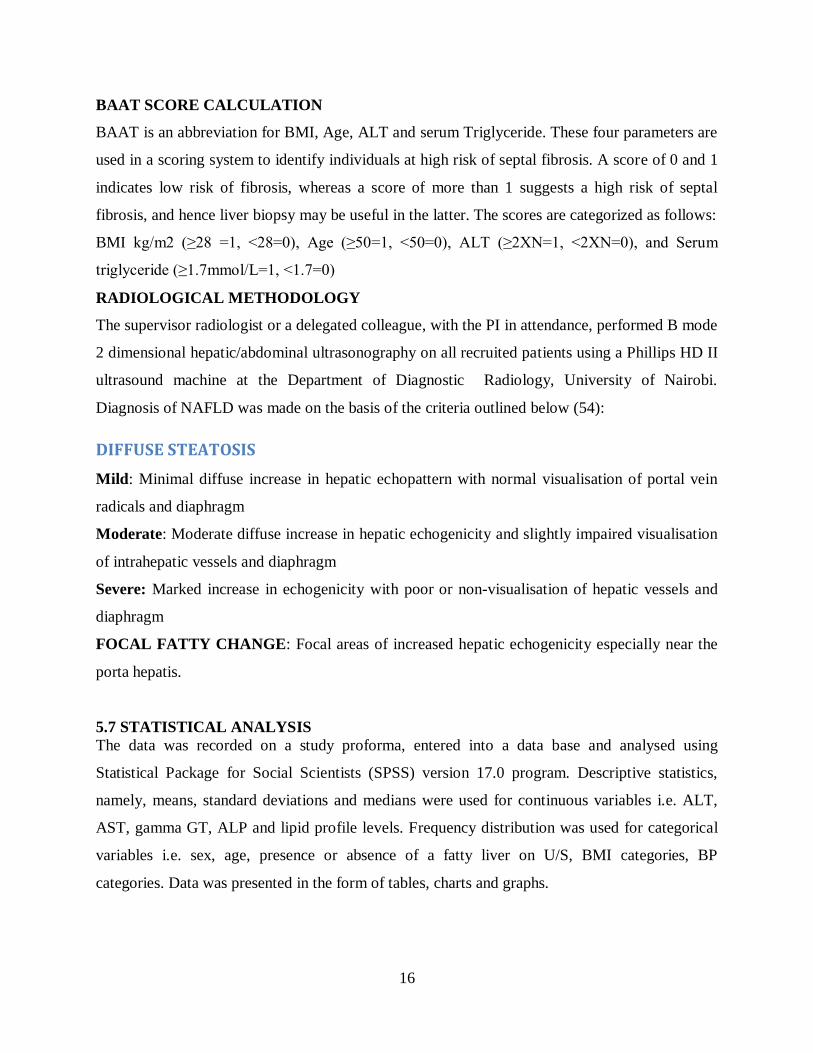
BAAT SCORE CALCULATION
BAAT is an abbreviation for BMI, Age, ALT and serum Triglyceride. These four parameters are
used in a scoring system to identify individuals at high risk of septal fibrosis. A score of 0 and 1
indicates low risk of fibrosis, whereas a score of more than 1 suggests a high risk of septal
fibrosis, and hence liver biopsy may be useful in the latter. The scores are categorized as follows:
BMI kg/m2 (≥28 =1, <28=0), Age (≥50=1, <50=0), ALT (≥2XN=1, <2XN=0), and Serum
triglyceride (≥1.7mmol/L=1, <1.7=0)
RADIOLOGICAL METHODOLOGY
The supervisor radiologist or a delegated colleague, with the PI in attendance, performed B mode
2 dimensional hepatic/abdominal ultrasonography on all recruited patients using a Phillips HD II
ultrasound machine at the Department of Diagnostic Radiology, University of Nairobi.
Diagnosis of NAFLD was made on the basis of the criteria outlined below (54):
DIFFUSE STEATOSIS
Mild: Minimal diffuse increase in hepatic echopattern with normal visualisation of portal vein
radicals and diaphragm
Moderate: Moderate diffuse increase in hepatic echogenicity and slightly impaired visualisation
of intrahepatic vessels and diaphragm
Severe: Marked increase in echogenicity with poor or non-visualisation of hepatic vessels and
diaphragm
FOCAL FATTY CHANGE: Focal areas of increased hepatic echogenicity especially near the
porta hepatis.
5.7 STATISTICAL ANALYSIS
The data was recorded on a study proforma, entered into a data base and analysed using
Statistical Package for Social Scientists (SPSS) version 17.0 program. Descriptive statistics,
namely, means, standard deviations and medians were used for continuous variables i.e. ALT,
AST, gamma GT, ALP and lipid profile levels. Frequency distribution was used for categorical
variables i.e. sex, age, presence or absence of a fatty liver on U/S, BMI categories, BP
categories. Data was presented in the form of tables, charts and graphs.

17
5.8 ETHICAL CONSIDERATIONS
The study was carried out after approval by the Department of Internal Medicine and
Therapeutics, UON, and the Ethics and Research Committee, Kenyatta National Hospital. The
procedures and purpose of the study were carefully explained to the patients verbally and in
writing. Study participation was voluntary, and patients declining to participate in the study were
not denied access to medical care. The costs of the study were borne by the investigator. These
included cost of materials, ultrasonography and provision of travelling stipend for study subjects.
The results of the investigations were availed by the PI to the patients and into their clinic files
and any necessary therapeutic intervention made in accordance to accepted standards of practice
by the attending physician. All patients found to have NAFLD were referred to the KNH Liver
clinic for further follow up. However, they still continued with their regular Diabetic clinic
follow up. The identities of the study participants were kept confidential.

18
6.0 RESULTS
During the study period, 760 patients with Type 2 DM attending the KNH Diabetic clinic were
screened. 389 did not meet the inclusion criteria and were excluded. 371 satisfied the inclusion
criteria after screening, 45 of whom declined to be enrolled into the study for various reasons: 6
were afraid of possible unfavourable hepatic U/S findings, 12 lost interest mainly due to time
constraints, 16 felt they were already overwhelmed and fatigued by the burden of too many
clinics associated with their medical condition and 11 gave a combination of the reasons above.
326 patients who satisfied the inclusion criteria and gave informed consent were recruited into
the study. The male: female ratio of the study population was 1:1.1.
Figure III: Recruitment flow chart
All study patients were on OHAs, either as a single agent or combination therapy. Metformin
was the commonest OHA in use in 65% (n=212). 26.4% (n=86) were on anti-hypertensive
medications and 10.4% (n=34) were on statins (28 on artovastatin and 6 on rosuvastatin). 9%
(n=29) were on low dose aspirin (75mg once daily).
Gender distribution in the study population
Table I
Sex Frequency (n=326)%
Male 158 (48)
Female 168 (52)
Age distribution of the study population
The overall study population had a mean age of 47±7 years and a range of 31 to 69 years.
760 Screened
371 Satisfied Criteria
326 Recruited
389 Excluded
45 Declined

19
Occupation of study participants
The occupation with the highest proportion was businessman/women with 19.6% (n=64),
followed by farmer and housewife at 15.3% (n=50) and 12.9% (n=42) respectively. Drivers and
conductors accounted for 8.9% (n=29), teachers 8.2% (n=27), casual labourers 5.8% (n=19) and
health care workers at 3.4% (n=12). The remaining occupations were distributed between
accountants, clerical officers, secretaries, hair-dressers, security personnel and others.
NAFLD prevalence in the study population
Prevalence of NAFLD in the 326 study patients was 34.4% (n=112) with 95% CI of 29.3% to
39.8%.
Figure IV: Prevalence of NAFLD in the study population
Ultrasonographic grades of NAFLD in study subjects
Mild fatty liver was the most common U/S finding at 60% (n=67) of all patients with NAFLD.
Moderate fatty liver accounted for 33% (n=37) and severe fatty liver 7% (n=8).
WITHOUT NAFLD 65.6%
NAFLD 34.4%

20
Figure V: Ultrasonographic grades of NAFLD in study subjects with NAFLD (n=112)
Gender distribution of study subjects with NAFLD
For females with NAFLD, 59% (n=38), 36% (n=23) and 5% (n=3) had mild, moderate and
severe NAFLD respectively. For males with NAFLD, 60% (n=29), 29% (n=14) and 10% (n=5)
had mild, moderate and severe NAFLD respectively. There was no statistically significant
association of gender with NAFLD (p value 0.177).
60%
33%
7%
MILD
MODERATE
SEVERE

21
Figure VI: Gender distribution of study subjects with NAFLD
Age group distribution of study subjects by NAFLD status
The peak age group of the study subjects was 45-49 years (n=189), followed by the age group
40-44 years (n=143). The age group 30-34 (n=13) had the least number of study subjects.
59% 60%
36%
29%
5%
10%
0%
10%
20%
30%
40%
50%
60%
70%
FEMALE MALE
MILD MODERATE SEVERE

22
Figure VII: Distribution by age group of NAFLD status in study patients
.
Deranged liver parameters in the study population
Of the 326 study patients, 5% (n=17) had elevated ALP, 12% (n=39) had elevated ALT, 8%
(n=25) had elevated AST and 10% (n=32) had gamma GT elevated above normal values.
Elevated serum albumin was found in 13% (n=41) and elevated total bilirubin in 3% (n=11). 7%
(n=23) of study subjects had a decreased liver span, while 13% (n=44) had an increased liver
span.
1%
9%
23%
30%
18%
20%
3%
14%
21%
28%
19%
16%
0%
5%
10%
15%
20%
25%
30%
35%
30-34 35-39 40-44 45-49 50-54 >55
Age (Years)
NAFLD(+)
NAFLD(-)

23
Figure VIII: Deranged liver parameters in the study population
Bivariate analysis of deranged liver parameters in the study population
In the bivariate analysis of deranged liver functions of the study population, seven hepatic
parameters were found to be significantly associated with NAFLD, namely, elevations above
normal values of ALP, ALT, AST, gamma GT, serum albumin, total bilirubin and hepatomegaly.
A low serum albumin was found not to be significantly associated with NAFLD, with a p value
of 0.166.
L I V E R P A R A M E T E R S
ElevatedALT
ElevatedAST
ElevatedGammaGT
ElevatedSerumAlbumin
ElevatedDirectBilirubin
ElevatedTotalBilirubin
DecreasedLiverSpan
IncreasedLiverSpan
ElevatedALP
Prevalence

24
Table II: Bivariate analysis of deranged liver parameters of the study population
CHARACTERISTIC
NAFLD STATUS OR 95%CI CHI SQUARE P VALUE YES (N=112) NO (N=214) TOTAL (N=326)
Elevated ALP 13(12%) 4(2%) 17(5%) 6.89 2.19-21.68 12.20 <0.001
Elevated ALT 36(32%) 3(1%) 39(12%) 33.32 9.97-111.35 63.08 <0.001
Elevated AST 23(21%) 2(1%) 25(8%) 27.39 6.32-118.66 37.17 <0.001
Elevated GGT 30(27%) 2(1%) 32(10%) 38.78 9.06-165.97 52.62 <0.001
Elevated serum albumin
7(8%) 34(18%) 41(13%) 0.38 0.16-0.91 4.29 0.038
Elevated total bilirubin
8(7%) 3(1%) 11(3%) 5.41 1.26-32.13 5.78 0.016
Hepatomegally 40(36%) 27(13%) 67(21%) 3.85 2.20-6.73 22.63 <0.001
Obesity indices of study subjects
40% (n=130) of study patients had a normal BMI. 30% (n =99) were overweight, 26% (n=83)
had class I obesity and 3% (n=11) and 1% (n=3) had class II and class III obesity respectively.
Figure IX: BMI categories of study patients
Bivariate analysis of elevated BMI in study subjects 73% (n=81) of study subjects with
NAFLD had a BMI above normal, while 54% (n=115) of those without NAFLD had above
25
normal BMI. During bivariate analysis, above normal BMI was found to be a statistically
significant risk factor associated with NAFLD with OR=2.25 (95%CI=1.37-3.68) and a p value
of 0.002.
Table III: Bivariate analysis of elevated BMI in study subjects
Characteristic
NAFLD
OR
95%CI
Chi
square
p value
Yes No Total
Elevated BMI 81
(73%)
115
(54%)
196
(60%)
2.25 1.37-3.68 9.83 0.002
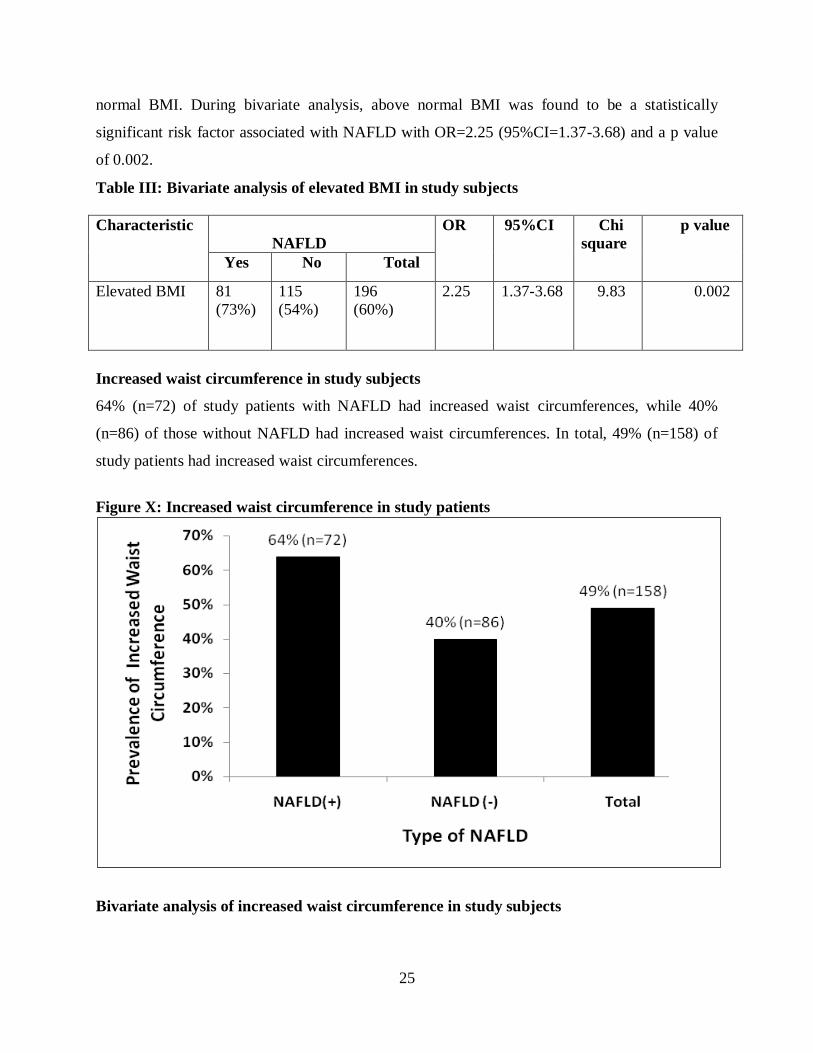
Increased waist circumference in study subjects
64% (n=72) of study patients with NAFLD had increased waist circumferences, while 40%
(n=86) of those without NAFLD had increased waist circumferences. In total, 49% (n=158) of
study patients had increased waist circumferences.
Figure X: Increased waist circumference in study patients
Bivariate analysis of increased waist circumference in study subjects

26
An increased waist circumference was found to be significantly associated with NAFLD when
compared between the study subjects with and without NAFLD, with a p value of <0.001.
Table III: Bivariate analysis of increased waist circumference in study subjects
VARIABLE Range
Mean p value Std Deviation
Waist circumference
NAFLD (+) 76-120
NAFLD (-) 74-112
96.8 <0.001
93.0
10.2
8.5
Blood pressure indices of study subjects
Of the 326 study patients, 26% (n=84) were normotensive and 57% (n=187) pre-hypertensive.
12% (n=40) had stage 1 hypertension and 5% (n=15) were stage 2 hypertensives.
Figure XI: Blood pressure indices of study subjects
Bivariate analysis of blood pressure indices
16% (n=18) of study patients with NAFLD were hypertensive. 18% (n=37) of study subjects
without NAFLD were also hypertensive. There was no statistically significant association
between blood pressure and NAFLD.
Table IV: Bivariate analysis of blood pressures of study subjects
26%(n=84)
57%(n=187)
12%(n=40)
5%(n=15)
0%
10%
20%
30%
40%
50%
60%
Normal BP Pre Hypertension Stage 1 Hypertension Stage 2 Hypertension
DISTRIBUTION OF BLOOD PRESSURE INDICES IN STUDY PATIENTS
27
NAFLD
(+)
(N=112)
NAFLD (-)
(N=214)
TOTAL
(N=326)
OR
95% CI
P VALUE
Normal BP
22(20%)
62(29%)
84(26%)
0.60
0.35-1.04
0.090
Pre-HTN
72(64%)
115(54%)
187(57%)
1.55
0.97-2.48
0.087
Diastolic
HTN
60(54%)
101(47%)
161(49%)
1.29
0.82-2.04
0.329
Systolic
HTN
79(71%)
130(61%)
209(64%)
1.55
0.95-2.53
0.104
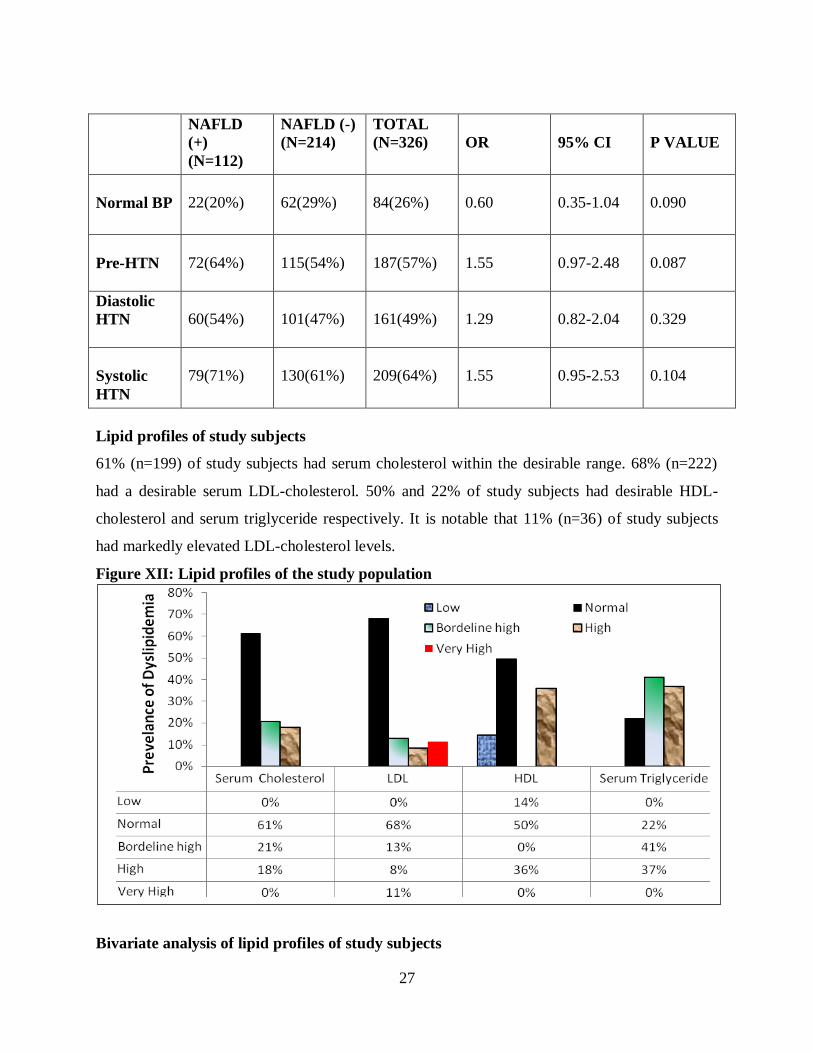
Lipid profiles of study subjects
61% (n=199) of study subjects had serum cholesterol within the desirable range. 68% (n=222)
had a desirable serum LDL-cholesterol. 50% and 22% of study subjects had desirable HDL-
cholesterol and serum triglyceride respectively. It is notable that 11% (n=36) of study subjects
had markedly elevated LDL-cholesterol levels.
Figure XII: Lipid profiles of the study population
Bivariate analysis of lipid profiles of study subjects

28
There was a statistically significant association between high serum triglyceride and high serum
HDL-cholesterol with NAFLD. There was no association of statistical significance of NAFLD to
serum LDL-cholesterol and Total Cholesterol levels.
Table V: Bivariate analysis of lipid profile
NAFLD
(+)
(n=112)
NAFLD
(-)
(n=214)
TOTAL
(N=326) OR 95%CI
P
value
Normal Total
Cholesterol 77(69%) 123(58%) 200 (61%) 1.63 1.00-2.64 0.062
High total
cholesterol 24(21%) 34(16%) 58(18%) 1.44 0.81-2.58 0.276
Low HDL 21(19%) 24 (11%) 45 (14%) 1.83 0.97-3.45 0.088
High HDL 26 (23%) 89(42%) 115 (36%) 0.42 0.25-0.71 <0.001
Normal HDL 65 (58%) 97 (45%) 162 (50%) 1.67 1.05-2.64 0.039
Normal LDL 72(64%) 150 (70%) 222 (68%) 0.77 0.47-1.25 0.356
High
Triglyceride 98(88%) 156(73%) 254(78%) 2.60 1.38-4.92 0.004
BAAT scores of study subjects with NAFLD
Ranged from 0-4 with mean of 1.6+/-1.1, median of 2 and mode of 2.
57/112 (51%) of patients had score > 1 suggestive of possible fibrosis.
BAAT > 1: 50% (n=33) in mild fatty liver disease, 51% (n=19) in moderate disease and
57%(n=4) in severe disease.

29
7.0 DISCUSSION
This study was designed to determine the ultrasonographic prevalence of NAFLD in subjects
with type 2 diabetes who were on OHA treatment for blood sugar control and were insulin-naive.
U/S is a validated surrogate tool for screening for NAFLD in the absence of liver biopsy (1, 31,
33, 34, 38).
Of the five components of the metabolic syndrome, diabetes is the risk factor most frequently
associated with NAFLD. This study further documented the prevalence of the other components
of the metabolic syndrome, namely, obesity, elevated blood pressure, elevated triglyceride and
low HDL-cholesterol and we sought to determine if there was significant association of these
factors to NAFLD in the study subjects. Derangements of liver function tests and hepatic spans
were also analysed.
The study population was mostly urban, living and working in Nairobi and its suburbs, and from
diverse occupational backgrounds. The age range of the study subjects was 31-69 years, with a
mean age of 47±7 years. The majority of all subjects studied were in the age group of 40-49
years.
The prevalence of ultrasonographic NAFLD among type 2 diabetic subjects in this study was
34.4%, the majority being in the age group 45-49 years, followed by the age group 40-44 years.
Our findings were comparable with those of a study carried out by Matteoni et al that found the
highest prevalence of NAFLD in a similar age group (5). The most common sonographic grade
of NAFLD was mild fatty liver (60%), followed by moderate (33%) and then severe fatty liver
(7%). A similar Italian study by Giovanni et al, also employing U/S as a screening tool, found a
much higher prevalence of 69.5%. 38% (n=64) of the female study subjects had NAFLD, while
30% (n=48) of male study subjects had NAFLD. There was no statistically significant
association of gender with NAFLD. This finding was comparable to that of Ludwig et al (7),
who found no statistically significant association between NAFLD and gender, with the disease
occurring in similar proportion among males and females.
We found significant association of NAFLD with deranged liver function tests, of which some
components were found to be markedly elevated. This finding was comparable to similar liver
function derangements from other studies described by Bacon et al, Cortez-Pinto et al and Reid
et al (69, 70, 76). 12.5% (n=14) of study patients with NAFLD had ALT: AST < 1, suggestive of
presence of cirrhosis, which is the terminal progression of NAFLD several years after the onset

30
(43, 45). Hepatomegaly was also significantly associated with NAFLD in this study, and this was
comparative with the study findings of Cortez-Pinto et al and Sheth et al (70, 73). Hepatomegaly
on bedside examination or right upper abdominal quadrant discomfort or tenderness are indeed
the commonest clinical findings in patients with symptomatic NAFLD.
73% of study patients with NAFLD had a BMI that was above normal, compared to 54% of
patients without NAFLD that had an elevated BMI. This was statistically significant with a p
value of 0.002, making obesity an important association. This was further affirmed by a
significant association of increased waist circumference with NAFLD. This finding was
consistent with the findings of Adler et al, Caldwell et al and Marceau et al, who also found
significant association of NAFLD and obesity (8, 9, 13).
In our study, no association was found between hypertension and NAFLD. The metabolic
syndrome and the resultant IR have been associated with NAFLD, as shown by Marceau et al
and Cortez-Pinto et al (13, 14). It is therefore of interest to note that hypertension, which is one
of the components of the metabolic syndrome, was not significantly associated with NAFLD in
this study.
Analysis of the lipid profiles showed hyper-triglyceridemia to be significantly associated with
NAFLD. Hyper-triglyceridemia has been shown to be associated with NAFLD (13, 14).
51% (57/112) of study subjects with NAFLD patients had a BAAT score of more than 2,
translating to an increased risk of hepatic fibrosis. It is significant that more than half of study
subjects with NAFLD were categorised into this high risk category.
Most of the NAFLD prevalence studies done to date are not representative of the general
population. They have focused mainly on sub-sets of patients (27), and mostly obese patients,
especially those undergoing bariatric surgery for morbid obesity (35). Other studies have mainly
been based on post-mortem liver histology findings (28, 29).
In Africa, there is lack of data on prevalence of NAFLD, either in the general population or in
specific groups of patients. It would be of interest to compare prevalence of NAFLD in the
general population in this region to that found in Japanese and Italian general population studies,
where the prevalence was almost similar, 23% and 20% respectively (31, 33). No other studies
on NAFLD in the general population are documented. As more data becomes available from
future studies on prevalence of NAFLD in type 2 diabetic patients from different regions, more
31
meaningful comparisons can be made. NAFLD therefore remains an understudied subject, with
few studies to compare to (58).
7.1 CONCLUSION
We found a 34.4% (95% CI 29.3-39.8%) prevalence of NAFLD in type 2 diabetic study subjects
with significant association to obesity and hyper-triglyceridemia.
7.2 STUDY LIMITATIONS
HBV and HCV markers were not done owing to financial constraints, and viral hepatitides may
occasionally mimic NAFLD.
10.4% (n=34) of the study patients were on statins. Statins are known to cause fatty liver disease.
However, it was not practical to exclude these patients from the study as statins are widely used
in the management of diabetic patients.
It was not possible to completely rule out previous use of medications that can cause secondary
fatty liver disease owing to limited patient recall and poor medical record keeping by most study
subjects.
Finally, some study patients may not have been truthful pertaining to alcohol consumption.
7.3 RECOMMENDATIONS
We recommend liver biopsy in diabetic patients with ultrasonographic evidence of this disease
and a BAAT score > 2 for histological profiling, as proposed by Laurin et al and Talwalkar et al
(56, 57). Intensive modification of associated risk factors has been shown to improve hepatic
histology in affected patients, hence the need for vigilance and stringent management of
prevalent risk factors for NAFLD in patients with type 2 DM, as this may delay onset or
progression of the disease.
Further, we recommend routine hepatic ultrasonography and LFTs monitoring in type 2 DM
patients. Subsequently, any patients found to have NAFLD should be referred to a hepatologist
for follow up.

32
8. REFERENCES
1 Contos MJ & Sanyal AJ. The clinicopathologic spectrum and management of
non-alcoholic fatty liver disease. Advances in anatomy and pathology 2002; 9:
37- 51.
2 Caldwell SH, Swerdlow RH, Khan EM et al. Mitochondrial abnormalities in
non-alcoholic steatohepatitis. J Hepatol 1999; 31: 430- 434.
3 Sanyal AJ, Campbell-Sargent C, Mirshahi F et al. Nonalcoholic steatohepatitis:
association of insulin resistance and mitochondrial abnormalities.
Gastroenterology 2001; 120: 1183- 1192.
4 Mendez-Sanchez N, Meda-Valdez P, Uribe M. Alcoholic Liver Disease. An
update. Ann Hepatol 2005; 4: 32-42.
5 Matteoni CA, Younossi ZM, Gramlich T et al. Nonalcoholic fatty liver disease:
A spectrum of clinical pathological severity. Gastroenterology 1999; 116:1413-
1419.
6 Nezam H. Afdhal. NAFLD: An emerging epidemic. AGA Postgraduate course,
May 15-16, 2004: 131-134.
7 Ludwig J, Viggiano RT, McGill DB & Ott BJ. Nonalcoholic steatohepatitis.
Mayo clinic experiences with a hitherto unnamed disease. Mayo Clin Proc
1980; 55: 434-438.
8 Adler M & Schaffner F. Fatty liver hepatitis and cirrhosis in obese patients. Am
J Med 1979; 67: 811-816.
9 Caldwell SH, Oelsner DH, Iezzoni JC et al. Cryptogenic cirrhosis: clinical
characterization and risk factors for underlying disease. Hepatology 1999; 29:
664-669.
10 Teli M, James OF, Burt AD et al. The natural history of non-alcoholic fatty
liver: a follow up study. Hepatology 1995; 22: 1714-1719.
11 Clark JM & Diehl AM. Nonalcoholic fatty liver disease: an under-recognized
cause of cryptogenic cirrhosis. JAMA 2003; 289: 3000-3004.
12 Marrero JA, Fontana RJ, Su GL et al. NAFLD may be a common underlying
liver disease in patients with hepatocellular carcinoma in the United States.
Hepatology 2002; 36: 1349-1354.
13 Marceau P, Biron S, Hould FS et al. Liver pathology and the metabolic
syndrome X in severe obesity. J Clin Endocrinol Metab 1999; 1513-1517.

33
14 Cleeman JI. Executive summary of the third report of the National Cholesterol
Education Program (NCEP) Expert Panel on detection, evaluation and treatment
of high blood cholesterol in adults (Adult Treatment Panel III). JAMA 2001;
285: 2486-2497.
15 Himsworth H. Diabetes mellitus: a differentiation into insulin sensitive and
insulin insensitive sub-types. Lancet 1936; i: 127-130.
16 Reaven GM. Banting lecture 1988. Role of insulin resistance in human disease
1988. Diabetes 1988; 37: 1595-1607.
17 Krook A & O’Rahilly S. Mutant insulin receptors in syndromes of insulin
resistance. Bailliere’s Clinical Endocrinology and Metabolism 1996; 10: 97-
122.
18 Swislocki AL, Chen YD, Golay A et al. Insulin suppression of plasma free fatty
acid concentration in normal individuals and patients with type 2 diabetes.
Diabetologia 1987; 30: 622-626.
19 Kissebah AH & Krakower GR. Regional adiposity and morbidity. Physiological
Reviews 1994; 74: 761-811.
20 Olefsky J, Farquhar JW & Reaven G. Relationship between fasting plasma
insulin level and resistance to insulin-mediated glucose uptake in normal and
diabetic subjects. Diabetes 1973; 22: 507-513.
21 Angulo P. Nonalcoholic fatty liver disease. N Eng J Med 2002; 346: 1221.
22 Vigano M, Vergani A, Trombini P et al. Insulin resistance influences iron
metabolism and hepatic steatosis in type 2 diabetes. Gastroenterology 2000;
118: 986.
23 Cohen B, Novick D, Rubinstein M. Modulation of insulin activities by leptin.
Science 1996; 274: 1185.
24 Xu A, Wang Y, Keshaw H et al. The fat derived hormone adiponectin alleviates
alcoholic and non- alcoholic fatty liver diseases in mice. J Clin Invest 2003;
112: 91.
25 Satoh H, Nguyen MTA, Miles PDG et al. Adenovirus mediated chronic ‘hyper-
resistenemia’ leads to in vivo insulin resistance in normal rats. J Clin Invest
2004; 114: 224.

34
26 Cope K, Risby T, Diehl AM. Increased gastrointestinal ethanol production in
obese mice: Implications for fatty liver disease pathogenesis. Gastroenterology
2000; 119: 1340.
27 Cortez- Pinto H, Camilo ME. Non- alcoholic fatty liver disease/non- alcoholic
steatohepatitis: diagnosis and clinical course. Best practice and research clinical
gastroenterology 2004; 18: 1090-1099.
28 Underwood Ground KE. Prevalence of fatty liver in healthy male adults
accidentally killed. Aviat Space Environ Med 1984; 55: 59- 61.
29 Hilden M, Christofferson P, Juhl E. Liver histology of a ‘normal’ population-
examinations of 503 consecutive fatal traffic casualties. Scand J Gastroenterol
1977; 12: 593- 597.
30 Sheth SG, Gordon FD, Chopar S. Nonalcoholic steatohepatitis. Ann Intern Med
1997;126: 137- 145.
31 Nonomura A, Mizukami Y, Unoura M et al. Clinicopathologic study of alcohol-
like liver disease in non alcoholics; non- alcoholic steatohepatitis and fibrosis.
Gastroenerol Jpn 1992; 27: 521- 528.
32 Propst A, Propst T, Judmaier G and Vogel W. Prognosis in non-alcoholic
steatohepatitis. Gastroenterology 1995; 108: 1607.
33 Lonardo A, Bellini M, Tartoni P & Tondelli E. The bright liver syndrome.
Prevalence and determinants of a bright liver echopattern. Ital J Gastroenterol
Hepatol 1997; 29: 351- 356.
34 Giovanni et al. Prevalence of NAFLD and its association with cardiovascular
disease among type 2 diabetic patients. Diabetes Care 2007; 30: 1212-1218.
35 Dixon JB, Bhathal PS and O’Brien PE. Nonalcoholic fatty liver disease:
predictors of non-alcoholic steatohepatitis and liver fibrosis in the severely
obese. Gastroenterology 2001; 121: 91- 100.
36 Clark JM, Brancati FL & Diehl AM. The prevalence and aetiology of elevated
aminotransferase levels in the United States. Am J Gastroenterol 2003; 98: 960-
967.
37 Mofrad P, Contos MJ, Haque M et al. Clinical and histologic spectrum of non-
alcoholic fatty liver disease associated with normal ALT values. Hepatology
2003; 37: 1286- 1292.

35
38 Tominaga K, Kurata JH, Chen YK et al. Prevalence of fatty liver in Japanese
children and relationship to obesity. An epidemiological ultrasonographic
survey. Dig Dis Sci 1995; 40: 2002- 2009.
39 Matteoni CA, Younossi ZM, Gramlich T et al. Nonalcoholic fatty liver disease:
a spectrum of clinical and pathological severity. Gastroenterology 1999; 116:
1413- 1419.
40 Bacon BR, FarahvashMJ, Janney CG & Neuschwander- Tetri BA. Nonalcoholic
steatohepatitis: an expanded clinical entity. Gastroenterology 1994; 107: 1103-
1109.
41 Lee RG. Nonalcoholic steatohepatitis. A study of 49 patients. Hum Pathol 1989;
20: 594- 598.
42 Moran JR, Grishan FK, Halter SA & Greene HL. Steatohepatitis in obese
children: a cause of chronic liver dysfunction. J Gastroenterol 1983; 78: 374-
377.
43 Sheth SG, Gordon FD & Chopra S. Nonalcoholic steatohepatitis. Ann Int Med
1997; 126: 137- 145.
44 Yamazaki H, Ito S & Yoshida H. Acanthosis nigricans is a reliable cutaneous
marker of insulin resistance in obese Japanese children. Paediatr Int 2003; 45:
701- 705.
45 Reid AE. Nonalcoholic steatoepatitis. Gastroenterology 2001; 121: 710- 723.
46 Bugianesi E, Manzini P, D’Antico S et al. Relative contribution of iron burden,
HFE mutations, and insulin resistance to fibrosis in non-alcoholic fatty liver.
Hepatology 2004; 39: 179- 187.
47 George DK, Goldwurm S, McDonald GA et al. Increased hepatic iron
concentration in non-alcoholic steatohepatitis is associated with increased
fibrosis. Gastroenterology 1998; 114: 311- 318.
48 Younossi ZM, Gramlich T, Bacon BR et al. Hepatic iron and non-alcoholic fatty
liver disease. Hepatology 1999; 30: 847- 850.
49 DeFronzo RA, Tobin JD & Andres R. Glucose clamp technique: a method for
quantifying insulin secretion and resistance. American Journal of Physiology
1979; 237: E214 – E223.
50 Matthews DR, Hosker JP, Rudenski AS et al. Homeostasis model assessment:
insulin resistance and beta cell function from fasting plasma glucose and
insulin concentrations in man. Diabetologia 1985; 28: 412- 419.

36
51 Katz A, Nambi SS, Mather K et al. Quantitative insulin sensitivity check index:
a simple, accurate method for assessing insulin sensitivity in humans. J Clin
Endocrinol Metab 2000; 85: 2402- 2410.
52 Marchesini G, Bugianesi E, Forlani G et al. Nonalcoholic fatty liver,
steatohepatitis and the metabolic syndrome. Hepatology 2003; 37: 917- 923.
53 Siegelman ES & Rosen MA. Imaging of hepatic steatosis. Semin Liver Dis
2001; 21: 71- 80.
54 Saadeh S, Younossi ZM, Remer EM et al. The utility of radiological imaging in
non-alcoholic fatty liver disease. Gastroenterology 2002; 123: 745 – 750.
55 Sutton D. Textbook of radiology and imaging, 7th edition 2002; 765.
56 Laurin J. Motion- all patients with NASH need to have a liver biopsy:
arguments against the motion. Can J Gastroenterol 2002; 16: 722- 726.
57 Talwalkar JA. Motion- all patients with NASH need to have a liver biopsy:
arguments for the motion. Can J Gastroenterol 2002: 16: 718- 721.
58 Younossi ZM, Diehl AM & Ong JP. Nonalcoholic fatty liver disease: an agenda
for clinical research. Hepatology 2002; 35: 746- 752.
59 Mathiesen UL, Franzen LE, Fryden A, et al. The clinical significance of slightly
to moderately increased liver transaminase values in asymptomatic patients.
Scand J Gastroenterol 1999; 34: 85-91.
60 Pratt DS, Kaplan MM. Evaluation of abnormal liver-enzyme results in
asymptomatic patients. N Engl J Med2000; 342: 1266-71.
61 Skelley MM, James PD, Ryder SD. Findings on liver biopsy to investigate
abnormal liver function tests in the absence of diagnostic serology. J Hepatol
2001; 35: 195-9.
62 Daniel S, Ben-Menachem T, Vasudevan GCK, et al. Prospective evaluation of
unexplained chronic liver transaminase abnormalities in asymptomatic and
symptomatic patients. Am J Gastroenterol 1999; 94: 3010-14.
63 Angulo P, Keach JC, Batts KP & Lindor KD. Independent predictors of liver
fibrosis in patients with non-alcoholic steatohepatitis. Hepatology 1999; 30:
1356- 1362.
64 Younossi ZM, Gramlich T, Matteoni CA et al. Nonalcoholic fatty liver disease
in patients with type 2 diabetes. Clin Gastroenterol Hepatol 2004; 2: 262- 265.

37
65 Ratziu V, Giral P & Charlotte F. Liver fibrosis in overweight patients.
Gastroenterology 2000; 118: 1117- 1123.
66 AnguloP. Nonalcoholic fatty liver disease. N Engl J Med 2002; 346: 1221-
1231.
67 Dam- Larsen S, Franzmann M, Andersen IB et al. Long term prognosis of fatty
liver: risk of chronic liver disease and death. Gut 2004; 53: 750- 755.
68 Powell EE, Cooksley WG, Hanson R et al. The natural history of non-alcoholic
steatohepatitis: a follow up study of 42 patients followed for up to 21 years.
Hepatology 1990; 11: 74 – 80.
69 Harrison SA, Torgerson S & Hayashi PH. The natural history of non-alcoholic
fatty liver disease: a clinical histopathological study. Am J Gastroenterol 2003;
98: 2042- 2047.
70 Cortez- Pinto H, Baptista A, Camilo ME & De Moura MC. Nonalcoholic
steatohepatitis- a long term follow up study: comparison with alcoholic hepatitis
in ambulatory and hospitalised patients. Dig Dis Sci 2003; 48: 1909- 1913.
71 Keeffe EB, Adesman PW, Stenzel P, Palmer RM. Steatosis and cirrhosis in an
obese diabetic: resolution of fatty liver by fasting. Dig Dis Sci 1987; 32: 441.
72 Lwaga SK. Sample size determination in Health Studies-A practical manual.
WHO, Geneva 1991.
73 Chobanian AV et al: The Seventh Report of the Joint National Committee on
Prevention, Detection, Evaluation, and Treatment of High Blood Pressure: The
JNC 7 report. JAMA 289: 2560, 2003.
74 National Institute of Health, National Heart, Lung, and Blood Institute: Clinical
Guidelines on the Identification, Evaluation, and Treatment of Overweight and
Obesity in Adults: U.S. Department of Health and Human Services, Public
Health Service, 1998.

38
APPENDIX I: STUDY PROFORMA
DATE OF INTERVIEW …………………………………………...
NAME ………………………………………………………………………..
HOSPITAL NUMBER …………………………………………………
SEX ………………..
AGE ……………………………..
OCCUPATION ………………………………………….
RESIDENCE ………………………………………………
CONTACTS………………………………………………..
DRUG HISTORY ……………………………………….
MEDICAL HISTORY ……………………………………
PHYSICAL EXAMINATION
BLOOD PRESSURE ……….....mmHg. HIGH NORMAL LOW
LIVER SPAN ………cm. (12-15cm) INCREASED NORMAL DECREASED
WEIGHT ……………………………………………………kg
HEIGHT …………………………………………….cm
WAIST CIRCUMFERENCE …… cm (men < 102 cm, women <88 cm) ( NORMAL
INCREASED)
CALCULATED BMI ……..kg/m². ( LOW NORMAL HIGH)
ULTRASONOGRAPHIC FINDINGS …………………………….
LABORATORY FINDINGS

39
LIVER FUNCTION TESTS
SERUM ALBUMIN ………g/L. (35-52g/L) NORMAL HIGH LOW
SERUM BILIRUBIN: DIRECT ………umol/L. (0-4.3umol/L). NORMAL
HIGH
TOTAL ………umol/ L. (<17umol/L). NORMAL HIGH
ALT …………U/L. (0-37 U/L) NORMAL HIGH
AST …............U/L. (0-42U/L) NORMAL HIGH
ALT/AST RATIO…………………….
GAMMA GT ……….U/L. (5-45) NORMAL HIGH
ALP ………..U/L. (98-279) NORMAL HIGH
FASTING LIPID PROFILE
TOTAL CHOLESTEROL …..…mmol/L. NORMAL HIGH LOW
LDL- CHOLESTEROL ……….mmol/L. NORMAL HIGH LOW
HDL- CHOLESTEROL ………mmol/L. NORMAL HIGH LOW
SERUM TRIGLYCERIDES ………mmol/L. NORMAL HIGH LOW
BAAT score: …………. 0-1: suggests no septal fibrosis, >2 indicates possible fibrosis

40
APPENDIX II: CALCULATION AND GRADING OF BODY MASS INDEX (BMI)
(kg/m2):
BMI = WEIGHT (KG)
HEIGHT X HEIGHT (M²)
18.5- 24.9: NORMAL
25- 29.9: OVERWEIGHT
30- 34.9: CLASS I OBESITY
35- 39.9: CLASS II OBESITY
40: > CLASS III OBESITY
41
APPENDIX III :CONSENT EXPLANATION
My name is Dr Karanga J K. I am a post- graduate student pursuing a Masters degree in internal
medicine at the University of Nairobi. The program requires I write a thesis. My research is on
non-alcoholic fatty liver disease in patients with type 2 diabetes.
I will require to take a detailed history and perform a thorough physical examination on you. A
radiologist will perform a liver ultrasound on you to screen for fatty liver disease.
Benefits of the study
The study aims to establish the prevalence of non-alcoholic fatty liver disease in type 2 diabetic
patients like you. This will assist in planning for follow up and intervention measures to alleviate
risk factors for those found to have this liver disease or any of its associated risk factors.
Ultrasonography is a painless procedure.
Your participation is absolutely voluntary and an informed written consent will be required from
you before participation. All information obtained will be confidential. You can withdraw from
the study at any stage should you so desire without jeopardy to your current treatment. The
results obtained shall be availed and discussed with you. I will bear the costs of all the
investigations.
You can contact me on 0733235142 in case of any queries.
42
APPENDIX IV: CONSENT FORM
I, ……………………………………………………………………………, do hereby
consent to participate in the above study, the nature of which has been fully explained to
me by Dr ………………………………………….. I understand the results of this study
shall be used for research work and strict confidentiality shall be maintained at all times.
Date………………………………. Signed…………………………………….
I confirm that I have explained to the patient the nature of the study and tests to be done
Date………………………………. Signed……………………………………

43
APPENDIX V: STUDY BUDGET
Stationery 5,000
Secretarial services 5,000
Ultrasound 326,000
Travelling allowance 65,000
Total 401,000

44
APPENDIX VI: ATP III CLASSIFICATION OF LDL, TOTAL AND HDL
CHOLESTEROL AND SERUM TRIGLYCERIDES (MMOL/L)
LDL cholesterol
<2.6 optimal
2.6-3.3 near optimal/above optimal
3.4-4.1 borderline high
4.1-4.9 high
≥4.9 very high
Total cholesterol
<5.2 desirable
5.2-6.2 borderline high
≥ 6.2 high
HDL cholesterol
<1.03 low
>1.55 high
Triglycerides
<1.7 normal
1.7-2.2 borderline high
2.2-5.6 high
≥5.6 very high

45
ETHICS APPROVAL LETTER