
Prevalence of Overweight
28
Prevalence of Overweight in American Samoan Schoolchildren (2007/2008 School Year) Report to the Directors Department of Health Department of Education June 2008 Territory of American Samoa Togiola T. A. Tulafono, Governor
Transcript of Prevalence of Overweight
Prevalence of Overweight in
American Samoan Schoolchildren
(2007/2008 School Year)
Report to the Directors
Department of Health
Department of Education
June 2008
Territory of American Samoa Togiola T. A. Tulafono, Governor
ABSTRACT
This large-scale survey complements our earlier work to
determine the prevalence of overweight in American Samoan
children and adolescents. Last school year we determined the
prevalence of overweight as about 34% for students in
grades K, 3, 6, 9, and 12 in all schools of the Territory. The
current study included students in all grades, K through 12,
from eight elementary schools and three high schools. In
addition to measuring students for their body mass index and
categorizing them as either underweight, at a healthy weight,
at-risk-of-overweight, or overweight according to criteria
established by the Centers for Disease Control and Preven-
tion, we also asked them questions concerning diet and
physical activity. We again found that the overall prevalence
of overweight was about 35%. We found that only about half
the students engaged in any type of physical activity after
school on a typical day. A larger proportion of students on
Manu’a had after-school chores, compared with students on
Tutuila/Aunu’u, and a lower proportion of Manu’a girls were
categorized as overweight compared with girls on Tutuila/
Aunu’u. Even so, the prevalence of overweight children and
adolescents on both Manu’a and Tutuila/Aunu’u is more than
twice that of youngsters in the United States. The health im-
plications for them as they enter adulthood and for the Terri-
tory’s healthcare system are grim.
1
In August 2007, we presented the results of our first
large-scale study of overweight in American Samoan
schoolchildren1. It detailed our survey of 2,795 boys
and 2,621 girls attending kindergarten (K-5) and
grades 3, 6, 9, and 12 at all public and private schools
throughout the Territory during the 2006/2007 school
year. We determined each student’s body mass index,
or BMI, which noted whether the student was under-
weight, at a healthy weight, at-risk-of-overweight, or
overweight according to age- and gender-specific
growth charts2. We also measured each student’s waist
circumference and compared it against age- and gen-
der-specific cutoffs for children and adolescents3. The
results indicated that less than half the students were
at a healthy weight, about 21% were at risk of becom-
ing overweight, and an alarming 34% were already
overweight. This was far greater than the 16% of 6-to-
19-year-olds found to be overweight in the United
States from 1999 to 20024. It was also substantially
greater than the highest US ethnic group rate of 23.6%
for 12- to 19-year-old non-Hispanic Blacks and the
27.9% reported in Polynesian children aged six to 12
from 13 Pacific countries surveyed in 20025.
One objection to using the Centers for Disease
Control and Prevention (CDC) BMI growth charts on
children of Samoan ancestry is that the charts are
based on a reference population that comprised less
than 4% of Asians and Pacific Islanders. We therefore
examined subsets of our data using cutoffs developed
by the International Obesity Task Force (IOTF). While
slightly more than half of the 6-to-8-year-olds had
healthy weights, most students 9 to 11, 12 to 14, and
15 to 17 years old were either overweight or obese.
[Note: CDC and IOTF definitions for unhealthy weight
differ in a confusing way. The IOFT defines ―at-risk-of
-overweight‖ as ―overweight‖ and ―overweight‖ as
―obese.‖ IOTF definitions are used internationally and
by the CDC for categorizing adults. In July 2007, an
expert panel representing the American Academy of
2
Pediatrics, the American Dietetic Association, the
American Academy of Child and Adolescent Psychia-
try, and the American College of Preventive Medicine
all recommended that the CDC adopt these definitions
for children as well6. Until/unless the CDC does so, we
continue to use the standing definitions of at-risk-of-
overweight and overweight.]
Another objection to using BMI standards in as-
sessing Pacific Islanders for overweight is that greater
weight for height among Pacific Islanders may be due
to heavier bones, more muscle mass, or wider frame
rather than to excess fat. We circumvented this objec-
tion by also measuring each student’s waist circumfer-
ence. Intra-abdominal fat is the most clinically rele-
vant type of fat. Using waist circumference as a surro-
gate measure of intra-abdominal fat and applying age-
and gender-specific cutoff points for children and ado-
lescents3, we found that about 40% of both boys and
girls had a high level of abdominal fat.
While it may be desirable and practical to eventu-
ally tailor an obesity screening tool specifically for
Samoans, the ramifications of unchecked obesity
make it imperative that the problem be addressed now
based on the best available evidence rather than wait
for the best possible evidence.
This year we determined the BMIs of 4,214 stu-
dents in grades K through 12 and confirmed that
American Samoan youth face a serious obesity prob-
lem. We also asked students about their food choices
and level of physical activity outside of school.
Though we did not enquire about the amount of food
eaten, most students reported that foods representing
the greatest part of their diets were low in fat. Their
responses suggested that low levels of physical activ-
ity may be the more important factor accounting for
overweight in our schoolchildren. We discovered two
possible critical intervals when the transition from
healthy weight to either at-risk-of-overweight or over-
weight was particularly evident: between ages six and
3
seven and between ages 13 and 14. Interventions
might be most effective during these intervals.
Materials and Methods
We again conducted our survey under the aus-
pices of the American Samoa Department of Health
with the approval of its Institutional Review Board
and in compliance with the Family Educational Rights
and Privacy Act administered by the American Samoa
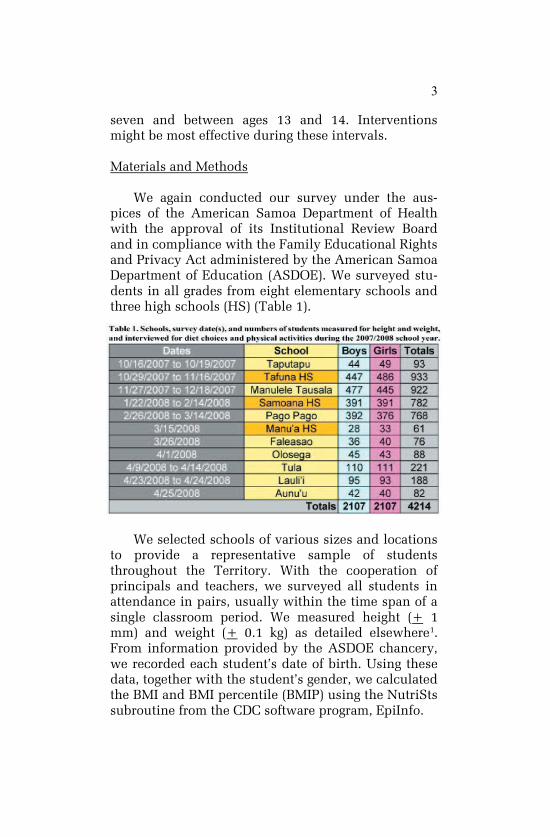
Department of Education (ASDOE). We surveyed stu-
dents in all grades from eight elementary schools and
three high schools (HS) (Table 1).
We selected schools of various sizes and locations
to provide a representative sample of students
throughout the Territory. With the cooperation of
principals and teachers, we surveyed all students in
attendance in pairs, usually within the time span of a
single classroom period. We measured height (+ 1
mm) and weight (+ 0.1 kg) as detailed elsewhere1.
From information provided by the ASDOE chancery,
we recorded each student’s date of birth. Using these
data, together with the student’s gender, we calculated
the BMI and BMI percentile (BMIP) using the NutriSts
subroutine from the CDC software program, EpiInfo.
4
We next asked the student three diet-related ques-
tions and one question about physical activity. Inter-
views were in either Samoan or English, whichever
language the student was more comfortable speaking.
Given the time constraint and reliability of student
recall, the questions were necessarily short and sim-
ple: What did you eat this morning before school? What
did you eat for supper last night? What fruits and vege-
tables do you eat? and What did you do, or plan to do,
after school yesterday or today? Because our food- and
physical activity-related questions were open-ended,
we received a variety of answers. We report here only
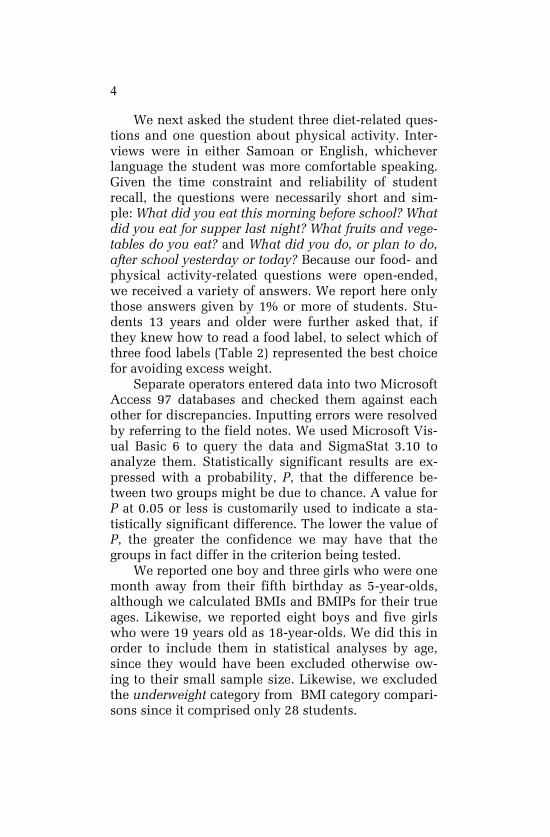
those answers given by 1% or more of students. Stu-
dents 13 years and older were further asked that, if
they knew how to read a food label, to select which of
three food labels (Table 2) represented the best choice
for avoiding excess weight.
Separate operators entered data into two Microsoft
Access 97 databases and checked them against each
other for discrepancies. Inputting errors were resolved
by referring to the field notes. We used Microsoft Vis-
ual Basic 6 to query the data and SigmaStat 3.10 to
analyze them. Statistically significant results are ex-
pressed with a probability, P, that the difference be-
tween two groups might be due to chance. A value for
P at 0.05 or less is customarily used to indicate a sta-
tistically significant difference. The lower the value of
P, the greater the confidence we may have that the
groups in fact differ in the criterion being tested.
We reported one boy and three girls who were one
month away from their fifth birthday as 5-year-olds,
although we calculated BMIs and BMIPs for their true
ages. Likewise, we reported eight boys and five girls
who were 19 years old as 18-year-olds. We did this in
order to include them in statistical analyses by age,
since they would have been excluded otherwise ow-
ing to their small sample size. Likewise, we excluded
the underweight category from BMI category compari-
sons since it comprised only 28 students.
5
6
Results and Discussion
Body Mass Index: Overall
We found that 34.4% of boys and 36.3% of girls
were overweight (Table 3), similar to the 34.9% of
boys and 33.6% of girls who were categorized as over-
weight during the first year of the study1. Likewise,
about 20% of students were again at-risk-of-
overweight. Average overall BMIPs were near the CDC
85th
percentile cutoff separating healthy weight from
at-risk-of-overweight individuals. High BMIPs of
about 75 were seen even in the youngest students.
This was far above the average BMIP of 50 for all ages
in the CDC reference population. The weight of one
18-year-old girl exceeded the 200-kg capacity of our
balance, giving her a BMI greater than 73 kilograms
per meter square, nearly three times the BMI cutoff for
overweight in adults.
Chi-square analyses comparing the proportions of
healthy weight, at-risk-of-overweight, and overweight
boys and girls of the same age revealed differences at
ages 14 (P = 0.050) and 16 (P = 0.011). Significantly
more boys had healthy weights at these ages. Other-
wise, before age 14 and after age 16, the distribution
of students among the healthy weight, at-risk-of-
overweight, and overweight categories were about the
same for both sexes.
Similar chi-square comparisons of adjacent ages
for boys and girls separately gave significant differ-
ences between ages six and seven (P = 0.058 for boys,
P < 0.001 for girls) and between ages 12 and 13 for
boys (P = 0.023) and ages 13 and 14 for girls (P =
0.036). For boys, the percentage at a healthy weight
between ages six and seven decreased from 60.9% to
48.9%, or 12.0 points, while the percentage who were
overweight increased 12.3 points to 32.6%. Those who
were at-risk-of-overweight remained constant at about
18.3%, that is, an equal percentage of healthy weight
boys moved into the at-risk-of-overweight category as

7
Table 3. Percentages of students who were underweight (UW), at a
healthy weight (HW), at risk of overweight (AR), and overweight
(OW) by gender and age; their average body mass index (BMI) with
standard deviation (StDev); their average body mass index percentile
(BMIP) with standard deviation; and the number of students (N).
8
moved out and into the overweight category.
For 6- and 7-year-old girls, the 11.9-point decrease
in healthy weight from 64.3% to 52.4% was similar to
the rate seen for boys. However, the increase in the
percentage who were overweight—from 12.7% for 6-
year-olds to 32.8% for 7-year-olds—was much greater
than the increase in percentage for boys. Although
both boys and girls showed an equal decline in the
percentage of healthy weight individuals between
ages six and seven, our results indicated that girls may
be more susceptible to greater weight gain then.
For 13- and 14-year-old girls, the percentage at a
healthy weight decreased from 40.1% to 29.0%, or
11.1 points, while the at-risk-of-overweight and the
overweight percentages increased by 7.4 and 4.9
points, respectively. Girls may be particularly suscep-
tible to weight gain at this age. A study by the Na-
tional Heart, Lung, and Blood Institute found that girls
between ages nine and 12 were especially at risk of
becoming overweight7. The study, however, did not
address why, nor did it examine boys to see whether
they faced a similar risk. Samoan girls may lag a year
behind the study group of 2,300 black and white girls
for several reasons. Perhaps they remain more physi-
cally active doing chores or playing sports. They
might also be less exposed to sedentary lifestyle influ-
ences such as hours on the phone and similar distrac-
tions. Alternatively, Samoan girls may take more
meals at home than in a fast-food setting.
While the percent of healthy weight 12- and 13-
year-old boys remained unchanged at about 47.6%,
the percent at-risk-of-overweight increased by 10.6
points, while the percent who were overweight de-
creased by 11.2 points. This anomalous decrease in
the percentage of overweight boys at age 13 was re-
versed at age 14 along with an 8.7-point decline in the
percentage of healthy weight boys. This later transi-
tion between 13- and 14-year-old boys corresponded
to the same age transition period for girls. We used
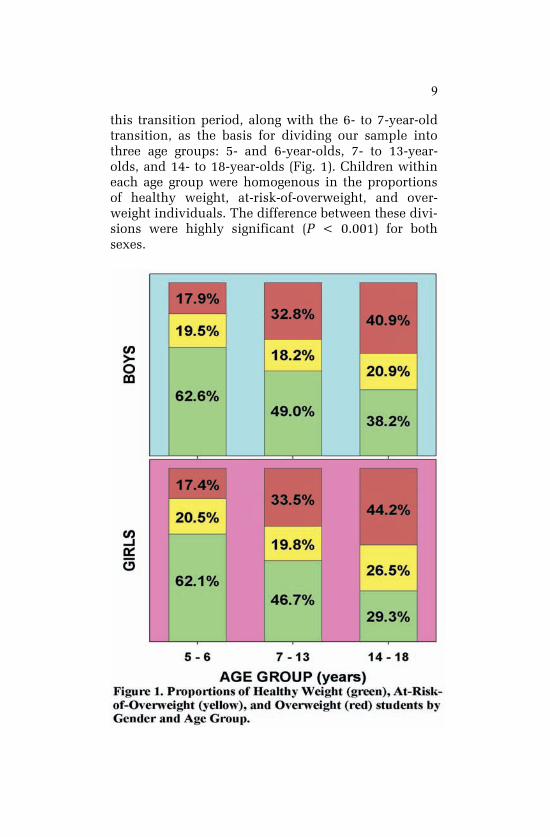
9
this transition period, along with the 6- to 7-year-old
transition, as the basis for dividing our sample into
three age groups: 5- and 6-year-olds, 7- to 13-year-
olds, and 14- to 18-year-olds (Fig. 1). Children within
each age group were homogenous in the proportions
of healthy weight, at-risk-of-overweight, and over-
weight individuals. The difference between these divi-
sions were highly significant (P < 0.001) for both
sexes.
10
Because the CDC BMI growth charts2 take into
account the changing physiology of children and ado-
lescents as they grow, the abrupt changes in the pro-
portions of students distributed among the CDC BMI
categories during these age transitions must be due to
one or more other factors. Ms. Maggie Keane, CEO of
Ina’ilau a Tama’itai’i, Inc., pointed out that benefits
from the US Department of Agriculture Special Sup-
plemental Nutrition Program for Women, Infants, and
Children (WIC) expire when the child reaches age
five. Benefits include nutritious foods to supplement
the diet, information on healthy eating, and referrals
to health care. Loss of these benefits might contribute
to a change from a relatively healthy diet to one with
increased proportions of less expensive, less nutri-
tious, energy-dense foods. A survey by researchers at
the University of Washington found that energy-dense
foods, such as sweets and snacks, cost an average of
$1.76 per 1,000 calories compared with $18.16 per
1,000 calories for low-energy but nutrient-dense foods
such as fruits and vegetables8. Switching from low-
energy to high-energy foods owing to loss of WIC sup-
plemental income might then result in children—girls
especially—gaining excessive weight over the follow-
ing year or two. This likelihood must be taken seri-
ously in American Samoa, where two of three chil-
dren live in poor families9.
Dr. Stacey Wiles, a pediatrician at LBJ Tropical
Medical Center, suggested that the spike between six
and seven years of age might be due to the school en-
vironment. Children transition from kindergarten to
full school days, resulting in fewer parent-supervised
meals. Lack of close supervision and encouragement
might also lead children to skip vegetables but to eat
dessert. And as children sit in classes for more hours,
their total caloric expenditure tends to decrease.
However, a study of 5,380 kindergartners and first
-graders by researchers from Indiana and Ohio State
Universities found that the youngsters’ BMIs in-
11
creased on average more than twice as much during
summer break compared with the school year10
. The
increase was even greater for children who were al-
ready overweight at the start of kindergarten. They
concluded that the 5- and 6-year-olds experienced a
more structured routine with school activities as op-
posed to plenty of free time eating snacks and watch-
ing television when at home.
Age 13 was when the highest percentage of under-
weight was evident for either sex (Table 3). Percent-
ages for healthy weight were relatively high and per-
centages for overweight low, particularly for boys, at
this age too. The second spike in overweight between
ages 13 and 14 might be attributed to the physiologi-
cal effects of puberty having a greater impact on eth-
nic Samoan adolescents than on the CDC reference
population. Factors fueling obesity in American Sa-
moa might be more pronounced or less avoidable as
well for adolescents in their early teens.
Body Mass Index: Manu’a vs. Tutuila Islands
Last year we surveyed only 117 students from
Manu’a Island schools. This proved to be too small a
sample for comparative tests. This year we surveyed
225 students from Olosega and Faleasao Elementary
Schools and Manu’a High School, allowing us to per-
form chi-square analyses.
Although we reported that the prevalence of over-
weight among American Samoan girls in this current
survey was 36.3%, a chi-square comparison between
girls from Manu’a and Tutuila found a significant dif-
ference (P = 0.010). The percentage of overweight
girls from Manu’a was only 23.3% compared with
37.2% of overweight girls from Tutuila and Aunu’u.
The prevalence of normal weight for Manu’a girls,
48.3%, was also greater than the 40.3% prevalence for
Tutuila girls. We found no prevalence differences be-
tween Manu’a and Tutuila Island boys.
12
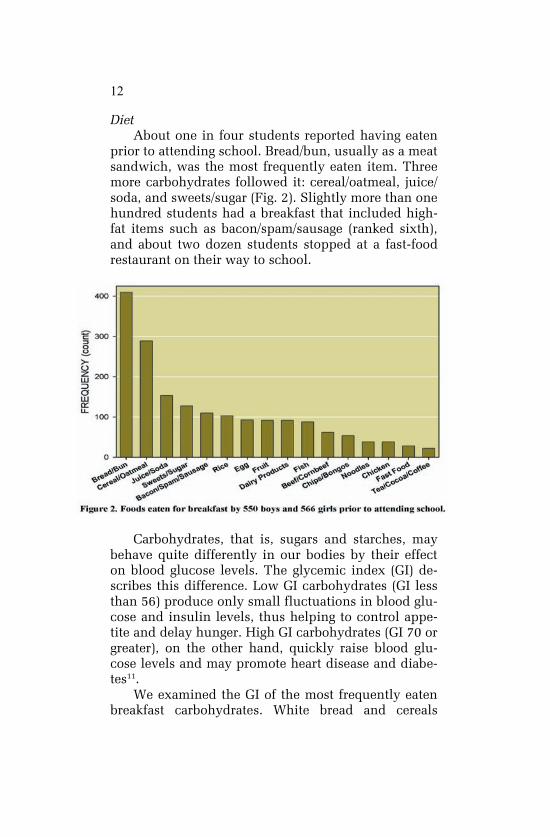
Diet
About one in four students reported having eaten
prior to attending school. Bread/bun, usually as a meat
sandwich, was the most frequently eaten item. Three
more carbohydrates followed it: cereal/oatmeal, juice/
soda, and sweets/sugar (Fig. 2). Slightly more than one
hundred students had a breakfast that included high-
fat items such as bacon/spam/sausage (ranked sixth),
and about two dozen students stopped at a fast-food
restaurant on their way to school.
Carbohydrates, that is, sugars and starches, may
behave quite differently in our bodies by their effect
on blood glucose levels. The glycemic index (GI) de-
scribes this difference. Low GI carbohydrates (GI less
than 56) produce only small fluctuations in blood glu-
cose and insulin levels, thus helping to control appe-
tite and delay hunger. High GI carbohydrates (GI 70 or
greater), on the other hand, quickly raise blood glu-
cose levels and may promote heart disease and diabe-
tes11
.
We examined the GI of the most frequently eaten
breakfast carbohydrates. White bread and cereals
13
(Cheerios™, corn flakes) had high GIs of 70 and 75,
respectively12
. Other favorite breakfast choices had
low to moderate GIs. Oatmeal had a GI of 48, unsweet-
ened apple juice (the base in Just Juice™) was 40,
while Coca-Cola™ was 6312
. Both juice and soda have
been implicated in contributing to overweight13
, even
if the latter were sugar-free14
. Sweets, the fifth-ranked
choice, probably have a GI of 58, similar to that of
sugar12
.
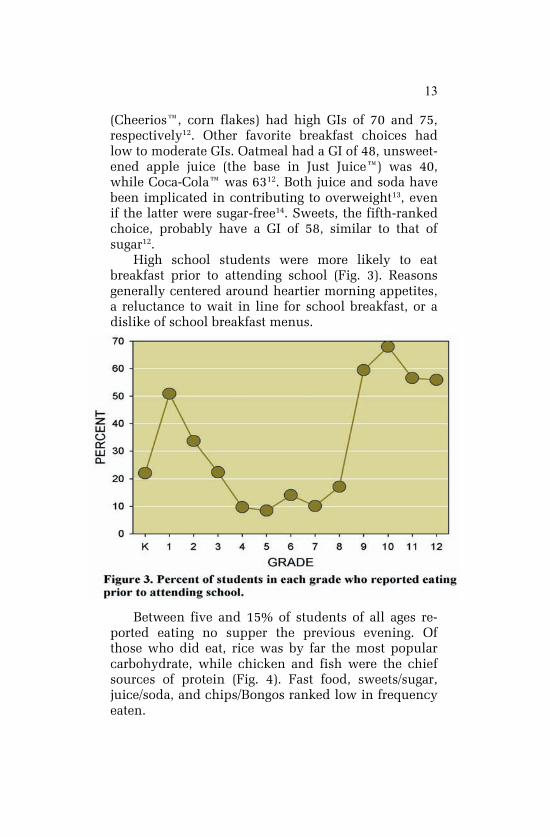
High school students were more likely to eat
breakfast prior to attending school (Fig. 3). Reasons
generally centered around heartier morning appetites,
a reluctance to wait in line for school breakfast, or a
dislike of school breakfast menus.
Between five and 15% of students of all ages re-
ported eating no supper the previous evening. Of
those who did eat, rice was by far the most popular
carbohydrate, while chicken and fish were the chief
sources of protein (Fig. 4). Fast food, sweets/sugar,
juice/soda, and chips/Bongos ranked low in frequency
eaten.

14
Imported apples, oranges, and carrots were the
fruits and vegetable of choice (Fig. 5). Even in Manu’a,
which lies about 75 mi (120 km) east of Tutuila with
limited air and sea transportation, students reported
apples and oranges as their first and second fruit
choices and carrots fourth, after cabbage. Students
selected locally grown fruits such as mango, papaya,
and breadfruit far less frequently. In the case of
mango and papaya, limited availability rather than
actual preference may account for their low rankings.

15
Whether boy or girl (n = 2,107 each), elementary
(n = 2,438) or high school (n = 1,776) student, an-
swers to diet-related questions were remarkably simi-
lar. The only significant difference (Wilcoxon Signed
Rank Test on paired replicates, P = 0.006) that we
discovered was in breakfast choices between students
from Tutuila and students from Manu’a. While about
10% of students from Tutuila selected bread/bun as
the most frequently eaten breakfast item, only 2.7% of
students from Manu’a did so. Instead, cereal/oatmeal
(5.3%) was their first choice followed by sweets/sugar
and dairy products (3.1% each). Other less striking
differences in home breakfast choices between Tutuila
and Manu’a students, respectively, were juice/soda
(3.8% vs. 0.4%), beef/corn beef (1.6% vs. none), and
chips/Bongos (1.4% vs. none).
Slightly more than half the students correctly se-
lected label C of Table 2 as the food choice lowest in
calories and fat (Table 4). Overweight students were
the most knowledgeable (65.5%), followed by at-risk-
of-overweight students (56.8%) and normal weight
students (46.7%). Many snacks and dairy products
sold in American Samoa are labeled according to the
Food Standards Australia New Zealand (FSANZ),
which uses the metric energy unit, the joule, in place
of the calorie. The students’ level of knowledge in
reading FSANZ labels may be even lower.
Table 4. Number of students, N, by age who selected a
label from Table 2, and the percent who correctly se-
lected label C. P is the cumulative binomial distribution
probability for the percent correct.
16
Physical Activity
In order to gain an understanding of how students
used their time when not in school, we asked what
they did the previous day or what they planned to do
that afternoon or evening. If their response was a sed-
entary activity such as ―homework‖ or ―nap,‖ we
prompted them in order to find if they also intended
to play outside, do chores, or engage in some other
physical activity.
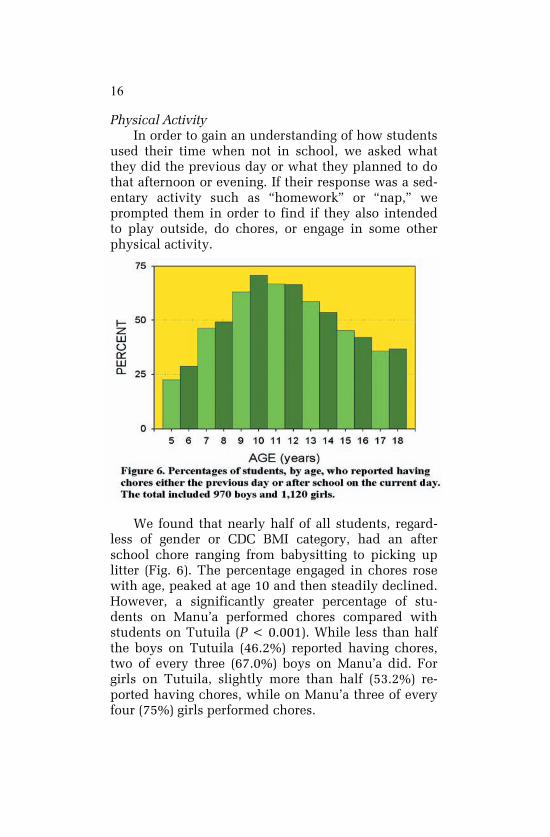
We found that nearly half of all students, regard-
less of gender or CDC BMI category, had an after
school chore ranging from babysitting to picking up
litter (Fig. 6). The percentage engaged in chores rose
with age, peaked at age 10 and then steadily declined.
However, a significantly greater percentage of stu-
dents on Manu’a performed chores compared with
students on Tutuila (P < 0.001). While less than half
the boys on Tutuila (46.2%) reported having chores,
two of every three (67.0%) boys on Manu’a did. For
girls on Tutuila, slightly more than half (53.2%) re-
ported having chores, while on Manu’a three of every
four (75%) girls performed chores.
17
18
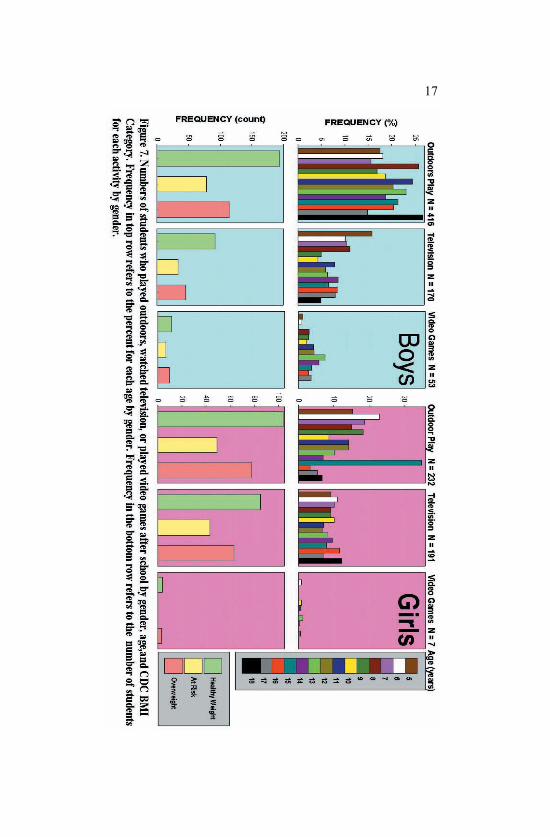
Less than one in five boys and one in nine girls
engaged in some type of outdoor play (Fig. 7). Outdoor
games appealed to boys regardless of age but declined
with age for girls, except for a spike for girls aged 15
years. About 5-10% of students reported watching
television regardless of age or gender, with the excep-
tion of 5-year-old boys (16%). The most striking differ-
ence between boys and girls was the number who
played video games. Although boys were seven times
more likely than girls to engage in this pastime, less
than 3% actually did so. For all three activities—
outdoor play, television, and video games–most of the
students had healthy weights.
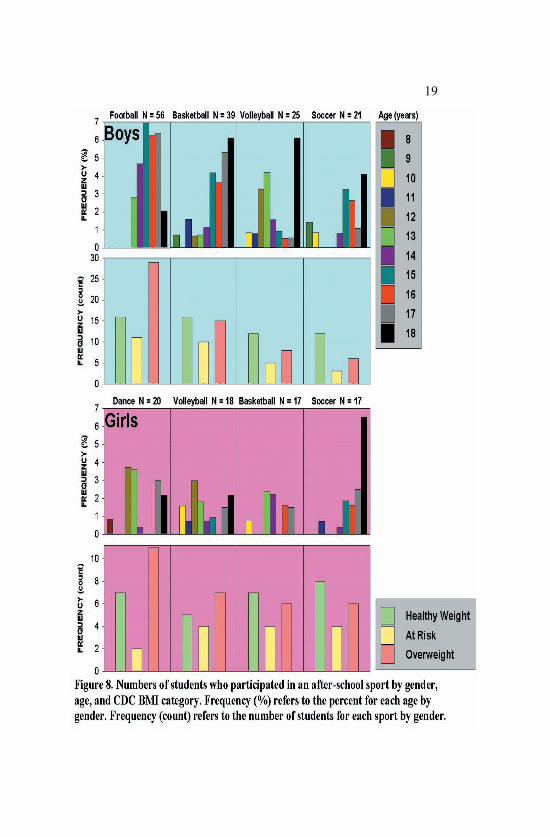
No Manu’a student participated in a sport. On Tu-
tuila, football was the most popular sport of boys
while girls preferred dance (Fig. 8). Both boys and
girls also enjoyed basketball, volleyball, and soccer
followed to a lesser degree by Junior Reserve Officers’
Training Corps, softball, jogging, weight lifting, and
swimming. Taken together, only about 10% of boys
and 5% of girls participated in some type of strenuous
after-school sports activity. Football, dance, basket-
ball, and volleyball were activities where overweight
students outnumbered healthy weight individuals.
Commentary
Many of today’s young and middle-aged adults
were children or adolescents in 1978 and 1982 when
University of Alabama Professor James Bindon visited
American Samoa and collected BMI data on 130 boys
and 138 girls between 11 and 18 years of age. Retroac-
tively applying IOTF cutoffs, which were published in
2000, to Bindon’s data revealed that the prevalence of
obesity was 3.8% for boys and 8.0% for girls15
. We
may presume that these rates were even lower for
older American Samoan adults who, as children, grew
up in a more traditional, less commercialized society
when ample time was allotted for vigorous recrea-
19
20
tional activities16
. Given these healthier starts in life,
what is the health status of American Samoan adults
25 to 64 years of age now?
American Samoa has one of the highest rates of
diabetes in the world at 47.3%17
. LBJ Tropical Medical
Center Board Chairman, Charles Warren, cited that it
costs five times more for the hospital to care for dia-
betic patients than for non-diabetic patients, that is,
$13,243 vs. $2,650 per year18
. Almost all adults in
American Samoa have one or more of the major risk
factors for a noncommunicable disease: smoking, obe-
sity, hypertension, low consumption of fruits and
vegetables, and low level of physical activity17
. With
93.5% of the adult population either overweight or
obese17
, American Samoans are exceeded only by
Nauruans (94.5%) as the most overweight people in
the world19
. And since our report last year1, another
fast-food restaurant has joined the five already operat-
ing here, offering the allure of a three-pound lunch.
What, then, are the health implications for today’s
youth, of whom more than one in three is already
obese, as they enter adulthood? The physical and
psychological effects of being overweight can last a
lifetime20
. Human beings develop their tastes at an
early age and have difficulty changing them. The
number of fat cells is set during childhood and adoles-
cence, and the most important factor in determining
fat mass in adults is linked to previously developed fat
cells21
.
The cause of obesity is nothing more complicated
than a habit of eating more calories than are used up
while resting and moving. Eating excessive amounts
of highly processed foods and foods high in sugar,
saturated fats, or trans fats generally account for the
first part of the cause. Using muscles for little more
than demanded by a sedentary lifestyle accounts for
the second part. However, this energy imbalance is
not simply due to gluttony and sloth, as some critics
charge. Efforts to make our lives more comfortable
21
contribute towards obesity. Our biology has not kept
up with the pace of change in society. The result is
that individuals—children especially–have much less
choice regarding their weight than is generally as-
sumed.
Surprising factors have recently been linked to
childhood obesity, ranging from plasticizers and other
hormone-mimicking contaminants leached from food
and beverage containers22
to poor nutrition during
pregnancy23
and insufficient sleep24
. Such correla-
tional observations cannot adequately account for all
collateral influences, most of which may be unknown,
that also affect obesity. These other influences, called
confounding variables, limit the usefulness of such
studies in determining a cause for obesity. This is
why, too, no single intervention short of forced starva-
tion will have much of an impact on reducing obesity.
Results presented here and in other obesity stud-
ies in American Samoa can serve as important evi-
dence-based resources to help shape public policy.
Yet change may come slowly. In addition to overcom-
ing apathy and inertia, at least three other challenges
must be confronted. First, understaffed government
departments already struggle with multi-faceted prob-
lems; second, political lifetimes are short compared
with the amount of time interventions may need to
have an impact; and third, complex problems beset
with uncertainty might be marginalized by policymak-
ers who want simple and certain solutions.
Nevertheless, several efforts have already been
initiated to address the problem. In July 2007, ASDOE
contracted Sodexho School Services to conduct a sys-
tem-wide needs assessment of the food services in
each school participating in the federal School Lunch
Program25
. Pediatric nutritionist Dr. Keith-Thomas
Ayoob cautions that following the Institute of Medi-
cine’s nutrition guidelines for foods served and sold in
schools may not have a large impact on reducing
childhood obesity26
. Students spend only six hours in
22
school, five days a week. Once outside of school, they
are again exposed to the lure of foods high in fat,
sugar, and salt. However, a recent study in five Phila-
delphia elementary schools that replaced sodas with
fruit juice, scaled back snacks, and banished candy
reduced the obesity risk by half27
. But students, along
with parents and teachers, were also given hours of
instruction about good nutrition. The take-home mes-
sage: A multicomponent school-based intervention
can be effective.
Other partnerships that are helping children com-
bat weight gain are the American Samoa Nutrition
Coalition, Ina’ilau a Tama’ita’i, Savali Mo Oe, Healthy
Kids Summer Camp, and the ASCC/GEAR-UP Fitness
Mini-camp to name a few. In addition to playgrounds
at Pago Park, Lion’s Park, McDonald’s restaurant, and
various schools, a village playground in Vailoatai of-
fers an opportunity for children to burn calories while
having safe fun.
As former Arkansas Governor and Presidential
Candidate Mike Huckabee stated, ―We don’t have a
health care crisis in this country. We have a health
crisis.‖ By working together and with parents, policy
makers and community leaders, concerned people can
bring about needed change. Otherwise, we bequeath
our children a legacy of shortened lifetimes con-
strained by chronic illnesses and a bankrupt health
care system to treat them.
Literature Cited
1. Obesity Study Committee. Prevalence of Overweight in Ameri- can Samoan Schoolchildren. Report to the Directors: Depart- ment of Health, Department of Education. August 2007. 28 pp. Available from: http://www.ctahr.hawaii.edu/adap/ASCC_Land Grant/technical_papers.asp as Report No. 47. 2. Centers for Disease Control and Prevention, National Center for Health Statistics, 2000 Growth Charts: United States. Published May 30, 2000. Available from: http://www.cdc.gov/growthcharts. 3. Taylor RW, Jones IE, Williams SM, Goulding A. Evaluation of waist circumference, waist-to-hip ratio, and the conicity index as
23
screening tools for high trunk fat mass, as measured by dual- energy X-ray absorptiometry, in children aged 3-19 y. Am J Clin Nutr 2000; 72:490-495. 4. Hedley AA, Ogden CL, Johnson CL, Carroll MD, Curtin LR, Flega KM. Overweight and obesity among US children, adoles- cents, and adults, 1999-2002. JAMA 2004; 291:2847-2850. 5. Hughes RG. Diet, food supply and obesity in the Pacific. World Health Organization, Geneva, Switzerland, 2003. 6. Tanner L. Expert panel says to call kids „obese.‟ ABC News Internet Ventures. Available from: http://www.abcnews.go.com/ print?id=3271834, (accessed 15 July 2007). 7. Thompson D, Obarzanek E, Franko D, Barton B, Morrison J, Biro F, Daniels S, Striegel-Moore R. Childhood overweight and cardiovascular disease risk factos: the National Heart, Lung, and Blood Institute Growth and Health Study. J Pediatrics 2007; 150(1):18-25. 8. Monsivais P, Drewnowski A. The rising cost of low-energy- density foods. J Am Dietetic Association 2007; 107(12):2071- 2076. 9. Population Reference Bureau. Children in American Samoa: results of the 2000 census. December 2002. Available from: http://www.prb.org/Source/ACF53A4.pdf 10. von Hippel PT, Powell B, Downey DB, Rowland NJ. The effect of school on overweight in childhood: gain in body mass index during the school year and during summer vacation. Am J Pub- lic Health 2007; 97(4):696-702. 11. Harvard School of Public Health. Carbohydrates: good carbs guide the way. Available from: http://www.hsph.harvard.edu/ nutritionsource/what-should-you-eat/carbohydrates-full-story/ Index.html. (accessed 22 May 2008). 12. SUGiRS. Sydney University Glycemic Index Research Service. Available from: http://www.glycemicindex.com (accessed 22 May 2008). 13. Bray GA, Nielsen SJ, Popkin BM. Consumption of high-fructose corn syrup in beverages may play a role in the epidemic of obe- sity. Am J Clin Nutr 2004; 79: 537-543. 14. Benton D. Can artificial sweeteners help control body weight
and prevent obesity? Nutrition Research Review 2005; 18(1):63-76.
15. Davison N, Fanolua S, Rosaine M, Vargo D. Concerns in as-sessing overweight and obesity in American Samoan adoles-cents. Available from: http://www.ctahr.hawaii.edu/adap/ASCC_ Land Grant/technical_papers.asp as Report No. 45.
16. Dunlap HL. Games, sports, dancing, and other vigorous recrea-tional activities and their function in Samoan culture. Research Quarterly, 1951; 22:298-311.
17. STEPS Report. American Samoa NCD Risk Factors. World Health Organization. March, 2007. 18. Sagapolutele F. “LBJ board chairman says: With LBJ obligated
to provide free medical service, Fono help needed.” Sa-
24
moaNews, 17 May 2007. 19. Epidemiologic Inquiry. Most overweight countries in the world:
ranking. Available from: http://www.epidemiologic.org/2007/02/most-overweight-countries-in-world.html.
20. Puhl R., Latner J. Obesity, stigma, and the health of the nation‟s children. Psychological Bulletin 2007; 133(4):557-580. 21. Spalding KL, Arner E, Westermark PO, Bernard S, Buchholz BA, Bergmann O, et al. Dynamics of fat cell turnover in humans. Nature 2008; 453:783-787. 22. vom Saal FS, Hughes C. An extensive new literature concerning low-dose effects of bisphenol A shows the need for a new risk assessment. Environmental Health Perspectives 2005; 113:926- 933. 23. Gluckman PD, Lillycrop KA, Vickers MH, Pleasants AB, Phillips ES, Beedle AS, et al. Metabolic plasticity during mammalian development is directionally dependent on early nutritional status. PNAS 2007; 104(31):12796-12800. 24. Taveras EM, Rifas-Shiman SL, Oken E, Gunderson EP, Gillman MW. Short sleep duration in infancy and risk of childhood over- weight. Arch Pediatr Adolesc Med 2008; 162(4):305-311. 25. Sodexho. American Samoa Government, RFP-015-2008. 26. Ayoob K-T. What if school foods improve and kids are still fat? 26 April 2007. ABC News Internet Ventures. Available from: http://www.abcnews.go.com/print?id=3083321, (accessed 15 July 2007). 27. Foster GD, Sherman S, Borradaile KE, Grundy KM, Vander Veur SS, Machmani J, et al. A policy-based school intervention to prevent overweight and obesity. Pediatrics 2008;121(4):e794- e802 (doi:10.1542/peds.2007-1365).
Obesity Study Committee
Donna Gurr
Matt Le’i
- ASDOE
Luana Scanlan
- ASCCN
Jacki Tulafono
- ASDOH
Don Vargo
- ASCC CNR
Survey Team
Sharon Fanolua
Sanerive Fuiava
Tamara Pereira
Marie Chan Kau
- ASCC CNR
Prepared by
Don Vargo
American Samoa Community College
Community and Natural Resources
P.O. Box 5319
Pago Pago, AS 96799
TEL: 684-699-1394
FAX: 684-699-5011
Order 292491040
Department of Health
Uto’ofili A. Maga, MPA, MPH, Director
Department of Education
Claire T. Poumele, Ed.D, Director
American Samoa Community College
Seth P. Galea’i, Ed.D, President
Uta Dr. Laloulu Tagoilelagi, BHE Chairman
ASCC Community and Natural Resources
Tapa’au Daniel M. Aga, DPA, Dean/Director
American Samoa Community Cancer Network Tafaeono Victor T. Williams, MD, FACS, PI
United States Department of Agriculture
CRIS Accession No. 0208378
Financial support was provided by a grant from the Coopera-
tive State Research, Extension, and Education Service of the
United States Department of Agriculture, administered by the
American Samoa Community College. This publication may
also be accessed from: http://www.ctahr.hawaii.edu/adap/
ASCC_LandGrant/technical_papers.asp as Report No. 48.
Order 292491040


![O L Journal of Obesity & Weight Loss Therapy...prevalence of obesity has been changed from 15 to 60 percent [5]. In Iran, prevalence of overweight, obesity and morbid obesity (BMI≥40)](https://static.fdocuments.net/doc/165x107/5f305497951df85cd52e88ee/o-l-journal-of-obesity-weight-loss-therapy-prevalence-of-obesity-has-been.jpg)


