Prevalence of Leprosy in Gudiyatham Taluk,4 South …ila.ilsl.br/pdfs/v40n2a08.pdfI NTERNATIONAL J...
7
I NTERNAT IONAL J OURNAL OF LEPROSY Vol um e 40. Number 2 Print.ed il1 the U.S.A . Prevalence of Leprosy in Gudiyatham Taluk,4 South India Part II . Geographical Variations 1.2 P. S. S. Rao , A. 8. A. Ka r at , V. C. Kaliaperumal and S. Karat 3 The pr evalence of leprosy varies be- tween continents. Likewis e, countries with- in a continent have differing rates of pr eva- lence of leprosy (15). Even countries in which lepro sy is end emic may demonstrate variations in leprosy pr evalence from one state to another, and even from one district to another within the same state (13 . 14 ._ 15). Th e reasons for these variations have not been fully explained. Th e relationships ex isting between the type of leprosy and the total prevalence also have not been conclusive. Further studies, therefor e, ap- pear to be necessary to document the exist- ence of the variations and to study the relationships between known demographic and geographic factors as related to lepro- sy. A previous paper described th e specific rates of leprosy with reference to age, sex a nd type (8). In this paper th e geograph- ical variations observed within one taluk in a district are describ ed and discussed with specific reference to the type of leprosy and certain demographic factors. MATERIALS AND METHODS Description of the area. Th e taluk of Gudiyatham is an inland area lying be- tween 78°35' to 79°20' eastern longitude and 12°40' to 13°05' northern latitude and 1 Received (or publication 2 Septe mb er 1971. 2 Sponsored a nd financed by the Swedish R ed Cross, Stockholm, as part of th e Swedish Red Cross Leprosy Campaign, Katpadi. 3 P. S. S. Rao , M.A., M.P.H. , F.S.S., Chief, Depart- ment of Biostatistics, C hri s ti an Medical College & Hospital, Vell ore, So. India ; A. B. A. Karat, B.Sc., M.B., M.R.C.P . (Lond ), F.R.C.P. (Edin) , Consul - ta nt l)h ys ician & Director of the Department of Ex- perimental Medicine, Church of South Indi a Hos- pit al, Banga lore IA ; V. C. Kaliaperumal, M.Sc. , Lecturer, Department of Bi ostatist ics , Christian Medical College, Vell ore, So. Indi a; S. Karat , M.B., B.S., F.R.C.S. (E), Asst. Professor of Orthopedics, St. J o hn 's Medical College and Consultant Ortho - p ed ic Surgeon , Church of South Indi a Hosp it a l, Banga lor e IA. 4 An administrative sub division of North Areat Di strict. 164 having an area of 510 square mil es (Fig. 1). Th e climate of th e taluk is warm throughout the year with low relative hu- midity. Th e mean maximum temperature varies between 30°C and 40 °C and the mean minimum between 12°C and 23 °C. Th e average rainfall is 800-900 mm per year. Many small hillocks lie scattered in this region. The river Palar is the southern boundary and the rivers Goddar and Kaun- danya How from north to south and are tributaries to the river Palar. Except for a few days each year, these rivers are dry sandy wastes. The forests in Gudiyatham Taluk are of fuel and scrub type. The northwest part is hilly and rises gradually along the neigh- boring district of Chittoor. Th e southern part is th e Palar River bed, fertile enough to produc e paddy and sugar cane. The soil is of black, red and alluvial types. According to 1961 census reports ( 2), the population of the taluk was 385,228, the density was 755 persons per square mil e, 40.3% of population were below ages 1.5 years, and 78% were living in rural areas. There were 982 females per 1,000 males, and the average size of household was 5.35. Of the total population, 42.6% were en- gaged in productive activities, cultivation being the main occupation. About 65% of houses in the rural areas have mud walls, 23% have burnt brick walls, 67% have gras s, leaf or similar roofs. Only 29% have tiles, slates, etc., 67% of the houses have only one room per house while the average numb er of per sons per house is 3.19. A majority of the population belongs to poor socio-economic groups having poor sanitation. Of the total population, the Hin- dus form 93.3%, Muslims 4.3% and Chris- tians 2.3%. Prevalence surveys, Because of the known
Transcript of Prevalence of Leprosy in Gudiyatham Taluk,4 South …ila.ilsl.br/pdfs/v40n2a08.pdfI NTERNATIONAL J...
I NTERNAT IONAL J OURNAL OF LEPROSY Volum e 40. Number 2 Print.ed il1 the U.S.A .
Prevalence of Leprosy in Gudiyatham Taluk,4 South India
Part II. Geographical Variations 1.2
P. S. S. Rao, A. 8. A. Ka rat, V. C. Kaliaperumal and S. Karat 3
The prevalence of leprosy varies between continents. Likewise, countries within a continent have differing rates of prevalence of leprosy (15). Even countries in which leprosy is endemic may demonstrate variations in leprosy prevalence from one state to another, and even from one district to another within the same state (13 . 14 ._ 15). The reasons for these variations have
not been fully explained. The relationships existing between the type of leprosy and the total prevalence also have not been conclusive. Further studies, therefore, appear to be necessary to document the existence of the variations and to study the relationships between known demographic and geographic factors as related to leprosy. A previous paper described the specific rates of leprosy with reference to age, sex and type (8). In this paper the geographical variations observed within one taluk in a district are described and discussed with specific reference to the type of leprosy and certain demographic factors .
MATERIALS AND METHODS
Description of the area. The taluk of Gudiyatham is an inland area lying between 78°35' to 79°20' eastern longitude and 12°40' to 13°05' northern latitude and
1 Received (or publication 2 September 1971. 2 Sponsored and financed by the Swedish R ed
Cross, Stockh olm , as part of the Swedish Red Cross Leprosy Campaign, Katpadi.
3 P. S. S. Rao, M.A., M.P.H. , F.S.S., Chief, Department of Biostatistics, Christian Medical College & Hospital, Vellore, So. India ; A. B. A. Karat, B.Sc., M.B., M.R.C.P . (Lond), F.R.C.P. (Edin) , Consul tant l)h ysician & Director of the Department of Experimental Medicine, Church of South Indi a Hospita l, Banga lore IA ; V. C. Kaliaperumal, M.Sc. , Lecturer, Department of Biostatistics, Christian Medical College, Vellore, So. Indi a; S. Karat, M.B., B.S., F.R.C.S. (E), Asst. Professor of Orthopedics, St. J ohn 's Medical College and Consultant Orthoped ic Surgeon , Church of South Indi a Hospita l, Banga lore IA.
4 An administrative subdivision of North Areat District.
164
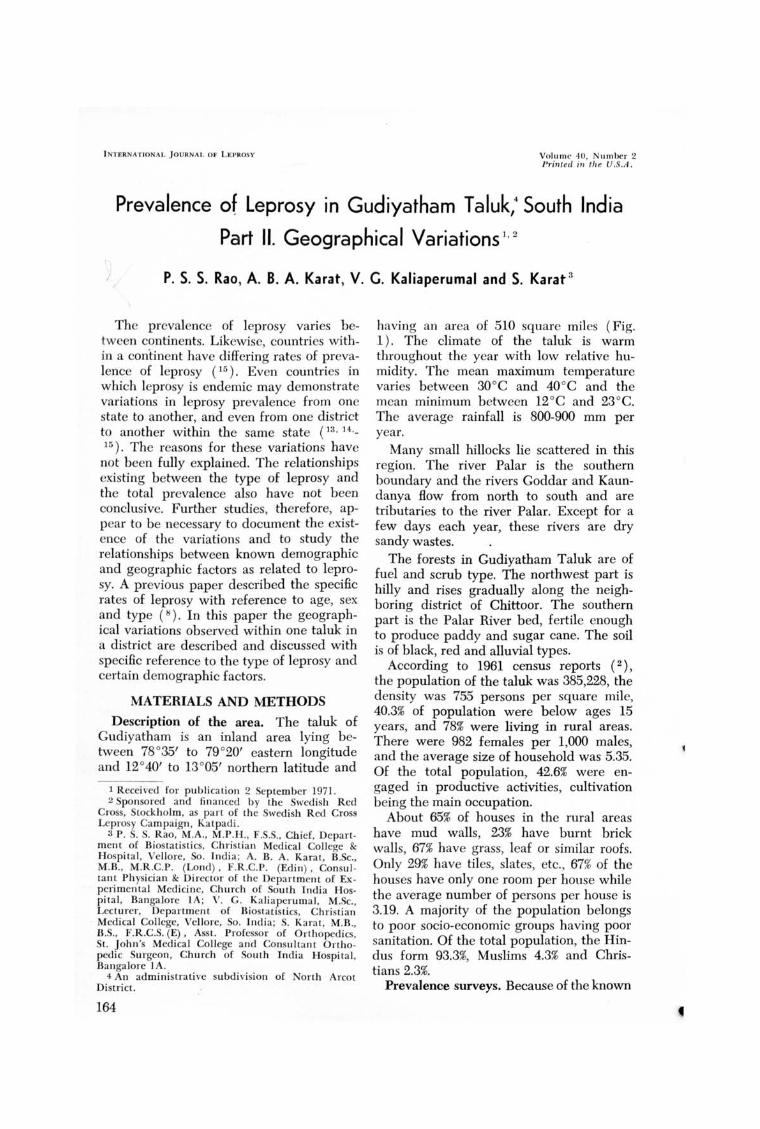
having an area of 510 square miles (Fig. 1). The climate of the taluk is warm throughout the year with low relative humidity. The mean maximum temperature varies between 30°C and 40°C and the mean minimum between 12°C and 23°C. The average rainfall is 800-900 mm per year.
Many small hillocks lie scattered in this region. The river Palar is the southern boundary and the rivers Goddar and Kaundanya How from north to south and are tributaries to the river Palar. Except for a few days each year, these rivers are dry sandy wastes.
The forests in Gudiyatham Taluk are of fuel and scrub type. The northwest part is hilly and rises gradually along the neighboring district of Chittoor. The southern part is the Palar River bed, fertile enough to produce paddy and sugar cane. The soil is of black, red and alluvial types.
According to 1961 census reports ( 2), the population of the taluk was 385,228, the density was 755 persons per square mile, 40.3% of population were below ages 1.5 years, and 78% were living in rural areas. There were 982 females per 1,000 males, and the average size of household was 5.35. Of the total population, 42.6% were engaged in productive activities, cultivation being the main occupation.
About 65% of houses in the rural areas have mud walls, 23% have burnt brick walls, 67% have grass, leaf or similar roofs. Only 29% have tiles, slates, etc. , 67% of the houses have only one room per house while the average number of persons per house is 3.19. A majority of the population belongs to poor socio-economic groups having poor sanitation. Of the total population, the Hindus form 93.3%, Muslims 4.3% and Christians 2.3%.
Prevalence surveys, Because of the known

FIG. 1. Gudiya tham Taluk area map.
endemicity of leprosy in this taluk, a domiciliary treatment and leprosy control program was initiated by th e Schieffelin Leprosy Research Sanatorium, Karigiri, in the latter part of 1962. The whole taluk was divided into 43 peripheral zones (centers ), each having a clinic. Eight of the centers each had a population below 3,000; seven with a population of 3,000-4,999; ten with a population of 5,000-6,999; ten with a population of 7,000-9,999; and seven with a population of more than 10,000.
One or more of the centers were under the supervision of a trained paramedical worker, who was in charge of approximately 20,000 persons. A screening program for the taluk was successfully completed by 1967 in which the paramedical workers had visited every household (family) and surveyed all resident persons. After collecting data regarding demographic factors and environmental conditions, each person in the household was examined for leprosy. Where leprosy was suspect the subjects were referred to clinics where they were examined by clinicians. Skin smears were taken and the Bacterial Index (BI) determined according to Ridley's scale. Those
found to have leprosy were registered and followed-up. For each of these cases, the basic demographic, social and medical data are available. A resurvey of the area was designed and carried out during 1968-1970 ( 8). .
Gudiyatham town which had a population of 50,384 in 1961, is much influenced by a high migration rate. Data peItaining to this urban area is not included in this paper. The remaining 42 peripheral centers are considered here. In these, 305,096 persons were enumerated and 276,568 persons were examined as of April 1970. Of a total of 8,371 patients registered in these centers, 726 were not true residents of the tal uk, and 503 had died, migrated or were lost and could not be followed-up. Of the remaining 7,142 patients; 17.6% had lepromatous, 55.5% tuberculoid, 10.5% borderline and 16.4% indeterminate type leprosy. There were 731 female patients per 1,000 male patients as compared with 984 females per 1,000 males in .the population examined, thus indicating that leprosy is more prevalent among m~tl es. The child ratio (number of persons aged below 15 years per 100 persons of all ages) was 25
166 I nternational lournal of Leprosy 1972
J 1
rALUK BOUNDARY,,· '
CENTRE BOUNDARY sol 8A$£ HOSPITAL I
I 2 I 0 2 4 6 8 MILES I
I !, !! I
TALUK ". 10 '
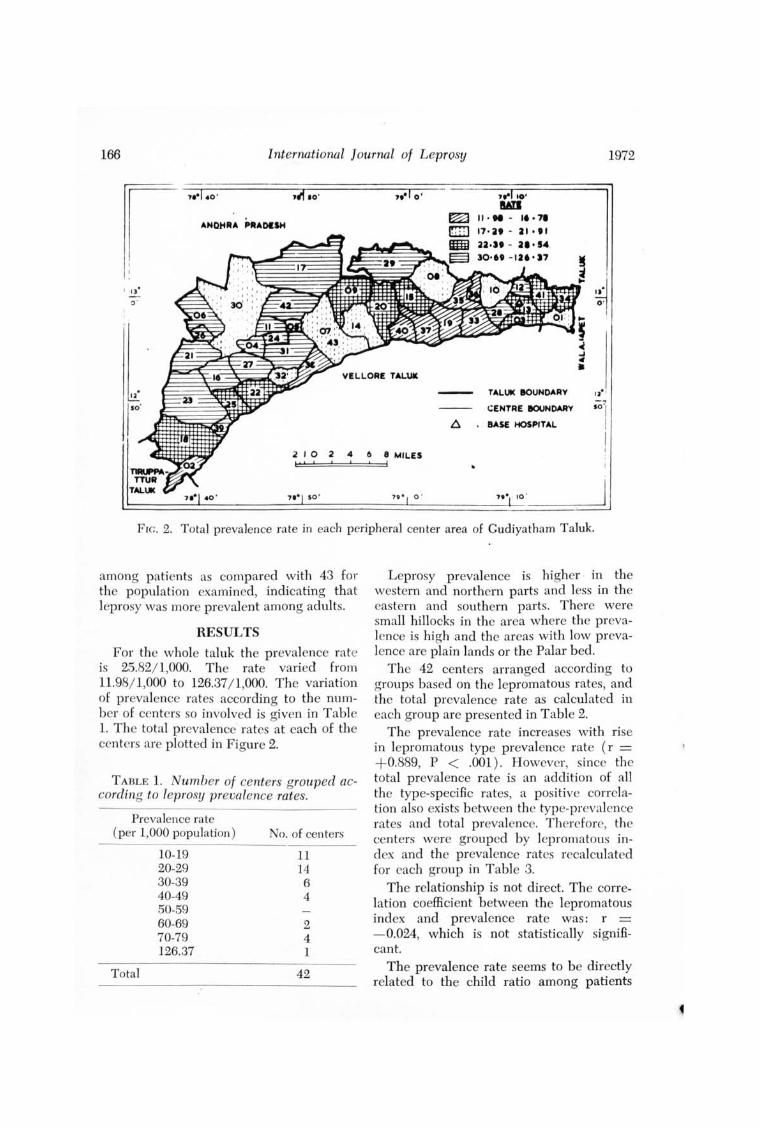
FIG. 2. Total prevalence rate in each peripheral center area of Gudiyatham Taluk.
among patients as compared with 43 for the population examined, indicating that leprosy was more prevalent among adults.
RESULTS
For the whole taluk the prevalence rate is 25.82/ 1,000. The rate varied from 11.98/1,000 to 126.37/ 1,000. The variation of prevalence rates according to the number of centers so involved is given in Table 1. The total prevalence rates at each of the centers are plotted in Figure 2.
TABLE 1. Number of centers grouped according to leprosy prevalence rates.
Prevalence rate (per 1,000 population)
Total
10-19 20-29 30-39 40-49 50-59 60-69 70-79 126.37
No. of centers
11 14 6 4
2 4 1
42
Leprosy prevalence is higher · in the western and northern parts and less in the eastern and southern parts. There were small hillocks in the area where the prevalence is high and the areas with low prevalence are plain lands or the Palar bed.
The 42 centers arranged according to groups based on the lepromatous rates, and the total prevalence rate as calculated in each group are presented in Table 2.
The prevalence rate increases with rise in lepromatous type prevalence rate (r = +0.889, P < .001). However, since the total prevalence rate is an addition of all the type-specific rates, a positive correlation also exists between the type-preval cnce rates and total prevalence. Therefore, the centers were grouped by lepromatous index and the prevalence rates recalculated for each group in Table 3.
The relationship is not direct. The correlation coefficient between the lepromatous index and prevalence rate was: r = - 0.024, which is not statistically significant.
The prevalence rate seems to be directly related to the child ratio among patients

40, 2 Rao et al.: Prevalence of Leprosy in South India, Part II 167
TABLE 2. Total versus lepromatous prevalence rates.
Lepromatous No. of No. of Leprosy prevalence rate centers patients Population prevalence rate
Below 3.00 8 891 53,521 16.65 3.00-3.99 10 1956 99,071 19.74 4.00-4.99 7 1278 49,560 25.79 5.00-5.99 4 829 28,412 29.18 6.00- 6.99 6 1070 28,322 37.78 8.00 & Over 7 1118 17,682 63.23
Total 42 7142 276,568 25.82
TABLE 3. Total leprosy prevalence as related to the lepromatous index.
Lepromatous No. of No. of Prevalence index centers patients Population rate
Below 10 3 361 9,009 40.07 10.00-14.99 9 1580 62,112 25.44 15.00- 19.99 18 2908 106,490 27.31 20.00 & Over 12 2293 98,957 23.17
Total 42 7142 276,568 25.82
TABLE 4. Leprosy prevalence rates compared with child ratio among patients.
Child ratio No. of No. of Prevalence for patients" centers patients Population rate
Below 20 11 1814 90,329 20.08 20.00-24.99 12 2057 78,710 26.13 25.00-29.99 7 1410 57,212 24.65 30.00-34.99 6 1024 27,207 37.64 35.00 & Over 6 837 23,110 36.22
Total 42 7142 276,568 25.82
• Number of persons aged below 15 years per 100 persons of a ll ages.
TABLE 5. Total prevalence as related to demographic factors .
Demographic factors
1. Percentage of male population 2. Percentage of child population 3. Percentage of scheduled castes and tribes 4. Percentage of workers 5. Percentage of literates 6. No. of persons per house 7. No. of persons per household 8. Density of Population
• Statistically significant.
Correlation coefficient
+ 0.0396 + 0.3187° + 0.5213" - 0.1437 - 0.4993" - 0.2553 + 0.0820 - 0.1313
P-value
0.7 < P< .8 0.02< P<.05
P< .OOI 0.3 < P< .4
P< .OOI 0.05< P< .1
·0.5 < P<.6 0.3 < P< .4

168 International Journal of Leprosy 1972
and prevalence rate is r = + 0.5493, which is statistically significant (P < .05 ).
Eight major demographic factors in the general population were examined in rela .. tion to the prevalence rate of leprosy. The factors considered were the percentages of males, of children (child ratio), of castes and tribes, of workers, and of literates, the number of persons per house, the number of persons per household and the number of persons per mile ( population density). The correlation coefficients between total prevalence rate and each one of these factors are given in Table 5.
The percentage of children in the general population has a direct relationship with the prevalence rate (1' = +0.3187, P < .05). Similarly the percentage of castes and tribes has a direct relationship with the prevalence rate (r = + 0.5213, P < .05 ). The percentage of literates is inversely related to the prevalence rate (r = - 0.4993, P < .05 ). All other factors have no significant relationship with the prevalence rate.
Since effective treatment would have arrested or completely cured or resulted ill making the index cases noninfective, the duration of treatment may also be a factor in the variation of prevalence. In our data, the duration of the clinic and the control program in a center and prevalence rate were studied and found to be inversely related ( r = - 0.44, P < .05).
DISCUSSION
International or intranational comparisons on the prevalence of leprosy become difficult unless the studies have been carried out on a uniform basis. The methods of survey for detection of cases play an important role in determining the prevalence rate. Reports on prevalence should therefore be considered in relation to the methods employed before interpreting the variations noticed.
Most countries show wide leprosy prevalence variations between different regions. In Ecuador (4), the prevalence per 1,000 was 0.23 as compared with 0.51 in Cuba (6) and 20.9 in Argentina (1). In Africa, the prevalence rate in the Upper Volta (9)
was 58.4 as compared to 25 per 1,000 in the Manga region ( ]O). In Asia, reports indicate that Ceylon had a prevalence rate of 0.72, Indonesia 0.96, and Burma 30 per 1,000 (15). In India, the reported prevalence rates have shown wi de variations, ranging from 8 per 1,000 in Maharashtra (5) to 35 per 1,000 near Wardha in Andhra Pradesh (14). In the present study, while one-third of the centers have a prevalence rate between 20 to 29 per 1,000 population, the remainder show either low rates or fairly high rates of prevalence. The reasons for these variations could not be entirely related to any geographi c or demographic factor. While studying the history of leprosy in Netherlands, New Guinea, Leiker (1) suggested that the susceptibility of a community determines the pattern of prevalence more than the infectivity of the bacillus or demographic and social factors. In our earlier paper, emphasis was laid on the fact that the age structure determined the total prevalence of leprosy (8). Relationship between the type of 'leprosy and age was also established. The present analysis did not reveal any relationship between density of population and the total prevalence, but the level of literacy was inversely related. Since occupation and literacy are correlated, one may speculate as to whether occupational contacts, apart from intrafamilial contacts, are primarily responsible for the transmission of the disease.
In the present study while all typespecific rates seem to be associated with the total prevalence, the relationship between the lepromatous index and total prevalence showed an inverse relationship to a certain extent. With intensification of the control programs the lepromatous cases are rendered noninfective. However, those persons already infected continue to manifest the disease. Thus there results a continual increase in prevalenee rate for some more time before a decline begins to register. In other words, the impact of a control program may be obvious only after it has been in operation for a certain period of time and when later identified cases are also put under control. Since the early cases were mostly children showing indeterminate type, the detection program contributes to

40, 2 Rao et al. : Prevalence of Leprosy in South India, Part II 169
a higher prevalence rate. Dharmendra and Santra (3), in a study of several provinces of India, found a higher prevalence of leprosy associated with a high lepromatous type rate. On the other hand, Sharma and Prasad (11) reported a low lepromatom rate in a group of villages in Utter Pradesh where the total prevalence was high. Spickett (12) indicated that lepromatous prevalence will b e at its lowest at a timc when total prevalence of the disease reaches its peak.
Barring a few exceptions, the prcvalence was high in hilly areas. Further studics may be needed to identify specific environmental and climatic factors that may be contributing to this phenomenon. The present study indicates that while no single factor is responsible for the high prevalence of leprosy, the domiciliary program can be effective in reducing the magnitude of the problem. Further studies in this area should produce more evidence on the effectiveness of the control programs.
SUMMARY
Even within an endemic area, the prevalence of leprosy varies markedly b etween various geographic segments as shown in the rural areas of Gudiyatham Taluk, South India. The entire taluk was divided into 42 peripheral centers and for each area, the total prevalence as well as the distribution by type of leprosy was determined. The total prevalence per 1,000 population varied from 12 to 126, with a mean of 26. The prevalence was higher, in general, in the hilly areas. While the rates of each typc of leprosy were correlated with the total prevalence rate, a somewhat inverse relationship was shown between the lepromatous index and the total prevalence. Eight major demographic factors were studied in relation to the total prevalence of which only three showed a significant correlation. The literacy rate correlated inversely with the total prevalence. No single factor could be shown to be responsible for these variations in prevalence. The implications of the findings are discussed in the light of effectiveness of leprosy control programs.
RESUMEN
Segun 10 observado en el area rural de Gudiyatham Taluk, India del Sur, aun dentro de un area endemica la prevalencia de lepra varia notablemente entre diferentes segmentos geograficos. Se dividio el Taluk completo en 42 centros perifericos y se determino la prevalencia total y la distribucion POI' tipos de lepra de cada area . La prevalencia total pOI' 1000 habitantes vario entre 12 y 126, con una media de 26. POI' 10 general, la prevalencia fue mas alta en las areas montaiiosas. Aunque las tasas de cada tipo de lepra estaban relacionadas con la tasa total de prevalenci a, se observo una relacion algo inversa entre el Indice de casos lepromatosos y la prevalencia total. Se estudiaron ocho factores demograficos principales en relacion con la prevalencia total , de los cuales sola mente tres mostraron una correlacion significativa. La tasa de alfabetizacion fue inversamente proporcional a la prevalencia total. No se pudo demostrar que hubiera un solo factor aislado que pudiera ser responsable de estas variaciones de la prevalencia. Se discuten las implicaciones de estos hallazgos en rel acion con la efectividad de los programas de control de lepra.
RESUME
Meme a I' interieur d'une region endemique, la prevalence de la lepre varie de fa90n marquee dans les differentes zones . geog raphiques, a insi qu 'en temoignent les observations faites dans Ics regions rurales du Gudiyatham Taluk, en Tnde Meridionale. L'ensemble du Taluk a ete divise en 42 centres peripheriques, et dans chacune des zones, on a determine la prevalence totale, de meme que la distribution par type de lepre. La prevalence totale pour 1.000 personnes a va rie de 12 a 126. avec line moyenne de 26. La prevalence etait plus elevee, en general dans les regions de collines. Lorsqu'on mettait en correlation les taux de chaque type de lepre, avec Ie taux de prevalence totale, on a observe une relation en quelque sorte inverse entre I" index lepromateux et la prevalence totale. Huit facteurs demographiques majeurs ont ete etudies, en relation avec la prevalence totale ; troi s seulement parmi ces facteurs ont montre une correlation significative. Le taux d'alphabetisation temoignait d'une correlat ion negati ve avec la prevalence total e. Aucun facteur unique n'a pu etre mis en evidence, qui soit responsable pour les variations de prevalences observees dans cette etude. Las implications de ces resultats sont discutes en fonction de l'efficacite des programmes de lutte contre la lepre.

170 International Journal of Leprosy 1972
Acknowledgements. This work could not have been undertaken and continued but for the inspiration, encouragement and financia'l support given by the Swedish Red Cross, Stockholm, and its Secretary-General, Mr. Olaf Stroh. Part of the work was supported by a grant from the Department of Health , Education and Welfare, U.S. Government, under PL-480 projects-SRS-IND-32.
This study has been made possible by the devo ted services of the numerous paramedical workers whom we thank. vVe are grateful to the stan' 'O f the Biostatistics Department, Christian Medical College & Hospital, Vellore, for data processing and statistical assistance. We also thank Mr. S. Philip for secretarial services and Mr. E. D. Rajkumar for the art work.
REFERENCES
1. ALTMAN, M. Datos epidemiologicos de la endemia leprosa en Corrientes. [Epidemiologic data on the leprosy endemic in the province of Corrientes (Argentina).] Rev. Argent. Lepro213 ( 1965) 138-143. [Ahstract in Internat. J. Leprosy 34 (1966) 346.]
2. Census of India. Census Handbook. North Arcot District. Volumes I & II, Director of Stationary and Printing, Madras (1966).
3. DnAR}.IENDRA, and SANTJ~A, D. 1. Epidemiological leprosy surveys in various parts of India. Leprosy in India 17 (1945) 2-27.
4. GUTIERHEZ, B. E. EI program a de control de la lepra en el Ecuador. Consideraciones sobre los dos primeros anos de actividades. (Leprosy control program in Ecuador. Comments on the first two years of its activities.) HoI. Ofc. Sanit. Panamer. 62 (1967) 120-131.
5. KAPOOH, P. Epidemiological survey of leprosy in Maharashtra State (India). Leprosy in India 35 (1963) 83-89.
6. LACAHO, D . Epidemiological aspects and control of leprosy in Cuba. [Ahst.ract in Internat. J. Leprosy 37 (1969) 333.]
7. LEIKEH, D. L. Epidemiological and immunological surveys in Netherlands, New Guinea. Leprosy Rev. 31 (1960) 241-259.
8. RAO, P. S. S., KAlIAT, A. B. A., KALlAPEHUMAL, V. G. and KABAT, S. Prevalence of leprosy in Gudiyatham Taluk, South India. Part I. Spec ific rates with reference to age, sex and type. [(1971) Submitted to Internat. J. Leprosy for publication.]
9. SANSAHHlCQ, H. A survey of certain epidemiological and clinical features of leprosy in West Africa (Upper Volta). Prelimin ary results. Med. Trop. 24 (1964) 546-565. [Abstract in Internat. J. Leprosy 33 ( 1965) 920.]
10. SANSAHHlCQ, H., STEEN, E. and SAUVACET,. M. Epidemiological and clinical characteristics of leprosy in the Manga region, Upper Volta, compared with other observations in the same country. Med. Trop. 29 (1969) 208-228. [Abstract in Leprosy Rev. 41 (1970) 193.]
11. SHAHMA, V. K: and PRASAD, B. G. An epidemiological study of leprosy in the Masauli Block of Barabanki District, Utter Pradesh. Indian J. Med. Res. 52 (1964) 1293-1312.
12. SPICKETT, S. G. Genetics and the epidemiology of leprosy. n. The form of leprosy. Leprosy Rev. 33 (1962) 173-181.
13. SUHESH, K. , MANI, R. S., KHlSHNA RAO, A. and MADHAVA RAO, D. Results after five years of intensive leprosy control work in a highly endemic area. Leprosy Rev. 40 (1969) 211-216.
14. W ARDEKAR, R. V. DDS prophylaxis against leprosy. Leprosy in India 39 (1967) 155-159.
15. World Health Organization. Twenty years in Southeast Asia 1948-1967. C. Mani, Regional Director (1967). WHO 71130.