Prevalence of Food Sensitization and Food Allergy in ...
20
Original Article Prevalence of Food Sensitization and Food Allergy in Children Across Europe Sarah A. Lyons, MD a, *, Michael Clausen, MD b, *, André C. Knulst, MD, PhD a , Barbara K. Ballmer-Weber, MD c,d,e , Montserrat Fernandez-Rivas, MD, PhD f , Laura Barreales, MD g , Christian Bieli, MD, PhD h , Ruta Dubakiene, MD, PhD i , Cristina Fernandez-Perez, MD, PhD g , Monika Jedrzejczak-Czechowicz, MD, PhD j , Marek L. Kowalski, MD, PhD j , Tanya Kralimarkova, MD, PhD k , Ischa Kummeling, PhD l , Tihomir B. Mustakov, MD k , Nikolaos G. Papadopoulos, MD, PhD m,n , Todor A. Popov, MD, PhD o , Paraskevi Xepapadaki, MD m , Paco M.J. Welsing, PhD p , James Potts, BSc l , E.N. Clare Mills, PhD q , Ronald van Ree, PhD r , Peter G.J. Burney, MD, PhD l,z , and Thuy-My Le, MD, PhD a,z Utrecht and Amsterdam, The Netherlands; Reykjavik, Iceland; Zürich and St Gallen, Switzerland; Madrid, Spain; Vilnius, Lithuania; Lodz, Poland; Sofia, Bulgaria; London and Manchester, United Kingdom; and Athens, Greece What is already known about this topic? For adults, standardized data collection all across Europe has yielded prevalence estimates of food sensitization (FS) and of food allergy (FA) defined as symptoms plus IgE sensitization, that can be validly compared internationally. For children, such estimates are lacking. What does this article add to our knowledge? Using methodology identical to that in adults, prevalence estimates of FS and FA, respectively ranging from 11.0% to 28.7% and from 1.0% to 5.6%, were found in school-age children across Europe. Both primary and cross-reactive FS and FA occurred frequently at this age. How does this study impact current management guidelines? This study reveals the substantial geographical vari- ation in the prevalence of FS and FA in school-age children across Europe, provides prevalence estimates for 24 commonly implicated foods in multiple countries, and facilitates valuable comparison with adults. a Department of Dermatology and Allergology, University Medical Center Utrecht, Utrecht University, Utrecht, The Netherlands b Children’s Hospital, Landspitali University Hospital, Reykjavik, Iceland c Allergy Unit, Department of Dermatology, University Hospital of Zürich, Zürich, Switzerland d Faculty of Medicine, University of Zürich, Zürich, Switzerland e Clinic for Dermatology and Allergology, Kantonsspital St Gallen, St Gallen, Switzerland f Allergy Department, Hospital Clinico San Carlos, IdISSC, ARADyAL, Madrid, Spain g Servicio de Medicina Preventiva, Epidemiology Unit, Hospital Clinico San Carlos, UCM, IdISSC, Madrid, Spain h Department of Paediatric Pulmonology, University Children’s Hospital, Zürich, Switzerland i Medical Faculty, Vilnius University, Vilnius, Lithuania j Department of Allergy and Immunology, Medical University of Lodz, Lodz, Poland k Clinical Centre of Allergology of the Alexandrovska Hospital, Medical University of Sofia, Sofia, Bulgaria l National Heart and Lung Institute, Imperial College London, London, United Kingdom m Allergy Department, 2nd Pediatric Clinic, University of Athens, Athens, Greece n Division of Infection, Immunity and Respiratory Medicine, Lydia Becker Institute of Immunology and Inflammation, University of Manchester, Manchester, United Kingdom o University Hospital Sv. Ivan Rilski, Sofia, Bulgaria p Division of Internal Medicine and Dermatology, University Medical Center Utrecht, Utrecht, The Netherlands q Division of Infection, Immunity and Respiratory Medicine, Manchester Institute of Biotechnology & Lydia Becker Institute of Immunology and Inflammation, University of Manchester, Manchester, United Kingdom r Department of Experimental Immunology and Department of Otorhinolaryngology, Amsterdam University Medical Centers, AMC, Amsterdam, The Netherlands This work was funded by the European Union through EuroPrevall (grant no. FP6- FOOD-CT-2005-514000). Conflicts of interest: B. K. Ballmer-Weber reports personal fees from Thermo Fisher Scientific. M. Fernandez-Rivas reports grants and personal fees from Aimmune Therapeutics and Diater and personal fees from DBV, Allergy Therapeutics, HAL Allergy, Novartis, Thermo Fisher Scientific, and SPRIM. N. G. Papadopoulos reports personal fees from Novartis, Nutricia, HAL Allergy, Menarini/Faes Farma, Sanofi, Mylan/Meda, Biomay, AstraZeneca, GlaxoSmithKline (GSK), MSD, ASIT Biotech, and Boehringer Ingelheim and grants from Gerolymatos Interna- tional SA and Capricare. P. Xepapadaki reports personal fees from Nutricia, Nestle, Friesland, Uriach, Novartis Pharma AG, and GSK. E. N. C. Mills reports grants from and is shareholder in Reacta Biotech. R. van Ree reports personal fees from HAL Allergy BV, Citeq BV, Angany Inc., and Thermo Fisher Scientific. The rest of the authors declare that they have no relevant conflicts of interest. Received for publication January 8, 2020; revised March 5, 2020; accepted for publication April 6, 2020. Available online April 21, 2020. Corresponding author: Sarah A. Lyons, MD, Department of Dermatology and Allergology, University Medical Centre Utrecht, Heidelberglaan 100, 3584 CX Utrecht, The Netherlands. E-mail: [email protected]. * These authors contributed equally to this work. z These authors contributed equally to this work. 2213-2198 Ó 2020 The Authors. Published by Elsevier Inc. on behalf of the American Academy of Allergy, Asthma & Immunology. This is an open access article under the CC BY-NC-ND license (http://creativecommons.org/licenses/by-nc-nd/4.0/). https://doi.org/10.1016/j.jaip.2020.04.020 2736 Downloaded for Anonymous User (n/a) at Vilnius University from ClinicalKey.com by Elsevier on April 27, 2021. For personal use only. No other uses without permission. Copyright ©2021. Elsevier Inc. All rights reserved.
Transcript of Prevalence of Food Sensitization and Food Allergy in ...

Original Article
Prevalence of Food Sensitization and Food Allergyin Children Across Europe
Sarah A. Lyons, MDa,*, Michael Clausen, MD
b,*, André C. Knulst, MD, PhD
a, Barbara K. Ballmer-Weber, MD
c,d,e,
Montserrat Fernandez-Rivas, MD, PhDf, Laura Barreales, MD
g, Christian Bieli, MD, PhD
h, Ruta Dubakiene, MD, PhD
i,
Cristina Fernandez-Perez, MD, PhDg, Monika Jedrzejczak-Czechowicz, MD, PhD
j, Marek L. Kowalski, MD, PhD
j,
Tanya Kralimarkova, MD, PhDk, Ischa Kummeling, PhD
l, Tihomir B. Mustakov, MD
k,
Nikolaos G. Papadopoulos, MD, PhDm,n
, Todor A. Popov, MD, PhDo, Paraskevi Xepapadaki, MD
m,
Paco M.J. Welsing, PhDp, James Potts, BSc
l, E.N. Clare Mills, PhD
q, Ronald van Ree, PhD
r, Peter G.J. Burney, MD, PhD
l,z,
and Thuy-My Le, MD, PhDa,z Utrecht and Amsterdam, The Netherlands; Reykjavik, Iceland; Zürich and St Gallen, Switzerland;
Madrid, Spain; Vilnius, Lithuania; Lodz, Poland; Sofia, Bulgaria; London and Manchester, United Kingdom; and Athens, Greece
What is already known about this topic? For adults, standardized data collection all across Europe has yieldedprevalence estimates of food sensitization (FS) and of food allergy (FA) defined as symptoms plus IgE sensitization, thatcan be validly compared internationally. For children, such estimates are lacking.
What does this article add to our knowledge? Using methodology identical to that in adults, prevalence estimates of FSand FA, respectively ranging from 11.0% to 28.7% and from 1.0% to 5.6%, were found in school-age children acrossEurope. Both primary and cross-reactive FS and FA occurred frequently at this age.
How does this study impact current management guidelines? This study reveals the substantial geographical vari-ation in the prevalence of FS and FA in school-age children across Europe, provides prevalence estimates for 24commonly implicated foods in multiple countries, and facilitates valuable comparison with adults.
aDepartment of Dermatology and Allergology, University Medical Center Utrecht,Utrecht University, Utrecht, The Netherlands
bChildren’s Hospital, Landspitali University Hospital, Reykjavik, IcelandcAllergy Unit, Department of Dermatology, University Hospital of Zürich, Zürich,Switzerland
dFaculty of Medicine, University of Zürich, Zürich, SwitzerlandeClinic for Dermatology and Allergology, Kantonsspital St Gallen, St Gallen, SwitzerlandfAllergy Department, Hospital Clinico San Carlos, IdISSC, ARADyAL, Madrid,Spain
gServicio de Medicina Preventiva, Epidemiology Unit, Hospital Clinico San Carlos,UCM, IdISSC, Madrid, Spain
hDepartment of Paediatric Pulmonology, University Children’s Hospital, Zürich,Switzerland
iMedical Faculty, Vilnius University, Vilnius, LithuaniajDepartment of Allergy and Immunology, Medical University of Lodz, Lodz, PolandkClinical Centre of Allergology of the Alexandrovska Hospital, Medical Universityof Sofia, Sofia, Bulgaria
lNational Heart and Lung Institute, Imperial College London, London, UnitedKingdom
mAllergy Department, 2nd Pediatric Clinic, University of Athens, Athens, GreecenDivision of Infection, Immunity and Respiratory Medicine, Lydia Becker Instituteof Immunology and Inflammation, University of Manchester, Manchester, UnitedKingdom
oUniversity Hospital Sv. Ivan Rilski, Sofia, BulgariapDivision of Internal Medicine and Dermatology, University Medical Center Utrecht,Utrecht, The Netherlands
qDivision of Infection, Immunity and Respiratory Medicine, Manchester Institute ofBiotechnology & Lydia Becker Institute of Immunology and Inflammation,University of Manchester, Manchester, United Kingdom
rDepartment of Experimental Immunology and Department of Otorhinolaryngology,Amsterdam University Medical Centers, AMC, Amsterdam, The Netherlands
This work was funded by the European Union through EuroPrevall (grant no. FP6-FOOD-CT-2005-514000).
Conflicts of interest: B. K. Ballmer-Weber reports personal fees from Thermo FisherScientific. M. Fernandez-Rivas reports grants and personal fees from AimmuneTherapeutics and Diater and personal fees from DBV, Allergy Therapeutics, HALAllergy, Novartis, Thermo Fisher Scientific, and SPRIM. N. G. Papadopoulosreports personal fees from Novartis, Nutricia, HAL Allergy, Menarini/Faes Farma,Sanofi, Mylan/Meda, Biomay, AstraZeneca, GlaxoSmithKline (GSK), MSD,ASIT Biotech, and Boehringer Ingelheim and grants from Gerolymatos Interna-tional SA and Capricare. P. Xepapadaki reports personal fees from Nutricia,Nestle, Friesland, Uriach, Novartis Pharma AG, and GSK. E. N. C. Mills reportsgrants from and is shareholder in Reacta Biotech. R. van Ree reports personal feesfrom HAL Allergy BV, Citeq BV, Angany Inc., and Thermo Fisher Scientific. Therest of the authors declare that they have no relevant conflicts of interest.
Received for publication January 8, 2020; revised March 5, 2020; accepted forpublication April 6, 2020.
Available online April 21, 2020.Corresponding author: Sarah A. Lyons, MD, Department of Dermatology andAllergology, University Medical Centre Utrecht, Heidelberglaan 100, 3584 CXUtrecht, The Netherlands. E-mail: [email protected].
* These authors contributed equally to this work.z These authors contributed equally to this work.2213-2198� 2020 The Authors. Published by Elsevier Inc. on behalf of the American Academyof Allergy, Asthma & Immunology. This is an open access article under the CCBY-NC-ND license (http://creativecommons.org/licenses/by-nc-nd/4.0/).
https://doi.org/10.1016/j.jaip.2020.04.020
2736
Downloaded for Anonymous User (n/a) at Vilnius University from ClinicalKey.com by Elsevier on April 27, 2021. For personal use only. No other uses without permission. Copyright ©2021. Elsevier Inc. All rights reserved.

J ALLERGY CLIN IMMUNOL PRACTVOLUME 8, NUMBER 8
LYONS ETAL 2737
Abbreviations used
CCD- C ross-reactive carbohydrate determinantDBPCFC- D
ouble-blind placebo-controlled food challenge FA- F ood allergy FS- F ood sensitizationPR-10- P
athogenesis-related protein family 10BACKGROUND: For adults, prevalence estimates of foodsensitization (FS) and food allergy (FA) have been obtained in astandardized manner across Europe. For children, such estimatesare lacking.OBJECTIVES: To determine the prevalence of self-reported FA,FS, probable FA (symptoms plus IgE sensitization), andchallenge-confirmed FA in European school-age children.METHODS: Data on self-reported FA were collected through ascreening questionnaire sent to a random sample of the generalpopulation of 7- to 10-year-old children in 8 European centers inphase I of the EuroPrevall study. Data on FS and probable FAwere obtained in phase II, comprising an extensive questionnaireon reactions to 24 commonly implicated foods, and serologytesting. Food challenge was performed in phase III.RESULTS: Prevalence (95% CI) of self-reported FA ranged from6.5% (5.4-7.6) in Athens to 24.6% (22.8-26.5) in Lodz; prevalenceof FS ranged from 11.0% (9.7-12.3) in Reykjavik to 28.7% (26.9-30.6) in Zurich; and prevalence of probable FA ranged from 1.9%(0.8-3.5) in Reykjavik to 5.6% (3.6-8.1) in Lodz. In all centers,most food-sensitized subjects had primary (nonecross-reactive)FS. However, FS due to birch pollen related cross-reactivity wasalso common in Central-Northern Europe. Probable FA to milkand egg occurred frequently throughout Europe; to fish andshrimp mainly in the Mediterranean and Reykjavik. Peach, kiwi,and peanut were prominent sources of plant FA inmost countries,along with notably hazelnut, apple, carrot, and celery in Central-Northern Europe and lentils and walnut in the Mediterranean.CONCLUSIONS: There are large geograhical differences in theprevalence of FS and FA in school-age children across Europe.Both primary and cross-reactive FS and FA occurfrequently. � 2020 The Authors. Published by Elsevier Inc. onbehalf of the American Academy of Allergy, Asthma & Immu-nology. This is an open access article under the CC BY-NC-NDlicense (http://creativecommons.org/licenses/by-nc-nd/4.0/). (JAllergy Clin Immunol Pract 2020;8:2736-46)
Key words: Food allergy; Food sensitization; Prevalence;Causative foods; Cross-reactivity; Europe; Children
INTRODUCTIONPrevalence of food allergy (FA) in children from European
countries has been evaluated in several studies, using variousstudy designs and outcome definitions. Studies published be-tween 2000 and 2012 reveal estimates ranging from 5.7% to41.8% for lifetime prevalence of self-reported FA, and from1.6% to 24.4% for point prevalence of self-reported FA in 6- to10-year-old European children.1 Point prevalence of foodsensitization (FS), which entails the presence of IgE antibodiesagainst specific foods, and is a prerequisite for IgE-mediatedFA, varies between 4.1% and 52.0% in the same age group.1
The combination of typical clinical symptoms and IgE sensi-tization to the same food, which is required for FA diagnosis, is
Downloaded for Anonymous User (n/a) at Vilnius UniversityFor personal use only. No other uses without permission.
consensually termed probable FA by the European Academy ofAllergy and Clinical Immunology.2 The point prevalence ofprobable FA was found to be 4.6% in children of any age in aGerman study.1,3 Confirmed FA, based on open or double-blind placebo-controlled food challenge (DBPCFC), is re-ported to occur in 0.4% to 4.2% of 6- to 10-year-old childrenin Europe.1
It is clear that reported prevalence estimates vary considerably,even between studies using the same definition of FA in similarage groups. A likely explanation is that there are geographicaldifferences in prevalence and causative foods across Europe.However, the extent of these differences remains unclear due tomethodological heterogeneity among studies conducted indifferent countries (eg, sampling methods and evaluated foods).
In adults, data from the well-standardized pan-EuropeanEuroPrevall project have permitted valid comparisons of FAprevalence estimates in multiple European countries. Analyses ofthese data have revealed the true geographical variation in theprevalence of FA in the European general adult population, andthe foods involved.4,5 Prevalence of self-reported FA in adultswas found to range from around 1.0% to 18.9% for commonlyimplicated foods; prevalence of FS from 6.6% to 23.6%; andprevalence of probable FA from 0.3% to 5.6%, with plant-sourcefoods dominating as causative foods.
In the current study, data collected during the EuroPrevallproject from the general population of 7- to 10-year-old Euro-pean children were evaluated, to provide prevalence estimates ofself-reported FA, FS, probable FA and confirmed FA, and cor-responding symptoms and causative foods. A distinction wasmade between animal- and plant-source foods, because pollen-related cross-reactivity may play a role in the latter.
METHODS
Study design
The 3 phases of the multicenter cross-sectional EuroPrevall studywere described in detail previously.6,7 Briefly, in phase I, a screeningquestionnaire (see “Food Allergy Screening Questionnaire forChildren” in this article’s Online Repository at www.jaci-inpractice.org) was distributed to randomly sampled 7- to 10-year-old children from the general population of Zurich (Switzerland),Madrid (Spain), Athens (Greece), Sofia (Bulgaria), Lodz (Poland),Vilnius (Lithuania), Reykjavik (Iceland), and Utrecht (TheNetherlands). Twenty-four foods commonly incriminated in FA, oroften consumed in participating countries, were deemed so-calledpriority foods: hen’s egg, cow’s milk, fish, shrimp, peanut, hazel-nut, walnut, peach, apple, kiwi, melon, banana, tomato, celery,carrot, corn, lentils, soy, wheat, buckwheat, sesame seed, mustardseed, sunflower seed, and poppy seed. In phase II, respondersreporting symptoms to 1 or more of these priority foods (cases) anda random sample of responders who did not report symptoms to anyof the priority foods (controls) answered a more extensive ques-tionnaire and underwent blood sampling to test for IgE againstpriority foods and common inhalant allergens. In phase III,DBPCFC was offered to subjects with self-reported symptoms andmatching IgE against 1 of 9 priority foods selected for challengetesting (cow’s milk, hen’s egg, fish, shrimp, peanut, hazelnut, apple,peach, and celery).
All participating centers obtained local ethical approval, and allparticipants provided informed consent. All phase I, II, and IIIevaluations were completed between 2007 and 2009, with a median
from ClinicalKey.com by Elsevier on April 27, 2021. Copyright ©2021. Elsevier Inc. All rights reserved.

J ALLERGY CLIN IMMUNOL PRACTSEPTEMBER 2020
2738 LYONS ETAL
time interval of 5 months between phase I and II and 7 monthsbetween phase II and III.
Outcome definitionsThe prevalence of the following FA definitions was explored:
1. Self-reported FA: symptoms ever reported to any food, and to anypriority food.
2. FS: positive IgE serology (IgE � 0.35 kUA/L) for at least 1 of the24 priority foods. FS was considered primary FS if positive IgEserology was not due to cross-reactivity with pollen (see Figure E1in this article’s Online Repository at www.jaci-inpractice.org).Prevalence of primary FS was also established.
3. Probable FA: self-reported FA in combination with matchingpositive IgE serology (IgE � 0.35 kUA/L) for at least 1 of the 24priority foods.
4. Confirmed FA: DBPCFC-confirmed FA to at least 1 of the 9foods selected for challenge testing.
Further information on data collection is described in the“Supplementary Methods on Data Collection” section in this arti-cle’s Online Repository at www.jaci-inpractice.org.
Statistical analysisBased on data from phase I, the prevalence of self-reported FA
was calculated as the percentage of responders reporting symptomsto any food, and to at least 1 priority food.
Data from phase II were used to estimate the prevalence of FS andprobable FA. The percentages of subjects with these outcomes wereweighted back according to the sampling scheme in each center (see“Weighting Procedure Prevalence Calculations” section in this article’sOnline Repository at www.jaci-inpractice.org; also see Figure E2 in thisarticle’s Online Repository at www.jaci-inpractice.org). Only subjectswith available food serology were included. Subjects with discrepanciesin the clinical questionnaires of phase I and II were excluded forcalculation of probable FA (because of uncertainties regarding symp-tomatology), but were included in the study population for the calcu-lation of FS. The Bulgarian site Sofia was excluded from analysis beyondphase I, because very few subjects participated in phase II (only 16 casesand 9 controls) to result in valid prevalence estimations.
Further exploration included examination of cross-reactivity insubjects sensitized to plant-source foods, where a distinction wasmade between subjects with only primary sensitization, likelypathogenesis-related protein family 10 (PR-10) cross-reactivity,likely profilin/cross-reactive carbohydrate determinant (CCD)cross-reactivity, or a combination of such sensitization patterns(Figure E1).
Regarding confirmed FA, phase III data yielded the number andpercentage of subjects challenged with each of the 9 selected foods andthe frequency of positive challenge test results. No prevalence esti-mates could be obtained because of the low number of challenges.
Analyses were conducted with SPSS version 25 (IBM Corpora-tion, Armonk, NY) and R version 3.4.1 (R Core Team, Vienna,Austria).
RESULTS
Phase I—Self-reported FA
As shown in Figure 1, 16,935 subjects (59.2%) responded tothe phase I screening questionnaire. Participating subjects had amean age of 8.9 years, and 50.1% were males.
The prevalence of self-reported FA varied considerably be-tween centers, ranging from 13.1% to 47.5% for any food and
Downloaded for Anonymous User (n/a) at Vilnius UniversityFor personal use only. No other uses without permission.
from 6.5% to 24.6% for priority foods (Figure 2, A and B).Prevalence was lowest in Athens, and notably high in Vilnius andLodz.
The priority foods most commonly reported for self-reportedFA in the overall population were cow’s milk (20.3%), hen’s egg(9.9%), tomato (5.2%), fish (3.6%), kiwi (2.9%), apple (2.1%),peanut (1.9%), wheat (1.7%), carrot (1.1%), and banana(1.1%). Self-reported FA to nonpriority foods, of which choco-late (13.0%), strawberry (5.8%), and orange (4.4%) were mostoften specified as causative foods, was particularly common inVilnius and Lodz.
In both subjects with self-reported FA to any food and self-reported FA to priority foods, skin symptoms (61.6% and70.2%, respectively) and gastrointestinal symptoms (39.5%and 37.3%, respectively) were reported most frequently(Table I). Notably, oral allergy symptoms, which are generallythe first symptoms subjects with an IgE-mediated FA experi-ence,8,9 were only rarely reported in relation to self-reportedFA in North-Eastern Europe (Vilnius, Lodz), that is, 5.8%to 6.5% for any food compared with 16.3% on average overall centers, and 8.1% to 9.2% for priority foods comparedwith 23.4% on average.
Phase II—FSPrevalence of FS was estimated through evaluation of 2196
subjects with available food serology participating in phase II.Figure 2, C, shows that prevalence estimates of FS ranged
from 11.0% in Reykjavik to 28.7% in Zurich. Although prev-alence estimates for each specific food varied substantially be-tween centers, there was considerable overlap in the mostcommon causative foods, as seen in Figure 3. The foods mostfrequently causing FS in the different centers included animal-source foods cow’s milk and hen’s egg and plant-source foodsbanana, wheat, hazelnut, apple, peach, kiwi, tomato, celery,carrot, sesame seed, and peanut. Prevalence estimates of FS for allpriority foods are available in Table E1 in this article’s OnlineRepository at www.jaci-inpractice.org. Fish was one of the leastcommon sensitizers in all countries.
Prevalence of primary FS to all food types (both animal-and plant-source) in the total study population rangedfrom 8.6% in Reykjavik to 21.7% in Madrid (Table E1).On the basis of component-resolved diagnostics (Figure E1),most food-sensitized children in all centers had primary FS(78.7% of those sensitized), with the highest percentage inAthens (92.5%), followed by Madrid (85.4%), Reykjavik(84.4%), Vilnius (83.3%), Utrecht (76.2%), Lodz (74.4%),and Zurich (67.7%). Relatively, animal-source FS was mostcommon in Athens (70.0% of those sensitized) and Reykjavik(60.9%), and least common in Madrid (48.8%) and Zurich(44.1%).
Focusing on subjects with plant-source FS, 63.2% of subjectshad primary plant-source FS, 40.9% plant-source FS based onPR-10 cross-reactivity, and 28.5% plant-source FS based onprofilin or CCD cross-reactivity. Figure 4 shows the overlapbetween primary plant-source FS and cross-reactive plant-sourceFS per center. Primary plant-source FS was most common inMadrid and Athens, PR-10 cross-reactivity occurred mostfrequently in Utrecht, Zurich, Lodz, and Vilnius, and profilin orCCD cross-reactivity occurred in 21.7% to 32.5% of plant-source food sensitized subjects in all centers.
from ClinicalKey.com by Elsevier on April 27, 2021. Copyright ©2021. Elsevier Inc. All rights reserved.

FIGURE 1. Flowchart. Case: subject self-reporting symptoms to at least 1 priority food; Control: subject not reporting symptoms to anypriority food; New case: subjects who reported symptoms to priority foods in phase II, but symptoms to only nonpriority foods in phase I,most likely due to the maximum of 3 foods that could be reported in phase I (see “Food Allergy Screening Questionnaire for Children” inthis article’s Online Repository). *Sofia was excluded from calculation of probable FA prevalence because of lack of cases participating inphase I. **Probable FA to cow’s milk, hen’s egg, fish, shrimp, peanut, hazelnut, apple, peach, or celery. PFA, Probable food allergy.
J ALLERGY CLIN IMMUNOL PRACTVOLUME 8, NUMBER 8
LYONS ETAL 2739
Downloaded for Anonymous User (n/a) at Vilnius University from ClinicalKey.com by Elsevier on April 27, 2021. For personal use only. No other uses without permission. Copyright ©2021. Elsevier Inc. All rights reserved.

FIGURE 2. Prevalence of probable FA vs prevalence of self-reported FA and FS. (A) Self-reported allergy to any food. (B) Self-reportedallergy to at least 1 priority food. (C) IgE sensitization to at least 1 priority food. (D) Probable FA to at least 1 priority food.
J ALLERGY CLIN IMMUNOL PRACTSEPTEMBER 2020
2740 LYONS ETAL
Downloaded for Anonymous User (n/a) at Vilnius University from ClinicalKey.com by Elsevier on April 27, 2021. For personal use only. No other uses without permission. Copyright ©2021. Elsevier Inc. All rights reserved.

TABLE I. Reported symptoms for self-reported and probable FA
Characteristics and symptoms
Self-reported FA
to any food
(N [ 4265)
Self-reported FA
to priority food
(N [ 2019)
Probable FA to
priority food
(N [ 136)
Age (y), mean � SD 8.89 � 1.01 8.85 � 1.01 9.02 � 0.99
Male sex 2116 (49.7) 1014 (50.3) 68 (50.0)
Oral allergy symptoms 631 (16.3) 438 (23.4) 75 (56.0)
Isolated oral allergy symptoms 122 (3.2) 89 (4.7) 7 (5.2)
Skin symptoms 2456 (61.6) 1344 (70.2) 108 (80.6)
Rhinoconjunctivitis 959 (24.7) 534 (28.6) 55 (42.0)
Gastrointestinal symptoms 1567 (39.5) 711 (37.3) 38 (29.5)
Difficulty swallowing 200 (5.2) 110 (5.9) 25 (19.2)
Respiratory symptoms 290 (7.5) 186 (10.0) 27 (20.8)
Cardiovascular symptoms 111 (2.9) 48 (2.6) 6 (4.6)
Other symptoms 1224 (31.4) 624 (33.4) 48 (37.2)
Lifetime frequency of reactions
1� 986 (24.4) 276 (14.1) 12 (9.1)
2-4� 1315 (32.6) 540 (27.6) 38 (28.8)
>4� 1738 (43.0) 1137 (58.2) 82 (62.1)
Previous doctor diagnosis of FA 1671 (40.2) 1128 (56.9) 94 (70.1)
Values are n (%) unless otherwise indicated.Oral allergy symptoms: itching/tingling/swelling of the mouth/lips/throat; Skin symptoms: rash/nettle sting/itchy skin; Rhinoconjunctivitis: runny/stuffy nose or red/sore/running eyes; Gastrointestinal symptoms: diarrhea/vomiting; Respiratory symptoms: breathlessness; Cardiovascular symptoms: fainting/dizziness; Other: stiffness in joints orheadaches or other symptoms.
J ALLERGY CLIN IMMUNOL PRACTVOLUME 8, NUMBER 8
LYONS ETAL 2741
Phase II—Probable FA
Prevalence of probable FA was determined using the 670 caseswith available food serology participating in phase II (Figure 1).
Overall, matching food serology was found in 17.2% of allself-reported FAs (see Table E2 in this article’s Online Re-pository at www.jaci-inpractice.org). Probable FA to at least 1priority food was established in 136 subjects. The prevalence ofprobable FA was much lower than the prevalence of self-reportedFA and of FS, and was found to range from 1.9% in Reykjavik,to 2.0% in Athens, 2.3% in Zurich, 3.0% in Utrecht and Vil-nius, 3.9% in Madrid, and 5.6% in Lodz (Figure 2, D).
Cow’s milk, hen’s egg, hazelnut, walnut, peanut, lentil, apple,peach, kiwi, banana, carrot, and celery were among the foods mostoften causing probable FA in the participating centers (Figure 5).Probable FA to cow’s milk or to hen’s egg was relatively commonin all centers besides Zurich, where these 2 causative foods werenot observed. Hazelnut, apple, carrot, and celery probable FAswere prominent in Central and Northern Europe (Zurich,Utrecht, Lodz, and Vilnius). Peach and kiwi were importantcausative foods in most countries, but were particularly dominantinMadrid. Probable FA to peanut was observed everywhere exceptVilnius, and made the top 3 in Madrid and Reykjavik. In Athens,unique top causative foods were found compared with the rest ofEurope, with walnut, lentils, and banana as some of the mostcommon elicitors. Shrimp and fish were important causes ofprobable FA in Madrid (shrimp and fish), Athens (fish), andReykjavik (shrimp and fish), but not in the rest of Europe.
Regarding symptoms, skin symptoms (80.6%) and oral allergysymptoms (56.0%) were most frequently reported by subjects withprobable FA (Table I). Skin, oral allergy, rhinoconjunctivitis,laryngeal, respiratory, and cardiovascular symptoms were reportedmore often, and reactions occurredmore frequently, in subjects withprobable FA than in subjects with self-reported FA. Gastrointestinalsymptoms were less common in subjects with probable FA.
Downloaded for Anonymous User (n/a) at Vilnius UniversityFor personal use only. No other uses without permission.
Phase III—Confirmed FA
DBPCFC was performed in 18 subjects (Figure 1). Table IIpresents the results from challenge testing. Most challengeswere performed with shrimp, peanut, hazelnut, and apple (N ¼3 for each food). Overall, 7 of the challenges (38.9%) werepositive, 6 (33.3%) negative, and 5 (27.8%) subjects were pla-cebo reactors. The number of challenges performed was too smallto obtain reliable values for prevalence of confirmed FA andcorresponding symptomatology.
DISCUSSION
Summary of findingsThe present study reviews the largest available data collection
on FA and FS in European school-age children from the generalpopulation. It is the first to provide prevalence estimates obtainedby uniform methods from socially and climatically varied regionsall across Europe. Apparently, 6.5% to 24.6% of 7- to 10-year-old children across Europe report symptoms to at least 1 of 24foods often implicated in FA (priority foods). A remarkable11.0% to 28.7% of 7- to 10-year-old children are IgE-sensitizedto at least 1 such food. The frequency with which symptoms andIgE sensitization coincide (ie, probable FA) is considerably lower,but still impressive at 1.9% to 5.6%. Cow’s milk, hen’s egg,hazelnut, walnut, peanut, lentil, apple, peach, kiwi, banana,carrot, and celery were top causative foods for probable FA in theparticipating countries.
Self-reported FAWith lifetime prevalence estimates of self-reported FA ranging
from 13.1% to 45.6% for any food and from 6.5% to 24.6% forpriority foods, the current study reveals considerable variationdue to geographical location and evaluated foods. The wide rangeis similar to the 5.7% to 41.8% determined in a systematic re-view of European studies including children aged 6 to 10 years.1
from ClinicalKey.com by Elsevier on April 27, 2021. Copyright ©2021. Elsevier Inc. All rights reserved.

FIGURE 3. FS across Europe. This figure displays the prevalence of FS for each priority food in each center, and the upper limit of the 95%CIs. For numeric prevalence estimates of FS, view Table E1 in this article's Online Repository at www.jaci-inpractice.org. Foods are sortedaccording to food group. The birch-endemic centers are displayed in the top row.
J ALLERGY CLIN IMMUNOL PRACTSEPTEMBER 2020
2742 LYONS ETAL
Also comparable between our study and previous literature isthat lifetime prevalence of self-reported FA in children appearshighest in North-Eastern Europe (Lithuania, Poland) and lowestin South-Eastern Europe (Greece, Turkey)1; that, overall, cow’smilk, fruits, and hen’s egg are the most commonly reportedfoods10; and that skin-related and gastrointestinal symptoms arereported most frequently.10
Compared with other countries, North-Eastern Europeancountries were found to have particularly high occurrence ofself-reported FA to foods not selected as priority foods. Closerinspection of the data revealed that the nonpriority foods mostoften specified to cause FA were foods with suggestedhistamine-releasing capacities, such as chocolate, strawberry,and orange.11
Food sensitizationRegarding FS in school-age children, the standardized
approach in the current study likely allowed us to obtain morehomogeneous prevalence estimates from different European re-gions than a previous systematic review: 11.0% to 28.7%compared with 4.1% to 52.0%.1 The observed FS patterns inour study correspond with transition from early childhood toadulthood FS patterns. On one hand, cow’s milk and hen’s eggsensitization, sources of FA most common in young children,1
Downloaded for Anonymous User (n/a) at Vilnius UniversityFor personal use only. No other uses without permission.
were some of the most prevalent causes of FS in the 7- to 10-year-old children in the current study. On the other hand,nonprimary FS based on cross-reactivity with pollen, which is thedominant source of FS in European adults, was also prominentin this age group (see Figure E3 in this article’s Online Re-pository at www.jaci-inpractice.org).4,5
Especially the major PR-10 protein in birch pollen, Bet v 1,is renowned for cross-reacting with certain food allergens intree nuts, Rosacea fruits, and Apiaceae vegetables.12,13 PR-10cross-reactivity likely explains why hazelnut, apple, peach,kiwi, carrot, and celery were some of the most commonsensitizing foods in the birch-endemic countries, Switzerland,the Netherlands, Poland, and Lithuania. PR-10 sensitizationwas found in 47.8% to 52.2% of plant-source food-sensitizedchildren in these countries. In Greece and Spain, only 7.7%and 14.9% of plant-source food sensitized subjects had PR-10sensitization. Sensitization to plant-source foods such as peach,apple, and kiwi in the Mediterranean is more likely due toprimary sensitization, and partly through lipid transferprotein.12,13
FS based on cross-reactivity with profilin or CCD proteincomponents in pollen (in birch, but also grass, mugwort, andParietaria) was found in 21.7% to 32.5% of food-sensitizedsubjects. Such cross-reactivity with profilin/CCD goes some
from ClinicalKey.com by Elsevier on April 27, 2021. Copyright ©2021. Elsevier Inc. All rights reserved.

FIGURE 4. Plant-source FS: primary sensitization and cross-reactivity in children. For classification of primary sensitization, PR-10, CCD,and profilin cross-reactivity, view Figure E1. Only subjects with sensitization to plant-source foods are included in this figure.
J ALLERGY CLIN IMMUNOL PRACTVOLUME 8, NUMBER 8
LYONS ETAL 2743
way toward explaining the high levels of banana and wheatsensitization throughout Europe. Of subjects with FS to bananaand wheat, respectively 77% and 92% were sensitized to grass,mugwort, Parietaria, or Bet v 2. Profilin and CCD are known tocause broader cross-reactivity than PR-10 proteins with plant-source foods,14 but FS through profilin does not correspondwith symptoms as consistently as FS through PR-10 protein, andCCD sensitization is generally thought to be clinically irrele-vant.15,16 This could help explain the low levels of probable FAto banana and wheat, in contrast to the high levels of FS.
Probable FAIn fact, most food-sensitized subjects did not have con-
current symptoms, and most subjects with self-reported FAappeared not to have an IgE-mediated FA (as viewed inTable E2). Overall, 1.9% to 5.6% of children across Europewere found to have a probable FA. We identified only 1previous study providing a prevalence estimate for probableFA, defined as symptoms and matching IgE sensitization, in 1
Downloaded for Anonymous User (n/a) at Vilnius UniversityFor personal use only. No other uses without permission.
country: 4.6% in 0- to 17-year old children from an unse-lected pediatric population in Germany.1,3 This lack of evi-dence is rather surprising, because the prevalence of probableFA is a key prevalence estimate in FA epidemiology. Becausepatients in daily practice tend to decline the time-consumingand burdensome criterion standard of diagnostic testing, oralfood challenge, probable FA is often the best attainable endpoint. This was clearly observed in our study, where too fewsubjects agreed to undergo DBPCFC to reliably determine theprevalence of challenge-confirmed FA.
Some notably common causes of probable FA were cow’smilk, hen’s egg, hazelnut, peanut, apple, peach, kiwi, and carrot.Birch pollenerelated FA can explain the high prevalence ofhazelnut, apple, peach, kiwi, and carrot probable FA in countriessuch as Switzerland, the Netherlands, Poland, and Lithuania. Inthe countries where birch pollen is not a key source of FA(Greece, Spain, and Iceland), animal-source foods and otherplant-source foods appear higher up in the hierarchy of foodsmost commonly causing probable FA. The low prevalence of
from ClinicalKey.com by Elsevier on April 27, 2021. Copyright ©2021. Elsevier Inc. All rights reserved.

FIGURE 5. Probable FA across Europe. This figure displays the prevalence of probable FA for each priority food in each center, and theupper limit of the 95%CIs. For numeric prevalence estimates of probable FA, view Table E3 in this article’s Online Repository at www.jaci-inpractice.org. Foods are sorted according to food group. The birch endemic centers are displayed in the top row.
TABLE II. Challenge-confirmed FA
Food No. of challenges* Reactive Tolerant Placebo reactive
Cow’s milk 2 0 2 0
Hen’s egg 1 1 0 0
Fish 1 0 1 0
Shrimp 3 1 0 2
Peanut 3 2 0 1
Hazelnut 3 2 1 0
Apple 3 0 1 2
Peach 2 1 1 0
Celery 0 0 0 0
Total 18 7 6 5
*Three subjects were challenged in Zurich, 1 in Madrid, 1 in Athens, 5 in Utrecht, 1in Lodz, 7 in Reykjavik, 0 in Vilnius. No challenges were performed with celery.None of the subjects underwent more than 1 challenge.
J ALLERGY CLIN IMMUNOL PRACTSEPTEMBER 2020
2744 LYONS ETAL
cow’s milk and hen’s egg probable FA in Switzerland was aremarkable finding for which no clear explanation is apparent.
Interestingly, fish and shrimp were the least common sensi-tizing foods across Europe, but they were definitely not the leastcommon causes of probable FA. In literature, fish and shellfishare 2 of the 8 foods suggested to cause most food-allergic re-actions.17 Apparently, subjects with fish and shrimp sensitizationare likely to have concurrent symptoms. Fish and shrimp wereamong the top foods causing probable FA in Spain, Greece (forfish), and Iceland. This observation suggests that levels ofexposure and frequency of consumption may increase the like-lihood of probable FA for certain foods, because seafood con-sumption is highest in Southern and Northern Europe.18
Comparison to adultsThe EuroPrevall population study was also conducted in 20-
to 54-year-old adults during the same time period, in which thesame study design was applied,6 and the same food and outcomemeasures were investigated.4,5
One of the major differences between children and adults isobserved on comparison of Figure 4 and Figure E3, which showpatterns of cross-reactivity in respectively children and adultssensitized to plant-source foods. Where primary FS explains
Downloaded for Anonymous User (n/a) at Vilnius UniversityFor personal use only. No other uses without permission.
most plant-source FS in children, plant-source FS due tocross-reactivity dominates in adults, mainly due to birch pollencross-reactivity in Switzerland, the Netherlands, and Poland.
Despite the relatively more frequent occurrence of cross-reactive FS in adults, overall FS was more prevalent in children
from ClinicalKey.com by Elsevier on April 27, 2021. Copyright ©2021. Elsevier Inc. All rights reserved.

J ALLERGY CLIN IMMUNOL PRACTVOLUME 8, NUMBER 8
LYONS ETAL 2745
than in adults in all countries where both pediatric and adultpopulations were evaluated (Switzerland, the Netherlands, Spain,Poland, and Iceland). The prevalence of probable FA, however,was lower in children than in adults in Switzerland, theNetherlands, and Spain (>1.5% lower), and similar betweenchildren and adults in Poland, Iceland, and Greece (<1%difference).5
Although the high prevalence estimates of FS compared withprobable FA in children may be influenced by high nonresponserates, a more likely explanation is an increase in the prevalence ofFS over time,19-21 without a parallel increase in symptoms. Thistheory is supported by recent analyses of longitudinal data fromthe Isle of Wight Birth Cohort study, where the temporal rise inthe prevalence of FS was found to be much more prominent thanthe rise in the prevalence of FA in children followed from infancyto age 18 years.22
Why the prevalence of probable FA is lower in children thanin adults in some countries, and not in others, is likely related tothe geographical differences in pollen exposure, which plays arole in the prevalence of cross-reactive FS and associated FA(Figures 4 and E3). Both birch pollene and profilin-related FAoccur regularly in adults,12,13,23,24 and the gap between thepercentages of children and of adults demonstrating cross-reactivity with these allergens in Zurich (birch), Utrecht(birch), and Madrid (profilin) may partly explain why probableFA is more common in adults than in children in these countriesin particular.
Strengths and limitationsAs discussed, a limitation of the present study was the large
number of subjects refusing participation in phase III, whichprevented acquisition of prevalence estimates for challenge-confirmed FA. It is also important to be aware that the trueprevalence estimates of probable FA are likely lower than foundin this study. In adults, multiple imputation of missing data fromnonresponders in phase II revealed that complete case analysisoverestimates the prevalence of probable FA, because subjectswith FA were more likely to participate in the study.5 A similarselection bias in our pediatric population cannot be ruled out.Multiple imputation was deemed infeasible because of the highproportion of missing data, and a complete case analysis waspreferred. Findings in adults suggest that prevalence estimates ofprobable FA to any priority food, when all nonresponders areincluded, are 1.5 to 5.5 times lower. For comparison of preva-lence estimates in children and adults, unimputed data were usedin both cohorts. One should further note that the prevalence ofFS and of probable FA focused on 24 foods commonly impli-cated in FA or frequently consumed in participating countries,and nonpriority foods were not taken into account.
All in all, however, the data analyzed for this study aredecidedly unique. They are the only pan-European data on FAever collected according to the same predetermined protocol in alarge sample of school-age children from the general population,making valid geographical comparisons possible for the first time.Furthermore, we were able to explore the prevalence of primaryFS and cross-reactivity in the general population, and providepreviously lacking prevalence estimates of probable FA, a valu-able prevalence estimate for daily practice. Finally, because thesame study design was applied in adults, the prevalence estimates
Downloaded for Anonymous User (n/a) at Vilnius UniversityFor personal use only. No other uses without permission.
for children can be compared with those previously published foradults.5
CONCLUSIONS
A remarkable percentage of 7- to 10-year-old children acrossEurope appear to be food sensitized, and to a somewhat lesserextent food allergic. Primary and cross-reactive FS, both of whichappear clinically relevant in this pediatric age group, occur tovarying degrees throughout Europe. Although cow’s milk andhen’s egg were found to be common causes of probable FA inmost countries, the occurrence of reactions to various plant-source foods and seafood depends on geographical location,and is clearly related to pollen and, likely, food exposure.
REFERENCES
1. Nwaru BI, Hickstein L, Panesar SS, Muraro A, Werfel T, Cardona V, et al. Theepidemiology of food allergy in Europe: a systematic review and meta-analysis.Allergy 2014;69:62-75.
2. Muraro A, Werfel T, Hoffmann-Sommergruber K, Roberts G, Beyer K, Bind-slev-Jensen C, et al. EAACI food allergy and anaphylaxis guidelines: diagnosisand management of food allergy. Allergy 2014;69:1008-25.
3. Roehr CC, Edenharter G, Reimann S, Ehlers I, Worm M, Zuberbier T, et al.Food allergy and non-allergic food hypersensitivity in children and adolescents.Clin Exp Allergy 2004;34:1534-41.
4. Burney PG, Potts J, Kummeling I, Mills EN, Clausen M, Dubakiene R, et al.The prevalence and distribution of food sensitization in European adults. Al-lergy 2014;69:365-71.
5. Lyons SA, Burney PGJ, Ballmer-Weber BK, Fernandez-Rivas M,Barreales L, Clausen M, et al. Food allergy in adults: substantial variation inprevalence and causative foods across Europe. J Allergy Clin Immunol Pract2019;7:1920-8.
6. Kummeling I, Mills EN, Clausen M, Dubakiene R, Perez CF, Fernandez-Rivas M, et al. The EuroPrevall surveys on the prevalence of food allergies inchildren and adults: background and study methodology. Allergy 2009;64:1493-7.
7. Fernandez-Rivas M, Barreales L, Mackie AR, Fritsche P, Vazquez-Cortes S, Jedrzejczak-Czechowicz M, et al. The EuroPrevall outpatientclinic study on food allergy: background and methodology. Allergy 2015;70:576-84.
8. Amlot PL, Kemeny DM, Zachary C, Parkes P, Lessof MH. Oral allergy syn-drome (OAS): symptoms of IgE-mediated hypersensitivity to foods. Clin Al-lergy 1987;17:33-42.
9. Turner PJ, Baumert JL, Beyer K, Boyle RJ, Chan CH, Clark AT, et al. Can weidentify patients at risk of life-threatening allergic reactions to food? Allergy2016;71:1241-55.
10. Steinke M, Fiocchi A, Kirchlechner V, Ballmer-Weber B, Brockow K,Hischenhuber C, et al. Perceived food allergy in children in 10 European na-tions: a randomised telephone survey. Int Arch Allergy Immunol 2007;143:290-5.
11. Maintz L, Novak N. Histamine and histamine intolerance. Am J Clin Nutr 2007;85:1185-96.
12. Werfel T, Asero R, Ballmer-Weber BK, Beyer K, Enrique E, Knulst AC, et al.Position paper of the EAACI: food allergy due to immunological cross-reactionswith common inhalant allergens. Allergy 2015;70:1079-90.
13. Hofmann A, Burks AW. Pollen food syndrome: update on the allergens. CurrAllergy Asthma Rep 2008;8:413-7.
14. Wensing M, Akkerdaas JH, van Leeuwen WA, Stapel SO, Bruijnzeel-Koomen CA, Aalberse RC, et al. IgE to Bet v 1 and profilin: cross-reactivity patterns and clinical relevance. J Allergy Clin Immunol 2002;110:435-42.
15. Hauser M, Roulias A, Ferreira F, Egger M. Panallergens and their impact on theallergic patient. Allergy Asthma Clin Immunol 2010;6:1.
16. McKenna OE, Asam C, Araujo GR, Roulias A, Goulart LR, Ferreira F. Howrelevant is panallergen sensitization in the development of allergies? PediatrAllergy Immunol 2016;27:560-8.
17. Allen KJ, Koplin JJ. The epidemiology of IgE-mediated food allergy andanaphylaxis. Immunol Allergy Clin North Am 2012;32:35-50.
from ClinicalKey.com by Elsevier on April 27, 2021. Copyright ©2021. Elsevier Inc. All rights reserved.

J ALLERGY CLIN IMMUNOL PRACTSEPTEMBER 2020
2746 LYONS ETAL
18. European Market Observatory for Fisheries and Aquaculture Products.EU consumer habits regarding fishery and aquaculture products: final report.2017. Available from: https://www.eumofa.eu/documents/20178/84590/EUþconsumerþhabits_finalþreportþ.pdf/5c61348d-a69c-449e-a606-f5615a3a7e4c. Accessed July 15, 2019.
19. Ezendam J, Klis VDFR, Loveren VH. Time trends in prevalence of sensitizationto milk, egg and peanut in the Netherlands. Report Number 340350003. Bilt-hoven, The Netherlands: National Institute for Public Health and the Environ-ment of the Netherlands; 2009.
20. Ronmark E, Bjerg A, Perzanowski M, Platts-Mills T, Lundback B. Major in-crease in allergic sensitization in schoolchildren from 1996 to 2006 in northernSweden. J Allergy Clin Immunol 2009;124:357-63.e1-15.
Downloaded for Anonymous User (n/a) at Vilnius UniversityFor personal use only. No other uses without permission.
21. Koet LBM, Brand PLP. Increase in atopic sensitization rate among Dutchchildren with symptoms of allergic disease between 1994 and 2014. PediatrAllergy Immunol 2018;29:78-83.
22. Venkataraman D, Erlewyn-Lajeunesse M, Kurukulaaratchy RJ, Potter S,Roberts G, Matthews S, et al. Prevalence and longitudinal trends of food allergyduring childhood and adolescence: results of the Isle of Wight Birth Cohortstudy. Clin Exp Allergy 2018;48:394-402.
23. Santos A, Van Ree R. Profilins: mimickers of allergy or relevant allergens? IntArch Allergy Immunol 2011;155:191-204.
24. Rodriguez Del Rio P, Diaz-Perales A, Sanchez-Garcia S, Escudero C,Ibanez MD, Mendez-Brea P, et al. Profilin, a change in the paradigm. J InvestigAllergol Clin Immunol 2018;28:1-12.
from ClinicalKey.com by Elsevier on April 27, 2021. Copyright ©2021. Elsevier Inc. All rights reserved.

J ALLERGY CLIN IMMUNOL PRACTVOLUME 8, NUMBER 8
LYONS ETAL 2746.e1
ONLINE REPOSITORY
FIGURE E1. Classification of FS into primary sensitization and cross-reactive sensitization. Subjects were classified into 1 or more of theboxes depending on their sensitization patterns (ie, subjects could have both primary and cross-reactive sensitization). This is a simplifiedclassification, designed for exploratory purposes, and subjects with cross-reactive sensitization through food rather than pollen, or withcross-reactive sensitization to tropomyosins (eg, shrimp through house-dust mite), have been classified as primary sensitization. How-ever, aforementioned cross-reactivity patterns are much less common than pollen-related cross-reactivity, and are expected to have onlylimited influence on the prevalence estimates of primary FS. Green: Primary sensitization (¼ definite, or undefined but likely primarysensitization). Orange: cross-reactive sensitization.
Downloaded for Anonymous User (n/a) at Vilnius University from ClinicalKey.com by Elsevier on April 27, 2021. For personal use only. No other uses without permission. Copyright ©2021. Elsevier Inc. All rights reserved.

FIGURE E2. Flowcharts for (A) Zurich, (B) Madrid, (C) Athens, (D) Utrecht, (E) Lodz, (F) Vilnius, (G) Reykjavik, and (H) Sofia. Case: subjectself-reporting symptoms to at least 1 priority food; Control: subject not reporting symptoms to any priority food; New case: subjects whoreported symptoms to priority foods in phase II, but symptoms only to nonpriority foods in phase I, most likely due to the maximum of 3foods that could be reported in phase I (see “Food Allergy Screening Questionnaire for Children” in this article’s Online Repository atwww.jaci-inpractice.org.). PFA, Probable food allergy.
J ALLERGY CLIN IMMUNOL PRACTSEPTEMBER 2020
2746.e2 LYONS ETAL
Downloaded for Anonymous User (n/a) at Vilnius University from ClinicalKey.com by Elsevier on April 27, 2021. For personal use only. No other uses without permission. Copyright ©2021. Elsevier Inc. All rights reserved.

FIGURE E2. (CONTINUED).
J ALLERGY CLIN IMMUNOL PRACTVOLUME 8, NUMBER 8
LYONS ETAL 2746.e3
Downloaded for Anonymous User (n/a) at Vilnius University from ClinicalKey.com by Elsevier on April 27, 2021. For personal use only. No other uses without permission. Copyright ©2021. Elsevier Inc. All rights reserved.

FIGURE E2. (CONTINUED).
J ALLERGY CLIN IMMUNOL PRACTSEPTEMBER 2020
2746.e4 LYONS ETAL
Downloaded for Anonymous User (n/a) at Vilnius University from ClinicalKey.com by Elsevier on April 27, 2021. For personal use only. No other uses without permission. Copyright ©2021. Elsevier Inc. All rights reserved.

FIGURE E2. (CONTINUED).
J ALLERGY CLIN IMMUNOL PRACTVOLUME 8, NUMBER 8
LYONS ETAL 2746.e5
Downloaded for Anonymous User (n/a) at Vilnius University from ClinicalKey.com by Elsevier on April 27, 2021. For personal use only. No other uses without permission. Copyright ©2021. Elsevier Inc. All rights reserved.

FIGURE E3. Plant FS: primary sensitization and cross-reactivity in adults. For classification of primary sensitization, PR-10, CCD, andprofilin cross-reactivity, view Figure E1.
J ALLERGY CLIN IMMUNOL PRACTSEPTEMBER 2020
2746.e6 LYONS ETAL
Downloaded for Anonymous User (n/a) at Vilnius University from ClinicalKey.com by Elsevier on April 27, 2021. For personal use only. No other uses without permission. Copyright ©2021. Elsevier Inc. All rights reserved.
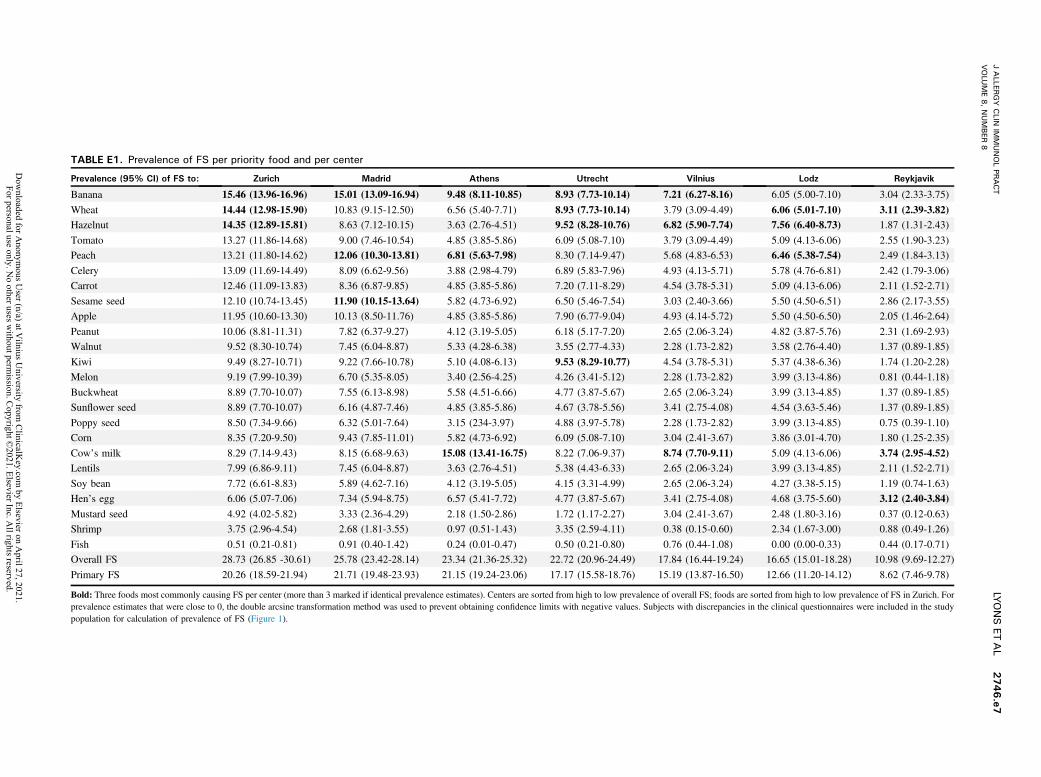
TABLE E1. Prevalence of FS per priority food and per center
Prevalence (95% CI) of FS to: Zurich Madrid Athens Utrecht Vilnius Lodz Reykjavik
Banana 15.46 (13.96-16.96) 15.01 (13.09-16.94) 9.48 (8.11-10.85) 8.93 (7.73-10.14) 7.21 (6.27-8.16) 6.05 (5.00-7.10) 3.04 (2.33-3.75)
Wheat 14.44 (12.98-15.90) 10.83 (9.15-12.50) 6.56 (5.40-7.71) 8.93 (7.73-10.14) 3.79 (3.09-4.49) 6.06 (5.01-7.10) 3.11 (2.39-3.82)Hazelnut 14.35 (12.89-15.81) 8.63 (7.12-10.15) 3.63 (2.76-4.51) 9.52 (8.28-10.76) 6.82 (5.90-7.74) 7.56 (6.40-8.73) 1.87 (1.31-2.43)
Tomato 13.27 (11.86-14.68) 9.00 (7.46-10.54) 4.85 (3.85-5.86) 6.09 (5.08-7.10) 3.79 (3.09-4.49) 5.09 (4.13-6.06) 2.55 (1.90-3.23)
Peach 13.21 (11.80-14.62) 12.06 (10.30-13.81) 6.81 (5.63-7.98) 8.30 (7.14-9.47) 5.68 (4.83-6.53) 6.46 (5.38-7.54) 2.49 (1.84-3.13)
Celery 13.09 (11.69-14.49) 8.09 (6.62-9.56) 3.88 (2.98-4.79) 6.89 (5.83-7.96) 4.93 (4.13-5.71) 5.78 (4.76-6.81) 2.42 (1.79-3.06)
Carrot 12.46 (11.09-13.83) 8.36 (6.87-9.85) 4.85 (3.85-5.86) 7.20 (7.11-8.29) 4.54 (3.78-5.31) 5.09 (4.13-6.06) 2.11 (1.52-2.71)
Sesame seed 12.10 (10.74-13.45) 11.90 (10.15-13.64) 5.82 (4.73-6.92) 6.50 (5.46-7.54) 3.03 (2.40-3.66) 5.50 (4.50-6.51) 2.86 (2.17-3.55)
Apple 11.95 (10.60-13.30) 10.13 (8.50-11.76) 4.85 (3.85-5.86) 7.90 (6.77-9.04) 4.93 (4.14-5.72) 5.50 (4.50-6.50) 2.05 (1.46-2.64)
Peanut 10.06 (8.81-11.31) 7.82 (6.37-9.27) 4.12 (3.19-5.05) 6.18 (5.17-7.20) 2.65 (2.06-3.24) 4.82 (3.87-5.76) 2.31 (1.69-2.93)
Walnut 9.52 (8.30-10.74) 7.45 (6.04-8.87) 5.33 (4.28-6.38) 3.55 (2.77-4.33) 2.28 (1.73-2.82) 3.58 (2.76-4.40) 1.37 (0.89-1.85)
Kiwi 9.49 (8.27-10.71) 9.22 (7.66-10.78) 5.10 (4.08-6.13) 9.53 (8.29-10.77) 4.54 (3.78-5.31) 5.37 (4.38-6.36) 1.74 (1.20-2.28)
Melon 9.19 (7.99-10.39) 6.70 (5.35-8.05) 3.40 (2.56-4.25) 4.26 (3.41-5.12) 2.28 (1.73-2.82) 3.99 (3.13-4.86) 0.81 (0.44-1.18)
Buckwheat 8.89 (7.70-10.07) 7.55 (6.13-8.98) 5.58 (4.51-6.66) 4.77 (3.87-5.67) 2.65 (2.06-3.24) 3.99 (3.13-4.85) 1.37 (0.89-1.85)
Sunflower seed 8.89 (7.70-10.07) 6.16 (4.87-7.46) 4.85 (3.85-5.86) 4.67 (3.78-5.56) 3.41 (2.75-4.08) 4.54 (3.63-5.46) 1.37 (0.89-1.85)
Poppy seed 8.50 (7.34-9.66) 6.32 (5.01-7.64) 3.15 (234-3.97) 4.88 (3.97-5.78) 2.28 (1.73-2.82) 3.99 (3.13-4.85) 0.75 (0.39-1.10)
Corn 8.35 (7.20-9.50) 9.43 (7.85-11.01) 5.82 (4.73-6.92) 6.09 (5.08-7.10) 3.04 (2.41-3.67) 3.86 (3.01-4.70) 1.80 (1.25-2.35)
Cow’s milk 8.29 (7.14-9.43) 8.15 (6.68-9.63) 15.08 (13.41-16.75) 8.22 (7.06-9.37) 8.74 (7.70-9.11) 5.09 (4.13-6.06) 3.74 (2.95-4.52)Lentils 7.99 (6.86-9.11) 7.45 (6.04-8.87) 3.63 (2.76-4.51) 5.38 (4.43-6.33) 2.65 (2.06-3.24) 3.99 (3.13-4.85) 2.11 (1.52-2.71)
Soy bean 7.72 (6.61-8.83) 5.89 (4.62-7.16) 4.12 (3.19-5.05) 4.15 (3.31-4.99) 2.65 (2.06-3.24) 4.27 (3.38-5.15) 1.19 (0.74-1.63)
Hen’s egg 6.06 (5.07-7.06) 7.34 (5.94-8.75) 6.57 (5.41-7.72) 4.77 (3.87-5.67) 3.41 (2.75-4.08) 4.68 (3.75-5.60) 3.12 (2.40-3.84)
Mustard seed 4.92 (4.02-5.82) 3.33 (2.36-4.29) 2.18 (1.50-2.86) 1.72 (1.17-2.27) 3.04 (2.41-3.67) 2.48 (1.80-3.16) 0.37 (0.12-0.63)
Shrimp 3.75 (2.96-4.54) 2.68 (1.81-3.55) 0.97 (0.51-1.43) 3.35 (2.59-4.11) 0.38 (0.15-0.60) 2.34 (1.67-3.00) 0.88 (0.49-1.26)
Fish 0.51 (0.21-0.81) 0.91 (0.40-1.42) 0.24 (0.01-0.47) 0.50 (0.21-0.80) 0.76 (0.44-1.08) 0.00 (0.00-0.33) 0.44 (0.17-0.71)
Overall FS 28.73 (26.85 -30.61) 25.78 (23.42-28.14) 23.34 (21.36-25.32) 22.72 (20.96-24.49) 17.84 (16.44-19.24) 16.65 (15.01-18.28) 10.98 (9.69-12.27)
Primary FS 20.26 (18.59-21.94) 21.71 (19.48-23.93) 21.15 (19.24-23.06) 17.17 (15.58-18.76) 15.19 (13.87-16.50) 12.66 (11.20-14.12) 8.62 (7.46-9.78)
Bold: Three foods most commonly causing FS per center (more than 3 marked if identical prevalence estimates). Centers are sorted from high to low prevalence of overall FS; foods are sorted from high to low prevalence of FS in Zurich. Forprevalence estimates that were close to 0, the double arcsine transformation method was used to prevent obtaining confidence limits with negative values. Subjects with discrepancies in the clinical questionnaires were included in the studypopulation for calculation of prevalence of FS (Figure 1).
JALLER
GY
CLIN
IMMUNOLPR
ACT
VOLU
ME8,NUMBER
8LYONSET
AL
2746.e7
Dow
nloaded for Anonym
ous User (n/a) at V
ilnius University from
ClinicalK
ey.com by Elsevier on A
pril 27, 2021. For personal use only. N
o other uses without perm
ission. Copyright ©
2021. Elsevier Inc. All rights reserved.

TABLE E2. Percentage of subjects with self-reported FA who had matching FS per priority food
Priority food No. of subjects with FS* No. of subjects with self-reported FA*
N (%) of subjects with self-reported FA who
had matching FS (probable FA)*
Lentils 105 11 5 (45.5)
Apple 152 51 22 (43.1)
Hazelnut 179 69 26 (37.7)
Sunflower seed 104 8 3 (37.5)
Peach 180 48 16 (33.3)
Carrot 143 33 10 (30.3)
Peanut 129 91 26 (28.6)
Celery 147 30 8 (26.7)
Sesame seed 149 8 2 (25.0)
Banana 188 52 12 (23.1)
Soy bean 101 27 6 (22.2)
Shrimp 53 43 9 (20.9)
Walnut 101 74 14 (18.9)
Kiwi 147 104 19 (18.3)
Hen’s egg 116 165 26 (15.8)
Buckwheat 109 15 2 (13.3)
Fish 14 74 8 (10.8)
Wheat 165 52 5 (9.6)
Tomato 141 121 10 (8.3)
Cow’s milk 149 437 35 (8.0)
Melon 90 15 1 (6.7)
Corn 119 15 1 (6.7)
Mustard seed 50 0 0 (0.0)
Poppy seed 95 0 0 (0.0)
Overall 2926 1543 266 (17.2)†
*Source population: cases and controls participating in phase II with available food serology (N ¼ 1989).†These 266 probable FAs were found in 136 subjects.
JALLER
GY
CLIN
IMMUNOLPR
ACT
SEPT
EMBER
2020
2746.e8
LYONSET
AL
Dow
nloaded for Anonym
ous User (n/a) at V
ilnius University from
ClinicalK
ey.com by Elsevier on A
pril 27, 2021. For personal use only. N
o other uses without perm
ission. Copyright ©
2021. Elsevier Inc. All rights reserved.

TABLE E3. Prevalence of probable FA per priority food and per center
Prevalence (95% CI) of
probable FA to: Lodz Madrid Vilnius Utrecht Zurich Athens Reykjavik
Cow’s milk 1.70 (0.68-3.24) 0.89 (0.12-2.46) 0.89 (0.01-3.17) 1.16 (0.34-2.52) 0.00 (0.00-0.49) 0.56 (0.00-2.51) 0.37 (0.02-1.23)
Celery 1.24 (0.40-2.60) 0.00 (0.00-0.56) 0.00 (0.00-0.86) 0.00 (0.00-0.37) 0.14 (0.04-0.98) 0.00 (0.00-0.88) 0.00 (0.00-0.35)
Apple 1.09 (0.32-2.38) 0.18 (0.02-1.15) 0.89 (0.01-3.17) 0.84 (0.18-2.05) 0.54 (0.02-1.80) 0.00 (0.00-0.88) 0.07 (0.03-0.63)
Banana 0.95 (0.25-2.18) 0.18 (0.02-1.15) 0.00 (0.00-0.86) 0.32 (0.01-1.18) 0.14 (0.04-0.98) 0.56 (0.00-2.51) 0.07 (0.03-0.63)
Peanut 0.78 (0.16-1.92) 0.89 (0.12-2.46) 0.00 (0.00-0.86) 0.63 (0.09-1.72) 0.41 (0.00-1.56) 0.28 (0.07-1.89) 0.52 (0.06-1.48)
Hazelnut 0.78 (0.16-1.92) 0.53 (0.02-1.85) 2.15 (0.41-5.26) 0.74 (0.14-1.89) 0.81 (0.10-2.27) 0.28 (0.07-1.89) 0.07 (0.03-0.63)
Hen’s egg 0.76 (0.16-1.90) 0.89 (0.12-2.46) 0.44 (0.02-2.28) 0.21 (0.00-0.97) 0.00 (0.00-0.49) 0.85 (0.01-3.06) 0.74 (0.15-1.84)
Tomato 0.63 (0.10-1.68) 0.35 (0.00-1.52) 0.00 (0.00-0.86) 0.11 (0.02-0.74) 0.27 (0.00-1.29) 0.28 (0.07-1.89) 0.07 (0.03-0.63)
Peach 0.48 (0.05-1.43) 1.06 (0.19-2.74) 0.44 (0.02-2.28) 0.53 (0.06-1.55) 0.14 (0.04-0.98) 0.28 (0.07-1.89) 0.00 (0.00-0.35)
Walnut 0.48 (0.05-1.43) 0.53 (0.02-1.85) 0.00 (0.00-0.86) 0.53 (0.06-1.55) 0.27 (0.00-1.29) 0.56 (0.00-2.51) 0.00 (0.00-0.35)
Kiwi 0.31 (0.01-1.14) 1.06 (0.19-2.74) 0.44 (0.02-2.28) 0.63 (0.09-1.72) 0.27 (0.00-1.29) 0.00 (0.00-0.88) 0.15 (0.01-0.80)
Soy bean 0.31 (0.01-1.14) 0.18 (0.02-1.15) 0.00 (0.00-0.86) 0.21 (0.00-0.97) 0.00 (0.00-0.49) 0.00 (0.00-0.88) 0.07 (0.03-0.63)
Carrot 0.15 (0.01-0.83) 0.00 (0.00-0.56) 0.89 (0.01-3.17) 0.11 (0.02-0.74) 0.81 (0.10-2.27) 0.00 (0.00-0.88) 0.00 (0.00-0.35)
Shrimp 0.00 (0.00-0.37) 0.71 (0.06-2.16) 0.00 (0.00-0.86) 0.00 (0.00-0.37) 0.14 (0.04-0.98) 0.00 (0.00-0.88) 0.30 (0.01-1.10)
Fish 0.00 (0.00-0.37) 0.53 (0.02-1.85) 0.00 (0.00-0.86) 0.11 (0.02-0.74) 0.14 (0.04-0.98) 0.28 (0.07-1.89) 0.15 (0.01-0.80)
Lentil 0.00 (0.00-0.37) 0.53 (0.02-1.85) 0.00 (0.00-0.86) 0.00 (0.00-0.37) 0.00 (0.00-0.49) 0.56 (0.00-2.51) 0.00 (0.00-0.35)
Sunflower seed 0.00 (0.00-0.37) 0.53 (0.02-1.85) 0.00 (0.00-0.86) 0.00 (0.00-0.37) 0.00 (0.00-0.49) 0.00 (0.00-0.88) 0.00 (0.00-0.35)
Melon 0.00 (0.00-0.37) 0.18 (0.02-1.15) 0.00 (0.00-0.86) 0.00 (0.00-0.37) 0.00 (0.00-0.49) 0.00 (0.00-0.88) 0.00 (0.00-0.35)
Corn 0.00 (0.00-0.37) 0.18 (0.02-1.15) 0.00 (0.00-0.86) 0.00 (0.00-0.37) 0.00 (0.00-0.49) 0.00 (0.00-0.88) 0.00 (0.00-0.35)
Wheat 0.00 (0.00-0.37) 0.00 (0.00-0.56) 0.00 (0.00-0.86) 0.21 (0.00-0.97) 0.14 (0.04-0.98) 0.00 (0.00-0.88) 0.15 (0.01-0.80)
Buckwheat 0.00 (0.00-0.37) 0.00 (0.00-0.56) 0.00 (0.00-0.86) 0.00 (0.00-0.37) 0.14 (0.04-0.98) 0.00 (0.00-0.88) 0.07 (0.03-0.63)
Sesame seed 0.00 (0.00-0.37) 0.00 (0.00-0.56) 0.00 (0.00-0.86) 0.00 (0.00-0.37) 0.00 (0.00-0.49) 0.00 (0.00-0.88) 0.15 (0.01-0.80)
Mustard seed 0.00 (0.00-0.37) 0.00 (0.00-0.56) 0.00 (0.00-0.86) 0.00 (0.00-0.37) 0.00 (0.00-0.49) 0.00 (0.00-0.88) 0.00 (0.00-0.35)
Poppy seed 0.00 (0.00-0.37) 0.00 (0.00-0.56) 0.00 (0.00-0.86) 0.00 (0.00-0.37) 0.00 (0.00-0.49) 0.00 (0.00-0.88) 0.00 (0.00-0.35)
Overall 5.60 (3.57-8.11) 3.89 (1.90-6.65) 3.04 (0.85-6.58) 2.96 (1.51-4.93) 2.31 (0.88-4.46) 1.97 (0.36-4.94) 1.93 (0.84-3.52)
Bold: Three foods most commonly causing probable FA per center (more than 3 marked if identical prevalence estimates). Centers are sorted from high to low prevalence of overall probable FA; foods are sorted from high to low prevalenceof probable FA in Lodz. For prevalence estimates that were close to 0, the double arcsine transformation method was used to prevent obtaining confidence limits with negative values. Subjects with discrepancies in the clinical questionnaireswere excluded from the study population for calculation of prevalence of probable FA (because of uncertainties regarding symptomatology) (Figure 1).
JALLER
GY
CLIN
IMMUNOLPR
ACT
VOLU
ME8,NUMBER
8LYONSET
AL
2746.e9
Dow
nloaded for Anonym
ous User (n/a) at V
ilnius University from
ClinicalK
ey.com by Elsevier on A
pril 27, 2021. For personal use only. N
o other uses without perm
ission. Copyright ©
2021. Elsevier Inc. All rights reserved.