
Prevalence of food deprivation - Food and Agriculture … 'DLO\ 9LWDPLQ % &RQVXPSWLRQ SHU 3HUVRQ PFJ...
97
-
Upload
truongnguyet -
Category
Documents
-
view
214 -
download
0
Transcript of Prevalence of food deprivation - Food and Agriculture … 'DLO\ 9LWDPLQ % &RQVXPSWLRQ SHU 3HUVRQ PFJ...

"The content of this publication is the sole responsibility of the National Bureau of Statistics Service, Dar es Salaam, Tanzania and can in no way be
taken to reflect the views of the European Union".

Food Security and Nutrition Analysis of Tanzania Household Budget Surveys 2000/1 and 2007

Food Security and Nutrition Analysis of Tanzania Household Budget Surveys 2000/1 and 2007

Food Security and Nutrition Analysis of Tanzania Household Budget Surveys 2000/1 and 2007

Food Security and Nutrition Analysis of Tanzania Household Budget Surveys 2000/1 and 2007
Food Security and Nutrition Analysis of Tanzania Household Budget Surveys 2000/1 and 2007

Foreword This report presents the findings of the joint research work by the National Bureau of Statistics
(NBS) in collaboration with the Food and Agricultural Organization of the United Nations (FAO). The
research is the result of further analysis of the 2000/01 and 2007 Tanzania Household Budget Surveys
(HBS’s) data. HBS surveys are conducted for a period of one year and contain rich information on the
type, quantity and values of food consumed by the Tanzanians households.
This joint research was conducted under the framework of technical assistance from FAO and the
financial support from the European Community (EC) to the NBS and other stakeholders on food
security. The availability of the two HBS data sets has made the trend analysis of food security indicators
possible.
The report presents both macro and micronutrients trends for Mainland Tanzania and therefore
contributes to the availability of very useful information needed to assist policy makers and programme
implementers to monitor and evaluate existing programmes and to design new food consumption related
strategies. We therefore hope that the results of this study will be useful for advocacy, research, policy
formulation, decision-making and program development.
One important aspect of this report is that it contains the trend analysis, which is imperative in
tracking and assessing the country progress in achieving the country and global goals. For example, the
report enables us to assess the progress made in achieving the Millennium Development Goal (MDG)
Number 1.9 indicator, which advocates for the reduction of hunger; that is to reduce the proportion of the
population below minimum level of dietary energy consumption by half by 2015.
The analysis was also meant to serve as a capacity building for the NBS and other stakeholders in
using the food consumption data from Household Budget Surveys to derive food security indicators. This
knowledge will enable the NBS staff to make more use of the HBS data in future and therefore
contributes to the availability of food security information for development strategies of the country.
The FAO organized the National Demonstration Centre (NDS) on Food Security and
Consumption Statistics in Dar es Salaam in February, 2010 that introduced the researchers to the Food
Security Statistics Module (FSSM) software developed by FAO Statistics Division. The workshop was
attended by 15 national officers from NBS, Office of the Chief Government Statistician (OCGS) -
Zanzibar, Ministry of Agriculture, Food Security and Cooperatives, and the Ministry of Trade, Industry
and Marketing. The FSSM software was eventually used in the analysis that produced inputs for this
report.
Dr. Albina A. Chuwa
Director General – National Bureau of Statistics
December 2010
Food Security and Nutrition Analysis of Tanzania Household Budget Surveys 2000/1 and 2007
Acknowledgement
The NBS and FAO wishes to acknowledge the contribution of various people who made this
report a huge success. First and foremost, we appreciate the technical assistance provided by Mr.
Seevalingum Ramasawmy, FAO Statistician, Mr. Ricardo Sibrian, former FAO Senior Statistician and
Ms. Ana Moltedo, FAO Consultant for their valuable support and contribution to this food security
activity. Grateful appreciation to the FAO Representative in Tanzania, Ms Louise Setshwaelo and her
staff who have provided the necessary administrative support since the inception of the project.
We are also grateful to the analysts and participants of the NDC, these are Aldegunda Komba,
Mlemba Abassy, Elinzuu Nicodemo, Israel Mwakapalala, Devotha Antony, Norvati Buberwa, Stephen
Maganda and William Mabusi of NBS; Mdachi Kombo and the late Bakari Hamad of OCGS; Onasimbo
Ntikha of Ministry of Agriculture, Food Security and Cooperatives, Francis Lwesya of Ministry of
Industry, Trade and Marketing and Mansura M. Kassim of the Ministry of Agriculture Zanzibar.
This report has benefited from contributions by experts from various Ministries and regional
offices together with international experts from WFP, World Bank, DFID and UNICEF who participated
in the National Seminar on Food Security Statistics and Multisectoral Perspectives, in October 2010, in
Dar es Salaam, Tanzania.
We would also like to thank the Economic Commission of the European Union for their financial
support to this successful food security activity in Tanzania.
Dr. Albina A. Chuwa
Director General – National Bureau of Statistics
December 2010
Food Security and Nutrition Analysis of Tanzania Household Budget Surveys 2000/1 and 2007

Food Security and Nutrition Analysis of Tanzania Household Budget Surveys 2000/1 and 2007
Food Security and Nutrition Analysis of Tanzania Household Budget Surveys 2000/1 and 2007

Food Security and Nutrition Analysis of Tanzania Household Budget Surveys 2000/1 and 2007

Food Security and Nutrition Analysis of Tanzania Household Budget Surveys 2000/1 and 2007

Food Security and Nutrition Analysis of Tanzania Household Budget Surveys 2000/1 and 2007

Food Security and Nutrition Analysis of Tanzania Household Budget Surveys 2000/1 and 2007
Food Security and Nutrition Analysis of Tanzania Household Budget Surveys 2000/1 and 2007
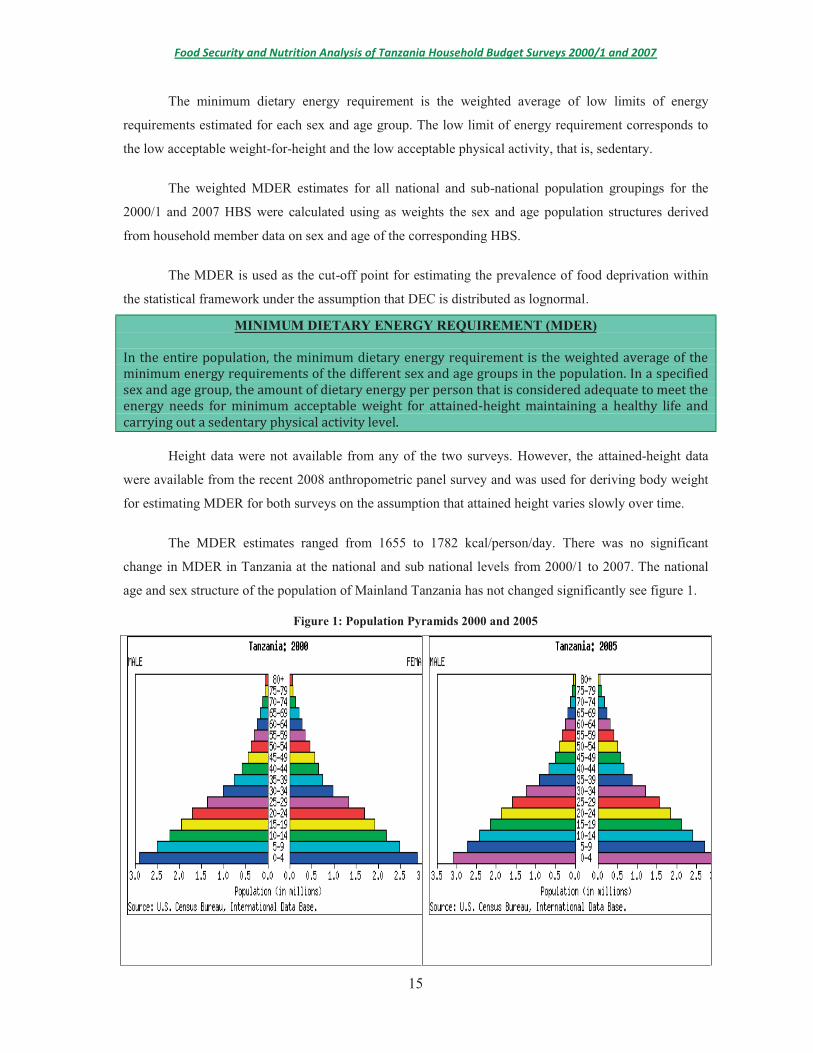
In the entire population, the minimum dietary energy requirement is the weighted average of the
minimum energy requirements of the different sex and age groups in the population. In a specified
sex and age group, the amount of dietary energy per person that is considered adequate to meet the
energy needs for minimum acceptable weight for attained-height maintaining a healthy life and
carrying out a sedentary physical activity level.

Food Security and Nutrition Analysis of Tanzania Household Budget Surveys 2000/1 and 2007

Food Security and Nutrition Analysis of Tanzania Household Budget Surveys 2000/1 and 2007

Food Security and Nutrition Analysis of Tanzania Household Budget Surveys 2000/1 and 2007

Food Security and Nutrition Analysis of Tanzania Household Budget Surveys 2000/1 and 2007

Food Security and Nutrition Analysis of Tanzania Household Budget Surveys 2000/1 and 2007
0
50
100
150
200
250
300
350
400
450
Tanzania Dar es Salaam Other Urban Rural Male Female
257
404
290
241 235
267262 274 277257 255 263
2000-01 HBS 2007 HBS

Food Security and Nutrition Analysis of Tanzania Household Budget Surveys 2000/1 and 2007
Food Security and Nutrition Analysis of Tanzania Household Budget Surveys 2000/1 and 2007
Food Security and Nutrition Analysis of Tanzania Household Budget Surveys 2000/1 and 2007

Food Security and Nutrition Analysis of Tanzania Household Budget Surveys 2000/1 and 2007
Food Security and Nutrition Analysis of Tanzania Household Budget Surveys 2000/1 and 2007

Food Security and Nutrition Analysis of Tanzania Household Budget Surveys 2000/1 and 2007

Food Security and Nutrition Analysis of Tanzania Household Budget Surveys 2000/1 and 2007

Food Security and Nutrition Analysis of Tanzania Household Budget Surveys 2000/1 and 2007

Food Security and Nutrition Analysis of Tanzania Household Budget Surveys 2000/1 and 2007
0
5
10
15
20
25
30
35
Dar es Salaam Other urban areas
Rural areas Male Female
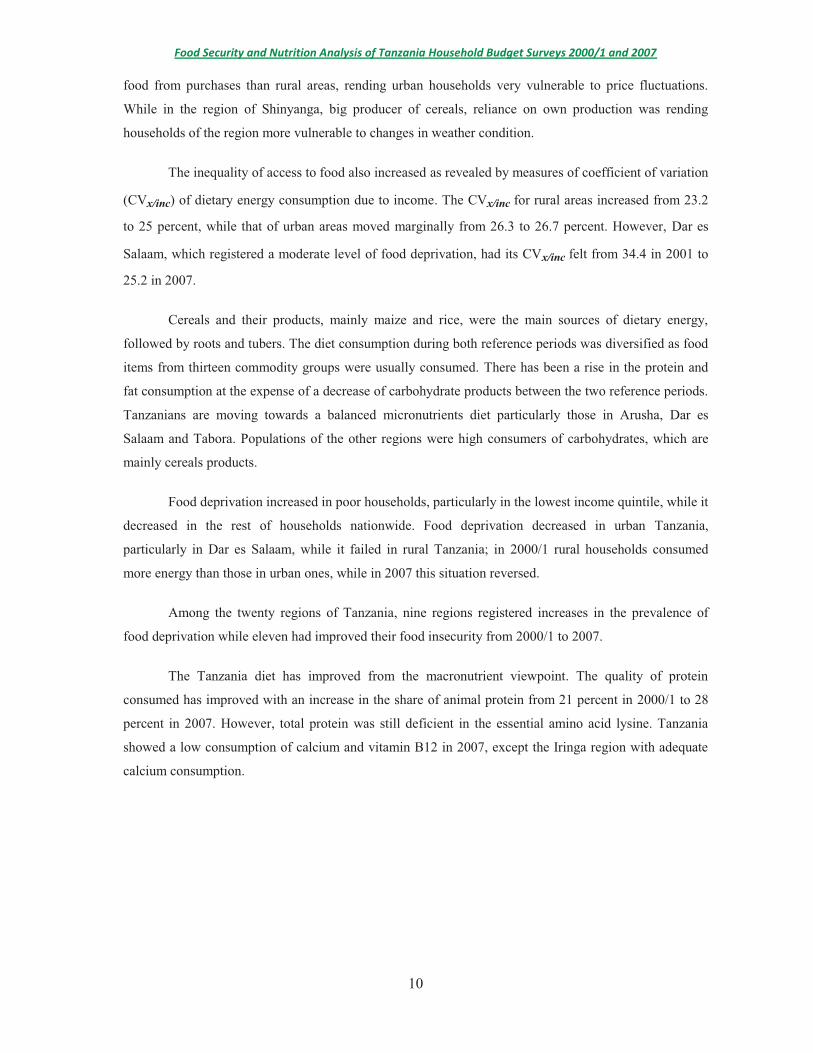
34.4
26.323.2
21.4
26.425.2 26.7 25.024.2
26.7
HBS 2000-01 HBS 2007
Food Security and Nutrition Analysis of Tanzania Household Budget Surveys 2000/1 and 2007
0
5
10
15
20
25
30
35
40
2000-01 2007

Food Security and Nutrition Analysis of Tanzania Household Budget Surveys 2000/1 and 2007
0
10
20
30
40
50
60
70
80
Protein 2000-01 Protein 2007 Fat 2000-01 Fat 2007 Carbohydrates 2000/01 Carbohydrates 2007
0
10
20
30
40
50
60
70
80
Protein 2000/01 Protein 2007 Fat 2000/01 Fat 2007 Carbohydrates 2000/01 Carbohydrates 2007

Food Security and Nutrition Analysis of Tanzania Household Budget Surveys 2000/1 and 2007

Food Security and Nutrition Analysis of Tanzania Household Budget Surveys 2000/1 and 2007
0
10
20
30
40
50
60
CERE
ALS
AN
D P
ROD
UCT
S
ROO
TS A
ND
TU
BERS
AN
D
ALC
OH
OLI
C BE
VERA
GES
SUG
ARS
AN
D S
YRU
PS A
ND
OIL
CRO
PS
MIS
CELL
AN
EOU
S A
ND
OIL
S A
ND
FA
TS (
vege
tabl
e oi
ls)
PULS
ES
MEA
T
FRU
ITS
AN
D P
ROD
UCT
S
VEG
ETA
BLES
AN
D P
ROD
UCT
S
FISH
AN
D F
ISH
PRO
DU
CTS
MIL
K A
ND
CH
EESE
STIM
ULA
NTS
TREE
NU
TS
SPIC
ES
EGG
S
OIL
S A
ND
FA
TS (
anim
al f
ats)
NO
N A
LCO
HO
LIC
BEVE
RAG
ES
%
HBS 2000-01 HBS 2007

Food Security and Nutrition Analysis of Tanzania Household Budget Surveys 2000/1 and 2007
0
100
200
300
400
500
600
Ma
ize
flo
ur
Ma
ize
gra
in
Ric
e h
usk
ed
Ca
ssa
va
flo
ur
Su
ga
r re
fin
ed
wh
ite
Tra
dit
ion
al
bre
ws(
e.g
. k
ac
ha
su)
ou
tsid
e h
om
e
So
rgh
um
av
era
ge
of
all
v
ari
eti
Ba
na
na
co
ok
ing
Ca
ttle
me
at
Ca
ssa
va
sw
ee
t ro
ots
ra
w
587
264169
113 87 76 72 53 46 46
Kc
al/
pe
rso
n/d
ay
HBS 2000-01
0
100
200
300
400
500
600
Ma
ize
flo
ur
wh
ite
Wh
ite
ma
ize
gra
ins
Ric
e
Ca
ssa
va
flo
ur
Oth
er
co
ok
ing
oil
Bro
wn
su
ga
r
Co
ok
ing
ba
na
na
s-p
lan
tain
s
Sw
ee
t p
ota
toe
s
Bro
ad
be
an
s
Ca
ssa
va
-fr
esh
510
225 216
120 8857 55 51 47 44
Kc
al/
pe
rso
n/d
ay
HBS 2007

Food Security and Nutrition Analysis of Tanzania Household Budget Surveys 2000/1 and 2007
2001
47 26
109
37
140
41 37
101
316
6429
105
243
110
*
Maiz
e flo
ur
Maiz
e gra
in
Rice
hus
ked
Cas
sava
flou
r
Sug
ar re
fined
whi
te
Tra
ditio
nal b
rews
(e.g
. kac
hasu
)ou
tsid
e hom
e
Sor
ghum
aver
age o
f all v
ariet
i
Ban
ana c
ookin
g
Cat
tle m
eat
Cas
sava
swee
t roo
ts ra
w
Cas
sava
swee
t roo
ts d
ried
cook
ing
oil o
ther
Bea
ns d
ry
Tra
ditio
nal b
rews
(e.g
. kac
hasu
Swe
etpo
tato
2007
9955
203
69
194
283
164194
154114
66
134
293331 352
182
304355
64
372
521
92
*0
600
Mai
ze fl
our w
hite
Whi
te m
aize
gra
ins
Rice
Cass
ava
flour
Othe
r coo
king
oil
Brow
n su
gar
Cook
ing
bana
nas-
pla
ntai
ns
Swee
t pot
atoe
s
Broa
d be
ans
Cass
ava-
fres
h
Sorg
hum
- flo
ur
Coco
nut (
un h
uske
d)
Whi
te s
ugar
Beef
with
bon
es
Othe
r loc
al b
rew
Fres
h co
w m
ilk
Soya
bea
ns
Buns
Othe
r lea
fy v
eget
able
s
Cass
ava
dry
Whe
at fl
our
Drie
d sa
rdin
es
Clot
ted
milk

Food Security and Nutrition Analysis of Tanzania Household Budget Surveys 2000/1 and 2007
Arusha and Manyara
180
508
857
202
778
197
585509
238
555
423
206 195
* *
Whi
tem
aize
Mai
zefl
our
whi
teFr
esh
cow
milk Bro
adbe
ans
Bee
f wit
hbo
nes
Ric
e
Goa
t m
eat
Oth
er w
ildve
geta
bles
Oth
er le
afy
vege
tabl
es
Live
goa
t
Fres
h dr
ied
fish
Bea
ns- d
ry
Dri
edsa
rdin
esFr
esh-
chill
ed o
r
Soya
bea
ns
Dar-es-salaam
563
228319
486
301
496
373
725
* * * * * * *
Mai
zefl
ou
r w
hit
e
Ric
e
Soya
bea
ns
Fres
h d
ried
fish
Bee
f w
ith
bo
nes
Dri
edsa
rdin
esB
road
bea
ns
Fres
h-
chill
ed o
rW
hea
tfl
ou
rD
ried
or
salt
ed f
ish
/
chap
ati
Tom
ato
es-
rou
nd
Slic
edb
read
Co
con
ut
(un
Oth
er le
afy
vege
tab
les
Dodoma
484
216 249156 130
186144
278377
97
345
162
451
195
310
*
Mai
ze f
lou
rw
hit
eSo
rgh
um
-fl
ou
rO
ther
leaf
yve
geta
ble
sW
hit
em
aize
Nat
ura
lgr
ou
nd
nu
tsB
arle
y an
do
ther
Len
tils
an
do
ther R
ice
Bro
adb
ean
sD
ried
sard
ines
Sorg
hu
m-
grai
nSp
ott
edb
ean
sW
hea
t-gr
ain
Oth
er w
ildve
geta
ble
sP
eas-
dry
Fres
h d
ried
fish
Iringa
182
530
171 22
621
422
822
7 317
9130
7
735
265
216
772
170
742
312 39
730
5
807
* * * *
Wh
ite
Mai
ze f
lou
rO
ther
leaf
yB
road
Soya
bea
ns
Dri
ed o
rD
ried
sm
all
Dri
edCo
oki
ng
Fres
h-
Ric
eTo
mat
oes
-B
eef
wit
hG
oat
mea
tEg
gsLe
nti
ls a
nd
Pota
toes
Peas
- dry
Cass
ava
Fres
h c
ow
Wh
eat
flo
ur
Nat
ura
lPo
rk m
eat
Trad
itio
nal
Kagera
206
507
182
484
258176
52135
303
112
782
* * * *
Broa
d be
ans
Mai
ze fl
our
whi
te
Dri
ed s
ardi
nes
Bean
s- d
ry
Whi
te m
aize
gra
ins
Rice
Cook
ing
bana
nas-
plan
tain
sD
ried
or
salt
ed fi
sh/
shel
lfish
Wild
bir
ds a
ndin
sect
s
Dri
ed s
mal
l fis
h
Fres
h co
w m
ilk
Beef
wit
h bo
nes
Swee
t pot
atoe
s
Eggs
Fres
h- c
hille
d or
froz
en fi
sh
Kigoma
462
257157
2
412
547
244
129203
142
304
763
* * *
Mai
ze fl
our
whi
te Whi
tem
aize
Dri
ed o
rsa
lted
fish
/In
dust
rial
lybr
ed li
veFr
esh-
chill
ed o
rD
ried
sard
ines
Cass
ava
flour
Broa
dbe
ans
Rice
Nat
ural
grou
ndnu
ts
Bean
s- d
ry
Cook
ing
oats
Lent
ils a
ndot
her
Dri
ed s
mal
lfis
h
Goa
t mea
t

Food Security and Nutrition Analysis of Tanzania Household Budget Surveys 2000/1 and 2007
Kilimanjaro
650
313211
283
754
238 271183
495
298
583
339
* * *
Mai
zeflo
ur w
hite
Whi
tem
aize
Rice
Beef
wit
hbo
nes
Broa
dbe
ans
Dri
ed s
mal
lfis
hFr
esh
cow
milk
Spot
ted
bean
sFr
esh
drie
dfis
h
Soya
bea
ns
Cook
ing
bana
nas-
Whe
atflo
urO
ther
leaf
yve
geta
bles
Clot
ted
milk Eg
gs
Lindi
630
186 167228 213
472 446
129
356
246 255 222 223
* *
Mai
ze fl
our
whi
teLe
ntils
and
othe
rD
ried
sard
ines
Ric
e
Peas
- dry
Whi
tem
aize
Fres
h-ch
illed
or
Oth
er le
afy
vege
tabl
esD
ried
sm
all
fish
Sorg
hum
-fl
our
Soya
bea
ns
Dri
ed o
rsa
lted
fish
/So
rghu
m-
grai
nCa
ssav
afl
our
Nat
ural
grou
ndnu
ts
Mara
250
601
263
626
178289
595
169
* *
Whi
te m
aize
gra
ins
Fres
h- c
hille
d or
froz
en fi
sh
Dri
ed s
ardi
nes
Cass
ava
flour
Rice
Beef
wit
h bo
nes
Dri
ed o
r sa
lted
fish
/sh
ellfi
sh
Broa
d be
ans
Swee
t pot
atoe
s
Sorg
hum
- gra
in
Mbeya
488
173274 238 211
392
193
773
551
214
472
277
614
* * * *
Mai
zefl
our
whi
teW
hite
mai
zeR
ice
Oth
er le
afy
vege
tabl
esB
road
bean
sD
ried
or
salt
ed fi
sh/
Fres
h-ch
illed
or
Bee
f wit
hbo
nes
Dri
edsa
rdin
esB
eans
- dry
Pork
mea
tCl
otte
dm
ilk Eggs
Dri
ed s
mal
lfi
shSp
otte
dbe
ans
Tom
atoe
s-ro
und
Fres
h co
wm
ilk
Morogoro
536
254 248 214283
390 405
130192 205 215 197
* *
Mai
zeflo
ur w
hite
Rice
Broa
dbe
ans
Dri
ed o
rsa
lted
fish
/W
hite
mai
zeO
ther
leaf
yve
geta
bles
Dri
edsa
rdin
esFr
esh-
chill
ed o
rO
ther
wild
vege
tabl
esLe
ntils
and
othe
r
Soya
bea
ns
Peas
- dry
Fres
h dr
ied
fish
Beef
wit
hbo
nes
Mtwara
616
148
587
249
392
253344
185 154221 219
74
196
* *
Mai
ze fl
our
whi
teLe
ntils
and
othe
rCa
ssav
afl
our
Oth
er le
afy
vege
tabl
es
Ric
e
Dri
edsa
rdin
esD
ried
or
salt
ed fi
sh/
Dri
ed s
mal
lfi
sh Whi
tem
aize
Nat
ural
grou
ndnu
ts
Soya
bea
ns
Peas
- dry
Fres
h-ch
illed
or
Cook
ing
oats
Nat
ural
grou
ndnu
ts
Mwanza
261
560
195
590
298
153204
264
895
* * *
Whi
tem
aize
Fres
h-ch
illed
or
Dri
edsa
rdin
esM
aize
flour
whi
te
Rice
Swee
tpo
tato
esBr
oad
bean
sCa
ssav
aflo
urBe
ef w
ith
bone
sCo
okin
goa
tsO
ther
leaf
yve
geta
bles
Fres
h dr
ied
fish
Pwani
563
96186
258
637
226
97
326
476
899
281 259
* *
Mai
zefl
our
whi
te
Ric
e
Fres
h dr
ied
fish
Oth
er le
afy
vege
tabl
esB
road
bean
sFr
esh-
chill
ed o
r
Soya
bea
ns
Fres
h sm
all
sard
ines
Dri
ed o
rsa
lted
fish
/Co
conu
t(u
nD
ried
sard
ines
Cass
ava
flou
r
Peas
- dry
Lent
ils a
ndot
her
Food Security and Nutrition Analysis of Tanzania Household Budget Surveys 2000/1 and 2007
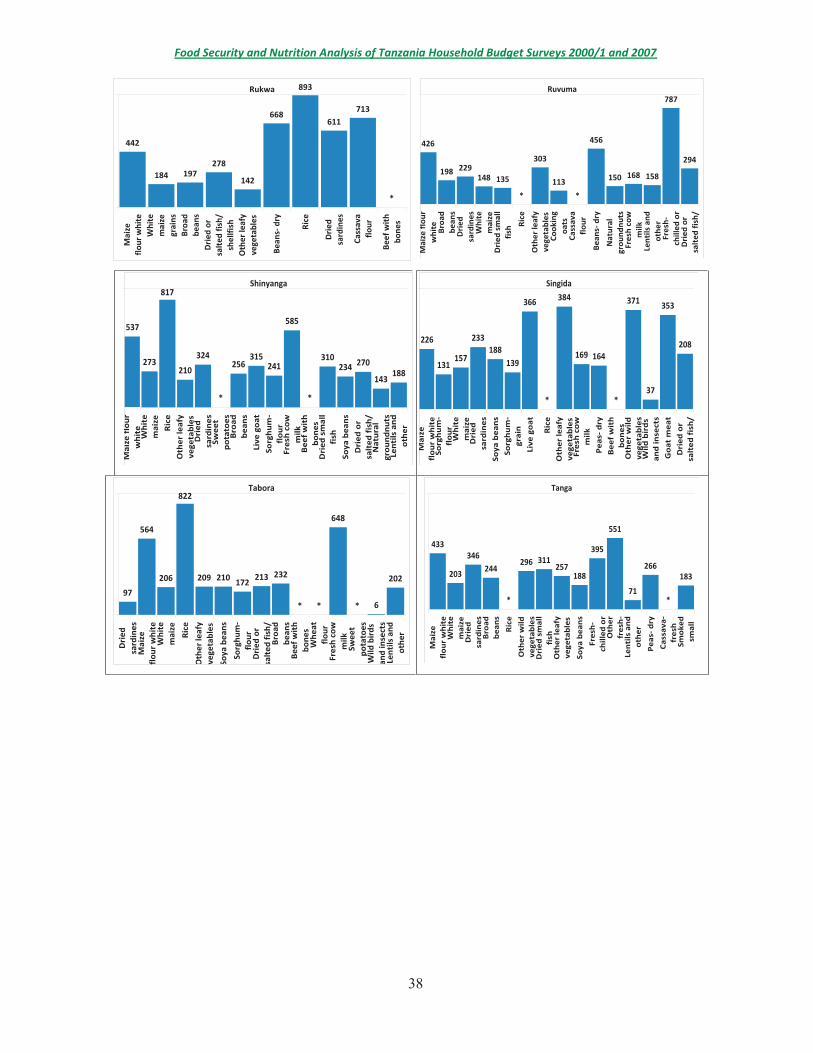
Rukwa
442
184 197278
142
668
893
611713
*
Mai
zeflo
ur w
hite
Whi
tem
aize
grai
nsBr
oad
bean
sD
ried
or
salt
ed fi
sh/
shel
lfish
Oth
er le
afy
vege
tabl
es
Bean
s- d
ry
Rice
Dri
edsa
rdin
es
Cass
ava
flour
Beef
wit
hbo
nes
Ruvuma
426
198 229148 135
303
113
456
150 168 158
787
294
* *
Mai
ze fl
our
whi
te Bro
adbe
ans
Dri
edsa
rdin
esW
hite
mai
zeD
ried
sm
all
fish
Ric
e
Oth
er le
afy
vege
tabl
esCo
okin
goa
tsCa
ssav
afl
our
Bea
ns- d
ry
Nat
ural
grou
ndnu
tsFr
esh
cow
milk
Lent
ils a
ndot
her
Fres
h-ch
illed
or
Dri
ed o
rsa
lted
fish
/
Shinyanga
537
273210
324256
315241
585
310234 270
143188
817
* *
Mai
ze f
lou
rw
hit
eW
hit
em
aize
Ric
eO
ther
leaf
yve
geta
ble
sD
ried
sard
ines
Swee
tp
ota
toes
Bro
adb
ean
sLi
ve g
oat
Sorg
hu
m-
flo
ur
Fres
h c
ow
milk
Bee
f w
ith
bo
nes
Dri
ed s
mal
lfi
shSo
ya b
ean
sD
ried
or
salt
ed f
ish
/N
atu
ral
gro
un
dn
uts
Len
tils
an
do
ther
Singida
226
131157
233188
139
366 384
169 164
371
37
353
208
* *
Mai
zefl
ou
r w
hit
eSo
rgh
um
-fl
ou
rW
hit
em
aize
Dri
edsa
rdin
esSo
ya b
ean
sSo
rgh
um
-gr
ain
Live
go
at
Ric
eO
ther
leaf
yve
geta
ble
sFr
esh
co
wm
ilkP
eas-
dry
Bee
f w
ith
bo
nes
Oth
er w
ildve
geta
ble
sW
ild b
ird
san
d in
sect
sG
oat
mea
tD
ried
or
salt
ed f
ish
/
Tabora
97
564
206 209 210 172213 232
648
6
202
822
* * *
Dri
edsa
rdin
esM
aize
flou
r w
hite
Whi
tem
aize
Ric
e
Oth
er le
afy
vege
tabl
es
Soya
bea
ns
Sorg
hum
-fl
our
Dri
ed o
rsa
lted
fish
/B
road
bean
sB
eef w
ith
bone
sW
heat
flou
rFr
esh
cow
milk
Swee
tpo
tato
esW
ild b
irds
and
inse
cts
Lent
ils a
ndot
her
Tanga
433
203
346244
296 311257
188
395
551
71
266183
* *
Mai
zefl
ou
r w
hit
eW
hit
em
aize
Dri
edsa
rdin
esB
road
bea
ns
Ric
e
Oth
er w
ildve
geta
ble
sD
ried
sm
all
fish
Oth
er le
afy
vege
tab
les
Soya
bea
ns
Fres
h-
chill
ed o
rO
ther
fres
h-
Len
tils
an
do
ther
Pea
s- d
ry
Cas
sava
-fr
esh
Smo
ked
smal
l

Food Security and Nutrition Analysis of Tanzania Household Budget Surveys 2000/1 and 2007

Food Security and Nutrition Analysis of Tanzania Household Budget Surveys 2000/1 and 2007

Food Security and Nutrition Analysis of Tanzania Household Budget Surveys 2000/1 and 2007
0
500
1000
1500
2000
2500
3000
Natio
nwid
e
Inco
me
quin
tile
1
Inco
me
quin
tile
2
Inco
me
quin
tile
3
Inco
me
quin
tile
4
Inco
me
quin
tile
5
Dar e
s Sal
aam
(C)
Oth
er u
rban
Are
as
Rura
l Are
as
Dodo
ma
Arus
ha an
d M
anya
ra
Kilim
anja
ro
Tang
a
Mor
ogor
o
Pwan
i
Dar E
s Sa
laam Lind
i
Mtw
ara
Ruvu
ma
Iring
a
Mbe
ya
Sing
ida
Tabo
ra
Rukw
a
Kigo
ma
Shin
yang
a
Kage
ra
Mw
anza
Mar
a
HBS 2000-01 HBS 2007
Food Security and Nutrition Analysis of Tanzania Household Budget Surveys 2000/1 and 2007

Food Security and Nutrition Analysis of Tanzania Household Budget Surveys 2000/1 and 2007

Food Security and Nutrition Analysis of Tanzania Household Budget Surveys 2000/1 and 2007
0
50
100
150
200
250Na
tionw
ide
Inco
me
quin
tile
1In
com
e qu
intil
e 2
Inco
me
quin
tile
3In
com
e qu
intil
e 4
Inco
me
quin
tile
5
Dar e
s Sal
aam
Oth
er u
rban
Are
asRu
ral A
reas
Dodo
ma
Arus
ha an
d M
anya
raKi
liman
jaro
Tang
aM
orog
oro
Pwan
iDa
r Es
Sala
amLi
ndi
Mtw
ara
Ruvu
ma
Iring
aM
beya
Sing
ida
Tabo
raRu
kwa
Kigo
ma
Shin
yang
aKa
gera
Mw
anza
Mar
a
HBS 2000-01 HBS 2007

Food Security and Nutrition Analysis of Tanzania Household Budget Surveys 2000/1 and 2007
0
20
40
60
80
100
120
Nat
ionw
ide
Inco
me
quin
tile
1In
com
e qu
intil
e 2
Inco
me
quin
tile
3In
com
e qu
intil
e 4
Inco
me
quin
tile
5
Dar
es
Sala
amO
ther
urb
an A
reas
Rura
l Are
as
Dod
oma
Aru
sha
and
Man
yara
Kilim
anja
roTa
nga
Mor
ogor
oPw
ani
Dar
Es
Sala
amLi
ndi
Mtw
ara
Ruvu
ma
Irin
gaM
beya
Sing
ida
Tabo
raRu
kwa
Kigo
ma
Shin
yang
aKa
gera
Mw
anza
Mar
a
HBS 2000-01 HBS 2007

Food Security and Nutrition Analysis of Tanzania Household Budget Surveys 2000/1 and 2007
0.0
0.2
0.4
0.6
0.8
1.0
1.2
1.4
1.6
1.8
2.0
Nat
ionw
ide
Inco
me
quin
tile
1
Inco
me
quin
tile
2
Inco
me
quin
tile
3
Inco
me
quin
tile
4
Inco
me
quin
tile
5
Dar
Es
Sala
am
Oth
er u
rban
Are
as
Rura
l Are
as
Dod
oma
Aru
sha
Kilim
anja
ro
Tang
a
Mor
ogor
o
Pwan
i
Dar
Es
Sala
am
Lind
i
Mtw
ara
Ruvu
ma
Irin
ga
Mbe
ya
Sing
ida
Tabo
ra
Rukw
a
Kigo
ma
Shin
yang
a
Kage
ra
Mw
anza
Mar
a
HBS 2000-01 HBS 2007
Food Security and Nutrition Analysis of Tanzania Household Budget Surveys 2000/1 and 2007
0.0
0.1
0.2
0.3
0.4
0.5
0.6
0.7
0.8
Nat
ionw
ide
Inco
me
quin
tile
1
Inco
me
quin
tile
2
Inco
me
quin
tile
3
Inco
me
quin
tile
4
Inco
me
quin
tile
5
Dar
Es
Sala
am
Oth
er u
rban
Are
as
Rura
l Are
as
Dod
oma
Aru
sha
Kilim
anja
ro
Tang
a
Mor
ogor
o
Pwan
i
Dar
Es
Sala
am
Lind
i
Mtw
ara
Ruvu
ma
Irin
ga
Mbe
ya
Sing
ida
Tabo
ra
Rukw
a
Kigo
ma
Shin
yang
a
Kage
ra
Mw
anza
Mar
a
HBS 2000-01 HBS 2007
0
5
10
15
20
25
Nat
ionw
ide
Inco
me
quin
tile
1
Inco
me
quin
tile
2
Inco
me
quin
tile
3
Inco
me
quin
tile
4
Inco
me
quin
tile
5
Dar
Es
Sala
am
Oth
er u
rban
Are
as
Rura
l Are
as
Dod
oma
Aru
sha
Kilim
anja
ro
Tang
a
Mor
ogor
o
Pwan
i
Dar
Es
Sala
am
Lind
i
Mtw
ara
Ruvu
ma
Irin
ga
Mbe
ya
Sing
ida
Tabo
ra
Rukw
a
Kigo
ma
Shin
yang
a
Kage
ra
Mw
anza
Mar
a
HBS 2000-01 HBS 2007

Food Security and Nutrition Analysis of Tanzania Household Budget Surveys 2000/1 and 2007
0
50
100
150
200
250N
atio
nwid
e
Inco
me
quin
tile
1
Inco
me
quin
tile
2
Inco
me
quin
tile
3
Inco
me
quin
tile
4
Inco
me
quin
tile
5
Dar
Es
Sala
am
Oth
er u
rban
Are
as
Rura
l Are
as
Dod
oma
Aru
sha
Kilim
anja
ro
Tang
a
Mor
ogor
o
Pwan
i
Dar
Es
Sala
am
Lind
i
Mtw
ara
Ruvu
ma
Irin
ga
Mbe
ya
Sing
ida
Tabo
ra
Rukw
a
Kigo
ma
Shin
yang
a
Kage
ra
Mw
anza
Mar
a
HBS 2000-01 HBS 2007

Food Security and Nutrition Analysis of Tanzania Household Budget Surveys 2000/1 and 2007
0
20
40
60
80
100
120
140
Nat
ionw
ide
Inco
me
quin
tile
1
Inco
me
quin
tile
2
Inco
me
quin
tile
3
Inco
me
quin
tile
4
Inco
me
quin
tile
5
Dar
Es
Sala
am
Oth
er u
rban
Are
as
Rura
l Are
as
Dod
oma
Aru
sha
Kilim
anja
ro
Tang
a
Mor
ogor
o
Pwan
i
Dar
Es
Sala
am
Lind
i
Mtw
ara
Ruvu
ma
Irin
ga
Mbe
ya
Sing
ida
Tabo
ra
Rukw
a
Kigo
ma
Shin
yang
a
Kage
ra
Mw
anza
Mar
a
HBS 2000-01 HBS 2007
0
500
1000
1500
2000
2500
3000
3500
Nat
ionw
ide
Inco
me
quin
tile
1
Inco
me
quin
tile
2
Inco
me
quin
tile
3
Inco
me
quin
tile
4
Inco
me
quin
tile
5
Dar
Es
Sala
am
Oth
er u
rban
Are
as
Rura
l Are
as
Dod
oma
Aru
sha
Kilim
anja
ro
Tang
a
Mor
ogor
o
Pwan
i
Dar
Es
Sala
am
Lind
i
Mtw
ara
Ruvu
ma
Irin
ga
Mbe
ya
Sing
ida
Tabo
ra
Rukw
a
Kigo
ma
Shin
yang
a
Kage
ra
Mw
anza
Mar
aHBS 2000-01 HBS 2007
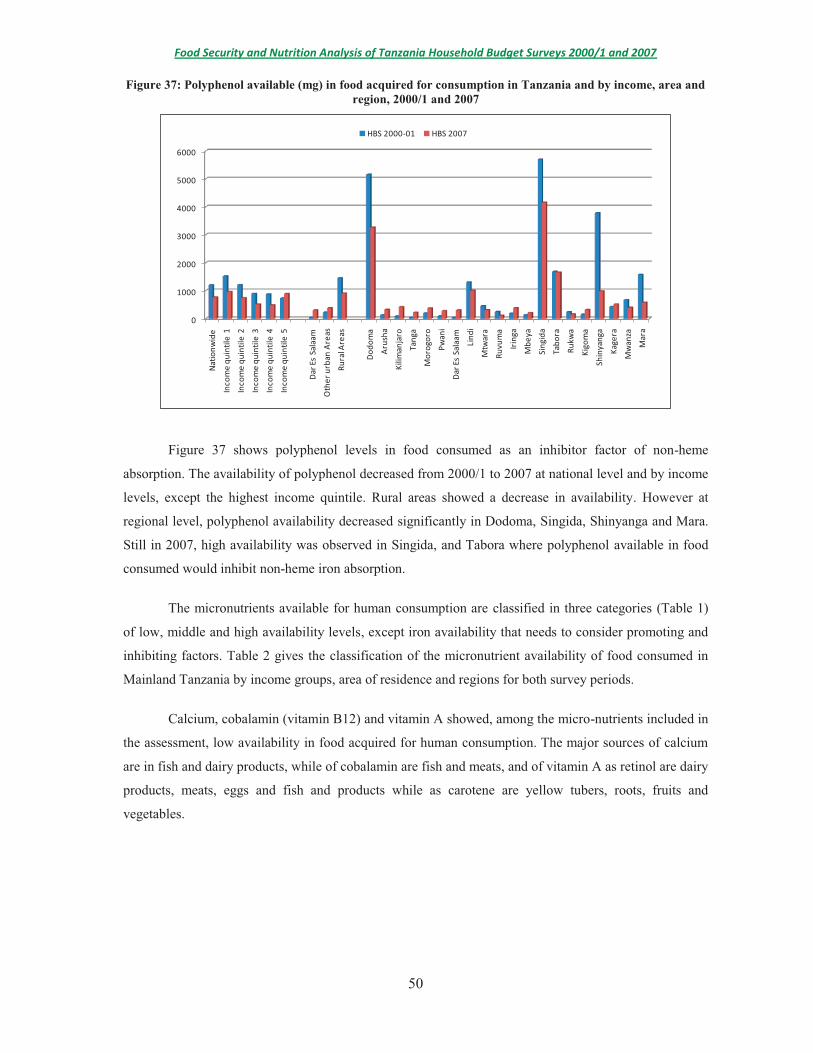
Food Security and Nutrition Analysis of Tanzania Household Budget Surveys 2000/1 and 2007
0
1000
2000
3000
4000
5000
6000
Nat
ionw
ide
Inco
me
quin
tile
1
Inco
me
quin
tile
2
Inco
me
quin
tile
3
Inco
me
quin
tile
4
Inco
me
quin
tile
5
Dar
Es
Sala
am
Oth
er u
rban
Are
as
Rura
l Are
as
Dod
oma
Aru
sha
Kilim
anja
ro
Tang
a
Mor
ogor
o
Pwan
i
Dar
Es
Sala
am
Lind
i
Mtw
ara
Ruvu
ma
Irin
ga
Mbe
ya
Sing
ida
Tabo
ra
Rukw
a
Kigo
ma
Shin
yang
a
Kage
ra
Mw
anza
Mar
a
HBS 2000-01 HBS 2007

Food Security and Nutrition Analysis of Tanzania Household Budget Surveys 2000/1 and 2007
HBS 2000-01 HBS 2007 HBS 2000-01 HBS 2007 HBS 2000-01 HBS 2007 HBS 2000-01 HBS 2007 HBS 2000-01 HBS 2007 HBS 2000-01 HBS 2007 HBS 2000-01 HBS 2007Nationwide 1 1 1 1 1 1 1 1 3 1 1 1 3 3Income quintile 1 1 1 1 1 1 1 1 1 3 2 1 1 3 3Income quintile 2 1 1 1 1 1 1 1 1 3 1 1 1 3 3Income quintile 3 1 1 1 1 1 1 1 1 3 1 1 1 3 3Income quintile 4 1 1 1 1 1 1 1 1 2 1 1 1 3 3Income quintile 5 1 1 1 1 1 1 1 1 2 1 1 1 3 1Dar es Salaam (C) 2 2 1 1 1 1 1 1 3 1 1 1 3 3Other urban Areas 1 1 1 1 1 1 1 1 3 1 1 1 3 3Rural Areas 1 1 1 1 1 1 1 1 3 1 1 1 3 3Dodoma 2 1 1 1 1 1 1 1 3 3 1 1 3 3Arusha and Manyara 2 2 1 1 1 1 1 1 3 2 1 1 3 3Kilimanjaro 2 1 1 1 1 1 1 1 3 1 1 1 3 3Tanga 2 1 1 1 1 1 1 1 3 1 1 1 3 3Morogoro 2 1 1 1 1 1 1 1 3 1 1 1 3 3Pwani 2 1 1 1 1 1 1 1 3 2 1 1 3 3Dar Es Salaam 2 2 1 1 1 1 1 1 3 1 1 1 3 3Lindi 2 2 1 1 1 1 1 1 3 1 1 1 3 3Mtwara 3 1 1 1 1 1 1 1 3 2 1 1 3 3Ruvuma 1 1 1 1 1 1 1 1 3 1 1 1 3 3Iringa 1 1 1 1 1 1 1 1 3 1 1 1 3 1Mbeya 1 1 1 1 1 1 1 1 3 1 1 1 3 3Singida 2 1 1 1 1 1 1 1 3 1 1 1 3 3Tabora 1 1 1 1 1 1 1 1 3 1 1 1 3 3Rukwa 2 1 1 1 1 1 1 1 3 1 1 1 3 3Kigoma 1 1 1 1 1 1 1 1 3 1 1 1 3 3Shinyanga 1 1 1 1 1 1 1 1 3 1 1 1 3 3Kagera 1 1 1 1 1 1 1 1 2 1 1 1 3 3Mwanza 1 1 1 1 1 1 1 1 2 1 1 1 3 3Mara 1 1 1 1 1 1 1 1 2 1 1 1 3 3
Category 1: High availabilityCategory 2: Medium availabilityCategory 3: Low availability
Vitamin C CalciumCategories and Groupings
Vitamin A Vitamin B1 Vitamin B2 Vitamin B6 Vitamin B12

Food Security and Nutrition Analysis of Tanzania Household Budget Surveys 2000/1 and 2007
Item group Retinol Beta
caroteno RAE of
vitamin A animal
iron
non animal
iron heme iron
non heme iron
vitamin C
vitamin B1
vitamin B2
vitamin B6 vitamin B12 calcium
mcg/person/day mg/person/dayROOTS AND TUBERS AND PRODUCTS 0 9141 762 0,00 1,6 0,00 1,6 52 0,2 0,2 0,5 0,0 45VEGETABLES AND PRODUCTS 0 2333 202 0,00 2,3 0,00 2,3 47 1,1 3,0 0,3 0,0 87FRUITS AND PRODUCTS 0 704 61 0,00 0,4 0,00 0,4 24 0,1 0,1 0,2 0,0 12CEREALS AND PRODUCTS 0 106 11 0,00 6,8 0,00 6,8 0 0,8 0,3 1,1 0,0 39SPICES 0 18 2 0,00 0,1 0,00 0,1 0 0,0 0,0 0,0 0,0 19PULSES 0 11 1 0,00 1,9 0,00 1,9 1 0,2 0,1 0,1 0,0 25OIL CROPS 0 2 0 0,00 1,4 0,00 1,4 1 0,0 0,0 0,0 0,0 27NON ALCOHOLIC BEVERAGES 0 0 0 0,00 0,0 0,00 0,0 0 0,0 0,0 0,0 0,0 1MILK AND CHEESE 33 0 33 0,10 0,0 0,00 0,1 0 0,0 0,1 0,0 0,2 55MEAT 7 0 7 0,32 0,0 0,17 0,1 0 0,0 0,0 0,1 0,4 2EGGS 6 0 6 0,04 0,0 0,00 0,0 0 0,0 0,0 0,0 0,0 2FISH AND FISH PRODUCTS 4 0 4 0,34 0,0 0,12 0,2 2 0,0 0,0 0,1 1,9 156OILS AND FATS (aninal fats) 0 0 0 0,00 0,0 0,00 0,0 0 0,0 0,0 0,0 0,0 0SUGARS AND SYRUPS AND PRODUCTS 0 0 0 0,00 0,1 0,00 0,1 0 0,0 0,0 0,0 0,0 13ALCOHOLIC BEVERAGES 0 0 0 0,00 0,0 0,00 0,0 0 0,0 0,0 0,1 0,0 3TREE NUTS 0 0 0 0,00 0,0 0,00 0,0 0 0,0 0,0 0,0 0,0 1STIMULANTS 0 0 0 0,00 0,0 0,00 0,0 0 0,0 0,0 0,0 0,0 0OILS AND FATS (vegetable oils) 0 0 0 0,00 0,0 0,00 0,0 0 0,0 0,0 0,0 0,0 0
50 12316 1088 0,80 15 0,29 15 127 2,4 3,9 2,4 2,5 486
mcg/person/day mg/person/day

Food Security and Nutrition Analysis of Tanzania Household Budget Surveys 2000/1 and 2007

Food Security and Nutrition Analysis of Tanzania Household Budget Surveys 2000/1 and 2007

Food Security and Nutrition Analysis of Tanzania Household Budget Surveys 2000/1 and 2007
HBS 2000-010 50 100 150 200 250
Lysine
Valine
Isoleucine
Leucine
Methionine andCysteine
Threonine
Histidine
Phenylalanine andTyrosine
Tryptophan
PDCAAS using Estimated PatternPDCAAS using Pre School Children Pattern (1-2 years)PDCAAS using Children and Adolescents Pattern (3-18 years)PDCAAS using Adults Pattern (>18 years)
HBS 20070 50 100 150 200 250
Lysine
Valine
Isoleucine
Leucine
Methionine andCysteine
Threonine
Histidine
Phenylalanine andTyrosine
Tryptophan
PDCAAS using Estimated PatternPDCAAS using Pre School Children Pattern (1-2 years)PDCAAS using Children and Adolescents Pattern (3-18 years)PDCAAS using Adults Pattern (>18 years)

Food Security and Nutrition Analysis of Tanzania Household Budget Surveys 2000/1 and 2007
0 50 100 150
Nationwide
Income quintile 1
Income quintile 2
Income quintile 3
Income quintile 4
Income quintile 5
2000/01 2007
0
20
40
60
80
100
120
Lysine PDCAAS using the preschool pattern
HBS 2000-01 HBS 2007

Food Security and Nutrition Analysis of Tanzania Household Budget Surveys 2000/1 and 2007
0
20
40
60
80
100
120
140
Lysine PDCAAS using the population based pattern
HBS 2000-01 HBS 2007
0 20 40 60 80 100
Nationwide
Income quintile 1
Income quintile 2
Income quintile 3
Income quintile 4
Income quintile 5
2000/01 2007

Food Security and Nutrition Analysis of Tanzania Household Budget Surveys 2000/1 and 2007
0
20
40
60
80
Nat
ionw
ide
Dod
oma
Aru
sha
and
Man
yara
Kilim
anja
ro
Tang
a
Mor
ogor
o
Pwan
i
Dar
Es S
alaa
m
Lind
i
Mtw
ara
Ruvu
ma
Irin
ga
Mbe
ya
Sing
ida
Tabo
ra
Rukw
a
Kigo
ma
Shin
yang
a
Kage
ra
Mw
anza
Mar
a
Estimated digested protein (grams) in Tanzania and by region
HBS 2000-01 HBS 2007

Food Security and Nutrition Analysis of Tanzania Household Budget Surveys 2000/1 and 2007
0
5000
10000
15000
20000
25000
30000
35000
40000
Nat
ionw
ide
Inco
me
quin
tile
1
Inco
me
quin
tile
2
Inco
me
quin
tile
3
Inco
me
quin
tile
4
Inco
me
quin
tile
5
Dar
es
Sala
am
Oth
er u
rban
Are
as
Rura
l Are
as
Dod
oma
Aru
sha
and
Man
yara
Kilim
anja
ro
Tang
a
Mor
ogor
o
Pwan
i
Dar
Es
Sala
am
Lind
i
Mtw
ara
Ruvu
ma
Irin
ga
Mbe
ya
Sing
ida
Tabo
ra
Rukw
a
Kigo
ma
Shin
yang
a
Kage
ra
Mw
anza
Mar
a
HBS 2000-01 HBS 2007

Food Security and Nutrition Analysis of Tanzania Household Budget Surveys 2000/1 and 2007
Food Security and Nutrition Analysis of Tanzania Household Budget Surveys 2000/1 and 2007

Food Security and Nutrition Analysis of Tanzania Household Budget Surveys 2000/1 and 2007
Food Security and Nutrition Analysis of Tanzania Household Budget Surveys 2000/1 and 2007
Food Security and Nutrition Analysis of Tanzania Household Budget Surveys 2000/1 and 2007
Food Security and Nutrition Analysis of Tanzania Household Budget Surveys 2000/1 and 2007

Food Security and Nutrition Analysis of Tanzania Household Budget Surveys 2000/1 and 2007

Food Security and Nutrition Analysis of Tanzania Household Budget Surveys 2000/1 and 2007

Food Security and Nutrition Analysis of Tanzania Household Budget Surveys 2000/1 and 2007
2000/1 HBS 2007 HBS 2000/1 HBS 2007 HBS 2000/1 HBS
2007 HBS
Mainland Tanzania 23 23 1434 1429 257 262Income level
Quintile 1 42 47 1458 1436Quintile 2 10 8 1544 1553Quintile 3 3 3 1603 1602Quintile 4 1 1 1635 1646Quintile 5 0 0 1663 1724
Area Dar Es Salaam 42 21 1378 1504 404 274 Other urban areas 28 23 1436 1441 290 277 Rural areas 21 23 1438 1419 241 257
Household size One person 6 10 1738 1805 285 243 2 to 3 people 10 13 1570 1527 214 2494 and 5 people 15 19 1469 1444 202 2306 and 7 people 22 24 1433 1429 224 2418 people and over 31 27 1442 1405 236 254
Gender of Head ofHH Male 21 22 1465 1445 235 255 Female 24 23 1388 1392 267 263
Age of Head of HH Less than 35 years 13 17 1430 1395 205 22635 to 45 years 22 22 1446 1434 235 23946 to 60 years 26 25 1478 1479 267 275 60 years & over 31 27 1418 1403 290 299
Region Dodoma 7 30 1503 1412 160 259 Arusha and Manyara 36 33 1417 1437 278 278 Kilimanjaro 33 12 1396 1508 314 211 Tanga 25 10 1466 1494 255 187 Morogoro 21 10 1462 1502 254 216 Pwani 38 29 1382 1399 328 300 Dar Es Salaam 42 21 1378 1504 404 274 Lindi 21 31 1412 1387 298 356 Mtwara 23 33 1461 1449 278 304 Ruvuma 37 29 1404 1393 317 311 Iringa 18 10 1469 1462 255 212 Mbeya 14 11 1446 1479 249 211 Singida 37 26 1386 1433 330 262 Tabora 4 25 1531 1364 153 286 Rukwa 24 36 1421 1305 251 328 Kigoma 25 30 1403 1366 264 287 Shinyanga 11 14 1476 1458 186 206 Kagera 24 32 1386 1353 247 297 Mwanza 34 33 1386 1424 274 263 Mara 44 47 1254 1237 396 400
Proportion of food deprivation in total population (%)
as defined by FAO
Dietary energy consumption in food deprived population
Depth of hunger (kcal/person/day)Population
Groupings
Food Security and Nutrition Analysis of Tanzania Household Budget Surveys 2000/1 and 2007
2000/1 HBS 2007 HBS 2000/1 HBS 2007 HBS 2000/1 HBS 2007 HBS
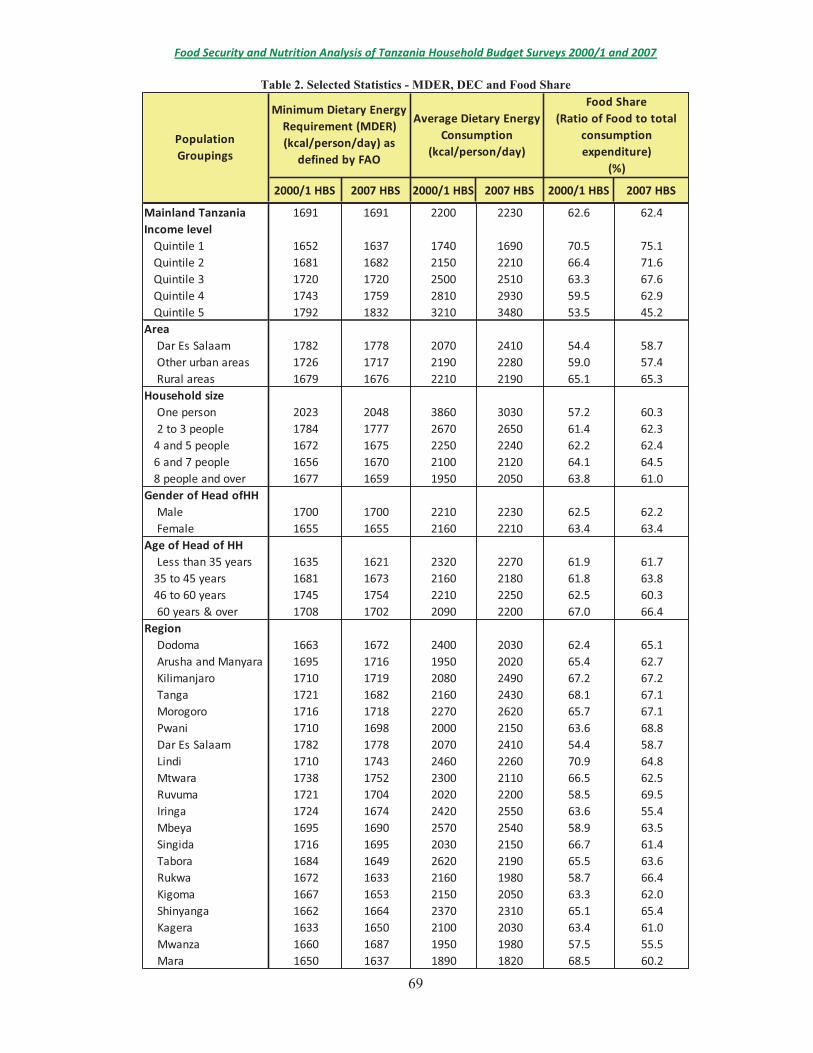
Mainland Tanzania 1691 1691 2200 2230 62.6 62.4Income level
Quintile 1 1652 1637 1740 1690 70.5 75.1Quintile 2 1681 1682 2150 2210 66.4 71.6Quintile 3 1720 1720 2500 2510 63.3 67.6Quintile 4 1743 1759 2810 2930 59.5 62.9Quintile 5 1792 1832 3210 3480 53.5 45.2
Area Dar Es Salaam 1782 1778 2070 2410 54.4 58.7 Other urban areas 1726 1717 2190 2280 59.0 57.4 Rural areas 1679 1676 2210 2190 65.1 65.3
Household size One person 2023 2048 3860 3030 57.2 60.3 2 to 3 people 1784 1777 2670 2650 61.4 62.34 and 5 people 1672 1675 2250 2240 62.2 62.46 and 7 people 1656 1670 2100 2120 64.1 64.58 people and over 1677 1659 1950 2050 63.8 61.0
Gender of Head ofHH Male 1700 1700 2210 2230 62.5 62.2 Female 1655 1655 2160 2210 63.4 63.4
Age of Head of HH Less than 35 years 1635 1621 2320 2270 61.9 61.735 to 45 years 1681 1673 2160 2180 61.8 63.846 to 60 years 1745 1754 2210 2250 62.5 60.3 60 years & over 1708 1702 2090 2200 67.0 66.4
Region Dodoma 1663 1672 2400 2030 62.4 65.1 Arusha and Manyara 1695 1716 1950 2020 65.4 62.7 Kilimanjaro 1710 1719 2080 2490 67.2 67.2 Tanga 1721 1682 2160 2430 68.1 67.1 Morogoro 1716 1718 2270 2620 65.7 67.1 Pwani 1710 1698 2000 2150 63.6 68.8 Dar Es Salaam 1782 1778 2070 2410 54.4 58.7 Lindi 1710 1743 2460 2260 70.9 64.8 Mtwara 1738 1752 2300 2110 66.5 62.5 Ruvuma 1721 1704 2020 2200 58.5 69.5 Iringa 1724 1674 2420 2550 63.6 55.4 Mbeya 1695 1690 2570 2540 58.9 63.5 Singida 1716 1695 2030 2150 66.7 61.4 Tabora 1684 1649 2620 2190 65.5 63.6 Rukwa 1672 1633 2160 1980 58.7 66.4 Kigoma 1667 1653 2150 2050 63.3 62.0 Shinyanga 1662 1664 2370 2310 65.1 65.4 Kagera 1633 1650 2100 2030 63.4 61.0 Mwanza 1660 1687 1950 1980 57.5 55.5 Mara 1650 1637 1890 1820 68.5 60.2
Minimum Dietary Energy Requirement (MDER) (kcal/person/day) as
defined by FAO
Average Dietary Energy Consumption
(kcal/person/day)
Food Share (Ratio of Food to total
consumption expenditure)
(%)
Population Groupings
Food Security and Nutrition Analysis of Tanzania Household Budget Surveys 2000/1 and 2007
2000/1 HBS 2007 HBS 2000/1 HBS 2007 HBS 2000/1 HBS 2007 HBS
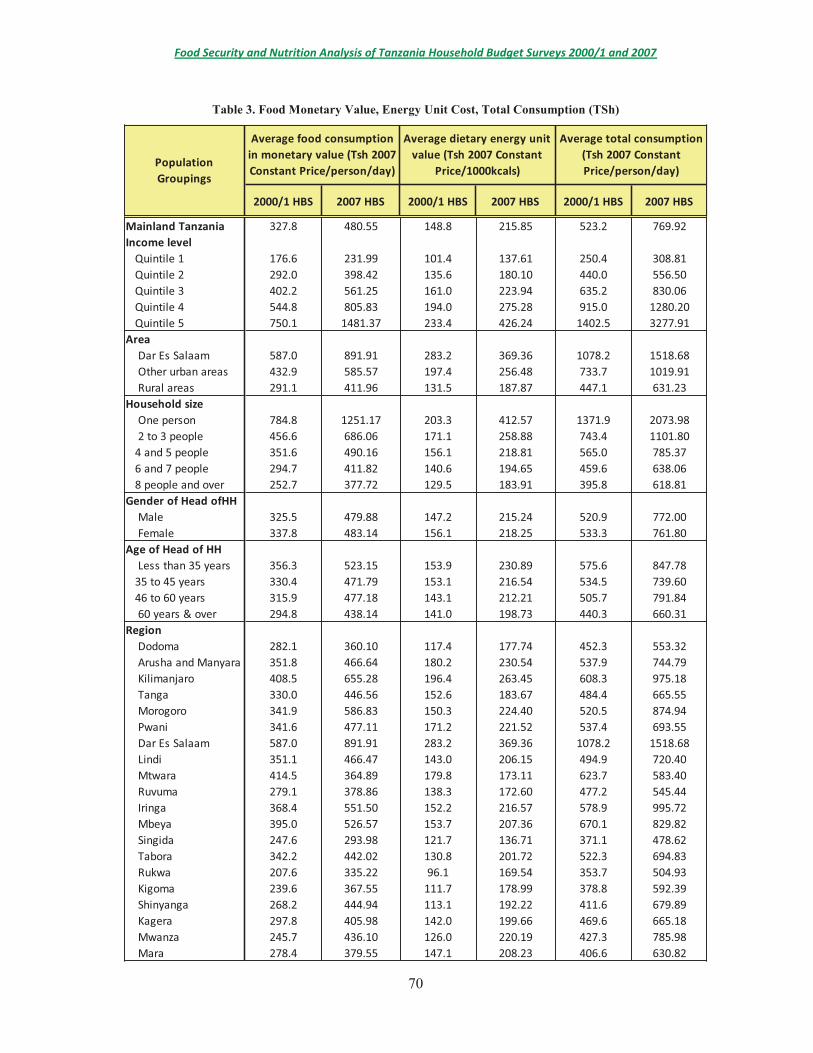
Mainland Tanzania 327.8 480.55 148.8 215.85 523.2 769.92Income level
Quintile 1 176.6 231.99 101.4 137.61 250.4 308.81Quintile 2 292.0 398.42 135.6 180.10 440.0 556.50Quintile 3 402.2 561.25 161.0 223.94 635.2 830.06Quintile 4 544.8 805.83 194.0 275.28 915.0 1280.20Quintile 5 750.1 1481.37 233.4 426.24 1402.5 3277.91
Area Dar Es Salaam 587.0 891.91 283.2 369.36 1078.2 1518.68 Other urban areas 432.9 585.57 197.4 256.48 733.7 1019.91 Rural areas 291.1 411.96 131.5 187.87 447.1 631.23
Household size One person 784.8 1251.17 203.3 412.57 1371.9 2073.98 2 to 3 people 456.6 686.06 171.1 258.88 743.4 1101.804 and 5 people 351.6 490.16 156.1 218.81 565.0 785.376 and 7 people 294.7 411.82 140.6 194.65 459.6 638.068 people and over 252.7 377.72 129.5 183.91 395.8 618.81
Gender of Head ofHH Male 325.5 479.88 147.2 215.24 520.9 772.00 Female 337.8 483.14 156.1 218.25 533.3 761.80
Age of Head of HH Less than 35 years 356.3 523.15 153.9 230.89 575.6 847.7835 to 45 years 330.4 471.79 153.1 216.54 534.5 739.6046 to 60 years 315.9 477.18 143.1 212.21 505.7 791.84 60 years & over 294.8 438.14 141.0 198.73 440.3 660.31
Region Dodoma 282.1 360.10 117.4 177.74 452.3 553.32 Arusha and Manyara 351.8 466.64 180.2 230.54 537.9 744.79 Kilimanjaro 408.5 655.28 196.4 263.45 608.3 975.18 Tanga 330.0 446.56 152.6 183.67 484.4 665.55 Morogoro 341.9 586.83 150.3 224.40 520.5 874.94 Pwani 341.6 477.11 171.2 221.52 537.4 693.55 Dar Es Salaam 587.0 891.91 283.2 369.36 1078.2 1518.68 Lindi 351.1 466.47 143.0 206.15 494.9 720.40 Mtwara 414.5 364.89 179.8 173.11 623.7 583.40 Ruvuma 279.1 378.86 138.3 172.60 477.2 545.44 Iringa 368.4 551.50 152.2 216.57 578.9 995.72 Mbeya 395.0 526.57 153.7 207.36 670.1 829.82 Singida 247.6 293.98 121.7 136.71 371.1 478.62 Tabora 342.2 442.02 130.8 201.72 522.3 694.83 Rukwa 207.6 335.22 96.1 169.54 353.7 504.93 Kigoma 239.6 367.55 111.7 178.99 378.8 592.39 Shinyanga 268.2 444.94 113.1 192.22 411.6 679.89 Kagera 297.8 405.98 142.0 199.66 469.6 665.18 Mwanza 245.7 436.10 126.0 220.19 427.3 785.98 Mara 278.4 379.55 147.1 208.23 406.6 630.82
Population Groupings
Average food consumption in monetary value (Tsh 2007 Constant Price/person/day)
Average dietary energy unit value (Tsh 2007 Constant
Price/1000kcals)
Average total consumption (Tsh 2007 Constant Price/person/day)

Food Security and Nutrition Analysis of Tanzania Household Budget Surveys 2000/1 and 2007
2000/1 HBS 2007 HBS 2000/1 HBS 2007 HBS 2000/1 HBS 2007 HBS 2000/1 HBS 2007 HBS
Mainland Tanzania 65.4 67.4 26.4 23.6 4.2 4.4 4.0 4.6Income level
Quintile 1 50.9 50.2 42.4 42.3 1.9 1.2 4.8 6.3Quintile 2 59.4 61.1 33.8 31.6 2.5 2.1 4.3 5.2Quintile 3 68.8 71.0 24.0 21.4 3.2 3.0 4.0 4.6Quintile 4 74.7 76.1 17.1 14.1 5.1 5.7 3.1 4.1Quintile 5 76.8 77.7 9.6 8.9 9.9 10.2 3.7 3.1
Area Dar Es Salaam 83.7 84.9 0.4 0.9 13.3 12.5 2.6 1.7 Other urban areas 85.2 83.0 7.0 7.5 5.0 6.0 2.9 3.6 Rural areas 57.7 58.1 35.1 34.2 2.7 2.0 4.5 5.7
Household size One person 62.3 63.9 12.6 6.3 20.6 25.2 4.6 4.7 2 to 3 people 68.2 73.7 23.3 16.2 4.2 5.1 4.4 5.04 and 5 people 67.5 70.7 25.1 21.7 3.7 3.1 3.7 4.56 and 7 people 64.9 66.0 27.2 27.2 3.4 2.5 4.5 4.38 people and over 61.8 59.9 31.9 33.2 2.8 2.1 3.5 4.8
Gender of Head ofHH Male 65.3 66.8 26.5 24.1 4.5 4.8 3.7 4.3 Female 65.8 69.4 25.9 21.7 3.1 3.1 5.1 5.7
Age of Head of HH Less than 35 years 66.6 69.8 23.0 18.4 6.1 7.6 4.2 4.135 to 45 years 68.8 70.4 23.8 21.4 4.0 4.1 3.5 4.146 to 60 years 63.0 66.5 30.1 26.0 3.2 3.0 3.8 4.5 60 years & over 59.5 58.9 32.1 31.7 3.1 2.3 5.3 7.1
Region Dodoma 56.9 66.5 35.2 25.1 3.2 3.1 4.6 5.4 Arusha and Manyara 73.1 62.8 20.6 27.6 2.9 4.7 3.3 4.8 Kilimanjaro 73.8 73.0 20.5 18.7 3.0 3.5 2.7 4.8 Tanga 63.9 63.3 31.0 27.3 1.8 3.7 3.3 5.7 Morogoro 62.4 69.3 29.4 22.1 2.9 3.9 5.2 4.7 Pwani 76.6 75.0 12.6 15.6 4.0 3.9 6.8 5.5 Dar Es Salaam 83.7 84.9 0.4 0.9 13.3 12.5 2.6 1.7 Lindi 58.8 54.8 32.5 35.4 2.5 2.9 6.2 6.9 Mtwara 56.7 70.2 31.0 21.3 6.1 3.2 6.2 5.3 Ruvuma 50.6 54.1 35.7 32.1 4.7 3.5 9.0 10.4 Iringa 63.4 68.0 29.5 25.0 2.1 2.3 5.0 4.7 Mbeya 64.2 66.3 27.9 25.8 4.8 2.8 3.1 5.1 Singida 58.7 63.9 36.3 30.3 1.9 0.9 3.1 4.9 Tabora 57.4 58.9 38.3 37.6 2.1 1.3 2.2 2.2 Rukwa 59.3 65.5 32.5 28.1 2.7 2.3 5.5 4.0 Kigoma 65.5 63.5 27.2 23.9 2.8 3.2 4.5 9.3 Shinyanga 48.7 50.4 46.6 43.1 2.1 2.5 2.5 4.0 Kagera 58.7 56.4 31.6 31.3 2.3 2.0 7.4 10.3 Mwanza 76.1 67.9 19.6 25.2 2.8 4.3 1.6 2.6 Mara 74.0 77.8 15.7 14.1 6.7 2.3 3.6 5.8
Share of food from other sources to total food expenditure (%)
Population Groupings
Share of food purchases to total food expenditure
(%)
Share of food from own production to
total food expenditure (%)
Share of food eaten away from home to
total food expenditure (%)

Food Security and Nutrition Analysis of Tanzania Household Budget Surveys 2000/1 and 2007
2000/1 HBS 2007 HBS 2000/1 HBS 2007 HBS 2000/1 HBS 2007 HBS 2000/1 HBS 2007 HBS
Mainland Tanzania 52.5 53.4 40.0 39.9 3.5 2.9 4.0 3.9Income level
Quintile 1 40.3 37.1 53.5 57.3 1.9 1.2 4.4 4.4Quintile 2 48.7 49.2 44.7 44.7 2.5 1.9 4.1 4.2Quintile 3 58.3 61.2 34.7 32.5 3.0 2.6 4.0 3.7Quintile 4 65.1 67.9 26.2 23.9 5.0 5.0 3.7 3.3Quintile 5 68.4 73.7 18.2 15.9 9.9 7.6 3.6 2.9
Area Dar Es Salaam 83.8 87.6 0.5 0.9 13.7 9.7 2.1 1.7 Other urban areas 79.2 78.5 12.5 14.0 5.3 4.3 3.0 3.2 Rural areas 45.8 43.2 47.3 50.8 2.6 1.7 4.4 4.3
Household size One person 53.8 61.4 18.6 16.4 22.1 16.7 5.5 5.5 2 to 3 people 55.0 59.6 36.3 31.7 3.6 4.3 5.1 4.44 and 5 people 53.9 56.0 39.2 37.7 3.1 2.3 3.8 4.16 and 7 people 52.3 51.9 40.6 42.8 2.8 1.9 4.3 3.48 people and over 49.6 47.2 44.7 47.1 2.4 1.9 3.3 3.7
Gender of Head ofHH Male 52.5 53.1 39.8 40.3 3.8 3.0 3.9 3.6 Female 52.1 54.6 40.6 38.1 2.5 2.2 4.8 5.0
Age of Head of HH Less than 35 years 53.5 56.3 37.6 35.6 4.8 4.4 4.1 3.635 to 45 years 55.8 57.2 37.2 36.7 3.4 2.7 3.6 3.446 to 60 years 50.4 51.7 42.9 42.4 2.8 2.3 3.9 3.7 60 years & over 47.4 45.6 44.5 46.8 2.8 1.9 5.3 5.6
Region Dodoma 40.9 46.0 51.2 46.0 3.0 3.1 4.9 4.9 Arusha and Manyara 66.0 50.1 26.5 44.3 2.8 2.6 4.7 3.0 Kilimanjaro 69.2 60.4 23.8 33.7 3.8 2.2 3.2 3.8 Tanga 56.2 49.5 39.1 44.1 1.6 2.7 3.1 3.7 Morogoro 49.7 56.3 42.0 36.3 2.6 2.9 5.7 4.5 Pwani 69.4 69.4 18.6 23.6 3.6 2.6 8.4 4.4 Dar Es Salaam 83.8 87.6 0.5 0.9 13.7 9.7 2.1 1.7 Lindi 46.2 43.5 44.8 47.6 2.1 2.0 7.0 6.9 Mtwara 43.2 50.1 44.7 42.0 5.8 2.6 6.2 5.4 Ruvuma 32.1 41.8 52.9 49.3 4.5 2.4 10.5 6.6 Iringa 49.6 45.4 43.5 48.0 1.9 1.9 5.0 4.8 Mbeya 54.5 51.8 37.9 41.3 4.8 2.2 2.8 4.7 Singida 41.5 43.8 52.9 52.1 2.1 0.9 3.5 3.2 Tabora 43.9 45.6 52.7 51.9 1.9 1.0 1.6 1.5 Rukwa 42.6 45.4 50.8 49.2 2.8 2.4 3.8 3.0 Kigoma 50.5 54.3 43.3 36.8 2.6 2.5 3.6 6.4 Shinyanga 34.9 41.1 60.7 54.1 1.9 2.1 2.5 2.7 Kagera 48.1 47.7 42.9 41.8 2.0 1.7 6.9 8.8 Mwanza 66.4 56.1 29.9 39.6 2.4 2.8 1.3 1.6 Mara 63.5 62.1 26.5 32.4 6.6 1.8 3.4 3.7
Share of DEC from other sources to total DEC (%)Population
Groupings
Share of DEC from purchases to total DEC
(%)
Share of DEC from own production to total DEC
(%)
Share of DEC from eaten away from home to total
DEC (%)

Food Security and Nutrition Analysis of Tanzania Household Budget Surveys 2000/1 and 2007
2000/1 HBS 2007 HBS 2000/1 HBS 2007 HBS 2000/1 HBS 2007 HBS
Area Dar Es Salaam 34.4 25.2 50.6 55.8 39.8 32.3 Other urban areas 26.3 26.7 47.4 54.9 32.6 32.9 Rural areas 23.2 25.0 46.5 63.3 29.6 31.0
Household size One person 30.9 16.6 49.9 61.1 38.6 28.4 2 to 3 people 20.2 25.1 47.4 66.4 28.9 32.54 and 5 people 18.7 22.2 45.6 58.9 26.4 29.06 and 7 people 20.1 22.2 48.5 54.6 26.9 28.58 people and over 17.4 23.0 42.5 60.1 25.1 29.2
Gender of Head ofHH Male 21.4 24.2 52.0 70.1 28.3 30.5 Female 26.4 26.7 56.6 72.3 32.4 32.7
Age of Head of HH Less than 35 years 21.7 24.5 54.9 74.8 28.4 30.535 to 45 years 21.5 22.8 52.1 66.4 28.2 29.146 to 60 years 22.9 24.2 51.5 71.7 29.9 31.0 60 years & over 25.6 29.1 46.6 61.9 31.6 34.6
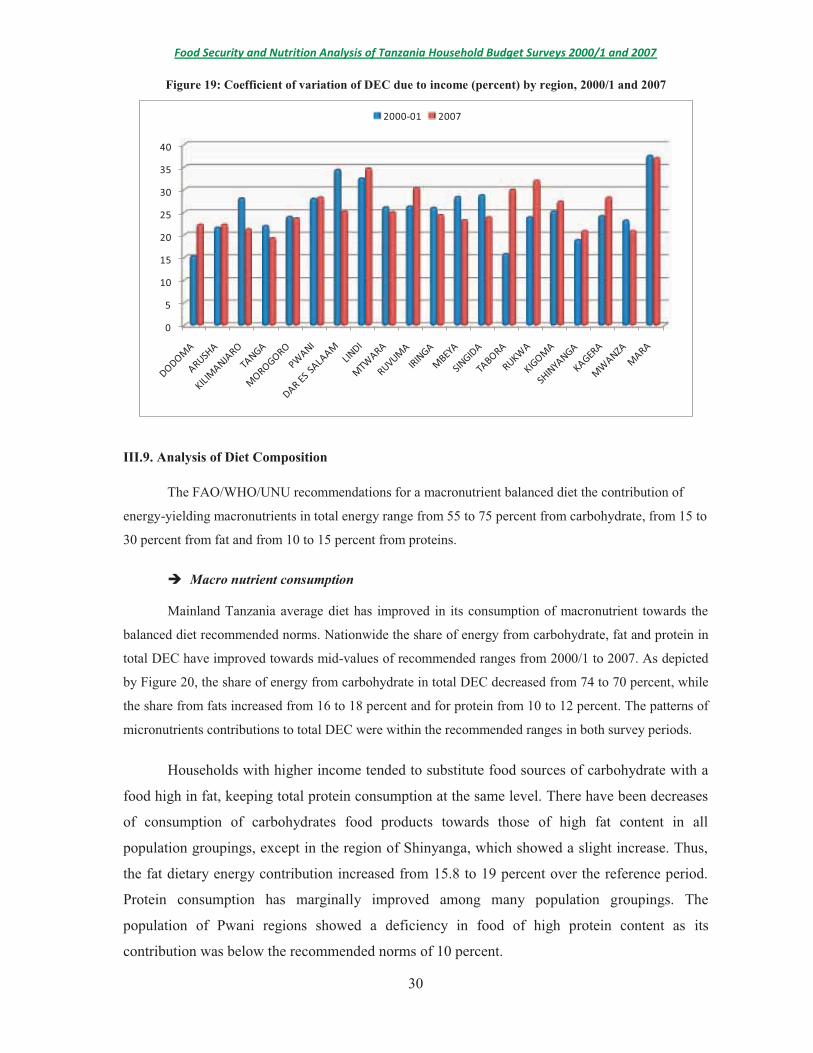
Region Dodoma 15.3 22.3 43.0 61.3 23.9 28.9 Arusha and Manyara 21.6 22.3 52.1 67.4 28.5 29.1 Kilimanjaro 28.1 21.3 44.3 57.5 33.8 28.6 Tanga 22.0 19.3 42.1 46.6 28.8 26.5 Morogoro 24.0 23.7 46.4 68.0 30.5 30.3 Pwani 28.0 28.3 49.3 60.9 33.7 34.0 Dar Es Salaam 34.4 25.2 50.6 55.8 39.8 32.3 Lindi 32.5 34.7 53.4 64.2 37.6 39.8 Mtwara 26.1 25.0 43.5 54.7 32.5 31.6 Ruvuma 26.3 30.4 51.6 70.7 32.5 35.6 Iringa 26.0 24.4 45.9 64.4 32.1 30.6 Mbeya 28.4 23.3 45.5 54.9 34.1 29.9 Singida 28.8 23.9 86.8 75.2 34.4 30.2 Tabora 15.8 30.0 39.6 109.6 24.4 35.0 Rukwa 23.9 32.0 41.3 58.1 30.1 36.7 Kigoma 25.2 27.4 50.3 52.6 31.3 32.8 Shinyanga 18.9 20.9 48.4 52.1 26.3 27.7 Kagera 24.2 28.3 44.4 51.3 30.1 33.6 Mwanza 23.2 20.9 53.3 57.3 29.4 27.9 Mara 37.5 37.0 53.9 69.5 41.6 41.2
Population Groupings
CV of DEC DUE TO Income (%)
CV of Food Consumption
Expenditure DUE TO income (%)
CV of DEC - FULL as defined by FAO (%)

Food Security and Nutrition Analysis of Tanzania Household Budget Surveys 2000/1 and 2007
2000/1 HBS 2007 HBS 2000/1 HBS 2007 HBS 2000/1 HBS 2007 HBS
Mainland Tanzania 10.4 11.6 15.8 18.3 73.8 70.0Income level
Quintile 1 10.5 11.8 12.5 14.8 77.1 73.4Quintile 2 10.4 11.6 15.2 16.6 74.4 71.8Quintile 3 10.1 11.5 16.7 19.7 73.2 68.9Quintile 4 10.4 11.6 18.7 21.8 71.0 66.7Quintile 5 10.4 11.7 21.7 25.3 67.9 63.0
Area Dar Es Salaam 10.4 11.2 22.6 24.3 67.0 64.5 Other urban areas 10.2 11.6 20.1 21.0 69.6 67.3 Rural areas 10.4 11.7 14.7 17.0 75.0 71.3
Household size One person 10.2 11.0 18.4 22.4 71.4 66.6 2 to 3 people 10.3 11.8 17.3 21.0 72.4 67.24 and 5 people 10.4 11.8 16.1 18.8 73.4 69.56 and 7 people 10.1 11.5 15.0 17.2 74.8 71.48 people and over 10.5 11.6 15.1 16.9 74.4 71.5
Gender of Head ofHH Male 10.3 11.7 15.7 18.2 74.0 70.1 Female 10.5 11.5 16.5 18.8 73.1 69.7
Age of Head of HH Less than 35 years 10.4 11.9 16.3 19.1 73.3 69.035 to 45 years 10.3 11.7 15.9 18.3 73.8 70.046 to 60 years 10.4 11.3 15.8 18.2 73.8 70.5 60 years & over 10.5 11.7 14.8 17.5 74.7 70.8
Region Dodoma 11.5 12.6 16.4 18.4 72.1 69.0 Arusha and Manyara 10.8 11.8 18.3 22.1 70.9 66.2 Kilimanjaro 8.9 10.5 17.9 22.2 73.2 67.4 Tanga 9.3 10.1 15.6 17.1 75.1 72.8 Morogoro 10.4 11.4 15.0 17.5 74.6 71.1 Pwani 9.8 9.8 16.9 17.8 73.3 72.3 Dar Es Salaam 10.4 11.2 22.6 24.3 67.0 64.5 Lindi 9.3 12.3 15.9 16.8 74.8 70.9 Mtwara 10.5 10.5 15.8 17.0 73.7 72.5 Ruvuma 10.0 11.9 13.7 16.8 76.3 71.3 Iringa 9.6 13.8 14.2 19.7 76.2 66.5 Mbeya 9.3 11.2 15.8 20.3 74.8 68.5 Singida 12.2 12.5 16.0 19.8 71.9 67.7 Tabora 11.2 13.5 18.7 17.9 70.1 68.6 Rukwa 9.3 11.8 12.5 16.2 78.2 72.0 Kigoma 9.7 11.1 14.3 18.5 76.0 70.3 Shinyanga 12.0 11.4 16.7 15.9 71.3 72.7 Kagera 9.1 11.1 12.1 14.3 78.8 74.6 Mwanza 11.0 11.6 13.8 15.1 75.3 73.3 Mara 10.6 12.0 12.8 13.9 76.5 74.1
Population Groupings
Share of DEC in total DEC coming from proteins
(%)
Share of DEC in total DEC coming from fats (%)
Share of DEC in total DEC coming from
carbohydrates, fiber and alcohol (%)
Food Security and Nutrition Analysis of Tanzania Household Budget Surveys 2000/1 and 2007
2000/1 HBS 2007 HBS 2000/1 HBS 2007 HBS 2000/1 HBS 2007 HBS
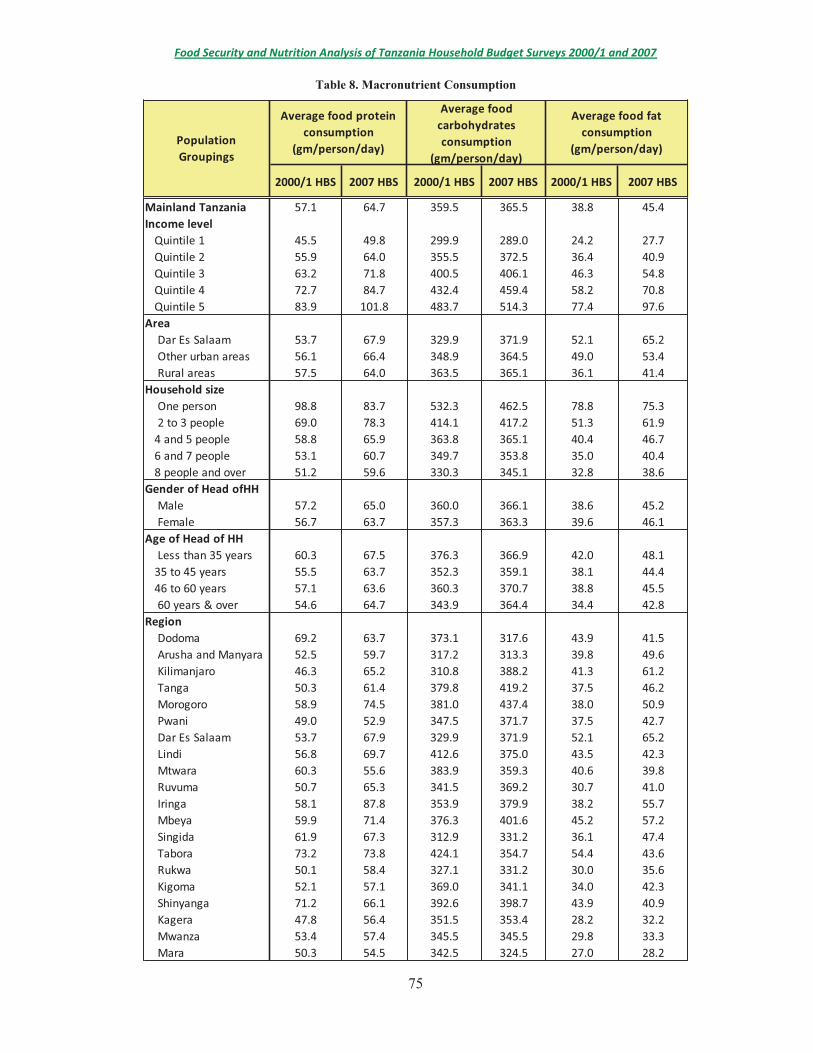
Mainland Tanzania 57.1 64.7 359.5 365.5 38.8 45.4Income level
Quintile 1 45.5 49.8 299.9 289.0 24.2 27.7Quintile 2 55.9 64.0 355.5 372.5 36.4 40.9Quintile 3 63.2 71.8 400.5 406.1 46.3 54.8Quintile 4 72.7 84.7 432.4 459.4 58.2 70.8Quintile 5 83.9 101.8 483.7 514.3 77.4 97.6
Area Dar Es Salaam 53.7 67.9 329.9 371.9 52.1 65.2 Other urban areas 56.1 66.4 348.9 364.5 49.0 53.4 Rural areas 57.5 64.0 363.5 365.1 36.1 41.4
Household size One person 98.8 83.7 532.3 462.5 78.8 75.3 2 to 3 people 69.0 78.3 414.1 417.2 51.3 61.94 and 5 people 58.8 65.9 363.8 365.1 40.4 46.76 and 7 people 53.1 60.7 349.7 353.8 35.0 40.48 people and over 51.2 59.6 330.3 345.1 32.8 38.6
Gender of Head ofHH Male 57.2 65.0 360.0 366.1 38.6 45.2 Female 56.7 63.7 357.3 363.3 39.6 46.1
Age of Head of HH Less than 35 years 60.3 67.5 376.3 366.9 42.0 48.135 to 45 years 55.5 63.7 352.3 359.1 38.1 44.446 to 60 years 57.1 63.6 360.3 370.7 38.8 45.5 60 years & over 54.6 64.7 343.9 364.4 34.4 42.8
Region Dodoma 69.2 63.7 373.1 317.6 43.9 41.5 Arusha and Manyara 52.5 59.7 317.2 313.3 39.8 49.6 Kilimanjaro 46.3 65.2 310.8 388.2 41.3 61.2 Tanga 50.3 61.4 379.8 419.2 37.5 46.2 Morogoro 58.9 74.5 381.0 437.4 38.0 50.9 Pwani 49.0 52.9 347.5 371.7 37.5 42.7 Dar Es Salaam 53.7 67.9 329.9 371.9 52.1 65.2 Lindi 56.8 69.7 412.6 375.0 43.5 42.3 Mtwara 60.3 55.6 383.9 359.3 40.6 39.8 Ruvuma 50.7 65.3 341.5 369.2 30.7 41.0 Iringa 58.1 87.8 353.9 379.9 38.2 55.7 Mbeya 59.9 71.4 376.3 401.6 45.2 57.2 Singida 61.9 67.3 312.9 331.2 36.1 47.4 Tabora 73.2 73.8 424.1 354.7 54.4 43.6 Rukwa 50.1 58.4 327.1 331.2 30.0 35.6 Kigoma 52.1 57.1 369.0 341.1 34.0 42.3 Shinyanga 71.2 66.1 392.6 398.7 43.9 40.9 Kagera 47.8 56.4 351.5 353.4 28.2 32.2 Mwanza 53.4 57.4 345.5 345.5 29.8 33.3 Mara 50.3 54.5 342.5 324.5 27.0 28.2
Population Groupings
Average food protein consumption
(gm/person/day)
Average food carbohydrates consumption
(gm/person/day)
Average food fat consumption
(gm/person/day)
Food Security and Nutrition Analysis of Tanzania Household Budget Surveys 2000/1 and 2007
2000/1 HBS 2007 HBS 2000/1 HBS 2007 HBS
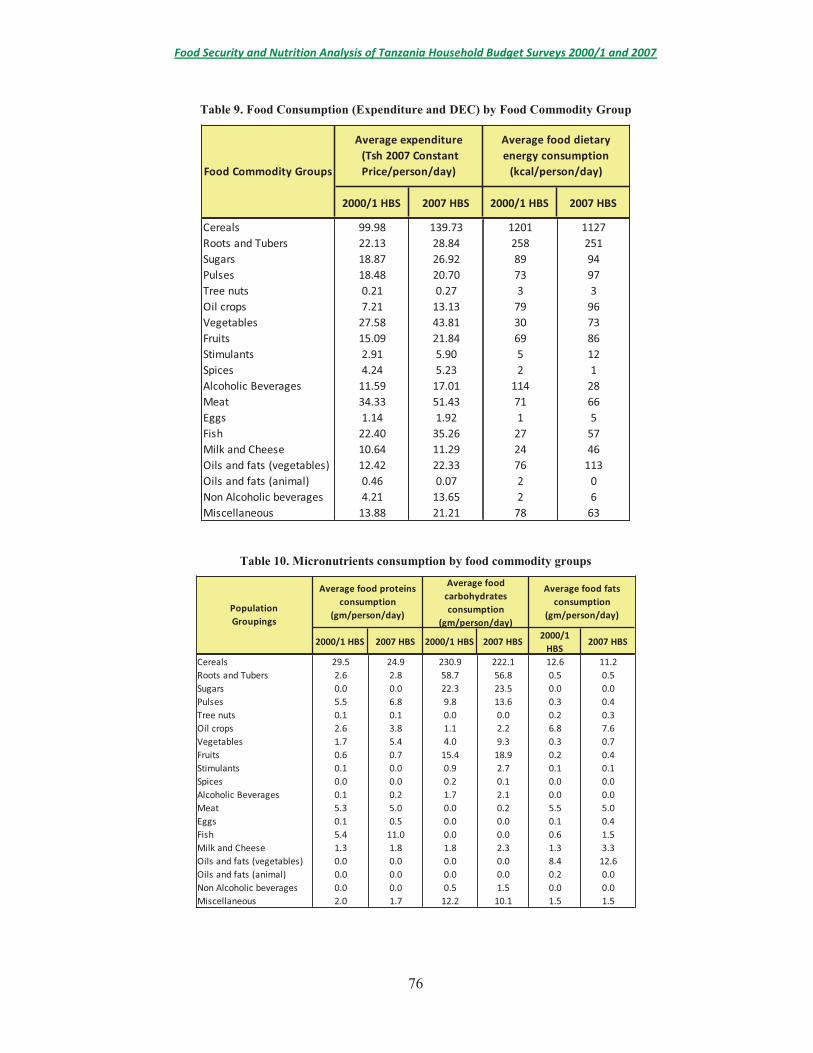
Cereals 99.98 139.73 1201 1127Roots and Tubers 22.13 28.84 258 251Sugars 18.87 26.92 89 94Pulses 18.48 20.70 73 97Tree nuts 0.21 0.27 3 3Oil crops 7.21 13.13 79 96Vegetables 27.58 43.81 30 73Fruits 15.09 21.84 69 86Stimulants 2.91 5.90 5 12Spices 4.24 5.23 2 1Alcoholic Beverages 11.59 17.01 114 28Meat 34.33 51.43 71 66Eggs 1.14 1.92 1 5Fish 22.40 35.26 27 57Milk and Cheese 10.64 11.29 24 46Oils and fats (vegetables) 12.42 22.33 76 113Oils and fats (animal) 0.46 0.07 2 0Non Alcoholic beverages 4.21 13.65 2 6Miscellaneous 13.88 21.21 78 63
Food Commodity Groups
Average expenditure (Tsh 2007 Constant Price/person/day)
Average food dietary energy consumption
(kcal/person/day)
2000/1 HBS 2007 HBS 2000/1 HBS 2007 HBS2000/1
HBS2007 HBS
Cereals 29.5 24.9 230.9 222.1 12.6 11.2Roots and Tubers 2.6 2.8 58.7 56.8 0.5 0.5Sugars 0.0 0.0 22.3 23.5 0.0 0.0Pulses 5.5 6.8 9.8 13.6 0.3 0.4Tree nuts 0.1 0.1 0.0 0.0 0.2 0.3Oil crops 2.6 3.8 1.1 2.2 6.8 7.6Vegetables 1.7 5.4 4.0 9.3 0.3 0.7Fruits 0.6 0.7 15.4 18.9 0.2 0.4Stimulants 0.1 0.0 0.9 2.7 0.1 0.1Spices 0.0 0.0 0.2 0.1 0.0 0.0Alcoholic Beverages 0.1 0.2 1.7 2.1 0.0 0.0Meat 5.3 5.0 0.0 0.2 5.5 5.0Eggs 0.1 0.5 0.0 0.0 0.1 0.4Fish 5.4 11.0 0.0 0.0 0.6 1.5Milk and Cheese 1.3 1.8 1.8 2.3 1.3 3.3Oils and fats (vegetables) 0.0 0.0 0.0 0.0 8.4 12.6Oils and fats (animal) 0.0 0.0 0.0 0.0 0.2 0.0Non Alcoholic beverages 0.0 0.0 0.5 1.5 0.0 0.0Miscellaneous 2.0 1.7 12.2 10.1 1.5 1.5
Average food carbohydrates consumption
(gm/person/day)
Average food fats consumption
(gm/person/day)Population Groupings
Average food proteins consumption
(gm/person/day)
Food Security and Nutrition Analysis of Tanzania Household Budget Surveys 2000/1 and 2007
2000/1 HBS 2007 HBS 2000/1 HBS 2007 HBS 2000/1 HBS 2007 HBS 2000/1 HBS 2007 HBS
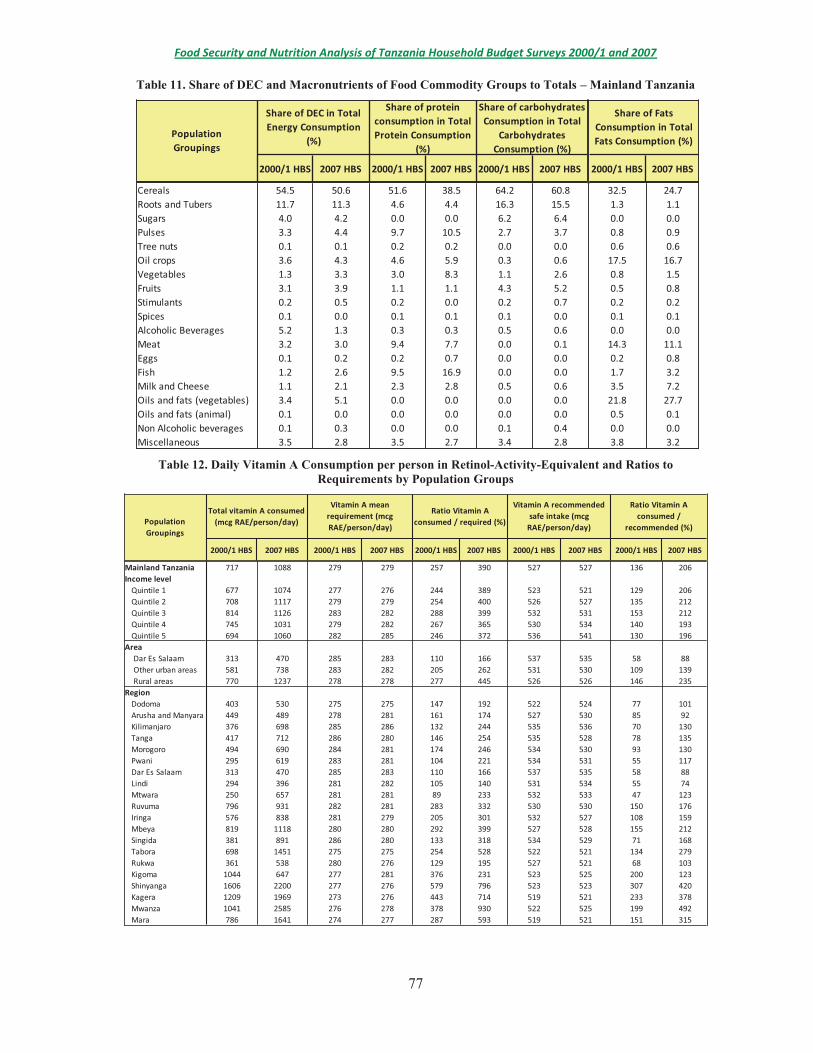
Cereals 54.5 50.6 51.6 38.5 64.2 60.8 32.5 24.7Roots and Tubers 11.7 11.3 4.6 4.4 16.3 15.5 1.3 1.1Sugars 4.0 4.2 0.0 0.0 6.2 6.4 0.0 0.0Pulses 3.3 4.4 9.7 10.5 2.7 3.7 0.8 0.9Tree nuts 0.1 0.1 0.2 0.2 0.0 0.0 0.6 0.6Oil crops 3.6 4.3 4.6 5.9 0.3 0.6 17.5 16.7Vegetables 1.3 3.3 3.0 8.3 1.1 2.6 0.8 1.5Fruits 3.1 3.9 1.1 1.1 4.3 5.2 0.5 0.8Stimulants 0.2 0.5 0.2 0.0 0.2 0.7 0.2 0.2Spices 0.1 0.0 0.1 0.1 0.1 0.0 0.1 0.1Alcoholic Beverages 5.2 1.3 0.3 0.3 0.5 0.6 0.0 0.0Meat 3.2 3.0 9.4 7.7 0.0 0.1 14.3 11.1Eggs 0.1 0.2 0.2 0.7 0.0 0.0 0.2 0.8Fish 1.2 2.6 9.5 16.9 0.0 0.0 1.7 3.2Milk and Cheese 1.1 2.1 2.3 2.8 0.5 0.6 3.5 7.2Oils and fats (vegetables) 3.4 5.1 0.0 0.0 0.0 0.0 21.8 27.7Oils and fats (animal) 0.1 0.0 0.0 0.0 0.0 0.0 0.5 0.1Non Alcoholic beverages 0.1 0.3 0.0 0.0 0.1 0.4 0.0 0.0Miscellaneous 3.5 2.8 3.5 2.7 3.4 2.8 3.8 3.2
Share of Fats Consumption in Total Fats Consumption (%)
Population Groupings
Share of DEC in Total Energy Consumption
(%)
Share of protein consumption in Total Protein Consumption
(%)
Share of carbohydrates Consumption in Total
Carbohydrates Consumption (%)
2000/1 HBS 2007 HBS 2000/1 HBS 2007 HBS 2000/1 HBS 2007 HBS 2000/1 HBS 2007 HBS 2000/1 HBS 2007 HBS
Mainland Tanzania 717 1088 279 279 257 390 527 527 136 206Income level
Quintile 1 677 1074 277 276 244 389 523 521 129 206Quintile 2 708 1117 279 279 254 400 526 527 135 212Quintile 3 814 1126 283 282 288 399 532 531 153 212Quintile 4 745 1031 279 282 267 365 530 534 140 193Quintile 5 694 1060 282 285 246 372 536 541 130 196
Area Dar Es Salaam 313 470 285 283 110 166 537 535 58 88 Other urban areas 581 738 283 282 205 262 531 530 109 139 Rural areas 770 1237 278 278 277 445 526 526 146 235
RegionDodoma 403 530 275 275 147 192 522 524 77 101Arusha and Manyara 449 489 278 281 161 174 527 530 85 92Kilimanjaro 376 698 285 286 132 244 535 536 70 130Tanga 417 712 286 280 146 254 535 528 78 135Morogoro 494 690 284 281 174 246 534 530 93 130Pwani 295 619 283 281 104 221 534 531 55 117Dar Es Salaam 313 470 285 283 110 166 537 535 58 88Lindi 294 396 281 282 105 140 531 534 55 74Mtwara 250 657 281 281 89 233 532 533 47 123Ruvuma 796 931 282 281 283 332 530 530 150 176Iringa 576 838 281 279 205 301 532 527 108 159Mbeya 819 1118 280 280 292 399 527 528 155 212Singida 381 891 286 280 133 318 534 529 71 168Tabora 698 1451 275 275 254 528 522 521 134 279Rukwa 361 538 280 276 129 195 527 521 68 103Kigoma 1044 647 277 281 376 231 523 525 200 123Shinyanga 1606 2200 277 276 579 796 523 523 307 420Kagera 1209 1969 273 276 443 714 519 521 233 378Mwanza 1041 2585 276 278 378 930 522 525 199 492Mara 786 1641 274 277 287 593 519 521 151 315
Vitamin A recommended safe intake (mcg
RAE/person/day)
Ratio Vitamin A consumed /
recommended (%)Population Groupings
Total vitamin A consumed (mcg RAE/person/day)
Vitamin A mean requirement (mcg RAE/person/day)
Ratio Vitamin A consumed / required (%)

Food Security and Nutrition Analysis of Tanzania Household Budget Surveys 2000/1 and 2007
2000/1 HBS 2007 HBS 2000/1 HBS 2007 HBS 2000/1 HBS 2007 HBS
Mainland Tanzania 2.13 2.45 0.98 0.98 217 249Income level
Quintile 1 1.96 2.95 0.96 0.95 204 310Quintile 2 2.20 2.17 0.98 0.98 225 222Quintile 3 2.20 2.08 1.00 1.00 219 208Quintile 4 2.32 2.12 1.00 1.02 232 209Quintile 5 2.30 2.12 1.02 1.05 224 202
Area Dar Es Salaam 1.41 1.15 1.03 1.02 137 113 Other urban areas 1.80 1.94 1.00 1.00 180 195 Rural areas 2.23 2.70 0.97 0.97 229 278
RegionDodoma 2.37 1.79 0.96 0.97 247 185Arusha and Manyara 1.99 1.83 0.98 0.99 203 185Kilimanjaro 1.48 1.57 1.01 1.02 147 155Tanga 2.05 1.84 1.01 0.98 203 188Morogoro 2.45 1.99 1.01 1.00 243 200Pwani 1.64 1.30 1.00 1.00 163 130Dar Es Salaam 1.41 1.15 1.03 1.02 137 113Lindi 2.00 1.68 1.00 1.01 201 166Mtwara 1.91 1.74 1.01 1.02 189 171Ruvuma 2.33 2.94 1.00 0.99 233 298Iringa 2.51 3.78 1.00 0.98 251 387Mbeya 2.31 2.45 0.99 0.98 234 249Singida 1.77 1.80 1.00 0.98 176 183Tabora 2.37 6.84 0.97 0.95 245 718Rukwa 2.02 2.25 0.97 0.95 208 238Kigoma 3.35 2.70 0.96 0.96 347 280Shinyanga 2.24 2.26 0.96 0.96 233 236Kagera 2.70 2.98 0.94 0.95 287 313Mwanza 1.83 1.81 0.96 0.97 191 186Mara 1.49 2.12 0.95 0.95 157 222
Population Groupings
Total vitamin B1 consumed
(mcg RAE/person/day)
Vitamin B1 recommended intakes (mcg RAE/person/day)
Ratio Vitamin B1 consumed /
recommended (%)
Food Security and Nutrition Analysis of Tanzania Household Budget Surveys 2000/1 and 2007
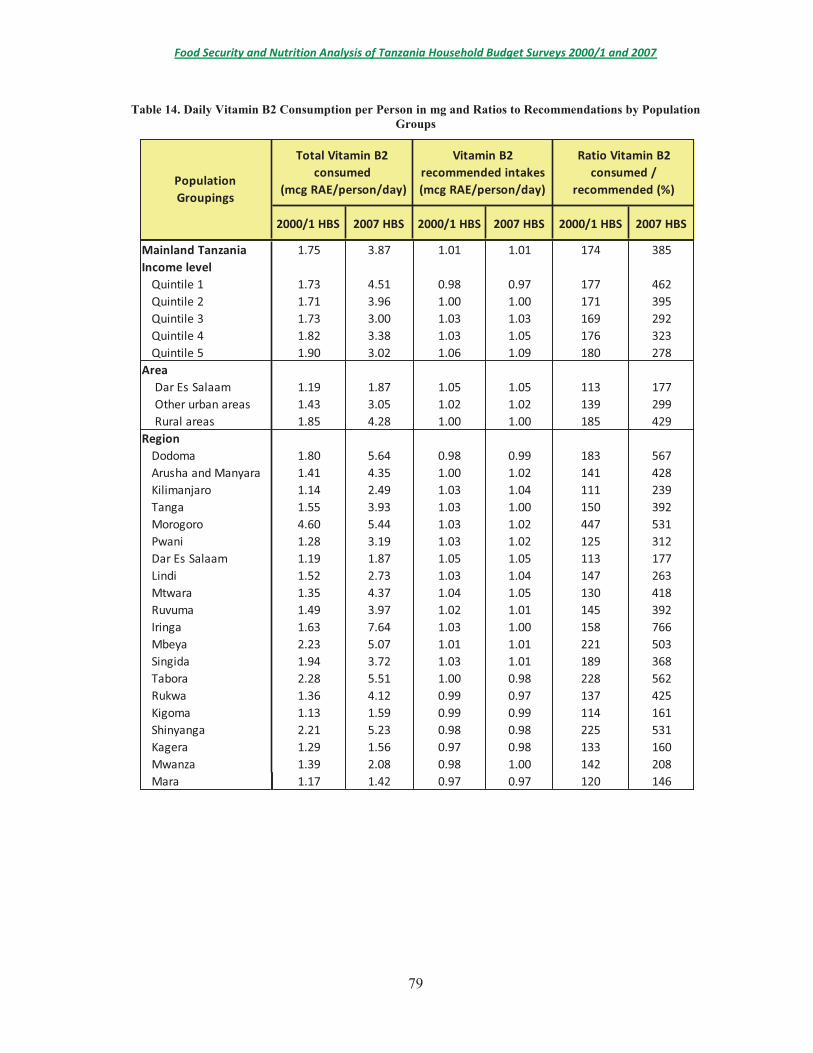
2000/1 HBS 2007 HBS 2000/1 HBS 2007 HBS 2000/1 HBS 2007 HBS
Mainland Tanzania 1.75 3.87 1.01 1.01 174 385Income level
Quintile 1 1.73 4.51 0.98 0.97 177 462Quintile 2 1.71 3.96 1.00 1.00 171 395Quintile 3 1.73 3.00 1.03 1.03 169 292Quintile 4 1.82 3.38 1.03 1.05 176 323Quintile 5 1.90 3.02 1.06 1.09 180 278
Area Dar Es Salaam 1.19 1.87 1.05 1.05 113 177 Other urban areas 1.43 3.05 1.02 1.02 139 299 Rural areas 1.85 4.28 1.00 1.00 185 429
RegionDodoma 1.80 5.64 0.98 0.99 183 567Arusha and Manyara 1.41 4.35 1.00 1.02 141 428Kilimanjaro 1.14 2.49 1.03 1.04 111 239Tanga 1.55 3.93 1.03 1.00 150 392Morogoro 4.60 5.44 1.03 1.02 447 531Pwani 1.28 3.19 1.03 1.02 125 312Dar Es Salaam 1.19 1.87 1.05 1.05 113 177Lindi 1.52 2.73 1.03 1.04 147 263Mtwara 1.35 4.37 1.04 1.05 130 418Ruvuma 1.49 3.97 1.02 1.01 145 392Iringa 1.63 7.64 1.03 1.00 158 766Mbeya 2.23 5.07 1.01 1.01 221 503Singida 1.94 3.72 1.03 1.01 189 368Tabora 2.28 5.51 1.00 0.98 228 562Rukwa 1.36 4.12 0.99 0.97 137 425Kigoma 1.13 1.59 0.99 0.99 114 161Shinyanga 2.21 5.23 0.98 0.98 225 531Kagera 1.29 1.56 0.97 0.98 133 160Mwanza 1.39 2.08 0.98 1.00 142 208Mara 1.17 1.42 0.97 0.97 120 146
Ratio Vitamin B2 consumed /
recommended (%)Population Groupings
Total Vitamin B2 consumed
(mcg RAE/person/day)
Vitamin B2 recommended intakes (mcg RAE/person/day)

Food Security and Nutrition Analysis of Tanzania Household Budget Surveys 2000/1 and 2007
2000/1 HBS 2007 HBS 2000/1 HBS 2007 HBS 2000/1 HBS 2007 HBS
Mainland Tanzania 2.3 2.4 1.1 1.1 207 217Income level
Quintile 1 2.0 2.1 1.1 1.1 185 200Quintile 2 2.3 2.5 1.1 1.1 208 225Quintile 3 2.5 2.5 1.1 1.1 222 223Quintile 4 2.7 2.7 1.1 1.2 234 230Quintile 5 2.8 2.8 1.2 1.2 242 235
Area Dar Es Salaam 1.5 1.6 1.2 1.2 128 140 Other urban areas 2.1 2.2 1.1 1.1 189 196 Rural areas 2.4 2.5 1.1 1.1 216 230
RegionDodoma 2.1 2.0 1.1 1.1 195 182Arusha and Manyara 2.1 2.1 1.1 1.1 195 186Kilimanjaro 1.9 2.4 1.2 1.2 166 201Tanga 2.1 2.6 1.1 1.1 181 237Morogoro 2.3 2.5 1.1 1.1 202 219Pwani 1.9 1.9 1.2 1.1 161 170Dar Es Salaam 1.5 1.6 1.2 1.2 128 140Lindi 2.7 2.3 1.2 1.2 232 199Mtwara 2.5 2.7 1.2 1.2 220 229Ruvuma 2.1 2.5 1.1 1.1 187 224Iringa 2.2 3.3 1.1 1.1 190 293Mbeya 2.4 2.8 1.1 1.1 217 250Singida 2.0 2.2 1.1 1.1 171 200Tabora 2.7 2.3 1.1 1.1 245 215Rukwa 2.3 2.3 1.1 1.1 209 221Kigoma 2.6 2.7 1.1 1.1 238 251Shinyanga 2.5 2.4 1.1 1.1 235 226Kagera 2.5 2.6 1.1 1.1 235 247Mwanza 2.6 2.6 1.1 1.1 244 237Mara 2.5 2.6 1.1 1.1 237 244
Population Groupings
Total Vitamin B6 consumed
(mc RAE/person/day)
Vitamin B6 recommended intakes (mc RAE/person/day)
Ratio Vitamin B6 consumed /
recommended (%)

Food Security and Nutrition Analysis of Tanzania Household Budget Surveys 2000/1 and 2007
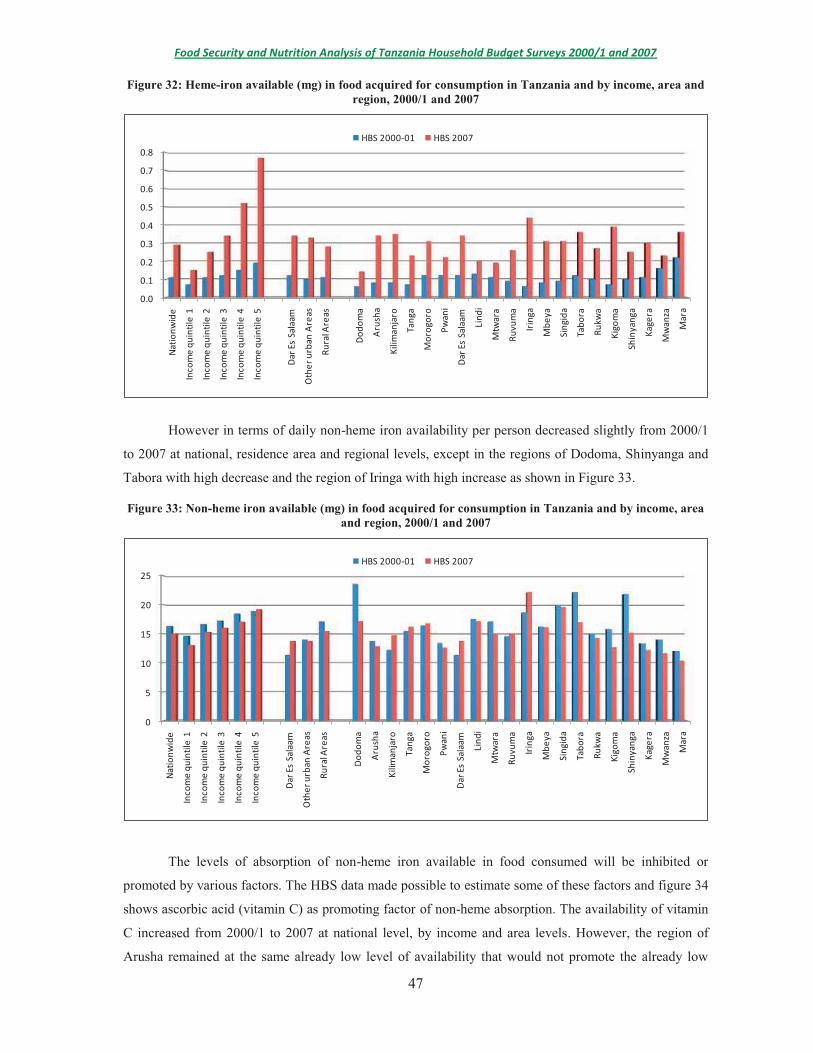
2000/1 HBS 2007 HBS 2000/1 HBS 2007 HBS 2000/1 HBS 2007 HBS 2000/1 HBS 2007 HBS 2000/1 HBS 2007 HBS
Mainland Tanzania 1.63 2.53 1.68 1.68 97 150 2.03 2.02 80 125Income level
Quintile 1 1.07 1.82 1.65 1.63 65 112 1.98 1.96 54 93Quintile 2 1.53 2.42 1.68 1.67 91 145 2.02 2.02 76 120Quintile 3 1.93 2.78 1.72 1.72 112 162 2.07 2.06 93 135Quintile 4 2.49 3.59 1.72 1.75 144 206 2.07 2.10 120 171Quintile 5 2.87 4.51 1.76 1.81 163 249 2.11 2.17 136 207
Area Dar Es Salaam 1.79 3.08 1.77 1.77 102 174 2.12 2.12 84 145 Other urban areas 1.76 2.78 1.72 1.71 102 162 2.07 2.06 85 135 Rural areas 1.59 2.41 1.67 1.66 95 145 2.01 2.00 79 120
RegionDodoma 1.12 1.19 1.64 1.65 68 72 1.98 1.99 57 60Arusha and Manyara 1.40 1.98 1.67 1.69 84 117 2.02 2.04 69 97Kilimanjaro 1.89 2.21 1.74 1.75 109 126 2.09 2.11 90 105Tanga 1.49 2.17 1.73 1.67 86 129 2.08 2.02 72 108Morogoro 1.29 2.67 1.73 1.71 75 156 2.08 2.06 62 130Pwani 1.70 2.03 1.73 1.72 98 118 2.08 2.06 82 98Dar Es Salaam 1.79 3.08 1.77 1.77 102 174 2.12 2.12 84 145Lindi 1.07 2.43 1.71 1.74 63 140 2.06 2.09 52 116Mtwara 1.65 1.89 1.74 1.75 95 108 2.09 2.10 79 90Ruvuma 1.26 2.41 1.72 1.69 73 143 2.07 2.03 61 118Iringa 1.19 2.68 1.72 1.68 69 159 2.07 2.02 57 132Mbeya 1.54 2.34 1.69 1.69 91 138 2.04 2.04 76 115Singida 1.43 2.11 1.73 1.68 83 125 2.08 2.03 69 104Tabora 1.68 4.27 1.66 1.63 102 263 1.99 1.96 84 218Rukwa 1.46 2.33 1.66 1.61 88 144 2.00 1.95 73 120Kigoma 1.47 2.20 1.66 1.65 89 133 1.99 1.99 74 111Shinyanga 1.67 2.01 1.65 1.64 101 122 1.98 1.98 84 101Kagera 1.96 2.94 1.61 1.63 122 181 1.95 1.96 101 150Mwanza 2.14 2.81 1.64 1.67 131 169 1.97 2.01 108 140Mara 2.44 3.05 1.62 1.63 150 187 1.95 1.97 125 155
Ratio Vitamin B12 consumed /
recommended (%)
Vitamin B12 recommended intakes (mcg RAE/person/day)
Ratio Vitamin B12 consumed /
recommended (%)Population Groupings
Total Vitamin B12 consumed
(mcg RAE/person/day)
Vitamin B12 average requirement (mcg RAE/person/day)

Food Security and Nutrition Analysis of Tanzania Household Budget Surveys 2000/1 and 2007
2000/1 HBS 2007 HBS 2000/1 HBS 2007 HBS 2000/1 HBS 2007 HBS
Mainland Tanzania 92.4 126.9 39.6 39.6 234 321Income level
Quintile 1 83.5 119.5 39.0 38.8 214 308Quintile 2 91.2 130.5 39.5 39.5 231 330Quintile 3 99.6 131.1 40.0 40.1 249 327Quintile 4 103.3 121.7 40.4 40.6 256 300Quintile 5 110.5 154.7 40.8 41.6 271 372
Area Dar Es Salaam 50.5 104.3 40.7 40.9 124 255 Other urban areas 66.8 112.8 40.1 40.0 167 282 Rural areas 99.8 132.7 39.4 39.4 253 337
RegionDodoma 49.5 76.0 39.2 39.4 126 193Arusha and Manyara 41.5 46.0 39.5 39.7 105 116Kilimanjaro 57.2 86.1 40.1 40.4 142 213Tanga 95.6 144.1 39.8 39.4 240 366Morogoro 96.9 126.7 40.1 40.0 242 317Pwani 80.0 148.2 40.1 40.1 199 369Dar Es Salaam 50.5 104.3 40.7 40.9 124 255Lindi 152.8 97.6 40.1 40.5 381 241Mtwara 145.6 215.1 40.4 40.5 360 531Ruvuma 92.3 137.9 40.0 39.6 230 348Iringa 63.8 214.1 40.1 39.6 159 541Mbeya 79.3 119.0 39.8 39.7 200 300Singida 33.5 80.6 39.9 39.6 84 204Tabora 64.6 113.3 39.3 38.9 164 291Rukwa 102.3 105.3 39.1 38.7 261 272Kigoma 140.2 178.3 39.3 39.0 357 457Shinyanga 62.6 101.4 39.1 39.1 160 259Kagera 161.0 168.5 38.8 39.0 415 433Mwanza 137.7 151.4 39.0 39.4 353 384Mara 163.5 171.3 38.8 39.0 421 439
Population Groupings
Total Vitamin C consumed
(mg /person/day)
Vitamin C recommended intakes
(mg /person/day)
Ratio Vitamin C consumed /
recommended (%)

Food Security and Nutrition Analysis of Tanzania Household Budget Surveys 2000/1 and 2007
2000/1 HBS 2007 HBS 2000/1 HBS 2007 HBS 2000/1 HBS 2007 HBS
Mainland Tanzania 296 486 747 746 40 65Income level
Quintile 1 237 374 743 739 32 51Quintile 2 295 491 747 746 40 66Quintile 3 323 541 758 754 43 72Quintile 4 384 612 744 752 52 81Quintile 5 410 765 750 756 55 101
Area Dar Es Salaam 279 518 761 754 37 69 Other urban areas 252 495 756 754 33 66 Rural areas 305 481 744 743 41 65
RegionDodoma 407 388 734 733 55 53Arusha and Manyara 270 403 744 750 36 54Kilimanjaro 322 614 767 768 42 80Tanga 256 426 771 750 33 57Morogoro 264 562 762 751 35 75Pwani 269 456 760 751 35 61Dar Es Salaam 279 518 761 754 37 69Lindi 282 440 750 753 38 58Mtwara 284 469 750 755 38 62Ruvuma 226 518 752 751 30 69Iringa 222 747 754 747 29 100Mbeya 244 511 750 751 32 68Singida 390 560 770 749 51 75Tabora 373 612 734 733 51 83Rukwa 193 425 747 734 26 58Kigoma 220 435 740 751 30 58Shinyanga 385 413 739 738 52 56Kagera 299 532 727 735 41 72Mwanza 309 341 735 743 42 46Mara 280 382 731 741 38 52
Population Groupings
Total Calcium consumed
(mg /person/day)
Calcium recommended intakes
(mg /person/day)
Ratio Calcium consumed /
recommended (%)
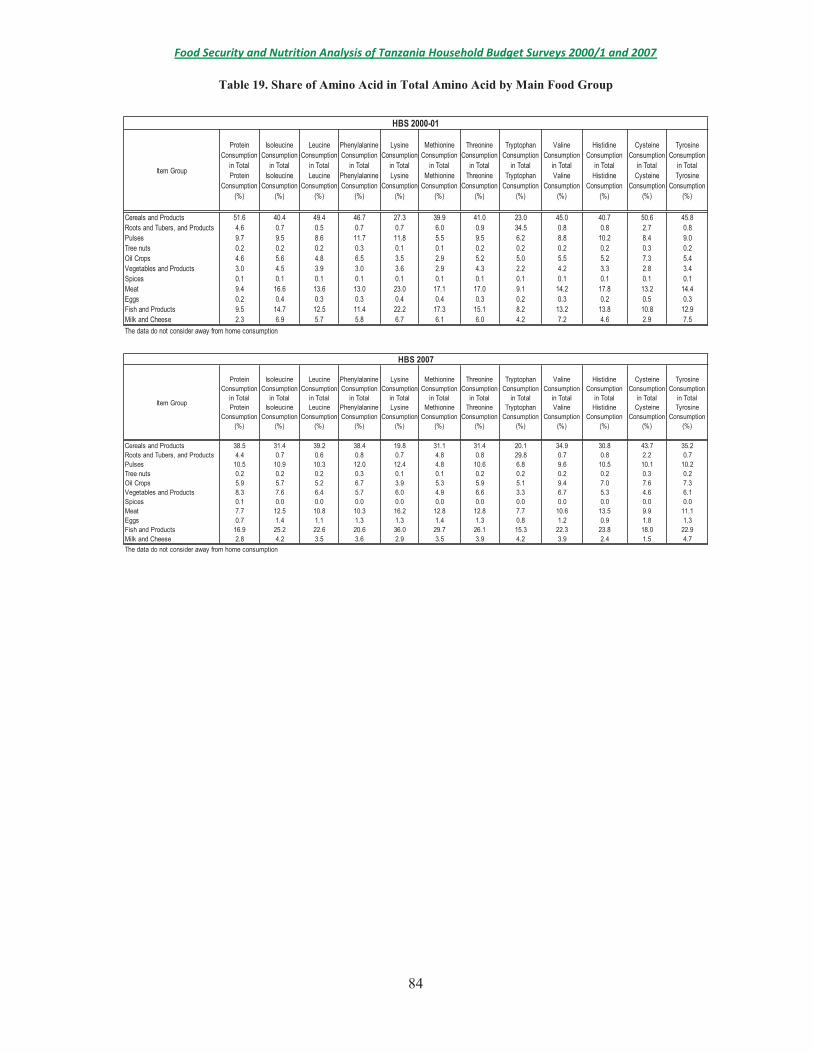
Food Security and Nutrition Analysis of Tanzania Household Budget Surveys 2000/1 and 2007

Food
Sec
urit
y an
d N
utri
tion
Ana
lysi
s of
Tan
zani
a H
ouse
hold
Bud
get
Surv
eys
2000
/1 a
nd 2
007
Ca
teg
ori
es
an
d G
rou
pin
gs
Nu
mb
er
of
sa
mp
led
h
ou
se
ho
lds
Av
era
ge
fo
od
c
on
su
mp
tio
n i
n
die
tary
en
erg
y
va
lue
(k
ca
l/p
ers
on
/da
y)
Fo
od
die
tary
e
ne
rgy
c
on
su
mp
tio
n
sta
nd
ard
err
or
Fo
od
die
tary
e
ne
rgy
c
on
su
mp
tio
n
sta
nd
ard
e
rro
r w
ith
in
cla
ss
es
Av
era
ge
fo
od
c
on
su
mp
tio
n i
n
mo
ne
tary
va
lue
(L
C$
/pe
rso
n/d
ay
)
Fo
od
mo
ne
tary
v
alu
e
sta
nd
ard
e
rro
r
Fo
od
mo
ne
tary
v
alu
e
sta
nd
ard
e
rro
r w
ith
in
cla
ss
es
Av
era
ge
to
tal
co
ns
um
pti
on
(L
C$
/pe
rso
n/d
ay
)
To
tal
co
ns
um
pti
on
s
tan
da
rd e
rro
r
To
tal
co
ns
um
pti
on
s
tan
da
rd e
rro
r w
ith
in c
las
se
s
Inc
om
e
(LC
$/p
ers
on
/da
y)
Inc
om
e
sta
nd
ard
e
rro
r
Inc
om
e
sta
nd
ard
e
rro
r w
ith
in
cla
ss
es
Na
tion
wid
e2
21
75
22
03
22
0.9
73
52
.71
54
4.6
2
A
rea D
ar
es
Sa
laa
m (
C)
12
25
20
73
42
42
39
5.7
39
.56
9.5
67
26
.83
24
.04
24
.04
10
95
.27
21
4.7
72
14
.77
Oth
er
urb
an
are
as
13
38
22
19
31
61
62
91
.85
2.3
62
.31
49
4.6
24
.93
4.8
58
76
.76
39
.71
39
.60
Ru
ral a
rea
s 7
56
82
21
41
51
41
96
.22
2.0
72
.01
30
1.4
24
.15
4.0
84
47
.96
16
.97
16
.90
Ho
use
ho
ld s
ize
on
e p
ers
on
2
50
33
85
96
76
75
29
.04
8.0
47
.84
92
4.8
61
6.9
11
6.5
51
76
2.6
11
53
.39
15
2.5
3 tw
o p
eo
ple
2
43
12
91
03
13
13
65
.77
5.7
25
.57
59
5.9
41
2.4
51
2.2
09
82
.84
13
1.2
21
31
.31
thre
e to
fou
r p
eo
ple
6
59
62
41
11
41
32
62
.18
2.5
82
.49
42
3.5
55
.93
5.7
66
55
.37
35
.33
35
.18
fiv
e to
se
ve
n p
eo
ple
7
01
62
13
61
11
12
08
.86
2.1
12
.03
32
9.6
34
.66
4.5
14
99
.34
30
.13
30
.05
Mo
re th
an
8
36
29
19
52
15
15
17
0.3
42
.38
2.3
22
66
.79
5.5
05
.38
39
5.5
13
5.0
53
4.9
5G
en
de
r o
f he
ad
of h
ou
seh
old
MA
LE
1
67
51
22
12
14
13
21
9.4
02
.02
1.9
63
51
.14
4.4
24
.31
55
6.0
63
4.8
33
4.7
4 F
EM
AL
E
54
24
21
65
17
16
22
7.7
53
.35
3.2
63
59
.49
6.3
16
.16
49
5.0
93
1.8
13
1.7
3A
ge
of h
ea
d o
f ho
use
ho
ld H
ea
d <
30
yrs
4
91
32
36
22
92
92
50
.14
4.3
84
.25
40
8.8
38
.50
8.2
66
77
.47
67
.71
67
.48
He
ad
be
twe
en
30
& 4
0 y
rs
65
44
21
82
20
20
22
2.5
13
.19
3.1
03
58
.12
7.0
76
.95
59
4.8
04
1.0
24
0.8
4 H
ea
d b
etw
ee
n 4
0 &
50
yrs
4
71
72
14
82
22
22
16
.22
3.5
23
.43
34
7.1
38
.13
7.9
05
11
.24
41
.96
41
.79
He
ad
be
twe
en
50
& 6
0 y
rs
31
20
22
58
22
22
21
5.8
34
.02
3.9
23
45
.13
8.7
78
.56
49
6.6
37
0.1
37
0.0
0 H
ea
d o
lde
r th
an
60
yrs
2
88
12
09
12
32
31
98
.75
3.6
13
.51
29
6.8
37
.19
7.0
34
02
.30
10
9.9
51
10
.04
Eco
no
mic
act
ivity
of h
ea
d o
f ho
use
ho
ld A
gri
cultu
re-
min
ing
& fi
shin
g
10
31
82
18
81
31
21
93
.68
1.7
91
.74
29
6.3
43
.37
3.3
14
41
.53
13
.22
13
.07
Pu
blic
& N
GO
s 4
78
32
29
92
92
93
35
.17
4.6
64
.56
59
3.8
19
.36
9.1
68
43
.91
46
.83
46
.63
Se
lf e
mp
loy
ed
5
88
42
25
52
52
42
87
.92
3.6
23
.54
48
8.5
88
.76
8.6
09
36
.79
89
.64
89
.44
No
act
ivity
1
19
02
08
83
83
82
00
.71
5.9
55
.71
30
6.3
51
1.0
21
0.5
63
95
.48
11
4.3
91
14
.25
Re
gio
n D
OD
OM
A
12
12
24
04
68
68
19
0.1
56
.32
6.3
23
04
.89
11
.72
11
.72
54
7.3
55
0.1
25
0.1
2 A
RU
SH
A
11
24
19
52
32
32
23
7.1
47
.90
7.9
03
62
.58
17
.84
17
.84
59
8.9
76
0.0
86
0.0
8 K
ILIM
AN
JAR
O
10
77
20
80
54
54
27
5.3
88
.68
8.6
84
10
.06
17
.96
17
.96
54
1.5
61
39
.95
13
9.9
5 T
AN
GA
1
11
72
16
34
14
12
22
.48
7.0
67
.06
32
6.5
81
3.3
51
3.3
54
13
.92
51
.65
51
.65
MO
RO
GO
RO
1
12
42
27
46
56
52
30
.48
7.6
77
.67
35
0.8
81
7.3
31
7.3
35
56
.60
68
.22
68
.22
PW
AN
I 9
87
19
96
43
43
23
0.2
77
.14
7.1
43
62
.25
14
.99
14
.99
56
6.6
75
8.2
15
8.2
1 D
AR
ES
SA
LA
AM
1
22
52
07
34
24
23
95
.73
9.5
69
.56
72
6.8
32
4.0
42
4.0
41
09
5.2
72
14
.77
21
4.7
7 L
IND
I 1
09
72
45
58
08
02
36
.69
8.3
78
.37
33
3.6
11
8.4
81
8.4
85
22
.11
13
0.6
61
30
.66
MT
WA
RA
1
09
12
30
55
15
12
79
.43
7.6
87
.68
42
0.4
51
4.2
41
4.2
47
25
.54
76
.79
76
.79
RU
VU
MA
1
10
22
01
85
85
81
88
.13
7.7
87
.78
32
1.7
01
8.1
11
8.1
15
34
.44
23
2.2
72
32
.27
IR
ING
A
11
25
24
20
40
40
24
8.3
28
.38
8.3
83
90
.23
15
.78
15
.78
59
1.4
51
69
.18
16
9.1
8 M
BE
YA
1
13
02
57
04
94
92
66
.27
5.7
65
.76
45
1.7
01
4.1
21
4.1
26
33
.82
46
.86
46
.86
SIN
GID
A
10
72
20
34
39
39
16
6.9
46
.69
6.6
92
50
.15
12
.94
12
.94
30
9.5
02
42
.54
24
2.5
4 T
AB
OR
A
10
96
26
17
40
40
23
0.6
78
.11
8.1
13
52
.07
16
.23
16
.23
52
6.5
75
1.9
55
1.9
5 R
UK
WA
1
00
62
15
95
05
01
39
.94
5.4
25
.42
23
8.4
21
0.3
81
0.3
83
15
.31
10
4.7
51
04
.75
KIG
OM
A
11
50
21
46
37
37
16
1.5
47
.14
7.1
42
55
.35
17
.16
17
.16
39
4.9
08
6.3
88
6.3
8 S
HIN
YA
NG
A
10
74
23
71
46
46
18
0.7
88
.17
8.1
72
77
.48
17
.27
17
.27
50
2.0
51
05
.17
10
5.1
7 K
AG
ER
A
11
49
20
98
40
40
20
0.7
58
.36
8.3
63
16
.56
17
.27
17
.27
45
5.7
09
9.8
99
9.8
9 M
WA
NZ
A
11
16
19
49
34
34
16
5.6
46
.40
6.4
02
88
.06
12
.21
12
.21
50
5.7
36
5.1
26
5.1
2 M
AR
A
11
01
18
92
32
32
18
7.6
75
.68
5.6
82
74
.07
10
.18
10
.18
40
0.9
52
8.6
52
8.6
5A
rea
-In
com
e D
ar
es
Sa
laa
m (
C)
- Q
uin
tile
24
51
27
82
72
71
93
.25
4.1
34
.13
30
7.1
35
.65
5.6
53
21
.89
5.8
95
.89
Da
r e
s S
ala
am
(C
) -
Qu
intil
e2
45
18
57
39
39
30
8.8
84
.97
4.9
75
33
.40
6.3
36
.33
57
4.3
94
.78
4.7
8 D
ar
es
Sa
laa
m (
C)
- Q
uin
tile
24
52
26
95
55
54
22
.03
8.5
68
.56
74
1.4
91
1.5
61
1.5
68
77
.78
6.7
96
.79
Da
r e
s S
ala
am
(C
) -
Qu
intil
e2
45
27
30
81
81
58
9.5
71
3.1
51
3.1
51
13
1.8
71
9.5
21
9.5
21
36
9.8
61
1.9
11
1.9
1 D
ar
es
Sa
laa
m (
C)
- Q
uin
tile
24
53
38
41
34
13
47
95
.55
29
.54
29
.54
16
50
.59
88
.51
88
.51
42
49
.88
10
30
.74
10
30
.74
Oth
er
urb
an
are
as
- Q
uin
tile
26
76
15
03
14
13
14
0.4
00
.90
0.8
72
03
.47
1.1
81
.16
22
0.0
11
.20
1.1
9 O
the
r u
rba
n a
rea
s -
Qu
intil
e2
67
71
90
91
91
92
27
.05
1.2
51
.24
36
1.0
91
.49
1.4
84
14
.75
1.0
01
.00
Oth
er
urb
an
are
as
- Q
uin
tile
26
76
23
90
18
18
30
3.6
41
.98
1.9
35
09
.51
2.5
22
.48
63
3.3
31
.47
1.4
7 O
the
r u
rba
n a
rea
s -
Qu
intil
e2
67
72
75
63
63
64
24
.39
3.4
13
.36
74
2.3
65
.14
5.0
41
01
7.6
93
.30
3.3
0 O
the
r u
rba
n a
rea
s -
Qu
intil
e2
67
63
21
25
55
45
67
.89
7.5
77
.47
10
68
.41
17
.51
17
.35
36
18
.91
18
6.5
91
86
.31
Ru
ral a
rea
s -
Qu
intil
e 1
1
51
31
60
31
71
69
8.1
90
.88
0.8
31
36
.90
1.0
00
.97
14
6.4
20
.98
0.9
5 R
ura
l are
as
- Q
uin
tile
2
15
14
20
84
19
18
16
1.8
61
.08
1.0
62
34
.54
1.1
11
.11
25
5.9
90
.77
0.7
6 R
ura
l are
as
- Q
uin
tile
3
15
14
23
52
25
24
21
0.5
61
.71
1.6
53
16
.19
2.0
11
.97
37
8.0
71
.15
1.1
4 R
ura
l are
as
- Q
uin
tile
4
15
14
26
80
33
32
28
1.7
32
.78
2.7
04
39
.32
3.7
93
.69
58
1.7
92
.29
2.2
8 R
ura
l are
as
- Q
uin
tile
5
15
13
32
07
42
41
38
7.1
16
.49
6.3
86
70
.45
14
.81
14
.73
16
59
.64
74
.57
74
.42
Sa
mp
le B
as
ed
Sta
nd
ard
Err
or
Re
gio
n:
Afr
ica
C
ou
ntr
y:
Ta
nza
nia
- M
ain
lan
d
Ye
ar:
20
00
/01

Food
Sec
urit
y an
d N
utri
tion
Ana
lysi
s of
Tan
zani
a H
ouse
hold
Bud
get
Surv
eys
2000
/1 a
nd 2
007

Food Security and Nutrition Analysis of Tanzania Household Budget Surveys 2000/1 and 2007
x
Food Security and Nutrition Analysis of Tanzania Household Budget Surveys 2000/1 and 2007

Food Security and Nutrition Analysis of Tanzania Household Budget Surveys 2000/1 and 2007
=
ij
x x
Food Security and Nutrition Analysis of Tanzania Household Budget Surveys 2000/1 and 2007
x
x=

91
Annex III. Estimation of micronutrient requirements and recommendations for national and sub-national population
groups
The normative micronutrient requirements and recommendations are given in milligrams or micrograms per person per day for each age group and sex for the human population as shown in Tables A1.a and A1.b.
Table A1.a. Requirement and recommended intake of selected micronutrients for males
Age in years
Calcium recommended
intakes based on animal protein
Vitamin C recommended
intakes
Vitamin B1 recommended
intakes
Vitamin B2 recommended
intakes
Vitamin B6 recommended
intakes
Vitamin B12 average
requierement
Vitamin B12 recommended
intakes
Vitamin A mean
requierement
Vitamin A recommended
safe intake
Less than one 383.3 27.5 0.3 0.4 0.2 0.5 0.6 185.0 387.51 a 1.9 500.0 30.0 0.5 0.5 0.5 0.7 0.9 200.0 400.02 a 2.9 500.0 30.0 0.5 0.5 0.5 0.7 0.9 200.0 400.03 a 3.9 500.0 30.0 0.5 0.5 0.5 0.7 0.9 200.0 400.04 a 4.9 550.0 30.0 0.6 0.6 0.6 1.0 1.2 200.0 450.05 a 5.9 550.0 30.0 0.6 0.6 0.6 1.0 1.2 200.0 450.06 a 6.9 550.0 30.0 0.6 0.6 0.6 1.0 1.2 200.0 450.07 a 7.9 700.0 35.0 0.9 0.9 1.0 1.5 1.8 250.0 500.08 a 8.9 700.0 35.0 0.9 0.9 1.0 1.5 1.8 250.0 500.09 a 9.9 700.0 35.0 0.9 0.9 1.0 1.5 1.8 250.0 500.0
10 a 10.9 1000.0 40.0 1.2 1.3 1.3 2.0 2.4 365.0 600.011 a 11.9 1000.0 40.0 1.2 1.3 1.3 2.0 2.4 365.0 600.012 a 12.9 1000.0 40.0 1.2 1.3 1.3 2.0 2.4 365.0 600.013 a 13.9 1000.0 40.0 1.2 1.3 1.3 2.0 2.4 365.0 600.014 a 14.9 1000.0 40.0 1.2 1.3 1.3 2.0 2.4 365.0 600.015 a 15.9 1000.0 40.0 1.2 1.3 1.3 2.0 2.4 365.0 600.016 a 16.9 1000.0 40.0 1.2 1.3 1.3 2.0 2.4 365.0 600.017 a 17.9 1000.0 40.0 1.2 1.3 1.3 2.0 2.4 365.0 600.018 a 18.9 1000.0 40.0 1.2 1.3 1.3 2.0 2.4 365.0 600.019 a 19.9 750.0 45.0 1.2 1.3 1.3 2.0 2.4 300.0 600.020 a 24.9 750.0 45.0 1.2 1.3 1.3 2.0 2.4 300.0 600.025 a 29.9 750.0 45.0 1.2 1.3 1.3 2.0 2.4 300.0 600.030 a 34.9 750.0 45.0 1.2 1.3 1.3 2.0 2.4 300.0 600.035 a 39.9 750.0 45.0 1.2 1.3 1.3 2.0 2.4 300.0 600.040 a 44.9 750.0 45.0 1.2 1.3 1.3 2.0 2.4 300.0 600.045 a 49.9 750.0 45.0 1.2 1.3 1.3 2.0 2.4 300.0 600.050 a 54.9 750.0 45.0 1.2 1.3 1.7 2.0 2.4 300.0 600.055 a 59.9 750.0 45.0 1.2 1.3 1.7 2.0 2.4 300.0 600.060 a 64.9 750.0 45.0 1.2 1.3 1.7 2.0 2.4 300.0 600.065 a 69.9 800.0 45.0 1.2 1.3 1.7 2.0 2.4 300.0 600.0
70+ 800.0 45.0 1.2 1.3 1.7 2.0 2.4 300.0 600.0
mg/person/day mcg/person/day
Males
The estimate of micronutrient requirements and recommendations were weighted by sex and age population structures of the population groups under study, at national and sub-national levels.
The sex and age population structure was estimated from household member data collected in the household surveys for the different population groups at national and sub-national levels.
The daily micronutrient requirement (MREQ) or recommended intake (MREC) per person in the population group are estimated as follows:
MREQ (per person per day) = MREQij * Pij orMREC (per person per day) = MRECij * Pijwhere
MREQ is the per person per day requirement in milligram or microgram,MREC is the per person per day recommended intake in milligram or microgram,
Food Security and Nutrition Analysis of Tanzania Household Budget Surveys 2000/1 and 2007
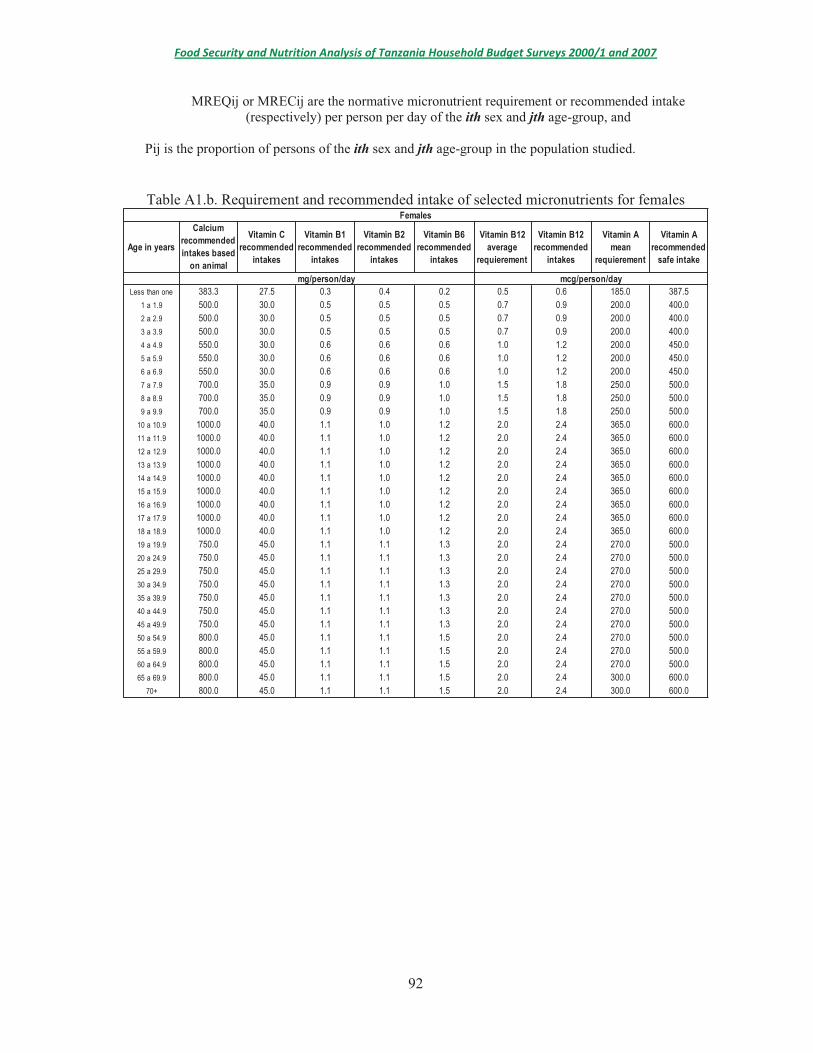
Food Security and Nutrition Analysis of Tanzania Household Budget Surveys 2000/1 and 2007
Age in years
Calcium recommended intakes based
on animal
Vitamin C recommended
intakes
Vitamin B1 recommended
intakes
Vitamin B2 recommended
intakes
Vitamin B6 recommended
intakes
Vitamin B12 average
requierement
Vitamin B12 recommended
intakes
Vitamin A mean
requierement
Vitamin A recommended
safe intake
Less than one 383.3 27.5 0.3 0.4 0.2 0.5 0.6 185.0 387.51 a 1.9 500.0 30.0 0.5 0.5 0.5 0.7 0.9 200.0 400.02 a 2.9 500.0 30.0 0.5 0.5 0.5 0.7 0.9 200.0 400.03 a 3.9 500.0 30.0 0.5 0.5 0.5 0.7 0.9 200.0 400.04 a 4.9 550.0 30.0 0.6 0.6 0.6 1.0 1.2 200.0 450.05 a 5.9 550.0 30.0 0.6 0.6 0.6 1.0 1.2 200.0 450.06 a 6.9 550.0 30.0 0.6 0.6 0.6 1.0 1.2 200.0 450.07 a 7.9 700.0 35.0 0.9 0.9 1.0 1.5 1.8 250.0 500.08 a 8.9 700.0 35.0 0.9 0.9 1.0 1.5 1.8 250.0 500.09 a 9.9 700.0 35.0 0.9 0.9 1.0 1.5 1.8 250.0 500.0
10 a 10.9 1000.0 40.0 1.1 1.0 1.2 2.0 2.4 365.0 600.011 a 11.9 1000.0 40.0 1.1 1.0 1.2 2.0 2.4 365.0 600.012 a 12.9 1000.0 40.0 1.1 1.0 1.2 2.0 2.4 365.0 600.013 a 13.9 1000.0 40.0 1.1 1.0 1.2 2.0 2.4 365.0 600.014 a 14.9 1000.0 40.0 1.1 1.0 1.2 2.0 2.4 365.0 600.015 a 15.9 1000.0 40.0 1.1 1.0 1.2 2.0 2.4 365.0 600.016 a 16.9 1000.0 40.0 1.1 1.0 1.2 2.0 2.4 365.0 600.017 a 17.9 1000.0 40.0 1.1 1.0 1.2 2.0 2.4 365.0 600.018 a 18.9 1000.0 40.0 1.1 1.0 1.2 2.0 2.4 365.0 600.019 a 19.9 750.0 45.0 1.1 1.1 1.3 2.0 2.4 270.0 500.020 a 24.9 750.0 45.0 1.1 1.1 1.3 2.0 2.4 270.0 500.025 a 29.9 750.0 45.0 1.1 1.1 1.3 2.0 2.4 270.0 500.030 a 34.9 750.0 45.0 1.1 1.1 1.3 2.0 2.4 270.0 500.035 a 39.9 750.0 45.0 1.1 1.1 1.3 2.0 2.4 270.0 500.040 a 44.9 750.0 45.0 1.1 1.1 1.3 2.0 2.4 270.0 500.045 a 49.9 750.0 45.0 1.1 1.1 1.3 2.0 2.4 270.0 500.050 a 54.9 800.0 45.0 1.1 1.1 1.5 2.0 2.4 270.0 500.055 a 59.9 800.0 45.0 1.1 1.1 1.5 2.0 2.4 270.0 500.060 a 64.9 800.0 45.0 1.1 1.1 1.5 2.0 2.4 270.0 500.065 a 69.9 800.0 45.0 1.1 1.1 1.5 2.0 2.4 300.0 600.0
70+ 800.0 45.0 1.1 1.1 1.5 2.0 2.4 300.0 600.0
Females
mg/person/day mcg/person/day

Food Security and Nutrition Analysis of Tanzania Household Budget Surveys 2000/1 and 2007

Food Security and Nutrition Analysis of Tanzania Household Budget Surveys 2000/1 and 2007
Essential Amino Acid InfantsPreschool children
(1-2 years)
Children and
adolescents (3-18 years)
Adults
Histidine 20 18 16 15Isoleucine 32 31 31 30Leucine 66 63 61 59Lysine 57 52 48 45Methionine and Cisteyne 28 26 24 22Phenylalanine and Tyrosine 52 46 41 38Threonine 31 27 25 23Tryptophan 8.5 7.4 6.6 6Valine 43 42 40 39
mg of essential amino acid required / gram of mean protein required

Food Security and Nutrition Analysis of Tanzania Household Budget Surveys 2000/1 and 2007
NATIONAL BUREAU OF STATISTICS
Director General P.O. Box 796 Dar es Salaam Telephone +255 22 2122724
General Office P.O. Box 796 Dar es Salaam Telephone +255 22 2122722/3
Fax: +255 22 2130852
E-mail: [email protected],
[Website www.nbs.go.tz]
Vision
To be a preferable source of official statistics in Tanzania
Mission
To facilitate informed decision-making process, through provision of relevant, timely and
reliable user-driven statistical information, coordinating statistical activities and
promoting the adherence to statistical methodologies and standards
I2074E/1/3.11


![SynthMaster 2.8 User Manual · 2019. 8. 20. · $8 +rvw dssolfdwlrq vxfk dv /rjlf *dudjh%dqg $$; ,qvwuxphqw :lqgrzv dqg deryh 0df26; dqg deryh *% 5$0 *+] &38 elw 3ur7rrov dqg deryh](https://static.fdocuments.net/doc/165x107/6129c20f5da80d0234434b3a/synthmaster-28-user-2019-8-20-8-rvw-dssolfdwlrq-vxfk-dv-rjlf-dudjhdqg.jpg)