
Prevalence Estimation and Geographic Distribution of ...
121
Prevalence Estimation and Geographic Distribution of Scrapie in the Canadian Sheep Population via Abattoir Surveillance By Jue Tang A Thesis Presented to The University of Guelph In partial fulfillment of requirements for the degree of Master of Science in Population Medicine Guelph, Ontario, Canada ○ c Jue Tang, June, 2014
Transcript of Prevalence Estimation and Geographic Distribution of ...
Prevalence Estimation and Geographic Distribution of Scrapie in the Canadian
Sheep Population via Abattoir Surveillance
By
Jue Tang
A Thesis
Presented to
The University of Guelph
In partial fulfillment of requirements
for the degree of
Master of Science in
Population Medicine
Guelph, Ontario, Canada
○c Jue Tang, June, 2014

ABSTRACT
PREVALENCE ESTIMATION AND GEOGRAPHIC DISTRIBUTION OF SCRAPIE IN THE
CANADIAN SHEEP POPULATION VIA ABATTOIR SURVEILLANCE
Jue Tang Advisor:
University of Guelph, 2014 Dr. Olaf Berke
Classical scrapie, a federally reportable disease in Canada, is a fatal neurodegenerative
disease of sheep and goats. In order to inform future scrapie eradication programs for Canada, a
study estimating the national prevalence of scrapie was conducted from Nov 2010 to Dec 2012;
seven cases were detected among 11,702 sheep. The prevalence at the individual level is
estimated to be 0.06% (CI from 0.03% to 0.12%); at the farm-level it is estimated to be 0.22%
(CI from 0.11% to 0.45%).
A sampling information index was developed which measures the available sampling
information at the Census Division (CD) level. A choropleth map is used to show the spatial
distribution of this index. CDs with a low information index value cluster in the West Coast, the
southern border between British Columbia and Alberta, southern Manitoba, northern Ontario and
the Atlantic Provinces. These areas should be targeted in future surveillance activities.

iii
ACKNOWLEDGEMENTS
I would like to thank my committee members, Dr. Olaf Berke and Dr. Paula Menzies, for
their guidance in the completion of this thesis. Dr. Berke, I appreciate your time and effort in
teaching and guiding me through this project, especially the encouragement to complete my
work. Dr. Menzies, thank you for your knowledge of the Canadian sheep industry and the
etiology of scrapie, which was invaluable in the completion of this project.
I would like to thank Heather Brown from the Canadian Food Inspection Agency (CFIA)
for compiling the data and continuously tracing back the origins of sheep whenever I
encountered problems. This project could not have been completed without your data support.
As well, I would like to acknowledge Dr. Hernan Ortegon from Alberta Agriculture and Rural
Development (AARD) for the data compiling, which made this project possible. I would also
like to acknowledge Agriculture Canada and the Canadian Sheep Federation for generously
providing the funding for this project.
Sincere thanks to all the colleagues and friends who provided help on data analysis,
namely Michelle Edwards and Lucia Constanzo from the Data Resource Center, University of
Guelph Library, Bimal Chhetri, Theresa Procter, Jessica Cha, and Herbert Tang. I would like to
thank you for replying to my never ending emails of questions and assisting me through all the
off- hour communications.
To my friends and colleagues who helped me editing the thesis, I understand the time it
took to edit probably was as long as my writing time. Thank you for sacrificing your own time to
read my thesis and taking the time to understand and polish every single sentence. Special thanks
to the ones who have accompanied me during my driving trips between Toronto and Guelph.

iv
Thanks for keeping me awake on the way and making the crazily crowded 401 driving
experiences not lonely but enjoyable.
Lastly, I want to thank my family members for all the care and love you have spoiled me
with, even with all the conflicts I have caused constantly. Thanks to my cats Snow and Pumpkin
who have never said that they regretted joining my crazy life, and kept my papers safe and warm
by lying on them. My greatest love and thanks go to my parents. I felt I could go wrong and
explore the world in any way because you would always protect me. Thanks for letting me
become the person I want to be. Thank you!

v
STATEMENT OF WORK DONE
Health status data from sheep sampled at abattoirs across Canada and diagnosed at
Canadian Food Inspection Agency (CFIA) laboratories were provided by the CFIA in electronic
format. This data came over time in form of quarterly samples. I compiled all the data sets from
different time periods into one data set, reviewed the accuracy of data entry, identified missing
values as well as double entries and corrected where necessary and possible. Any changes to the
original data were made in consultation with the CFIA in person of Heather Brown. The cleaned
data was then subjected to statistical analysis using R 3.1.0 (R development team, 2014). I
performed all statistical data analysis on my own.
The computer program to estimate the stratified Wilson Confidence Interval in chapter 2
was programmed independently by Bimal Chhetri and me in R and the results were confirmed by
Herbert Tang via Matlab. The results of the two programs agreed exactly.
In order to construct the choropleth map for chapter 3, postal codes information was
converted into Census District information with the help of Michelle Edwards from the Data
Resource Center, University of Guelph Library. However, some of the postal codes turned out to
be corresponding to multiple CD regions. I identified the problematic postal codes. After
consultation with Heather Brown and a CFIA GIS specialist, we had those data records revised
using exact farm addresses. They were disclosed to me subject to confidentiality agreements.

vi
Table of Contents ABSTRACT ...................................................................................................................................... ii
ACKNOWLEDGEMENTS................................................................................................................ iii
STATEMENT OF WORK DONE ....................................................................................................... v
LIST OF TABLES ............................................................................................................................ ix
LIST OF FIGURES ............................................................................................................................ x
Chapter 1 Literature review and objectives ...........................................................................................1
1.1 Introduction ..............................................................................................................................1
1.2 Scrapie......................................................................................................................................2
1.2.1 Clinical signs and transmission ............................................................................................4
1.2.2 Etiology and Pathogenesis ...................................................................................................4
1.2.3 Genetics of scrapie ..............................................................................................................5
1.2.4. Diagnosis ..........................................................................................................................7
1.2.5. The relation of scrapie to livestock TSEs ........................................................................... 10
1.3 The Canadian sheep industry .................................................................................................... 14
1.3.1 Canadian sheep population ................................................................................................ 15
1.3.2 Slaughter plants ................................................................................................................ 16
1.4. Scrapie surveillance, control and prevention ............................................................................. 17
1.4.1. Scrapie surveillance ......................................................................................................... 17
1.4.2. Current scrapie control and prevention .............................................................................. 20
1.5 Methodology for epidemiological studies .................................................................................. 22
1.5.1 Sampling methods............................................................................................................. 22
1.5.2 Prevalence estimation........................................................................................................ 25
1.5.3 Confidence interval ........................................................................................................... 26
1.6 Study rationale and objectives .................................................................................................. 26
1.6.1 Objectives ........................................................................................................................ 27
1.7 References .............................................................................................................................. 29
Chapter 2: Prevalence Estimation of Scrapie in the Canadian Sheep Population by Active Surveillance in
Animals at Slaughter......................................................................................................................... 42
Abstract........................................................................................................................................ 42
2.1 Introduction ............................................................................................................................ 42
2.2 Materials and methods ............................................................................................................. 44

vii
2.2.1 Study design ..................................................................................................................... 44
2.2.2 Sampling .......................................................................................................................... 45
2.2.3 Diagnostic testing ............................................................................................................. 48
2.2.4 Data management ............................................................................................................. 49
2.2.5 Prevalence and confidence interval estimation .................................................................... 49
2.3 Results .................................................................................................................................... 54
2.4 Discussion .............................................................................................................................. 56
2.5 Conclusion .............................................................................................................................. 60
2.6 Acknowledgements ................................................................................................................. 61
2.7 References: ............................................................................................................................. 62
Chapter 3: Choropleth mapping the sampling intensity of a Canadian scrapie prevalence study .............. 66
Abstract........................................................................................................................................ 66
3.1 Introduction ............................................................................................................................ 67
3.2 Materials and methods ............................................................................................................. 68
3.2.1 Study design ..................................................................................................................... 68
3.2.2 Sampling procedures ......................................................................................................... 69
3.2.3 Data management ............................................................................................................. 70
3.2.4 Sampling information index............................................................................................... 71
3.2.5 Choropleth mapping .......................................................................................................... 73
3.3 Results .................................................................................................................................... 74
3.4 Discussion .............................................................................................................................. 76
3.5 Conclusion .............................................................................................................................. 79
3.6 Acknowledgements ................................................................................................................. 79
3.7 References .............................................................................................................................. 80
Chapter 4: General Summary and Conclusion ..................................................................................... 87
4.1 Motivations for conducting scrapie surveillance ........................................................................ 87
4.2 Review of the results ............................................................................................................... 88
4.3 Implications of the study .......................................................................................................... 89
4.4 Strengths and limitations .......................................................................................................... 92
4.5 Conclusion .............................................................................................................................. 94
4.6 References .............................................................................................................................. 95
Appendix A: Stratified Wilson Confidence Interval calculation R code, using sheep level data .............. 97

viii
Appendix B: Stratified Wilson Confidence Interval calculation Matlab code, using sheep level data .... 101
Appendix C: Scrapie surveillance sampling data ranking by index values ........................................... 104
ix
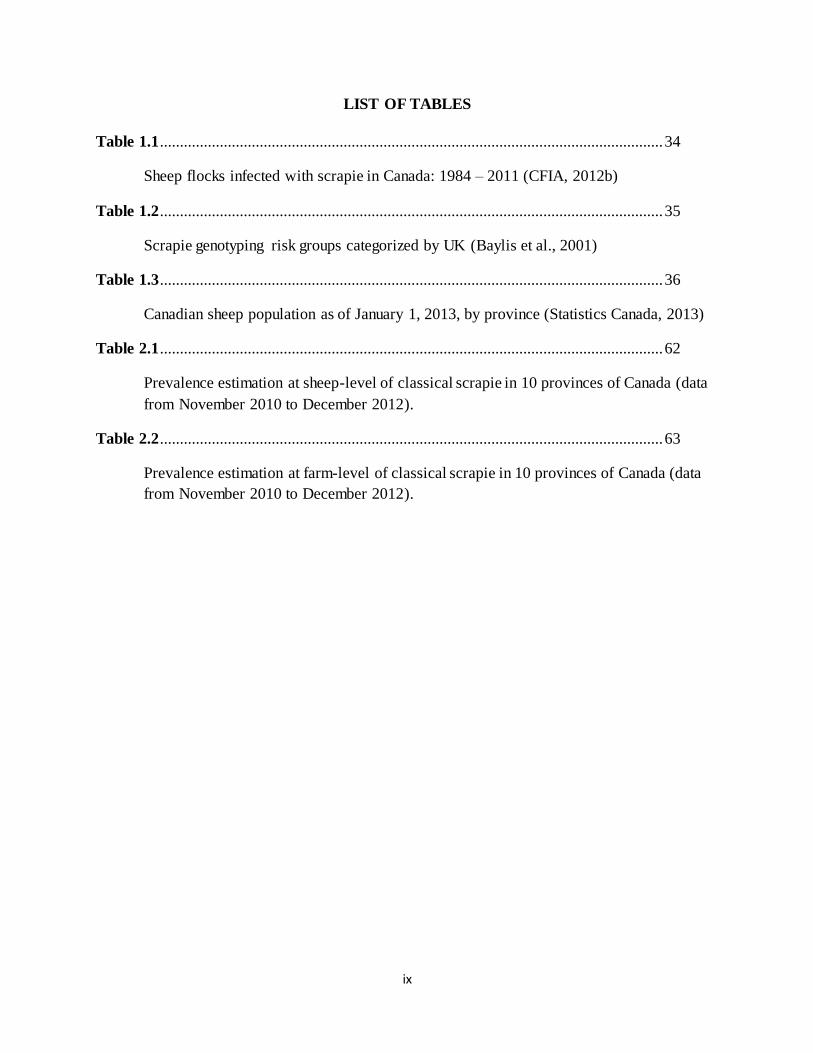
LIST OF TABLES
Table 1.1 .............................................................................................................................. 34
Sheep flocks infected with scrapie in Canada: 1984 – 2011 (CFIA, 2012b)
Table 1.2 .............................................................................................................................. 35
Scrapie genotyping risk groups categorized by UK (Baylis et al., 2001)
Table 1.3 .............................................................................................................................. 36
Canadian sheep population as of January 1, 2013, by province (Statistics Canada, 2013)
Table 2.1 .............................................................................................................................. 62
Prevalence estimation at sheep-level of classical scrapie in 10 provinces of Canada (data
from November 2010 to December 2012).
Table 2.2 .............................................................................................................................. 63
Prevalence estimation at farm-level of classical scrapie in 10 provinces of Canada (data
from November 2010 to December 2012).

x
LIST OF FIGURES
Figure 1.1 ............................................................................................................................ 37
Sheep population from 2000 to 2011 as of July 1st of each year (in thousands of heads)
(Stats Canada, 2011)
Figure 1.2 ............................................................................................................................ 38
Canada’s sheep inventories as of January 1, 2013 and July 1, 2012 (Statistics Canada,
2013)
Figure 1.3 ............................................................................................................................ 39
Figure 1.3 Estimates of prevalence of infection of classical scrapie in the sheep
population in Great Britain for the period 2002 -2011 with 95% confidence intervals
(Ortiz-Pelaez et al., 2012)
Figure 3.1 ............................................................................................................................ 79
Choropleth map of Canadian provinces based on the sampling information index of
scrapie study, using Azimuthal equidistant projection: CDs having no samples collected
from are outlined in purple; CDs having no sheep farms recorded are outlined in blue.
CDs with an index less than 0.1 are outlined in black.
Figure 3.2 ............................................................................................................................ 80
Enlargement of Figure 3.1: Choropleth map of sampling information index for British
Columbia and Alberta. CDs having no samples collected from are outlined in purple;
CDs having no sheep farms recorded are outlined in blue. CDs with an index less than 0.1
are outlined in black.
Figure 3.3 ............................................................................................................................ 81
Enlargement of Figure 3.1: Choropleth map of sampling information index for
Saskatchewan and Manitoba. CDs having no samples collected from are outlined in
purple; CDs having no sheep farms recorded are outlined in blue. CDs with an index less
than 0.1 are outlined in black.
Figure 3.4 ............................................................................................................................ 82
Enlargement of Figure 3.1: Choropleth map of sampling information index for Ontario.
CDs having no samples collected from are outlined in purple; CDs having no sheep farms
recorded are outlined in blue. CDs with an index less than 0.1 are outlined in black.
Figure 3.5 ............................................................................................................................ 83

xi
Enlargement of Figure 3.1: Choropleth map of sampling information index for Quebec
and the Atlantic Provinces. CDs having no samples collected from are outlined in purple;
CDs having no sheep farms recorded are outlined in blue. CDs with an index less than 0.1
are outlined in black.

1
Chapter 1 Literature review and objectives
1.1 Introduction
Scrapie is a transmissible neurodegenerative disease in sheep and goats. It is one of a
group of diseases known collectively as transmissible spongiform encephalopathies (TSEs),
which are characterized by findings of abnormal prion protein in the central nervous system.
Examples of TSE diseases include bovine spongiform encephalopathy (BSE) in cattle, chronic
wasting disease (CWD) in elk and deer, and Creutzfeldt-Jakob disease (CJD) and kuru in
humans. There is no effective treatment for scrapie, as for any of the other TSEs, thus leading to
a 100% case fatality rate if left to develop.
Scrapie has been diagnosed in sheep and goats in many countries around the world
(Hunter and Cairns, 1998). The long incubation of the disease, its infectious nature, and regular
animal movement require rapid and accurate tracing of the origin and movement of infected
animals, as well as correct classification of the scrapie status of flocks and herds in order to
achieve scrapie control. A sheep and goat identification (ID) system which allows for complete
traceability of livestock such as is in place for the UK (Department for Environment Food and
Rural Affairs, 2010) and Quebec (CFIA, 2012c) is therefore required. Currently, the mandatory
national sheep ID program (Canadian Sheep Identification Program) is in transition to a traceable
system. The national ID system for goats is voluntary. Canada’s national scrapie surveillance
program and data collection have not kept pace with that of other countries.
Even though the incidence of scrapie in Canada, as reported by Statistics Canada, has
been historically low (Table 1.1), the Canadian government has been recommended by the
scrapie eradication steering committee, which is made up of producers, industry groups,
academia and government agencies, that the eradication of scrapie needs to be planned and

2
achieved in the very near future in Canada (Scrapie Canada, 2014). In part, this is motivated by a
concern that scrapie may have been the cause of the BSE epidemic in the UK (Wilesmith et al.,
1991). When BSE was diagnosed in a Canadian cattle herd, a ban on importation of Canadian
sheep, goat and cattle products was announced by the US government on May 20, 2003 (Library
of Parliament, 2012) resulting in a loss of markets and income for the small ruminant industries
of Canada. Currently, animals less than one year of age may cross the border but must be
slaughtered prior to turning one year of age. Breeding stock may not be exported to the US (CSF,
2011a). As this restriction will not be lifted until Canada is proven to be scrapie free according to
OIE standard, determining the prevalence and distribution of scrapie in Canada is critical.
Therefore, this study examines both the individual level and farm level prevalence of scrapie in
Canadian sheep population.
The following sections of this chapter will describe scrapie in sheep in more detail along
with the Canadian sheep industry, current scrapie distribution, some statistical methods used in
epidemiology studies, and objectives of the project.
1.2 Scrapie
The pathodiagnostic classifications of scrapie are “classical” and “atypical”. In
publications and in this thesis, the word “scrapie” refers to classical scrapie unless specifically
noted. Classical scrapie has been reported since the 18th century (Woodhouse et al, 2001). Its
highly contagious nature has resulted in a world-wide distribution with few countries categorized
by the World Animal Health Association (OIE) as “scrapie-free”. However, recent studies have
shown the prevalence in various regions of scrapie is low. For example, in Finland, there have
been no cases detected from 2002 to 2008 (Hautaniemi et al., 2012). A study in France estimated
the prevalence of classical scrapie to be 0.44% (Vergne et al., 2012). In Great Britain, the flock-
3
level prevalence of classical scrapie declined by around 40% between 2003 and 2007 (from 0.6-
0.7% to 0.3-0.4%), as a result of various national mandatory control schemes (Gubbins and
McIntyre, 2009). The most recent European Commission’s annual report for 2011 from all its 27
member-states reported a prevalence of 0.38% (1,416 ovine positive of 369,417 ovine tested)
(The European Commission, 2012). In the United States 2002-2003, the prevalence was
estimated at a level of 0.2% (United States Department of Agriculture, 2004).
A new variant of scrapie, atypical or Nor98, was first described in Norway in 1998
(Benestad et al., 2008). Even though clinical signs are similar, the prion protein (PrP) lesions are
different from that of classical scrapie (Green et al, 2007). Involvement of the dorsal motor
nucleus of the vagus nerve (DMNV) is the primary finding in classical scrapie but is not affected
in case of atypical scrapie (Benestad et al., 2008). Additionally, sheep genetically resistant to
scrapie and the cattle BSE agents (i.e. genotypes ARR/ARR and ARR/ARQ), do not appear to be
similarly resistant to atypical scrapie (Andréoletti, 2011). So far, atypical scrapie cases have been
identified worldwide, including several in New Zealand, which is considered free of classical-
scrapie (Saunders et al, 2006). Epidemiological studies have indicated that atypical scrapie does
not conform to the behaviour of an infectious disease; rather it has been proposed that it is a
spontaneous disease (Benestad et al., 2008) and has been found to have restricted abilities to
spread into the environment or between individuals (Andréoletti, 2011). Therefore, as atypical
scrapie is not a major concern in infectivity studies, this study focuses only on classical scrapie.
The first recorded scrapie case in Canada was described in 1938 in a Suffolk sheep, a ewe
imported from Britain (Greenwood, 2002). As of 1945, scrapie became a reportable disease in
Canada under the Health of Animals Act, which means any suspected case must be reported to

4
the CFIA (Canadian Food Inspection Agency, 2012e). At this time, a national control program
was instituted.
1.2.1 Clinical signs and transmission
The term “scrapie” refers to the behaviour of affected animals scraping and rubbing their
coats against fences and walls due to intense pruritus. Clinical signs are not limited to pruritis,
however; signs of scrapie infection include chronic weight loss with reduced appetite, wool
pulling, biting at limbs or side, ataxia and hypermetria, sensitivity to noise and movement,
occasional blindness, tremor and eventually inability to stand (Foster et al., 2001). Scrapie has a
long incubation period prior to a sheep developing clinical signs, from a minimum of 1 year up
to several years. The majority of infected animals show clinical signs between the ages of 2 and
4 years; duration of disease is generally one to two months after the disease onset with a 100%
case fatality rate (Detwiler, 1992).
The disease agent can be transmitted both horizontally to sheep and goats in the same
environment, and vertically to offspring (Woolhouse et al., 1999). Usually it is spread from an
infected female’s placental tissue and birth fluids to her offspring at birth, and to other animals
exposed to the same birth environment, most susceptible are the lambs / kids born in the same
cohort (Wiggins, 2009). Researchers also found scrapie agent present in colostrum and milk
from infected sheep and goats (Lacroux et al., 2008), this may be a source of infection to young
stock. Although rams develop scrapie, they do not transmit the disease agent.
1.2.2 Etiology and Pathogenesis
Research has shown that animals affected by scrapie have characteristics very similar to
Creutsfeldt – Jakob disease (CJD) and kuru in human beings (Bendheim, 1985). When bovine
spongiform encephalopathy (BSE) was confirmed in 1986 (Becher et al., 2008), researchers

5
examined these diseases which showed similar clinical signs and discovered that the pathological
characteristics of kuru, CJD, BSE and scrapie were very similar, i.e. spongy degeneration in the
brain and spinal cord of the infected individual and that accumulations of proteinaceous material
filled the holes of these cavernous bodies. These diseases were subsequently identified as
transmissible spongiform encephalopathies (TSE’s). The word “spongiform”, refers to the
characteristic spongy appearance of the brain cortex that results from tiny holes seen when the
cortex tissue in the brain is viewed histologically.
The accumulations of protein that cause the spongiform appearance of the cortex were
found to be an abnormal form of the prion protein. Therefore, TSEs are also called “prion
diseases”. The word “prion” was named by Stanley B. Prusiner in 1982 as an abbreviation for
“protein of infection” (Kim, 2007). Specifically, abnormal prion protein (PrPSc) is a malformed
protein of its precursor isoform cellular prion protein (PrPC), and behaves like an infectious agent
that causes the normal proteins to misfold when replicating (Benestad et al, 2008). The prion is a
distinct form of infectious agent because it contains neither DNA nor RNA as do viruses,
bacteria, fungi and parasites (Kim, 2007). Currently, the pathogenesis of prion diseases is not
completely understood and no effective treatment is available. What causes the protein to change
to a neurodegenerative prion is unknown, but it is commonly accepted that scrapie is caused by
an infectious agent and that the genetic make-up of the exposed animal determines the
development of the disease (Woolhouse et al., 1999).
1.2.3 Genetics of scrapie
The presence of scrapie-resistant genotypes in sheep populations provides an opportunity
to control the disease through selectively breeding those sheep carrying the resistant genotypes.
Polymorphisms in the amino-acid sequence of PrP gene play a significant role in determining
6
whether individual sheep are susceptible or resistant to scrapie after being exposed to the
transmissible agent (Baylis et al., 2000). Three polymorphisms have been identified in sheep as
determining resistance or susceptibility: valine (V) or alanine (A) at codon 136; arginine (R) or
histidine (H) at codon 154; and glutamine (Q), arginine (R) or histidine (H) at codon 171 (Baylis
et al., 2000). Among those, V at codon 136, F at codon 154, and Q and H at codon 171 are
linked to susceptibility while the rest are linked to resistance to the scrapie agent (Baylis et al.,
2004). Although there are 12 possible genotype combinations, only 5 occur naturally with any
frequency: ARR (short notation for A136R154R171), ARQ, AHQ, ARH and VRQ, which in
different combinations can result in 15 common genotypes in sheep as there are two alleles at
one codon (Baylis et al., 2004).
Among all the naturally occurring genotypes, researchers have found that sheep of
genotype ARR/ARR appear to be the most resistant to scrapie, whereas sheep of VRQ/VRQ
genotype are highly susceptible (Belt et al., 1995). Due to the fact that the latter is a very rare
genotype and extremely susceptible to scrapie, it was hypothesized that scrapie may be primarily
a genetic disease and animals with this genotype would invariably develop scrapie regardless of
environmental exposures (Parry, 1983). However, sheep with the VRQ/VRQ genotype were
later proven to be able to live a normal life-span in a scrapie-free environment supporting the
hypothesis that an infectious agent was indeed necessary to cause scrapie (Foster, 2006). The
classification adapted by Department of Environment, Food and Rural Affairs (DEFRA) in UK
of each genotype’s risk of developing disease when exposed to the scrapie agent is shown in
Table 1.2 (Baylis et al., 2001; Baylis et al., 2004). The classification used by the CFIA ignores
the codon at 154; the most resistant genotypes are (136AA 171RR) and (136AA 171QR); while
the most susceptible as (136AA 171QQ), (136AV 171QQ), (136VV 171QQ) and (136AV

7
171QR) (CFIA, 2012d). Within some genotypes, the level of prevalence of susceptible
genotypes varies, however, based on different regions, farm types (hill, upland or lowland), flock
types (pedigree, pure-bred or commercial) and sheep breeds (Baylis et al., 2004).
1.2.4. Diagnosis
Scrapie can be diagnosed by biopsy of affected tissues, or blood-based assays in live
sheep or by necropsy in deadstock (deaths on farm). In live sheep, scrapie can be detected by the
age of 14 months (O’Rourke et al., 2002). Researchers have been diagnosing scrapie based on
the accumulation of PrPSc in biopsy of lymphoid tissues of the tonsil or third eyelid (O’Rourke et
al., 2002). More recently, recto-anal mucosa associated lymphoid tissues (RAMALT) have been
used to indicate an infection of scrapie in sheep. In a sheep infected with scrapie, PrPSc
accumulates more in RAMALT than in lymphoid tissue samples from other body parts. For this
reason as well as the convenient accessibility of RAMALT for sampling, it is considered a better
screening test compared to third eyelid lymphoid tissues (Dennis et al., 2009). After the samples
are collected, immunohistochemistry (IHC) staining is performed, by which antibodies bind
specifically to scrapie antigens. The sensitivity (Se) of the IHC tests using RAMALT was found
to be not significantly different from the one using the third eyelid (Dennis et al., 2009). In this
study, the Se of IHC testing for PrPSc in RAMALT collected from live sheep was between
85.3%and 89.4%, depending on the site from which RAMALT was obtained, compared to 87%
Se for eyelid tissues. The reference test system used is the results from necropsy diagnosis using
either tonsil and brain tissue or retropharyngeal lymph nodes, or both considered in parallel.
Blood-based assays in live animals are also used in the diagnosis of scrapie. It is difficult
to detect the infection in the early stages because of much lower PrPSc concentrations found in
blood compared to brain (Everest et al., 2007). An example of such a test is the immunocapillary

8
electrophoresis (ICE, or capillary electrophoresis fluoroimmunoassay). The test appears to be
capable of detecting the presence of PrPSc in blood with low PrPSc concentrations (Everest et al.,
2007). However, the sensitivity (Se) and specificity (Sp) of the test vary greatly: the range is 0%
to 66.7% for Se and 66.7% to 100% for Sp (Everest et al., 2007). Due to the low test
performance, especially low sensitivity, this test is not used as often as the IHC assay.
There are some weaknesses in detecting scrapie in live animals. Although the methods
applied to detect scrapie in live sheep have previously detected PrPSc in some subclinically
affected sheep, they have technical drawbacks and cannot be used to screen large populations of
sheep in the field (González et al., 2006). In addition, some PrPSc genotypes do not accumulate
PrPSc in their lymphoid tissues, or do so weakly or inconsistently (van Keulen et al., 1996;
Schereuder et al., 1998; Andreoletti et al., 2000). There is a higher accumulation of PrPSc in the
obex tissue which is available for collection only in dead animals.
Scrapie diagnosis in dead animals is more accurate and is the most commonly used
method, regardless of whether the animal has succumbed to scrapie or for another reason –
including slaughter of healthy animals. It can be accomplished using one or more of the
following tests: ELISA (enzyme-linked immunosorbent assay); IHC; western blot (WB); and
luminescence immunoassay (LIA). Tissues sampled at necropsy are the obex in medulla
oblongata (tissues from central nervous system [CNS]) and specific lymphoid tissues, i.e. tonsil
tissues and retropharyngeal lymph nodes (Monleón et al., 2005). By comparing the results,
Monleón and colleges (2005) suggested even though testing lymphoid tissue or CNS alone
would detect scrapie, it is more accurate when both lymphoid tissues and obex were used for
parallel testing to increase sensitivity without sacrificing specificity.

9
Currently, the Bio-Rad ELISA (Bio-Rad Laboratories, Inc., Hercules, California, USA) is
the most commonly used test for screening for evidence of scrapie at necropsy; it is used by all
CFIA certified laboratories and also used in many European countries, Japan and the US (CFIA
– OLF Standard Operating Procedure, SOP #SS-PR012.02, 2010, personal communication).
According to CFIA – Ottawa Laboratory in Fallowfield (CFIA-OLF) and Alberta Agriculture,
Food and Rural Development (AAFRD) TSE Laboratory in Edmonton, the Se and Sp of the Bio-
Rad ELISA are high, ranging from 95% to 100% and from 99.41% to 99.71% respectively
(CFIA – OLF Standard Operating Procedure, SOP #SS-PR012.02, 2010, personal
communication). The Bio-Rad ELISA uses a series of antibodies to which the target antigen
(PrPSc) can bind. The unbound antibodies as well as other proteins are washed away several
times before adding an enzymatic substrate, which binds to the antibody-antigen complex. The
result is the ELISA shows a colour change, indicating the quantity of antigen in the sample.
WB and IHC tests are also widely used diagnostic tests for scrapie. WB separates normal
and abnormal PrP through the use of the proteinase K (PK) enzyme which is then followed by
electrophoresis. After, the sample proteins are transferred to the immunoblotting membrane
where a highly specific monoclonal antibody is used to detect PrPSc. WB is an essential test in
scrapie because it can distinguish distinct banding patterns of classical and atypical scrapie strain
Nor98 (CFIA-OLF Standard Operating Procedure, SOP #SS-PR012.02, 2010, personal
communication). The IHC test involves microscopic examination of the obex and/or
lymphreticular tissues that have been first treated with antibodies directed against the abnormal
protein PrPSc; staining those tissues containing this protein and thus identifying animals that are
disease positive (Spiropoulos et al., 2007). This requires two to three days to complete and either
fixed or frozen tissue can be used for testing. LIA is a chemiluminescence sandwich ELISA,

10
which indicates positivity by emission of light as a result of chemical reaction (Bolea et al.,
2005). A comparison study done by Bolea and colleagues (2005) showed that WB and LIA tests
are able to detect PrPSc in the obex, cervical spinal cord, and thalamus from all the scrapie-
positive sheep, but unable to detect PrPSc in other areas of the brain where a weak
immunohistochemical staining was observed. This might result in a slightly lower Se of WB and
LIA compared to IHC in these regions. Serial diagnostic testing, where initially testing all
samples using the Bio-Rad ELISA followed by confirming cases through parallel testing using
WB and IHC, is considered to be the gold standard of scrapie diagnosis with a high Se and a
100% Sp (CFIA-OLF Standard Operating Procedure, SOP #SS-PR012.02, 2010, personal
communication); thus was used in this study.
Because scrapie diagnosis is less accurate when performed on biopsies of peripheral
lymphoid tissues compared to necropsy samples, control of the disease in live populations has
problems of accurate and early detection of infected animals. However, reliance on scrapie
testing in animals suspected of dying of scrapie may mean that there is a delay in the
implementation of control strategies, impeding their effectiveness. For this reason, detection of
scrapie by means of active surveillance (e.g. at the abattoir in slaughtered healthy animals)
appears to be an important tool in scrapie control and eventual eradication.
1.2.5. The relation of scrapie to livestock TSEs
Although scrapie is not a zoonotic disease, it is related to other zoonotic TSEs and there
is concern specifically around transmission of the scrapie agent from sheep to other species.
BSE, a TSE which occurs mostly in cattle has been well-described as an epidemic
occurring in the United Kingdom during the late 1980’s and early 1990’s (Bons et al., 1999). The
clinical signs of BSE are similar to scrapie and include abnormal posture, altered mental

11
status/behaviour, gait deficits, wasting, and finally death (Iulini et al., 2012). These two diseases
are hard to differentiate by clinical signs alone, but BSE exhibits pathological lesions and
distribution that are markedly different than scrapie and which can be distinguished by the
molecular features of different PrP’s. This can be tested by WB and examining molecular size
and the glycosylation profile (Thuring et al., 2004).
It has been confirmed that both sheep and goats are susceptible to experimental infection
with the BSE agent and secondary natural transmission can occur in sheep, although pathological
lesions are different than those with scrapie (Bellworthy et al, 2005). To date, no sheep raised in
flocks in a natural environment have been identified with BSE infection. However, two
confirmed BSE cases in naturally infected goats have been reported respectively in France in
2005 and the UK in 2006, the latter had been misdiagnosed by scrapie due to these two diseases’
similarity (Eloit et al., 2005, Jeffrey et al., 2006, Spriopoulos et al., 2011).
The agent of BSE has been found to cause disease in other species including humans,
which is called variant Creuzfelt Jakob disease (vCJD). It is believed that humans become
infected by consumption of infected beef products (Bruce et al., 1997; Migliore et al., 2011). The
rise in incidence of BSE followed by a rise in diagnosed cases of vCJD (World Organization for
Animal Health—OIE, 2013a; NCJDRSU, 2013) particularly in the UK suggests a significant
causal association between BSE and vCJD. Because of the BSE agent’s zoonotic potential, BSE
is considered a public health risk, and extensive measures have been established to detect and
eliminate the disease. The risk of BSE in sheep and goats, however, is negligible.
Studies conducted in the UK, 1988, by Wilesmith and colleagues (1991) suggested that
BSE may have arisen as a result of the feeding of “meat and bone meal” (MBM) to cattle. MBM
products that were usually sold as protein supplements are suspected to have been contaminated

12
with materials from scrapie-infected sheep and/or BSE-infected cattle (Wilesmith el al., 1991).
Therefore, the European Union (EU) introduced a feed ban on the use of processed animal
protein (PAP) in the feed for cattle, sheep and goats in July 1994 (The European Commission,
2013). The ban was expanded in January 2001 with the feeding of all processed animal proteins
to all farmed animals being prohibited, with certain limited exceptions (The European
Commission, 2013; WHO, 2011). This is to ensure that there is no cross-contamination between
species. MBM was banned in Canada in 1997 with the exception of MBM made exclusively
from pork or horse meat (Library of Parliament – LOP, 2005). Even though the number of BSE
cases decreased significantly after the feed ban (World Organisation for Animal health—OIE,
2013a), research has not yet identified a direct causal relationship between MBM containing
sheep tissue and BSE outbreaks.
The relationship between scrapie and chronic wasting disease (CWD) in elk and deer has
been investigated. It has been found that white-tailed deer are susceptible to the scrapie agent
through intracerebral inoculation (Greenlee et al, 2011), and that it is also possible to transmit
CWD to cattle, goats and sheep (Hamir et al, 2006). However, a study done by Hamir and
colleagues (2006) resulted in the observation that only sheep with genotypes ARQ/VRQ and
ARQ/ARQ appear to be susceptible to CWD: the only sheep inoculated with CWD agent and
further developed the disease has a genotype that corresponded to a susceptible genotype for
scrapie in sheep. Therefore, in the natural environment, the chance of cross-infection is possible.
Other TSEs such as feline spongiform encephalopathy (FSE) in cats, transmissible mink
encephalopathy (TME) in mink, and exotic ungulate encephalopathy (EUE) in zoo animals such
as nyala and greater kudu (Bendheim et al., 1985) have been linked to BSE (Sigurdson and
Miller, 2003). From the late 1980s until the early 1990s when BSE became an epidemic, 15

13
species were first diagnosed with TSE (Bons et al., 1999; Pearson et al., 1992). Affected animals
were either fed cattle-derived protein supplements or had been in contact with prion-infected
individuals of the same species (Kirkwood et al., 1994). Even though some researchers believe
scrapie-contaminate feedstuffs may have contributed to the BSE outbreaks in cattle, and further
cattle-derived protein supplements have affected other zoological or domestic animals, the direct
oral transmission of the scrapie agent to other animals has not been confirmed as a source of
infection (Sigurdson and Miller, 2003).
So far, BSE is the only confirmed zoonotic animal TSE. There is no epidemiological
evidence showing either scrapie or CWD can be transmitted naturally to humans. As a result, the
zoonotic risk remains unproven but should continue to be evaluated (Da Costa Dias et al., 2011;
Spiropoulos et al., 2011). Therefore, the role of scrapie in the transmission of BSE warrants
further research even though it is not a zoonotic disease.
The best known form of TSE in humans is Creutzfeldt Jakob disease (CJD). It is a rare,
degenerative and invariably fatal brain disorder with two forms, “classic CJD” and the
previously mentioned vCJD. Whereas classic CJD is the common type of CJD which occurs
worldwide and is either familial or sporadic in the elderly population, vCJD is a rare disease
which occurs primarily in young people and is associated with consumption of products from
BSE affected cattle (WHO, 2013). The first case of vCJD was reported in 1996 in the UK
(Mackay et al., 2011). The majority of cases worldwide have been identified in individuals
residing in the UK during the BSE outbreak period (NCJDRSU, 2011). Furthermore, a study has
reported that no cases of vCJD have been detected among people born after 1989, which was
after BSE risk materials were not sold for human consumption in 1987 (Mackay et al., 2011).

14
The temporal relationship suggests a causal association between BSE and vCJD which further
studies have confirmed (Mackay et al., 2011).
Kuru is another TSE of humans that was known to occur only in a restricted area in the
New Guinea highlands (Gajdusek, 2008). In recent years, the incidence has declined and the
disease has now almost disappeared (Gajdusek, 2008). Kuru is thought to be transmitted
between humans through the consumption of brains of people dying of the disease. Even though
the kuru agent has been experimentally transmitted to primates causing disease, as has the classic
CJD agent to chimpanzees, research has not achieved successful transmission of the scrapie
agent from sheep to other primates (Chou and Martin, 1971, Gibbs et al., 1980), suggesting host
specificity of those agents. However, knowledge regarding host specificity of TSE agents is still
unclear, and the precautionary principle should be applied when making assumptions regarding
the risk of scrapie transmission to other species.
Understanding the prevalence and distribution of scrapie in the Canadian sheep industry
is important because scrapie causes severe health problems in sheep. More importantly, infected
animals may provide a reservoir of pathogens and represent a risk to healthy populations of
animals and possibly people. Because of this, scrapie eradication should be achieved on national
bases.
1.3 The Canadian sheep industry
Reports show that in the year 2002 alone, the revenue from small ruminants (sheep and
goats) exported from Canada reached $12.5 million, and was expected to increase by 71% in
2003, with the USA being the most important trading partner (CSF et al., 2009). An international
ban on exports of Canadian sheep and goats along with cattle was implemented immediately
after the first Canadian BSE case was confirmed in Alberta in May, 2003. No sheep or lambs

15
were exported to the USA from 2004 to 2009. This ended in 2010 with the export of 3000 lambs
and 1,400 sheep for immediate slaughter (Statistics Canada, 2012). During 2011, the number of
sheep exported increased to 9,800 (Statistics Canada, 2012), suggesting a restoring of balanced
markets. However, the total number of exported sheep and lambs is still lower than the number
exported prior to 2003 (Statistics Canada, 2012). The market for cross-border trading of live
sheep for breeding purposes has remained closed however, causing economic difficulty for
producers and placing a burden on the government to support the producers (Library of
Parliament –LOP, 2012).
1.3.1 Canadian sheep population
The sheep population in Canada has remained around one million between 2000 and
2011 (Figure 1.1), with approximately half of the population being breeding sheep. There was
some decrease between 2003 and 2010, as a result of decreased access to international markets
and suppressed domestic prices caused by too many animals going to market in Canada. In 2011,
the sheep population finally increased slightly, reaching 1,070.3 thousand head on July 1, 2011, a
2.2% increase compared to the same period in 2010. It indicates the start of a post BSE recovery
for the sheep industry. Despite the increase between 2010 and 2011, the total stock of sheep still
hasn’t recovered to its 2002 pre-BSE level (Figure 1.1). Retention of a higher proportion of ewe
lambs for breeding, may have contributed to the total sheep population, because the sheep
industry believed that high prices would continue.
Statistics Canada conducts a semi-annual census on Canadian sheep population. The
national sheep population is divided into ewes, rams and lambs by province, and is recorded on
January 1 and July 1 of each year. Table 1.3 shows the sheep population in each province as of
January 1, 2013. Of the provinces, Ontario had 33% of the total mature sheep population,

16
making it the province with the highest sheep population, followed by Quebec and Alberta which
had 25% and 17% respectively. The three provinces with the most sheep farms according to
Statistics Canada’s 2006 Census of Agriculture are Quebec, Saskatchewan and Ontario (Table
1.3; Statistics Canada, 2007).
The population of lambs is higher at the July census than at the January census because
lambing commonly occurs in the spring and lambs are marketed in the fall. An example of the
sheep population in Canada broken down by growth stages and gender as of July 1, 2012, and as
of January 1, 2013, is shown in Figure 1.2. Mature sheep, which includes rams and ewes, are the
target population of this study. Mature sheep on July 1, 2012, and January 1, 2013, occupied
53% and 65% of the total population respectively. Ewes, as the possible source of transmission
of scrapie disease agents, on July 1, 2012, and January 1, 2013, accounted for 50% and 62%
respectively.
1.3.2 Slaughter plants
Sheep, goats and cattle are frequently transported long distances across Canada for
slaughter purposes. Provincial abattoirs receive animals from across the country but the meat can
only be sold within the same province. Federal abattoirs, on the other hand, process imported
animals as well and market their products across the country (Alton et al., 2012). Approximately
half of the market lambs born in Canada will be transported into Ontario for slaughter (Statistics
Canada, 2012). The market for lamb meat in Ontario is the largest in Canada, followed by
Quebec. This can be explained by the population concentration around in major cities such as
Toronto and Montreal. Therefore, the majority of sheep in Canada are being slaughtered in
Ontario.

17
It appears from the sharp decline and slow recovery of sheep inventory numbers in
Canada after 2003, that BSE and scrapie have had a strong and prolonged negative impact on the
sheep industry. The producers should be vigilant regarding recognizing and reporting potential
scrapie cases to the CFIA. In addition, the constant movement of sheep from farms to abattoirs
between difference provinces especially requires a national ID system which allows accurate
tracing of animal movements.
1.4. Scrapie surveillance, control and prevention
1.4.1. Scrapie surveillance
By monitoring the spread of a disease and determining patterns of progression, disease
surveillance can not only help predict, observe and minimize the harm caused by diseases, but
also monitor changes in disease patterns and the effect of control programs. A good disease
surveillance program should reflect national disease control priorities and promote the best use
of public resources by maximizing effectiveness and efficiency (Lynn et al., 2007).
Scrapie surveillance programs test sheep samples that have been collected by both
passive surveillance and active surveillance system. Passive surveillance is the examination of
clinically identified suspected cases; when the case is diagnosed as positive, information about
the case is entered into a notification database. Passive surveillance does not require researchers
to actively search for individuals to test. Active surveillance, on the other hand, is conducted by
actively looking for animals to test, such as healthy sheep slaughtered at abattoirs or fallen stock
in sheep flocks. For scrapie testing, active surveillance is primarily conducted in slaughter
populations, while passive surveillance is conducted by testing suspected cases reported by
farmers or veterinarians (Lynn et al., 2007). An effective scrapie surveillance program requires

18
implementation of a mandatory traceability program, which includes identification of individual
animals, and of their locations and farm types.
Surveillance programs for scrapie have been in place in the US and European countries
for several years, and are critical in the control and eradication of scrapie and other TSE diseases.
The Canadian surveillance program started in May 2005, and received new funding and strong
endorsement in 2010 from Agriculture and Agri-food Canada (Scrapie Canada, 2013b). The
structure and scope of surveillance systems used in the UK, US and Canada are explained below.
In the UK in 2002, the Department of Environment, Food and Rural Affairs (DEFRA)
initiated a surveillance program. This surveillance system had developed five sampling sources
for scrapie control by 2004, including surveillance via the Scrapie Notification Database (SND],
Fallen Stock (FS), Dead in Transit (DIT), Abattoir survey (AS) and Compulsory Scrapie Flock
Scheme (CSFS) (Ortiz-Pelaez et al., 2011). Among the five, FS and DIT, often done on animals
dying of other reasons, depend on producers’ and veterinarians’ submission of clinical samples,
and positive results lead to more frequent surveillance. A traceability program has been fully
developed (Birch et al., 2010) and allows for accurate tracing of animals to the farm of origin.
Animal movements are tracked by tagging the individual animal when it leaves its birth flock
(Birch et al., 2010). Information is stored in a nationally administered database which allows
officials to act on risk targets efficiently and quickly, including locating and quarantining
exposed farms and livestock. Overall, the number of confirmed scrapie cases in sheep identified
by passive surveillance in Great Britain has been decreasing since the program started in 2002.
The estimated prevalence of classical scrapie in the Great Britain sheep population is shown in
Figure 1.3 (Ortiz-Pelaez et al., 2012).

19
In the US, the surveillance activities include the following: active surveillance, passive
observation/reporting, laboratory surveillance, focusing efforts to reach under-sampled flocks
and geographic areas, and increasing compliance with identification requirements (United States
Department of Agriculture et al., 2010). Laboratory surveillance requires appropriate samples
from targeted and clinical animals to be forwarded to the National Veterinary Services
Laboratories (NVSL) or an approved contract laboratory (United States Department of
Agriculture et al., 2010). Sheep and goats moved interstate are required to be officially identified
(USDA, 2013). When a positive case is found, the individual is traced back to its flock of origin.
In cases where the flock of birth cannot be determined, the most recent residing flock will be
used (Code of Federal Regulations, 2012). Since the surveillance system has been implemented,
the prevalence of scrapie has decreased greatly. The US national prevalence of scrapie in sheep
in 2009 was estimated to be 0.05% compared to 0.2% in 2003, primarily through active
slaughter-based surveillance (United States Department of Agriculture et al., 2010).
In Canada, the CFIA has implemented the Canadian National Scrapie Surveillance
Program, an active surveillance program that aims to discover and identify infected animals and
their farm of origin in a time-efficient manner. The animal samples are mainly collected at
slaughter facilities, but also farms, auction markets, animal diagnostic laboratories, and dead
stock facilities (CFIA, 2012a).
The Canadian Sheep Identification Program (CSIP) has been mandatory for all sheep
regardless of age and location since January 1, 2004 (CSF, 2011b). A national identification tag
is applied to the individual’s ear before leaving the flock of origin. Tags are purchased in
authorized retail stores which are responsible for submitting the purchasers’ information and tag
numbers to the CSF (CSF, 2011b). In 2012, CSIP introduced radio frequency identification

20
(RFID) tags to the list of CSIP-approved identifiers; these RFID tags allow for easier recording
of all animal movement (CSF, 2012a). Sheep producers in Canada are required to record sheep
movements, i.e. animals leaving and entering a farm as well as source of the animal (CSF,
2011b). Ideally, this assures all farms on which a particular sheep has lived can be traced and
identified. However, this goal is not currently achievable due to the size of sheep flocks, the
frequency of movements among farms and compliance. In addition, the farms are not properly
identified, i.e. geographically coded, but might be referenced only via phone numbers, owner
names, and addresses. Data are frequently out of date or missing information.
This current study is aiming to estimate the national prevalence of scrapie in Canada
through active surveillance conducted from November 2010 to December 2012. Using the
experiences of GB and the US, it is expected that scrapie would decrease in prevalence, compare
to the periods prior to the surveillance systems being fully implemented.
1.4.2. Current scrapie control and prevention
The scrapie control and prevention program in Canada is currently implemented by and
under supervision of CFIA. As previously mentioned, scrapie is a federally reportable disease
meaning that anyone suspecting a case of scrapie must by law report this to the CFIA (Canadian
Food Inspection Agency, 2012e). When scrapie is suspected in a live animal on a farm, affected
animals are humanely euthanized, the brain submitted for official testing and their carcasses are
disposed under CFIA’s supervision. If scrapie is confirmed, the rest of the flock will be under
quarantine immediately, adult sheep with susceptible genotypes euthanized and all lambs are
ordered to be slaughtered (Canadian Food Inspection Agency, 2012f). Once all destruction and
disposal activities have been completed and the facility properly disinfected according to CFIA

21
requirements, the quarantine will be removed and the farm will be under CFIA’s surveillance to
ensure no remaining scrapie case.
When a scrapie case is diagnosed in an animal that was slaughtered in an abattoir, CFIA
will trace the animal to be farm of origin using the CSIP ear tag, and follow the procedures
mentioned above. CFIA will compensate producers for a previously established sum
approximating market value of animals ordered destroyed (CFIA, 2011b). Besides the financial
burden for both producers and government, this slaughtering action is also an animal welfare
concern since a large numbers of animals may be humanely euthanized.
To allow scrapie status to be determined at the flock level, Scrapie Canada introduced a
Voluntary Scrapie Flock Certification Program (VSFCP) (Scrapie Canada, 2012). Due to the
long incubation period of scrapie, infection in a flock may go undetected for many years. VSFCP
is designed to perform flock level surveillance (on farm deaths and suspected cases), genetic
monitoring (resistant genotypes vs. susceptible genotypes), combined with biosecurity such as
prevention of higher risk animals from entering the flock. The purpose is to assess a flock over a
long term with respect to status and put in place biosecurity practices which will minimize the
risk of a flock becoming infected (Scrapie Canada, 2012).
Producers participating in VSFCP need to follow one of three pathways and a number of
regulations (Scrapie Canada, 2013a). The most recommended pathway is to use disease
surveillance and biosecurity procedures to achieve specified VSFCP certification in 5 years. The
second and the third pathways use live animal testing technologies, such as lymphoid tissue
testing and/or genotyping for resistance to scrapie, in addition to disease surveillance (Scrapie
Canada, 2012). Some examples of the regulations are that animals over 12 months of age that die
on the farms participating in VSFCP must be tested by the CFIA for scrapie, and that annual

22
inventories, supervised by an accredited veterinarian, confirm that animals are accounted for and
have been properly sampled and identified. Risk of infection can be reduced by increasing the
proportion of the flock with genetic resistance to the scrapie prion (Scrapie Canada, 2013a). This
tool will also reduce the incidence of disease within an infected flock.
In addition to controlling scrapie, CFIA regulations also attempt to prevent scrapie. The
VSFCP requires that, because the transmission of scrapie is mainly by ewes, sheep flocks must
be strictly closed to ewes from other flocks, except from those at an equivalent or higher
program status level (Scrapie Canada, 2012). Producers may introduce sheep with genetic
resistant genotypes into the flocks as a method of prevention. However, if sheep are selected for
genetic resistance, the producer is not selecting for more economically important traits such as
carcass composition or prolificacy.
Overall, Canada’s scrapie surveillance program has been in place for almost a decade,
and some aspects have been improved by learning from the programs in Great Britain and the
US. The current scrapie control and prevention actions in Canada are aiming to eradicate scrapie
in the long run and thus to recover the international sheep trade with the US.
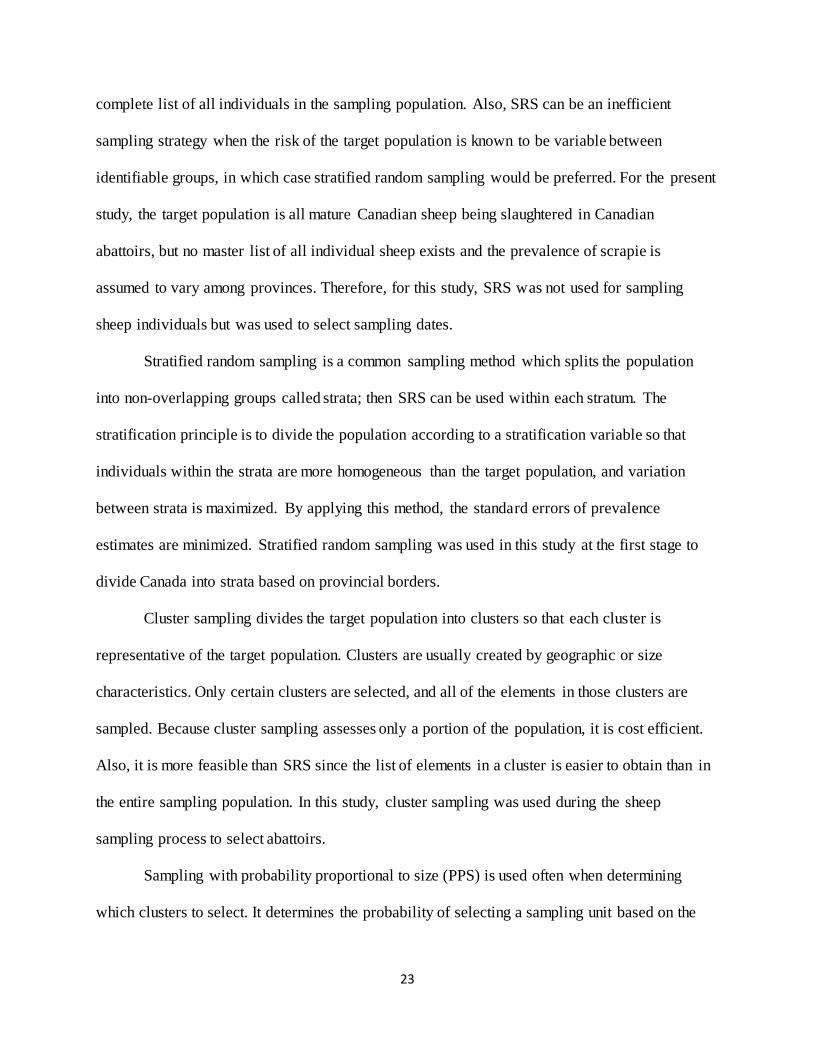
1.5 Methodology for epidemiological studies
1.5.1 Sampling methods
In order to provide an accurate estimation of disease prevalence, sampling strategies
should be carefully designed based on but not limited to the nature of the disease, the
representativeness of the sample, the feasibility of the study and the cost of sampling.
Simple random sampling (SRS) is the method that provides the most representative
sample because it is based on the principle that every sample of size n has the same chance of
being sampled out of a population of size N. However, it is rarely feasible because it requires a
23
complete list of all individuals in the sampling population. Also, SRS can be an inefficient
sampling strategy when the risk of the target population is known to be variable between
identifiable groups, in which case stratified random sampling would be preferred. For the present
study, the target population is all mature Canadian sheep being slaughtered in Canadian
abattoirs, but no master list of all individual sheep exists and the prevalence of scrapie is
assumed to vary among provinces. Therefore, for this study, SRS was not used for sampling
sheep individuals but was used to select sampling dates.
Stratified random sampling is a common sampling method which splits the population
into non-overlapping groups called strata; then SRS can be used within each stratum. The
stratification principle is to divide the population according to a stratification variable so that
individuals within the strata are more homogeneous than the target population, and variation
between strata is maximized. By applying this method, the standard errors of prevalence
estimates are minimized. Stratified random sampling was used in this study at the first stage to
divide Canada into strata based on provincial borders.
Cluster sampling divides the target population into clusters so that each cluster is
representative of the target population. Clusters are usually created by geographic or size
characteristics. Only certain clusters are selected, and all of the elements in those clusters are
sampled. Because cluster sampling assesses only a portion of the population, it is cost efficient.
Also, it is more feasible than SRS since the list of elements in a cluster is easier to obtain than in
the entire sampling population. In this study, cluster sampling was used during the sheep
sampling process to select abattoirs.
Sampling with probability proportional to size (PPS) is used often when determining
which clusters to select. It determines the probability of selecting a sampling unit based on the

24
size of its population. This was used in this current study to sample the abattoirs according to
their capacity or animal throughput in the past. The ones with larger capacity were selected
because they are more representative compared to the ones with smaller capacity.
While SRS is the standard method, stratified sampling is more efficient, and cluster
sampling is more feasible. In practise, these methods are often combined to create so-called
multistage sampling schemes, which were applied in the current study.
Multistage sampling is a complex form of cluster sampling and is usually applied when
the populations have a hierarchical structure and when using all the sample elements in the
selected clusters may be prohibitively expensive or not necessary (Gregoire and Valentine,
2008). Instead, the researcher randomly selects elements from each cluster. Constructing the
clusters is the first stage; deciding what elements within the cluster to use is the second stage. In
some cases, several levels of cluster selection may be applied, through stratified sampling or
cluster sampling, before the final sample elements are identified. The sampling unit in the first
stage of sampling is known as a primary sampling unit or first stage sampling unit. The sampling
unit in the second stage of sampling is known as a secondary sampling unit or second stage
sampling unit. The technique is used frequently when a complete list of all members of the
population does not exist or is inaccurate. The current study used stratified sampling as the first
stage to divide the target population by provinces; cluster sampling was used as second stage in
Ontario and Quebec to select abattoirs based on their capacity; then PPS, being the third stage,
was applied to choose the abattoirs to be visited within selected clusters.
Another sampling method used for rare diseases study is inverse sampling, also called
negative binomial sampling. In inverse sampling, a series of Bernoulli trials, which have exactly
two outcomes of “success” or “failure”, are conducted from a sampling population until a

25
predefined r number of ”successes” occur. Under this design, the total sample size is a random
variable. A more detailed description can be found in Haldane’s “On a method of estimating
frequencies” (Haldane, 1945). This method was not used in the current study, because it was
unknown whether a certain number of positive cases could be achieved within the two year time
frame of the study.
1.5.2 Prevalence estimation
This study aimed to estimate the prevalence of scrapie within a certain period of time
through active surveillance. Prevalence, or prevalence proportion (p), is an epidemiological
measure of how commonly a disease or condition presents in a population at a particular time. It
is in contrast to incidence which measures the risk of developing new cases of disease or
condition in a population within a certain period (Dohoo et al, 2009). Because scrapie has a long
incubation period, measuring the incidence will not give useful information.
Prevalence (p) is often expressed as a percentage with values between 0% and 100%. It is
calculated as:
p = cases / population-at-risk (Equation 1.1)
where “cases” is the number of cases of disease in a population at a point in time, and the
population-at-risk is the total number of individuals (or sampling units) at risk at the same point
in time (Dohoo et al, 2009).
For stratified sampling, in particular, the prevalence p for the entire population is a
weighted average of the individual stratum prevalence with weights proportional to the number
of elements in each stratum (Levy and Lemeshow, 2008). The equation is thus written as
∑
∑
(Equation 1.2)
26
where N is used to denote the number of individuals in the target population, Nh is the number of
sampling units in each stratum h, L is the number of strata, and Wh=Nh/N is the proportion of the
total population belonging to stratum h.
1.5.3 Confidence interval
A confidence interval (CI) for an estimator indicates a range of values which includes the
true value with a desired probability before sampling. It consists of a lower and an upper limit.
The size of the interval depends, among other things, on the sample size (n) and confidence level
(1 – α), where α denotes an acceptable error probability and is generally set to 5%. As prevalence
is essentially a probability, a proper CI is naturally bound between 0 and 1 (or expressed as
between 0% and 100%).
Several methods have been applied in the past to estimate CI of disease prevalence
depending on different aspects of the disease. Scrapie is a rare disease that varies geographically
and might go undetected in areas with low sheep populations; indeed no case of scrapie has ever
been detected among sheep from British Columbia as shown in Table 1.1 (CFIA, 2012b). When
the prevalence is equal to 0%, the normal CI estimation method, i.e. the Wald interval, will result
in a degenerated confidence interval at the point 0%, which does not give useful information.
Therefore, alternative methods to estimate the CI for the prevalence are required. For rare
diseases, methods to estimate CI, such as continuity corrected Wald interval, Clopper-Pearson
exact interval, Agresti-Coull interval, and Wilson score interval, will be explained in chapter 2.
1.6 Study rationale and objectives
Scrapie is a fatal disease, yet is shown to have low prevalence in the European countries,
in the US as well as in Canada. Controlling the spread of the disease is critical; however, an
infected flock may not be detected until extensive loss has occurred. The origins of infected

27
animals need to be confirmed, and the contaminated areas and disease-free areas need to be
identified. The US-Canada trading border for live sheep has remained closed since May 20,
2003, in part because Canada has not kept pace with other developed countries with respect to
implementation of a national surveillance program for scrapie. Economic loss from international
trade has affected small ruminant producers and has created a financial burden for the Canadian
government.
An eradication plan is in development with the aim that Canada achieves scrapie-free
status according to World Organization for Animal Health (OIE) standards. According to the
OIE, a country or zone can be considered scrapie free when a representative and sufficient
number of sheep and goats over 18 months of age (sample size assuming 0.1% prevalence) are
tested annually with no case found for at least seven years (World Organization for Animal
Health—OIE, 2013b). In order to achieve this goal, the CFIA, CSF, Canadian Sheep Breeders’
Association (CSBA), Canadian National Goat Federation (CNGF) and Agriculture and Agri-
Food Canada have partnered to support a “National Scrapie Prevalence Study”. Scrapie Canada,
a division of the CSF, is devoted to working on scrapie control in Canada. In spring 2010,
Scrapie Canada received funding through the Agri-Flexibility Fund for the National
Transmissible Spongiform Encephalopathy (TSE) Eradication Plan from Agriculture and Agri-
Food Canada. An extensive active surveillance program for scrapie was conducted between
November 2010 and December 2012, in order to sample sufficient animals to meet surveillance
targets, many more animals than had been previously sampled in prior years.
1.6.1 Objectives
The goal of this thesis project is to investigate the prevalence of classical scrapie in the
adult Canadian sheep population. Specific objectives are

28
(i) Review methods for point and confidence interval estimation appropriate for rare
disease conditions.
(ii) Estimate the prevalence of scrapie in Canada and its provinces at the individual sheep
and at the farm level
(iii) Assess the geographic distribution of available sample information to inform
activities for future disease surveillance and eradication.

29
1.7 References
Aguzzi, A., 2008. Unraveling prion strains with cell biology and organic chemistry. Proceedings
of the National Academy of Sciences of the United States of America 105 (1): 11–2.
Alton, G., Pearl, D., Bateman, K.G., McNab, W.B., Berke, O., 2012. Suitability of bovine
portion condemnations at provincially-inspected abattoirs in Ontario Canada for food
animal syndromic surveillance. BMC Veterinary Research 8:88.
Andreoletti, O., Berthon, P., Marc, D., Sarradin, P., Grosclaude, J., van Keulen, L., Schelcher, F.,
Elsen, J-M., Lantier, F., 2000. Early accumulation of PrPSc in gut-associated lymphoid
and nervous tissues of susceptible sheep from a Romanov flock with natural
scrapie.Journal of General Virology 81,3115-3126.
Andréoletti, O., Orgek L., Benestad, S.L., Beringue, V., Litaise, C., Simon, S., Le Dur, A.,
Laude, H., Simmons, H., Luga, S., Corbiere, F., Costes, P., Morel, N., Schelcher, F.,
Lacroux, C., 2011. Atypical/Nor98 scrapie infectivity in sheep peripheral tissues. PLoS
Pathog 7(2): e1001285. doi:10.1371/journal.ppat.1001285
Baylis, M., Houston, F., Goldmann, W., Hunter N., McLean, A.R., 2000. The signature of
scrapie: differences in the PrP genotype profile of scrapie-affected and scrapie-free UK
sheep flocks. Proc. R. Soc. Lond. B, 267:2029-2035.
Baylis, M., Chihota, C., Stevenson, E., Goldmann, W., Smith, A., Sivarn, K., Tongue, S.,
Gravenor, M.B., 2004. Risk of scrapie in British sheep of different prion protein
genotype. J. Gen. Virol, 85(9), 2735-2740.
Becher, G. S., Copeland, C. W., Lister, S. A., editors, 2008. Mad Cow Disease (Bovine
Spongiform Encephalopathy). Nova Science Publishers, Inc., New York, pp 2.
Bellworthy, S.J., Dexter, G., Stack, M., Chaplin, M., Hawkins, S.A.C., Simmons, M.M., Jeffrey,
M., Martin, S., Gonzalez, L., Hill, P., 2005. Natural transmission of BSE between sheep
within an experimental flock. Vet Rec, 157:206.
Belt, P.B., Muileman, I.H., Schreuder, B.E., Bos-de Ruijter, J., Gielkens, A. L., Smits, M.A.,
1995. Identification of five allelic variants of the sheep PrP gene and their association
with natural scrapie. J Gen Virol. 76 (Pt 3): 509-17.
Bendheim, P.E., Bockman, J.M., McKinley, M.P., Kingsbury, D.T., Prusiner, S.B., 1985. Scrapie
and Creutzfeldt-Jakob disease prion proteins share physical properties and antigenic
determinants. PNAS 82 (4): 997-1001
Benestad, S. L., Arsac, J., Goldmann, W., Noremark, M., 2008. Atypical/Nor98 scrapie:
properties of the agent, genetics, and epidemiology. Vet. Res., 39(4), 19.
Birch, C.P., Del Rio Vilas, V.J., Chikukwa, A.C., 2010. A “shotgun” method for tracing the birth
locations of sheep from flock tags, applied to scrapie surveillance in Great Britain. Prev.
Vet. Med., 96 (3-4), 218-25.
Bons, N., Mestre-Frances, N., Belli, P., Cathala, F., Gajdusek, D.C., Brown, P., 1999. Natural
and experimental oral infection of nonhuman primates by bovine spongiform
encephalopathy agents. PNAS 96 (7): 4046-4051.
Bruce, M. E., Will, R. G., Ironside, J. W.,McConnell, I., Drummond, D., Suttie, A., McCardle,
L., Chree, A., Hope, J., Birkett, C., Cousens, S., Fraser, H., Bostock, C. J., 1997.
Transmissions to mice indicate that ‘new variant' CJD is caused by the BSE agent. Nature
389: 498-501.
Canadian Food Inspection Agency (CFIA), 2011. Animal Health Compensation - What to expect
when an animal is ordered destroyed. Retrieved May 2013 from:
30
http://www.inspection.gc.ca/animals/terrestrial-
animals/diseases/compensation/eng/1313712524829/1313712773700
Canadian Food Inspection Agency (CFIA), 2012a. Scrapie surveillance: eradicating scrapie from
Canada. Retrieved Jan 2012 from:
http://www.inspection.gc.ca/english/anima/disemala/scrtre/surve.shtml
Canadian Food Inspection Agency (CFIA), 2012b. Flocks infected with scrapie in Canada in
2011. Retrieved Mar 2012 from: http://www.inspection.gc.ca/animals/terrestrial-
animals/diseases/reportable/2011/flocks-infected-in-
2011/eng/1329729421107/1329729572094
Canadian Food Inspection Agency (CFIA), 2012c. Canadian sheep identification program.
http://www.inspection.gc.ca/animals/terrestrial-animals/traceability/sheep-
identification/eng/1328852777479/1328852957523
Canadian Food Inspection Agency (CFIA), 2012d. Scrapie genotyping.
http://www.inspection.gc.ca/animals/terrestrial-
animals/diseases/reportable/scrapie/genotyping/eng/1356066354790/1356066497693
Canadian Food Inspection Agency (CFIA), 2012e. Fact sheet –
scrapie.http://www.inspection.gc.ca/animals/terrestrial-
animals/diseases/reportable/scrapie/fact-sheet/eng/1356131973857/1356132310673
Canadian Food Inspection Agency (CFIA), 2012f. Scrapie - What to expect if your animals may
be infected. http://www.inspection.gc.ca/animals/terrestrial-
animals/diseases/reportable/scrapie/if-your-animals-may-be-
infected/eng/1355963623752/1355963789207
Canadian Sheep Federation (CSF), Canadian Sheep Breeders’ Association, Canadian
Cooperative Wool Growers, Canadian National Goat Federation, Canadian Livestock
Genetics Association, 2009. Briefing note to the minister of agriculture and agri-food: A
national strategy for scrapie eradication.
Canadian Sheep Federation (CSF), 2011a. Myth: Allowing sheep to transit through Canada from
the northern US states to Alaska puts the Canadian industry at a disadvantage. Retrieved
from: http://www.cansheep.ca/User/Docs/POV%20Summer%20Edition%202011.pdf
Canadian Sheep Federation (CSF), retrieved Nov 2011b. Scrapie Eradication Programs.
http://www.cansheep.ca/cms/en/Programs/NSPrograms/NSProgram.aspx
Canadian Sheep Federation (CSF), retrieved Aug 2012a. Key Milestones for Mandatory RFID.
http://www.cansheep.ca/cms/en/key_milestones.aspx
Canadian Sheep Federation (CSF), retrieved Aug 2012b. RFID Tagging Videos.
http://www.cansheep.ca/cms/en/tagvideos.aspx
Chou, S.M., Martin, J.D., 1971. Kuru-plaques in a case of Creutzfeldt-Jakob disease. Acta
Neuropathologica, Vol 17, No. 2, 150-155.
Code of Federal Regulations, 2012. Section 79.2 - Identification of sheep and goats in interstate
commerce.
Da Costa Dias, B., Javanovic, K., Weiss, S.F., 2011. Alimentary prion infections: Touchdown in
the intertine. Prion, 5(1), 6-9.
Dennis, M.M., Thomsen, B.V., Marshall, K.L., Hall, S.M., Wagner, B.A., Salman, M.D.,
Norden, D.K., Gaise,r C, Sutton, D.L., 2009. Evaluation of immunohistochemical
detection of prion protein in rectoanal mucosa-associated lymphoid tissue for diagnosis
of scrapie in sheep. Am J Vet Res 70:63-72
31
Department for Environment Food and Rural Affairs (DEFRA), 2010. ARCHIVE: BSE: Other
TSEs – Scrapie. Retrieved from:
http://archive.defra.gov.uk/foodfarm/farmanimal/diseases/atoz/bse/othertses/scrapie/
Detwiler, L.A., 1992. Scrapie. Rev. Sci. Tech. Off. Int. Epiz. 11, 491-537.
Detwiler, L.A., Baylis, M., 2003. The epidemiology of scrapie. Rev Sci Tech., 22(1),121-43.
Dohoo, I., Martin W., Stryhn, H., 2009. Veterinary Epidemiologic Research. (2nd ed.).
Charlottetown , PEI, Canada, pp: 33-53.
Eloit, M., Adious, K., Coulpier, M. Fontaine, J.J., Hamel, R. Lilin, T. Messiaen, S., Andreoletti,
Ol, Baron, T., Bencsik, A., Biacabe, A.G., Berinque, V., Laude, H., Le Dur, A., Vilotte,
J.L., Comoy, E., Deslys, J.P., Grassi, J., Simon, S., Lantier, F., Sarradin, P., 2005. BSE
agent signatures in a goat. Vet. Rec., 156(16), 523-4.
The European Commission, 2012. Report on the monitoring of ruminants for the presence of
transmissible spongiform encephalopathies (TSEs) in the EU in 2011. Retrieved from:
http://ec.europa.eu/food/food/biosafety/tse_bse/monitoring_annual_reports_en.htm
The European Commission, 2013. TSE/BSE – Feed Ban. Retrieved Jan 2013 from:
http://ec.europa.eu/food/food/biosafety/tse_bse/feed_ban_en.print.htm
Everest, D.J., Waterhouse, S., Kelly, T., Velo-Rego, E., Sauer, M.J., 2007. Effectiveness of
capillary electrophoresis fluoroimniunoassay of Blood PrPSc for evaluation of
pathogenesis in sheep scrapie. J. Vet. Diagn. Invest., 19(5):552-7.
Foster J.D., Dickinson, A.G., 1989. Age at death from natural scrapie in a flock of Suffolk sheep.
Vet. Rec 125, 415–417.
Foster, J. D., Parnham, D., Chong, A., Goldmann, W., Hunter, N., 2001. Clinical signs,
histopathology and genetics of experimental transmission of BSE and natural scrapie to
sheep and goats. Vet. Rec., 148(6):165-171
Foster, J., McKenzie C., Parnham, D., Drummond, D., Goldmann, W., Stevenson, E., Hunter. N.,
2006. Derivation of a scrapie-free sheep flock from the progeny of a flock affected by
scrapie. Vet. Rec. 159, 42–45.
Gajdusek, D.C., 2008. Kuru and its contribution to medicine. Phil. Trans. R. Soc. B 27
363(1510): 3697-3700.
Gregoire, T. G., Valentine, H. T., 2008. Sampling strategies for natural resources and the
environment. Boca Raton, Florida, USA, Taylor & Francis Group, LLC, pp393-404.
Gibbs, C. J. Jr., Amyx, H. L., Bacote, A., Masters, C.L., Gajdusek, D.C., 1980. Oral transmission
of Kuru, Creutzfeldt-Jakob Disease, and scrapie to nonhuman primates. J. Infect. Dis.
142( 2), 205-208.
Goldmann, W., 2008. PrP genetics in ruminant transmissible spongiform encephalopathies. Vet
Res, 39(4):30.
González, L., Dagleish, M. P., Bellworthy, S. J., Sisó, S., Stack, M. J., Chaplin, M. J., Davis, L.
A., Hawkins, S. A. C., Hughes, J., Jeffrey, M., 2006. Postmortem diagnosis of preclinical
and clinical scrapie in sheep by the detection of disease-associated PrP in their rectal
mucosa. Veterinary Record,158: 325-331
Green, D.M., Vilas, V.J.D.R., Birch, C.P.D., Johnson, J., Kiss, I.Z., McCarthy, N.D., Kao, R.R.,
2007. Demographic risk factors for classical and atypical scrapie in Great Britain. J Gen
Viral, vol. 88 no. 12 3486-3492.
Greenlee, J. J., Smith, J.D., Kunkle, R.A., 2011. White-tailed deer are susceptible to the agent of
sheep scrapie by introcerebral inoculation. Veterinary Research 42:107.
Greenwood, P., 2002. Federal disease control. Can Vet J, 43(8):625-629.
32
Gubbins, S., McIntyre, K.M., 2009. Prevalence of sheep infected with classical scrapie in Great
Britian, 1993-2007. Epidemiol Infect., 136(6): 787-91.
Haldane J.B.S., (1945). On a method of estimating frequencies, Biometrika 33:222-225
Hamir, A.N., Kunkle, R.A., Cutlip, R.C., Miller, J.M., Williams, E.S., Richt, J.A., 2006.
Transmission of chronic wasting disease of mule deer to Suffolk sheep following
intracerebral inoculation. J Vet Diagn Invest. 18(6): 558-65.
Hautaniemi, M., Tapiovaara, H., Korpenfelt, S.L., Sihvonen, L., 2012. Genotyping and
surveillance for scrapie in Finnish sheep. BMC Vet Res., 8:122.
Hunter, N., Cairns, D., 1998. Scrapie-free Merino and Poll Dorset sheep from Australia and New
Zealand have normal frequencies of scrapie-susceptible PrP genotypes. J. Gen. Virol., 79
(Pt 8):2079-82.
Iulini, B., Maurella, C., Pintore, M.D., Vallino Dostassa, E., Corbellini, D., Porcario, C.,
Pautasso, A., Salata, C., Gelmetti, D., Avanzato, T., Palu, G., D’Angelo, A., Caramelli,
M., Casalone, C., 2012. Ten years of BSE surveillance in Italy: Newropathological
findings in clinically suspected cases. Res. Vet. Sci., 93(2), 872-878.
Jeffrey, M., Martin, S., Gonzalez, L., Foster, J., Langeveld, J.P., van Zijderveld, F.G., Grassi, J.,
Hunter, N., 2006. Immunohistochemical features of PrP(d) accumulation in natural and
experimental goat transmissible spongiform encephalopathies. J.Comp. Pathol., 134(2-3),
171-81.
Kim, K., 2007. The Social Construction of Disease. Routledge, New York, NY, USA, pp. 107-
126.
Kirkwood, J.K., Cunningham, A.A., 1994. Epidemiological observations on spongiform
encephalopathies in captive wild animals in the British Isles. Vet. Rec. 135, 296-303.
Lacroux, C., Simon, S., Benestad, S.L., Maillet, S., Mathey, J., Lugan, S., Corbière, F., Cassard,
H., Costes, P., Bergonier, D., Weisbecker, J., Moldal, T., Simmons, H., Lantier, F.,
Feraudet-Tarisse, C., Morel, N., Schelcher, F., Grassi, J., Andréoletti, O., 2008. Prions in
milk from ewes incubating natural scrapie. PLoS Pathog, 4(12): e1000238.
Levy, P. S., Lemeshow, S., 2008. Sampling of Populations: Methods and Applications (Forth
Edition). John Wiley & Sons, Inc., Hoboken, NJ, USA, pp. 121-139.
Library of Parliament (LOP), retrieved Mar 2012. Mad cow disease and Canada’s cattle industry.
http://www.parl.gc.ca/Content/LOP/ResearchPublications/prb0301-e.htm
Lynn, T., Grannis, J., Williams, M., Marshall, K., Miller, R., Bush, E., Bruntz, S., 2007. An
evaluation of scrapie surveillance in the United States. Prev Vet Medicine. 81:70-79
Mackay, G.A., Knight, R.S.G., Ironside, J.W., 2011. The molecular epidemiology of variant
CJD. Int J Mol Epidemial Genet. 2(3): 217-227.
Migliore, S., Esposite, E., Pirisinu, L., Marcon, S., Bari, M.D., Agostino, C.D., Chiappini, B.,
Conte, M., Sezzi, E., Grossi, L.D., Agrimi, U., Vaccari, G., Nonno, R., 2012. Effect of
PrP genotype and route of inoculation on the ability of discriminatory western blot to
distinguish scrapie from sheep BSE. J Gen Viral, 93(2): 450-455.
Monleón, E., Monzón, M., Hortells, P., Bolea, R., Acín, C., Vargas, F., Badiola, J.J., 2005.
Approaches to scrapie diagnosis by applying immunohistochemistry and rapid tests on
central nervous and lymphoreticular system. J Viral Methods. 125(2):165-171.
The National CJD Research & Surveillance Unit (NCJDRSU), 2013. Variant vCJD: current data,
June 201. Retrieved from: http://www.cjd.ed.ac.uk/documents/worldfigs.pdf
33
Ontario Sheep Marketing Agency2011. Retrieved June 2011 from:
http://www.ontariosheep.org/MARKETINFORMATION/MarketReports/MonthlyMarket
Summary.aspx
Ortiz-Pelaez, A., R. Warner, M. Arnold, 2011. Sheep and goats scrapie surveillance 2010. Joint
descriptive report for Great Britain. Retrieved Dec 2011 from:
http://vla.defra.gov.uk/science/docs/sci_tse_stats_scrapie.pdf
Ortiz-Pelaez, A., R. Warner, M. Arnold, 2012. Sheep and goats scrapie surveillance 2011. Joint
descriptive report for Great Britain. Retrieved Dec 2012 from:
http://www.defra.gov.uk/ahvla-en/files/pub-tse-stats-scrapie.pdf
O'Rourke, K.I., Duncan, J.V., Logan, J.R., Anderson, A.K., Norden, D.K., Williams, E.S.,
Combs, B.A., Stobart, R.H., Moss, G.E., Sutton, D.L., 2002. Active surveillance
for scrapie by third eyelid biopsy and genetic susceptibility testing of flocks of sheep in
Wyoming. Clin Diagn Lab Immunol. 9 (5):966-71.
Parry, H. B., 1983. Scrapie Disease in Sheep: Historical, Clinical, Epidemiological, Pathological
and Practical Aspects of the Natural Disease (Edited by D. R. Oppenheimer). Academic
press Inc. (London) LTD. New York, New York, pp. 93-102.
Pearson, G.R., Wyatt, J.M., Gruffydd-Jones, T.J., Hope, J., Chong, A., Higgins, R.J., Scott, A.C.,
Wells, G.A., 1992. Feline spongiform encephalopathy: fibril and PrP studies. Vet Rec
1992;131:307-310.
Petrie, A., Watson, P., 2006. Statistics for Veterinary and Animal Science (second edition).
Blackwell, Oxford, pp. 12-53.
Saunders, G.C., Cawthraw, S., Mountjoy, S.J., Hope, J., Windl, O., 2006. PrP genotypes of
atypical scrapie cases in Great Britain. J Gen Viral. 87 (11): 3141-3149.
Scheaffer, R.L., Mendenhall, W. III, Ott, R.L., Gerow, K. G., 2011. Elementary Survey
Sampling. (7th ed.). Boston, MA, USA.
Schreuder, B. E. C., van Keulen, L. J. M., Vromans, M. E. W., Langeveld, J. P. M., Smits,
M.A., 1998. Tonsillar biopsy and PrPSc detection in the preclinical diagnosis of scrapie.
Veterinary Record 142,564-568
Scrapie Canada, retrieved Aug 2012. Voluntary scrapie flock certification program,
http://www.scrapiecanada.ca/certification.html
Scrapie Canada, retrieved Jul 2013a. VSFCP National Standards (Revised March 2013).
http://www.scrapiecanada.ca/VSFCPrules-regs.html
Scrapie Canada, retrieved Jul 2013b. Welcome to Scrapie Canada.
http://www.scrapiecanada.ca/home.html
Scrapie Canada, retrieved Apr 2014. Strategic planning for scrapie eradication. Retrieved from:
http://www.scrapiecanada.ca/eradication.html
Sigurdson, C. J., Miller, M.W., 2003. Other animal prion diseases. Br Med Bull 66(1): 199-212.
Spiropoulos, J., Casalone, C., Caramelli, M., Simmons, M.M., 2007. Immunohistochemistry for
PrPSc in natural scrapie reveals patterns which are associated with the PrP genotype.
Neuropath Appl Neuro 33 (4): 398-409.
Spiropoulos, J., Lockey, R., Sallies, R.E., Terry, L.A., Thorne, L., Holder, T.M., Beck, K.E.,
Simmons, M.M., 2011. Isolation of Prion with BSE Properties from Farmed Goat.
Emerg. Infect. Dis., 17(12), 2253-2261.
Statistics Canada, 2007. Farms, by farm type and province (Census of Agriculture, 2006).
http://www.statcan.gc.ca/tables-tableaux/sum-som/l01/cst01/agrc35a-eng.htm

34
Statistics Canada, 2012. Supply and demand reports from year 2006 to 2011, Retrieved Jun 2012
from: http://www.statcan.gc.ca/pub/23-011-x/2011002/tablesectlist-listetableauxsect-
eng.htm
Statistics Canada, retrieved May 2013. Sheep inventories, by province.
http://www.statcan.gc.ca/tables-tableaux/sum-som/l01/cst01/prim52a-eng.htm
Thuring, C.M.A., Erkens, J.H.F., Jacobs, J.G., Bossers, A., Van Keulen, L.J.M., Garssen, G.J.,
Van Aijderveld, F.G., Ryder, S.J., Groschup, M.H., Sweeney, T., Langeveld, J.P.M.,
2004. Discrimination between scrapie and bovine spongiform encephalopathy in sheep
by molecular size, immunoreactivity, and glycoprofile of prion protein. J Clin Microbiol,
42(3): 972-980.
United States Department of Agriculture (USDA), 2004. Phase II: Scrapie: ovine slaughter
surveillance study 2002-2003. Retrieved from:
http://www.aphis.usda.gov/animal_health/animal_diseases/scrapie/downloads/sossphase2
United States Department of Agriculture (USDA), Animal and Plant Health Inspection Service
(APHIS), Veterinary Services Centers for Epidemiology and Animal Health (VSCEAH),
National Surveillance Unit (NSU) & Fort Collins, CO., 2010. National scrapie
surveillance plan. Retrieved from:
http://www.aphis.usda.gov/animal_health/animal_diseases/scrapie/downloads/national_s
crapie_surv_plan.pdf
United States Department of Agriculture (USDA), 2013. Final Rule: Traceability for Livestock
Moved Interstate. January 11, 2013. Summary of General Requirements by Species.
Effective Date: March 11, 2013. Retrieved from:
http://www.aphis.usda.gov/traceability/downloads/ADT_summary_species.pdf
van Keulen, L. J. M., Schreuder, B. E. C., Meloen, R. H., Mooijharkes, G., Vromans, M. E. W.
& Langeveld, J. P. M., 1996. Immunohistochemical detection of prion proteins in
lymphoid tissues of sheep with natural scrapie. Journal of Clinical Microbiology
34,1228-1231
Vergne, T., Calavas, D., Cazeau, G., Durand, B., Dufour, B., Grosbois, V., 2012. A Bayesian
zero-truncated approach for analysing capture-recapture count data from classical scrapie
surveillance in France. Prev Vet Med., 105 (1-2): 127-135.
Wilesmith, J.W., Ryan, J.B., Atkinson, M.J., 1991. Bovine spongiform encephalopathy:
epidemiological studies on the origin. Vet Rec;128:199-203
Wiggins, R.C., 2009. Prion Stability and Infectivity in the Environment. Neurochemical
Research, 34(1): 158-168.
World Health Organization (WHO), 2011. Retrieved Jun 2012 from:
http://www.who.int/mediacentre/factsheets/fs113/en/
World Health Organization (WHO), 2013. Retrieved April 2013 from:
http://www.who.int/mediacentre/factsheets/fs180/en/
World Organisation for Animal health (OIE), 2013a. BSE situation in the world and annual
incidence rate. Retrieved May 2013 from: http://www.oie.int/?id=504
World Organization for Animal Health—OIE, 2013b. Terrestrial Animal Health Code. Chapter
14.9. Scrapie.
http://www.oie.int/fileadmin/Home/eng/Health_standards/tahc/2010/en_chapitre_1.14.9.
htm

35
Woolhouse, M.E. J., Matthews, L., Coen, P., Stringer, S.M., Foster, J.D., Hunter, N., 1999.
Population dynamics of scrapie in a sheep flock. Philosophical Transactions: Biological
Sciences: Vol. 354, No. 1384.
Woolhouse, M.E.J., Coen, P., Matthews, L., Foster, J.D., Elsen, J., Lewis, R.M., Haydon, D.T.,
Hunter, N., 2001. A centuries-long epidemic of scrapie in British sheep? Trends
Microbiol., 9(2): 67-70.

36
Table 1.1: Sheep flocks infected with scrapie in Canada: 1984 – 2011 (CFIA, 2012b)
Year BC AB SK MB ON QC
Atlantic
Provinces Total
2011 0 0 0 0 3 3 0 6
2010 0 2 0 0 1 6 0 11
2009 0 0 0 0 0 2 0 6
2008 0 0 0 0 2 3 1 6
2007 0 0 0 0 1 0 0 2
2006 0 0 0 1 1 0 0 2
2005 0 0 0 2 0 2 0 4
2004 0 0 0 0 0 1 0 1
2003 0 1 6 0 1 4 0 12
2002 0 0 0 0 0 4 0 4
2001 0 0 0 8 0 4 0 12
2000 0 0 0 3 0 8 0 11
1999 0 0 3 1 2 8 0 14
1998 0 0 0 0 2 29 0 31
1997 0 0 0 0 2 14 0 16
1996 0 0 0 0 2 3 0 5
1995 0 0 0 0 1 2 0 3
1994 0 0 0 0 1 1 0 2
1993 0 1 0 0 3 4 1 9
1992 0 0 1 0 1 1 0 3
1991 0 0 0 0 3 2 1 6
1990 0 0 1 0 5 0 0 6
1989 0 0 2 0 5 2 0 9
1988 0 0 1 0 3 0 0 4
1987 0 0 1 0 0 0 0 1
1986 0 0 1 0 3 0 0 4
1985 0 0 1 0 2 1 0 4
1984 0 0 0 0 1 1 0 2
Total 0 4 17 15 45 105 3 196

37
Table 1.2: Scrapie genotyping risk groups categorized by UK (Baylis et al., 2001)
Risk to scrapie (from most
resistant to most acceptable)
Some genotypes representing the group (letters refer to codon
136, 157 and 171 respectively)
R1 (most resistant) ARR/ARR
R2 (resistant) ARR/ARQ, ARR/AHQ, ARR/ARH
R3 (have little resistance) ARQ/ARQ, ARH/ARH
R4 (susceptible) VRQ/ARR
R5 (highly susceptible) VRQ/AHQ, VRQ/ARQ, VRQ/ARH, VRQ/VRQ

38
Table 1.3 Canadian sheep population as of January 1, 2013, by province (Statistics Canada,
2013)
Province Mature
Sheep Lamb
AB 98.2 59.8
BC 27.7 19.3
MB 29.4 28.6
NB 4.7 2.9
NL 1.2 0.9
NS 12.5 7.1
ON 194.2 74.8
PE 4.1 3.3
QC 146.8 75.2
SK 62.1 39.9
Canada 580.9 311.8
Notes:
Ram: Male sheep.
Ewe: Female sheep which has borne young.

39
Figure 1.1 Sheep population from 2000 to 2011 as of July 1st of each year (in thousands of
heads) (Stats Canada, 2011)
0
200
400
600
800
1000
1200
1400
2000 2001 2002 2003 2004 2005 2006 2007 2008 2009 2010 2011
Tho
usa
nd
s o
f h
ead
s
Year
Total (sheep and lambs) 1 year or younger Ewes and rams
First case of BSE was
diagnosed in Canada
on May 20, 2003

40
Figure 1.2 Canada’s sheep inventories as of July 1, 2012 and January 1, 2013 (Statistics Canada,
2013)
Notes:
Unit: thousand head
Ram: Male sheep.
Ewe: Adult female sheep
0
200
400
600
800
1,000
1,200
Total Mature sheep Rams Ewes Lambs
Jul-12
Jan-13
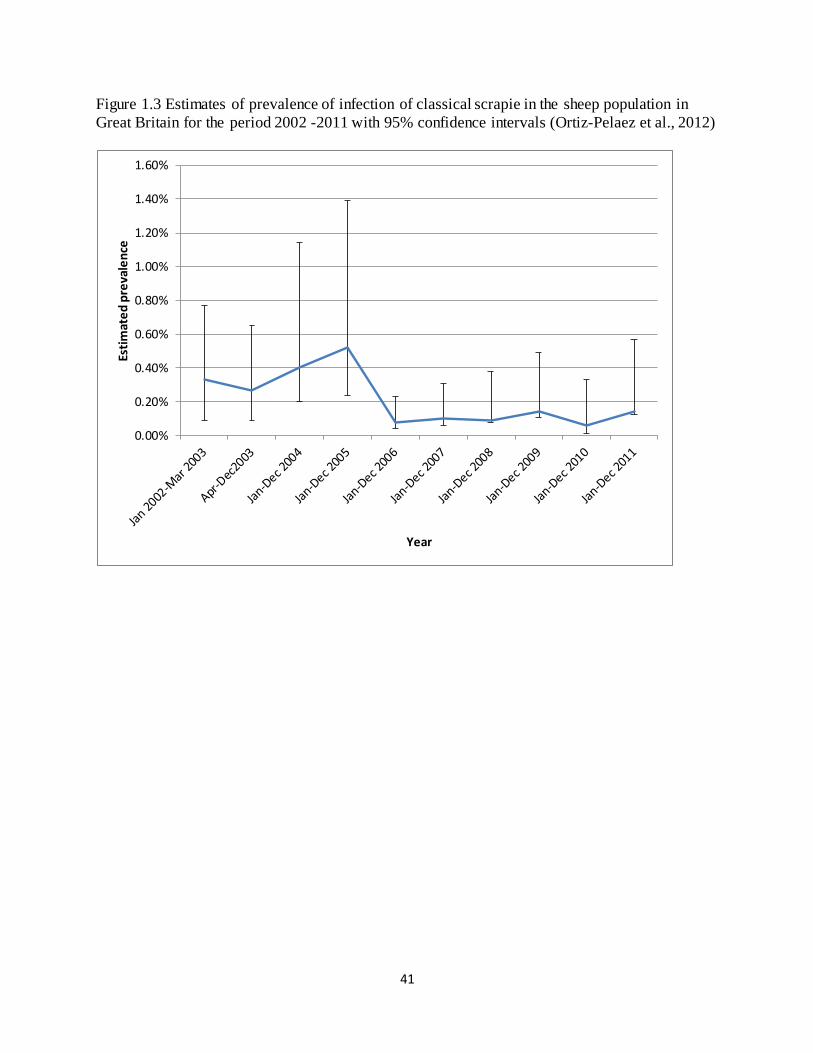
41
Figure 1.3 Estimates of prevalence of infection of classical scrapie in the sheep population in
Great Britain for the period 2002 -2011 with 95% confidence intervals (Ortiz-Pelaez et al., 2012)
0.00%
0.20%
0.40%
0.60%
0.80%
1.00%
1.20%
1.40%
1.60%
Esti
mat
ed
pre
vale
nce
Year
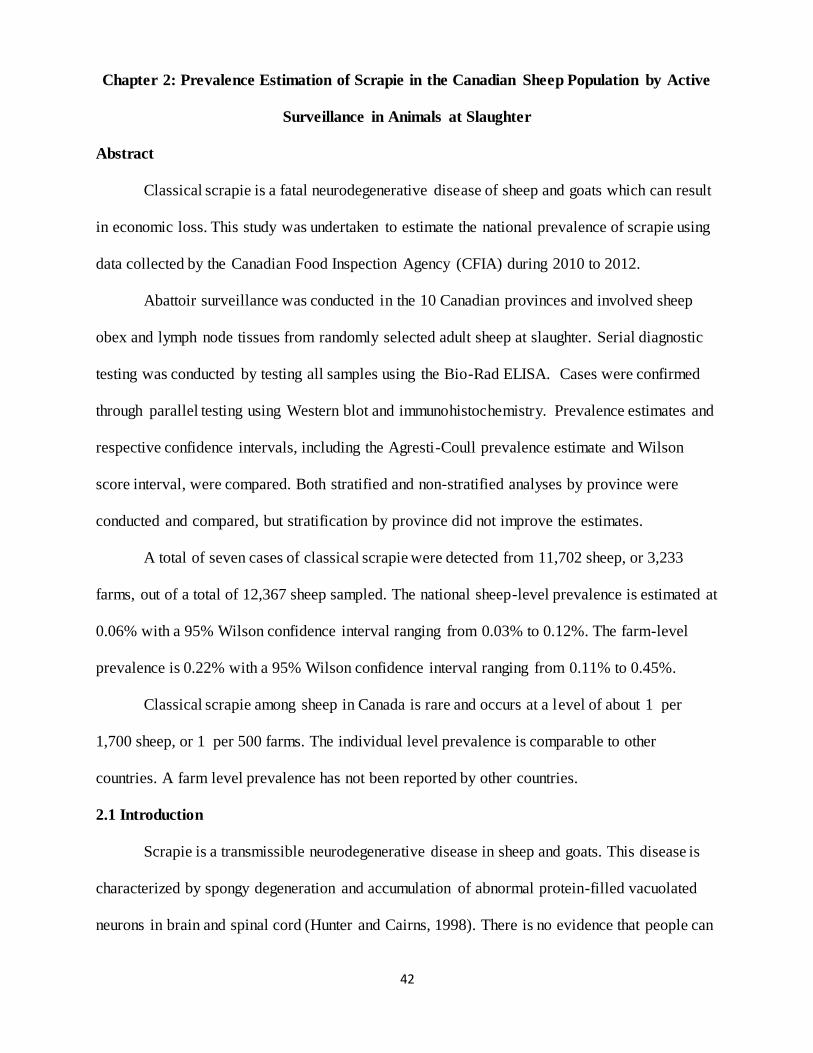
42
Chapter 2: Prevalence Estimation of Scrapie in the Canadian Sheep Population by Active
Surveillance in Animals at Slaughter
Abstract
Classical scrapie is a fatal neurodegenerative disease of sheep and goats which can result
in economic loss. This study was undertaken to estimate the national prevalence of scrapie using
data collected by the Canadian Food Inspection Agency (CFIA) during 2010 to 2012.
Abattoir surveillance was conducted in the 10 Canadian provinces and involved sheep
obex and lymph node tissues from randomly selected adult sheep at slaughter. Serial diagnostic
testing was conducted by testing all samples using the Bio-Rad ELISA. Cases were confirmed
through parallel testing using Western blot and immunohistochemistry. Prevalence estimates and
respective confidence intervals, including the Agresti-Coull prevalence estimate and Wilson
score interval, were compared. Both stratified and non-stratified analyses by province were
conducted and compared, but stratification by province did not improve the estimates.
A total of seven cases of classical scrapie were detected from 11,702 sheep, or 3,233
farms, out of a total of 12,367 sheep sampled. The national sheep-level prevalence is estimated at
0.06% with a 95% Wilson confidence interval ranging from 0.03% to 0.12%. The farm-level
prevalence is 0.22% with a 95% Wilson confidence interval ranging from 0.11% to 0.45%.
Classical scrapie among sheep in Canada is rare and occurs at a level of about 1 per
1,700 sheep, or 1 per 500 farms. The individual level prevalence is comparable to other
countries. A farm level prevalence has not been reported by other countries.
2.1 Introduction
Scrapie is a transmissible neurodegenerative disease in sheep and goats. This disease is
characterized by spongy degeneration and accumulation of abnormal protein-filled vacuolated
neurons in brain and spinal cord (Hunter and Cairns, 1998). There is no evidence that people can

43
contract scrapie from contact with livestock or by consuming sheep meat or products (CFIA,
2012a). Scrapie belongs to a group of diseases known collectively as transmissible spongiform
encephalopathies (TSE). Examples of TSE diseases include bovine spongiform encephalopathy
(BSE) in cattle, chronic wasting disease (CWD) in elk and deer, and Creutzfeldt Jakob disease
(CJD) and kuru in human beings. The disease is believed to be caused by an accumulation of an
abnormal or misfolded form of so-called prion proteins in tissues such as the brain in a way that
its function is disrupted; the term prion is derived from the words “protein” and “infection”
(Kim, 2007). Therefore, TSE diseases are also called prion diseases.
There are two types of scrapie: classical scrapie and atypical scrapie. In the scientific
literature, classical scrapie is usually referred to as scrapie, and atypical scrapie is specifically
noted as such. The history of classical scrapie can be traced back to the 18th century (Woolhouse
et al, 2001). Atypical scrapie was first confirmed in 1998 in Norway and differs in many ways
from classical scrapie (Benestad et al., 2008). Atypical scrapie, like classical scrapie, is a brain
degenerative condition in sheep and goats; however, the atypical form is spontaneously
occurring, is non-transmissible, occurs in older sheep and goats, and a genetic component has not
been found (Benestad et al., 2008). Because atypical scrapie is not a transmissible disease and is
not a major concern in infectivity studies, the current study focuses on classical scrapie.
Clinical signs of scrapie include but are not limited to weight loss, trembling, pruritus
without evidence of dermatitis, and lack of physical coordination. In the late stages of the
disease, the signs progress to paralysis and death (Foster and Dickinson, 1989). There is no
effective treatment for this disease. Scrapie, like all TSEs, has a 100% case fatality rate if
allowed to develop. The exact cause of the neurodegenerative changes in the prion protein (PrP)
is unknown, yet it is commonly accepted that scrapie is a naturally occurring infectious disease
with a genetic predisposition (Woolhouse et al, 1999).
44
Official scrapie surveillance programs have been established for many years in other
jurisdictions, e.g., the European Union since 2001 (The European Commission, 2012), the
United States (US) since 2002 for sheep and since 2007 for goats (the United States Department
of Agriculture, 2010). In Canada, scrapie has been categorized as a reportable disease since
1945 (CFIA, 2012a). A national surveillance program was initiated in May 2005 and restructured
to a more extended level in 2010 (Scrapie Canada, 2012). In May, 2003, live animal trade in
sheep and goats ceased between Canada and the USA due to a diagnosis of BSE in a bovine in
Alberta, Canada. The border has remained closed to sheep and goat breeding stock since this
date, partially because of a lack of prevalence data on scrapie (CSF, 2011).
The Canadian Food Inspection Agency (CFIA) implemented the mandatory Canadian
Sheep Identification Program (CSIP) in January, 2004 (Scrapie Canada, 2012). This program
requires all sheep to have approved CSIP ear tags applied before leaving the farm of origin. The
CSIP database includes identifying information on the producer who purchased the tags. If a
sheep is diagnosed with scrapie through active surveillance, the CSIP ID allows its identity to be
traced to the farm of origin, i.e. birth, thus providing geographic information as to the location of
potential scrapie positive flocks.
The objective of this study was to estimate the period prevalence of scrapie in the
Canadian sheep flock. Determining the prevalence will inform national strategies to lower this
prevalence so that Canada will reach compliance with the World Organization for Animal Health
(OIE) standards for scrapie-free status.
2.2 Materials and methods
2.2.1 Study design
A cross-sectional study was conducted over a two-year period from November 2010 to
December 2012 to obtain an estimate of the period prevalence of scrapie in the Canadian adult

45
sheep population in abattoirs. The period prevalence measures prevalence as the percentage of
cases in a sample that is collected over a period of time. The appropriate length of time is based
on characteristics and progress of the disease (Petrie and Watson, 2006). Scrapie is a rare and
chronic disease of adult sheep and usually manifests in animals that are two years of age or older.
For that reason, the target population was healthy adult sheep from Canadian farms that were
slaughtered at a Canadian abattoir.
The national scrapie prevalence study requires a large sample population due to the
disease’s low prevalence in Canada, as shown in Table 1.1 in Chapter 1 of this thesis. Only adult
sheep can be diagnosed with scrapie thus being collected in this study. The presence of
permanent incisors was used to determine the age of the sheep being sampled—when the first
permanent incisor erupts, the animal is one year old, thus an adult. However, only sheep with
readable CSIP tags, which enable CFIA agents to trace their flocks of origin, were included in
the analysis. This is to make sure the prevalence estimation for each province is accurate. To
ensure the samples were obtained strictly through active surveillance, only samples obtained at
the time of slaughter from healthy sheep at the abattoirs were used. Samples obtained by passive
surveillance (i.e. animals sampled directly from a farm or CFIA laboratory) were excluded. This
is because abattoir surveillance samples are considered to be from seemingly “healthy animals”,
whereas voluntary submissions through passive surveillance are considered to be from a higher
risk group for scrapie and therefore not representative of the period prevalence for Canada.
2.2.2 Sampling
The required sample size was determined to ensure that the prevalence can be accurately
estimated with 95% confidence. To achieve this, the target was to sample 15,000 sheep over a
period of two years (Olaf Berke, Scrapie among sheep in Canada-Sample size considerations for
prevalence estimation, unpublished report to the CFIA and CSF, University of Guelph, 2008).

46
CFIA agents were in charge of the sampling process, from both federally and provincially
inspected abattoirs, in all 10 Canadian provinces except Alberta. The three territories were not
included in the study because the respective sheep populations are considered negligible for the
purpose of this study. In Alberta, Alberta Agriculture and Rural Development (AARD) was in
charge of carrying out the sampling procedure and submitting information to CFIA. The detailed
sampling procedure for Alberta is described in “The Alberta Scrapie Prevalence Program”
(Hernan Ortegon, Alberta Agriculture and Rural Development, personal communication, 2011)
and for the rest of Canada in “Scrapie Prevalence Study Sampling Plan” (Heather Brown, CFIA,
Scrapie Prevalence Study Sampling Plan, personal communication, 2011). Both sampling frames
are summarized below.
Four federal abattoirs across Canada slaughtered sheep during the study period: one in
Ontario, two in Quebec, and one in Alberta. At federally inspected abattoirs, CFIA inspectors are
always on-site; therefore, they were able to sample every mature sheep slaughtered in these
abattoirs.
Due to the large number and the wide geographical distribution of provincially inspected
abattoirs, the sampling methods varied among provinces. Because a comprehensive list of sheep
slaughtered in Canada enabling simple random sampling (SRS) was not available, multistage
sampling was performed.
At provincially inspected abattoirs, the primary sampling stage was stratified by
province. Each province was considered a stratum, or the primary sampling unit. The secondary
sampling unit was the abattoir, but sampling methods differed between provinces. Cluster
sampling was conducted in Ontario and Quebec; convenience sampling was conducted in the
Atlantic Provinces and Alberta; and all abattoirs were selected in British Columbia,
Saskatchewan and Manitoba.

47
Cluster sampling was conducted as the second stage in Ontario and Quebec because of
the large number of sheep slaughtered: over 50% of Canadian sheep are slaughtered in these two
provinces. Abattoirs were divided into three clusters depending on their slaughtering capacity:
those processing 500 or more sheep per year (cluster 1), those processing 50 to 499 sheep per
year (cluster 2), and those processing fewer than 50 sheep per year (cluster 3). Only abattoirs in
clusters 1 and 2 were visited in this study. SRS was used in those two clusters to select the
abattoirs for this study. The week for an abattoir to be sampled was determined using a random
number generator; a CFIA agent would then pick the most appropriate day of that week to
sample (i.e., the day likely to provide the most samples), as many abattoirs slaughter sheep only
on certain days. For abattoirs which slaughter on multiple days per week, if possible, the agent
picked different slaughter days when repeat sampling at a particular site. This was to avoid over-
representation by certain populations; for example, because culls shipped from western Canada
are most likely sold at the Ontario auction markets on Monday and slaughtered in Ontario
abattoirs on Mondays or Tuesdays, inspectors were to avoid always sampling on Mondays and
Tuesdays. All mature sheep, which were presented for slaughtering on the day the abattoirs were
visited by CFIA inspectors, were sampled.
Convenience sampling was used as second stage sampling method in Atlantic Provinces
(New Brunswick, Prince Edward Island, Nova Scotia, and Newfoundland and Labrador), CFIA
inspectors took samples whenever the opportunity arose. For example, only when a CFIA
inspector was present at an abattoir where a mature sheep was being slaughtered, was the animal
sampled. In Nova Scotia, most or all of the sheep slaughtered were sampled because the
provincial inspectors at the Nova Scotia provincial abattoirs agreed to collect samples on behalf
of the CFIA.

48
Convenience sampling conducted in Alberta was performed by AARD provincial
inspectors. There are 54 provincially inspected abattoirs in Alberta. However, at the start of the
prevalence study, only four were processing a significant number of mature sheep on a regular
basis. Of those four abattoirs, one closed before the study was completed and one refused to
participate in the project. Therefore, samples representing about 80% of all mature sheep
slaughtered in Alberta were collected from two abattoirs which slaughtered sheep from the entire
province. A random selection of sampling dates was provided to these participating abattoirs,
based on the number of samples to be collected within the time frame and excluding non-
working days.
In British Columbia, Saskatchewan, and Manitoba mature sheep were sampled at
provincial abattoirs, which are staffed full-time with CFIA inspectors. All adult sheep
slaughtered in those plants were sampled.
The Pearson χ2-test was applied to test the proportional representativeness of samples
from each province by comparing the proportion of sheep population in each province (expected
value) with that of the sample population (observed value).
Tissues from either or both the obex section of the medulla oblongata of the brain and
retropharyngeal lymph nodes, when available, were collected from each sheep. In general, the
scrapie prion protein is more likely to be detected in the obex than retropharyngeal lymph nodes.
Samples were all sent to CFIA laboratories for scrapie testing.
2.2.3 Diagnostic testing
Diagnostic tests were performed on both lymphoid and obex tissues when available. The
screening diagnostic test used for this study was Bio-Rad ELISA (Bio-Rad Laboratories,
Inc., Hercules, California, USA;, according to CFIA-OLF Standard Operating Procedure, SOP
#SS-PR012.02, Heather Brown, CFIA 2010, personal communication).

49
Samples that were classified as positive by the Bio-Rad ELISA were submitted for
confirmatory testing by Western blot (WB) and immunohistochemistry (IHC). In scrapie testing,
WB is the accepted regulatory method of differentiating between classical and atypical scrapie
acts strain Nor98 (Heather Brown, CFIA, personal communication, CFIA-OLF Standard
Operating Procedure, SOP #SS-PR012.02, 2010). A positive result for classical scrapie from WB
or IHC is interpreted in parallel, i.e. any positive result is considered positive for scrapie.
This testing system is considered gold standard. The sensitivity and specificity are both
close to 100% and thus assumed to be perfect in all calculations.
2.2.4 Data management
Data on animal’s national ID, postal codes of farms of origin, the farm ID (i.e. Public
Account No.) and other sample information were recorded by the CFIA and ARRD inspectors
according to the time frame and location being sampled, using an electronic spreadsheet
(Microsoft Office Excel®, 2007). Testing results from the Bio-Rad ELISA test were also
recorded in the spreadsheets, and results from the WB and IHC tests were entered as comments
of the first test results, confirming the first test results and distinguishing atypical and classical
scrapie. Data were shared by the CFIA, under the confidentiality agreement, with researchers at
the University of Guelph, where the accuracy of data entry was reviewed and corrected where
possible, and missing values were identified. The resulting cleaned data set was then subjected to
statistical analysis using R 2.15.3 (R development team, 2012).
2.2.5 Prevalence and confidence interval estimation
Prevalence can be estimated in several ways and even more methods exist for estimating
respective confidence intervals. Due to the diversity of sampling methods involved for the
various provinces or strata, stratified sample estimation methods were applied and compared to
non-stratified estimation methods.

50
Ideally stratification will lead to a proportional representation of the target population in
the sample and estimators reduce to simple averages. When the target population is however not
proportionally represented, then post sampling stratification is necessary, and estimators are
based on weighted averages, where the weights represent the proportion of the strata in the target
population.
The stratified prevalence estimator of the total sample population p is a weighted average
of the individual stratum prevalence estimator ph, with weights (Wh=Nh/N) proportional to the
number of elements in each stratum (Levy and Lemeshow, 2008). The equation is thus written as
∑
∑
(Equation 2.1)
where N is the total number of sheep in Canada, Nh is the number of sheep in each stratum h
(each province), L is the number of strata or provinces (L=10), and Wh=Nh/N is the proportion of
the total population belonging to stratum h. N and Nh were obtained from Statistics Canada’s
semi-annual survey for January 1, 2013 (Statistics Canada, 2013).
The prevalence of scrapie has been reported by various countries at low levels of about 1
case per 1000 animals or below. Therefore non-standard approaches to estimating the prevalence
and its confidence interval (CI) were considered in order to select an appropriate method.
The Wald CI is the most commonly used approximation to estimate the CI for a
proportion or prevalence:
(Equation 2.2)
where p denotes the estimate of the proportion (prevalence), standard error
√ where q equals (1-p), and z denotes the appropriate percentile of the standard Gaussian
distribution which for the usual two-sided 95% interval is 1.96. The major limitation of the Wald
CI for prevalence is the lower coverage than the nominal level (McV Messam et al., 2008). The
attained coverage was only 0.881 on average when the nominal coverage level 1-α was set at

51
0.95 in an experiment by Newcombe (2013). This coverage limit can be improved by using the
continuity-corrected Wald interval, for which the formula becomes
√
(Equation 2.3)
However, the increased coverage does not solve another problem of the Wald interval: the lower
or upper limit could go beyond the boundaries of 0 and 1. Therefore, the Wald and continuity-
corrected Wald interval approximation have poor performance when the true prevalence is close
to or equal to 0 or 1. Neither method is appropriate to estimate the CI in the current context.
The Agresti-Coull CI, or modified Wald CI, is especially designed for situations when
the true prevalence is expected to be close to 0. The prevalence is then estimated by the
shrinkage estimator:
(Equation 2.4)
where ψ is a pseudo frequency greater than 0 and is commonly set to be (Newcombe,
2013). For the default 95% CI, z=1.96 and ψ=1.92 2. Hence, the formula is reduced to
(Equation 2.5)
which represents the addition of 2 cases and 2 non-cases. Note that for small samples this
estimate is close to 0.5, but with increasing sample size it will move towards the true prevalence.
The Agresti-Coull CI is:
√{ ( )
} √{
( )
} (Equation 2.5)
This method reduces but does not eliminate the boundary violation problem. In the case where
the true prevalence is 0 or 1, a CI of a point (which happens in the case of Wald CI) is avoided.
However, its limits can still go beyond the boundaries of 0 and 1.
The Wilson score CI, although closely related to the Wald formula, corrects the boundary
anomalies problem. With a slight modification, the Wilson score CI performs well even when the

52
total sample size n is small, or when p or q is at or near zero (Newcombe, 2013). The standard
error imputed to p is √
instead of √
, where p is the prevalence estimator based
on the data observed and is the unknown true population prevalence. The lower and upper
limits are obtained by solving for π in the following equation:
√
(Equation 2.7)
The solution is thus obtained as
(
) (
)
√
where, as usual, q denotes 1-p. As shown in the formula, the Wilson score interval is asymmetric
around the generally reported maximum likelihood prevalence estimator and produces no
boundary anomalies. For rare diseases, when r>0, the lower limit is always positive; when r=0,
the lower limit is 0 and the upper limit becomes
.
While the Wald interval has low coverage, the Agresti-Coull interval and Wilson score
interval have closer coverage to the desired confidence level (Agresti and Coull, 1998). Given
that the Agresti-Coull interval might result in boundary violation for an extremely small
estimator, the Wilson score test is considered more suitable for estimating uncertainty in the
scrapie prevalence estimator.
After CIs of provincial prevalence were estimated, the CI of the national prevalence was
estimated based on stratification by province. The standard error for the national prevalence
estimator is obtained by the following equation
√∑ (
)
(
)
(Equation 2.8)

53
where is the total number of sheep in Canada, is the number of sheep in each stratum h
(each province), is the number of sheep sampled in stratum h, is the estimated prevalence
in stratum h (Levy and Lemeshow, 2008). The stratified Wald CI for the national prevalence can
be estimated by applying Equation 2.2.
As mentioned, the Wald interval has many limitations and is not a recommended method
in rare disease situations. Therefore, the stratified Wilson interval estimation method has been
developed by Yan and Su (2010) for stratified prevalence. The lower and upper limits of this
interval are obtained as follows:
∑ (
√
) (Equation 2.9)
∑ (
√
) (Equation 2.10)
where k is the number of strata, and the required normal percentile and weights are given
as
{
√∑
∑ √
⁄
}
(Equation 2.11)
( )
( )
∑
( )
⁄ (Equation 2.12)
In order to calculate weights, the following iterative procedure was followed:
1. The initial cut-off was chosen as with α=0.05 and k=10, and Equation 2.12 was
used to compute the initial weights .

54
2. The initial weights were substituted into Equation 2.11 to compute the new normal
percentile .
3. The percentile were substituted into Equation 2.12 to calculate the new weights .
4. The updated weights were substituted into Equation 2.11 to compute the new
normal percentile .
After all the steps, the updated percentile was substituted into Equation 2.9 and
Equation 2.10 to obtain the lower and upper bounds of the stratified Wilson interval.
A function in the R software environment (R development team, 2012) was written,
based on the formulas above, to estimate this stratified Wilson interval (Appendix A). The results
of the lower and upper CI were confirmed by MATLAB® (Appendix B).
In summary, the maximum likelihood estimator (MLE) (ph=r/nh) and Agresti-Coull
shrinkage estimator (Equation 2.5) were applied to estimate the provincial and the national non-
stratified prevalence. The CIs for these estimates were obtained by the Wilson score method and
the Agresti-Coull method. For the stratified prevalence analysis, only the MLE was applied,
since a stratified version of the Agresti-Coull shrinkage estimator is not available. Respectively,
the CIs for the national stratified prevalence were estimated using the stratified Wilson intervals.
Farm level prevalence and CIs were estimated using the same method as the individual
level ones. The total numbers of sheep farms in the 10 provinces were obtained from the 2011
Census of Agriculture by Statistics Canada.
2.3 Results
From November 2010 through December 2012, a total of 13,057 samples were collected
from all 10 provinces of Canada. However, 1,355 samples were excluded from the analysis, of
which 689 belonged to other species and 567 were missing animal ID information. Further
samples were excluded due to other reasons such as repeated entries or non-abattoir sampling.

55
The data relating to 11,702 samples were used for statistical analysis. Of those, 1,589 had only
results from one type of tissue; either because only one sample was suitable for testing or only
one sample was obtained at slaughter. Those records were included in the analysis as valid test
results were available.
The 11,702 samples were collected at 4 federal and 85 provincial abattoirs. The numbers
recorded from the CSIP tags attached to the slaughtered animals indicated that the sampled sheep
originated from 3,233 farms. 7 scrapie positive samples were identified by testing. Each positive
animal originated from a different farm representing three provinces: Alberta (1), Ontario (2) ,
and Quebec (4). The sheep-level and farm level prevalence estimates for each province are
shown in Table 2.1 and Table 2.2 respectively. Sheep level prevalence estimates ranged from 0%
(no classical scrapie case found) to 0.083% (Ontario), whereas farm level ranged from 0% to
0.50% (Quebec). The lower bounds of the Agresti-Coull interval were negative for some of the
provinces; those values should be assumed to be 0 since prevalence cannot be negative. The
Agresti-Coull intervals are wider than the Wilson interval except for the province of NL.
However, among all the provinces, the CI value by the two methods, both lower and upper
bounds, differed by less than 2%.
The χ2-test result, for proportional representativeness of samples from different provinces,
was significant (P-value = 0.007). This indicates a significant difference in the sample
distribution and the sheep distribution at provincial level. Therefore the national scrapie
prevalence was estimated using a stratified estimator based on a weighted average of the
provincial estimates.
At the individual sheep level (Table 2.1), the non-stratified prevalence of scrapie for
Canada is 0.06% with the Wilson CI (0.03%, 0.12%) and the Agresti-Coull CI (0.03%, 0.13%) at
95% confidence. The stratified prevalence of scrapie at the sheep level for Canada (Equation 2.1)

56
was estimated to be 0.06% with stratified 95% Wilson confidence interval for the prevalence
estimate being CI95%(psheep)=(0.02%, 0.20%).
At the farm level (Table 2.2), the non-stratified prevalence of scrapie for Canada is 0.22%
with the Wilson CI (0.11%, 0.45%) and the Agresti-Coull CI (0.10%, 0.46%) at 95% confidence.
The stratified prevalence of scrapie at the farm level for Canada (Equation 2.1) was estimated to
be 0.15%, with stratified 95% Wilson interval for the prevalence estimate being CI95%(pfarm)=
(0.06%, 0.66%).
2.4 Discussion
The objective of this study was to obtain an accurate estimate with 95% confidence
interval for the prevalence of scrapie among sheep in Canada. It was planned to sample 15,000
sheep nationwide. This number was based on previous data collected from national surveillance
activities conducted in 2006 and 2007. Past data showed a prevalence of approximately 1 scrapie
case per 1000 sheep (Penny Greenwood, CFIA, personal communication). This current study
found a lower prevalence than expected. Therefore, even though the required sample size was
not achieved, the power of the study was sufficient to provide an accurate estimate, since the
assumption was based on a prevalence of 0.1%, which is larger than the actual value of 0.06%.
Since the sample populations were not proportional to the actual sheep populations in
each province, the prevalence was estimated using both non-stratified and stratified estimation
methods at the national level. When comparing the stratified with non-stratified prevalence
results, the CIs are shorter without stratification for both sheep level and farm level. If a good
stratification predictor is chosen, the variance should be smaller after stratification (Cochran,
1977). For this study, each province was classified as a stratum because the prevalence was
expected to be different between them. The stratified CI ranges are 86% and 75% wider than
non-stratified intervals for sheep level and farm level, respectively. This indicates that “province”
57
is not an effective stratification variable. In other words, the prevalence of scrapie is not
significantly different among the provinces; it is considered unnecessary to stratify. Therefore,
the non-stratified prevalence is reported as the final result. For future sampling, “age” or “breed”
might be used as stratification variables; this information, however, was not consistently
available for this study and is difficult to collect. Age can be roughly determined by examination
of the eruption of the incisors (Hongu et al., 2004). Accurate breed identification of purebred
animals requires considerable knowledge and experience. Additionally, many sheep are cross-
bred and not phenotypically uniform even within cross-breed types. However, notation of colour
of the face (black-faced versus white-faced breeds) is used by the US when stratifying sampling
and could be easily done by CFIA inspectors at the abattoir (USDA et al, 2013).
Most studies on scrapie conducted in European countries and the US showed a higher
prevalence than the results found in this study. Active surveillance conducted from 2002 to 2006
in 20 European countries showed 6 countries did not have scrapie detected; for those that had
disease detected, the prevalence of classical scrapie in healthy slaughtered animals varied from
0.003% in Switzerland in 2004 to 0.28% in Northern Ireland in 2005, with Cyprus observing the
highest prevalence of 15.09% in 2004 (Fediaevsky, 2008). The same study reported the
prevalence in fallen stock to have varied from 0.02% in Norway in 2006 to 2.2% in Slovenia in
2005, with Cyprus observing the highest prevalence of 24.56% in 2003. A study in France
estimated the prevalence of classical scrapie to be 0.44% (Vergne et al, 2012). In Great Britain,
the prevalence of classical scrapie declined from 0.6-0.7% in 2003 to 0.3-0.4% in 2007,
approximately a 40% decrease, as a result of various control schemes (Gubbins and McIntyre,
2009). The European Commission’s annual report for 2011 from all its 27 members states shows
an overall prevalence of 0.048% in the adult sheep population slaughtered for human
consumption, and a prevalence of 0.20% in other sheep populations which were not intended for

58
human consumption (mainly fallen stock) (The European Commission, 2012). In the United
States, the active surveillance studies conducted at the abattoir level estimated prevalence in cull
sheep at 0.20% from October 1, 2001, to September 30, 2002 (United States Department of
Agriculture, 2004). In a more recent study conducted in the US from October 1, 2011 to
September 30, 2012 (United States Department of Agriculture et al, 2012), 8 sheep were found
scrapie positive among 43,228 animals collected from the abattoirs, of which 83% were sheep.
The prevalence estimate was 0.022%, approximately one-third of the prevalence found in this
study.
This study, which focused on the seemingly healthy sheep population sampled at
abattoirs, showed a prevalence value lower than most other countries and is closest to the two
most recent estimates in the US (0.2% and 0.022%) and in the European Union (EU) (0.048%)
obtained through similar surveillance systems. These studies all had samples collected mainly
from abattoirs.
Various studies have demonstrated that the prevalence of scrapie among sheep sampled at
abattoir is lower than in dead stock (The European Commission, 2012). This study did not
consider dead stock samples, but future studies are recommended to consider this animal group.
Samples with either no CSIP ID or no sampling location information were excluded from
statistical analysis in this study. This was to assure that all samples were traceable to the
province of origin, also were collected through active surveillance in abattoirs rather than from
other sources. However, these 567 excluded samples, approximately 5% of the total, tested all
negative; thus the national scrapie prevalence was slightly over-estimated.
This study identified scrapie positive animals originating from three Canadian provinces:
Alberta, Ontario and Quebec. As shown in Table 1.1 in Chapter 1, passive surveillance from
1984 to 2011 had indicated scrapie cases in these three provinces with Ontario and Quebec

59
consistently having the most scrapie cases. Therefore, it was expected to similarly find this in
this study. However, although Saskatchewan, Manitoba and the Atlantic Provinces had reported
scrapie cases in the past, no case was found in those provinces during this study. This result
might be the effect of effective national scrapie control and eradication programs. Additionally,
this might result from too small sample sizes achieved in those provinces. Although every
mature sheep slaughtered in Saskatchewan and Manitoba abattoirs during the two years of this
study was sampled, the number was less than 1,700 sheep, so likely too few sheep were tested to
identify presence of infection.
Both lymphoid tissues and obex tissues were sampled. However, in 1,589 samples
(13.6%) only one type of tissue was available for testing; the second sample was either not
available or damaged and thus unfit for diagnostic testing. The results from these samples were
included in the analysis. In the future, sampling and sample storage procedure needs to be
improved to avoid these losses. In some infected individuals, scrapie prion PrPSc accumulates
more in the obex than in lymphoid tissues (Andreoletti et al, 2000); test sensitivity may be
compromised if only one type of sample is tested.
The objective of this study was to estimate the confidence intervals of scrapie in each
individual province as well as at the national level. Scrapie is considered a rare disease around
the world, with the exception of Cyprus. The typical confidence interval estimation method, i.e.
the Wald CI, is inappropriate when the prevalence is close to zero. Therefore, alternative CI
estimation methods were considered here. Of these, the Wilson score and Agresti-Coull intervals
were chosen to estimate the CIs for provincial and non-stratified national prevalence. Some of
the Agresti-Coull intervals showed negative values as the lower boundary, as expected. The
negative values can be adjusted to zero since prevalence cannot be negative. The Wilson interval
showed narrower ranges than the Agresti-Coull interval in most situations, except for the

60
province of NL due to few samples, indicating the Agresti-Coull method is more conservative
than the Wilson method.
2.5 Conclusion
This study has estimated both individual level and farm level scrapie prevalence for the
healthy sheep population at slaughter in Canada with sufficient accuracy and reliability. This
study provides information for regulatory veterinarians in charge of zoosanitary measures in
Canada, and for scrapie researchers in general. Since the samples were taken at abattoirs only,
future scrapie surveillance activities should include dead stock sampling to provide further
insight of the scrapie distribution in the Canadian sheep population.
The active surveillance design used for the study was feasible and effective. However,
the samples were not geographically representative. The Atlantic Provinces did not have many
samples taken but have previously reported scrapie cases. There seems to be a need for the CFIA
to sample more sheep from those underrepresented provinces to get a more accurate scrapie
prevalence estimate.
In order to achieve geographical representation, animals can be identified at the farm
level in a targeted region and then be followed to slaughter. This way, the animals are being
tested for scrapie regardless of the slaughter location. The Radio Frequency Identification (RFID)
tags would be helpful in this situation and improve the Canadian Sheep surveillance system. The
dissemination and requirements of RFID tags are still in progress with the exception of Quebec
where the RFID tags are mandatory (Canadian Food Inspection Agency, 2012c).
In order to monitor and assess the effect of scrapie control and eradication efforts in
Canada, continuing sampling of the surveillance project is required to track changes in
prevalence. For the next step of this project, more accurate information is needed on the origin of
the sheep in order to understand the geographic distribution of scrapie. Furthermore, better

61
geographic representation needs to be achieved, as some provinces were under-represented.
Future surveillance activities should be targeted to under-sampled areas.
2.6 Acknowledgements
I would like to acknowledge the data compiling of Heather Brown at the Canadian Food
Inspection Agency (CFIA) and Hernan Ortegon at the Alberta Agriculture and Rural
Development (AARD). I would like to further acknowledge Bimal Chhetri from the Department
of Population Medicine, University of Guelph, for helping with coding in R, and Herbert Tang
from the Department of Applied Mathematics, University of Waterloo, for assistance with
estimating the Stratified Wilson confidence intervals. In addition, I would like to thank the
Canadian Sheep Federation for funding this study.
62
2.7 References:
Agresti, A., Coull, B.A., 1998. Approximate is better than “exact” for interval estimation of
binomial proportions. The American Statistician, 52, 119-126.
Andreoletti, O., Berthon, P., Marc, D., Sarradin, P., Grosclaude, J., van Keulen, L., Schelcher, F.,
Elsen, J-M., Lantier, F., 2000. Early accumulation of PrPSc in gut-associated lymphoid
and nervous tissues of susceptible sheep from a Romanov flock with natural scrapie.
Journal of General Virology 81,3115-3126.
Benestad, S. L., Arsac, J., Goldmann, W., Noremark, M., 2008. Atypical/Nor98 scrapie:
properties of the agent, genetics, and epidemiology. Vet. Res., 39(4), 19.
Boomsma, A., 2006. Confidence Intervals for a Binomial Proportion. Department of Statistics &
Measurement Theory, University of Groningen, The Netherlands.
Canadian Food Inspection Agency (CFIA), 2012a. Fact Sheet – Scrapie.
http://www.inspection.gc.ca/animals/terrestrial-animals/diseases/reportable/scrapie/fact-
sheet/eng/1356131973857/1356132310673
Canadian Food Inspection Agency (CFIA), 2012b. Flocks infected with scrapie in Canada in
2011. Retrieved Mar 2012 from: http://www.inspection.gc.ca/animals/terrestrial-
animals/diseases/reportable/2011/flocks-infected-in-
2011/eng/1329729421107/1329729572094
Canadian Food Inspection Agency (CFIA), 2012c. Canadian sheep identification program.
http://www.inspection.gc.ca/animals/terrestrial-animals/traceability/sheep-
identification/eng/1328852777479/1328852957523
Canadian Sheep Federation (CSF), 2011. Myth: Allowing sheep to transit through Canada from
the northern US states to Alaska puts the Canadian industry at a disadvantage. Retrieved
from: http://www.cansheep.ca/User/Docs/POV%20Summer%20Edition%202011.pdf
Cochran, W. G., 1977. Sampling Techniques, 3rd Edition. John Wiley & Sons. Inc., USA, pp99.
The European Commision, 2012. Report on the monitoring of ruminants for the presence of
transmissible spongiform encephalopathies (TSEs) in the EU in 2011. Retrieved from:
http://ec.europa.eu/food/food/biosafety/tse_bse/monitoring_annual_reports_en.htm
Fediaevsky, A., Tongue, S. C., Nöremark, M., Calavas, D., Ru, G., Hopp, P., 2008. A descriptive
study of the prevalence of atypical and classical scrapie in sheep in 20 European
countries. Veterinary Research, 4:19.
Foster J.D., Dickinson, A.G., 1989. Age at death from natural scrapie in a flock of Suffolk sheep.
Vet. Rec. 125, 415-417.
Gregoire, T. G., Valentine, H. T., 2008. Sampling Strategies for Natural Resources and The
Environment. Boca Raton, Florida, USA, Taylor & Francis Group, LLC, pp127-164.
Gubbins, S., McIntyre, K.M., 2009. Prevalence of sheep infected with classical scrapie in Great
Britian, 1993-2007. Epidemiol Infect., 136(6): 787-91.
Hongo A, Zhang J, Toukura Y, Akimoto M., 2004. Changes in incisor dentition of sheep
influence biting force. Grass Forage Sci, 59:293–297.
Hunter, N., Cairns, D., 1998. Scrapie-free Merino and Poll Dorset sheep from Australia and New
Zealand have normal frequencies of scrapie-susceptible PrP genotypes. J. Gen. Virol., 79
(Pt 8):2079-82.
Kim, K., 2007. The Social Construction of Disease: From Scrapie to Prion. Routledge, Taylor &
Francis Group, New York, NY, USA, pp. 107-126.
Levy, P. S., Lemeshow, S., 2008. Sampling of Populations: Methods and Applications (Forth
Edition). John Wiley & Sons, Inc., Hoboken, NJ, USA, pp. 121-139.

63
McV Messam, L.L., Branscum, A.J., Collins, M.T. Gardner, I.A., 2008. Frequentist and
Bayesian approaches to prevalence estimation using examples from Johne’s disease.
Anim. Health Res. Rev., 9(1), 1-23.
Newcombe, R. G., 2013. Confidence Intervals for Proportions and Related Measures of Effect
Size. Taylor & Francis Group, LLC, Boca Raton, FL, USA, pp55-75.
Petrie, A., Watson, P., 2006. Statistics for Veterinary and Animal Science (second edition).
Blackwell, Oxford, pp. 12-53.
R Development Core Team, 2012. R: A language and environment for statistical computing. R
Foundation for Statistical Computing, Vienna, Austria. ISBN 3-900051-07-0, URL
http://www.r-project.org
Statistics Canada, retrieved May 2013. Sheep inventories, by province.
http://www.statcan.gc.ca/tables-tableaux/sum-som/l01/cst01/prim52a-eng.htm
Yan, X., Su, X. G., 2010. Statified Wilson and Newcombe Confidence Intervals for Multiple
Binomial Proportions. Statistics in Biopharmaceutical Research, 2:3, 329-335.
United States Department of Agriculture (USDA), 2004. Phase II: Scrapie: Ovine Slaughter
Surveillance Study 2002-2003. USDA:APHIS:VS,CEAH, National Animal Health
Monitoring System, Fort Collins, CO., #N419.0104. Retrieved from:
http://www.aphis.usda.gov/animal_health/animal_diseases/scrapie/downloads/sossphase2
United States Department of Agriculture (USDA), Animal and Plant Health Inspection Service
(APHIS), Veterinary Services Centers for Epidemiology and Animal Health (VSCEAH),
National Surveillance Unit (NSU), Fort Collins, CO., 2010. National Scrapie
Surveillance Plan. Retrieved from:
http://www.aphis.usda.gov/animal_health/animal_diseases/scrapie/downloads/national_s
crapie_surv_plan.pdf
United States Department of Agriculture (USDA), Animal Plant Health Inspection Service,
Veterinary Services (APHIS), National Center for Animal Health Programs, Ruminant
Health Programs, 2012. National Scrapie Eradication Program, Fiscal Year 2012 Report,
October 1, 2011 to September 30, 2012. Retrieved July 2013 from:
http://www.aphis.usda.gov/animal_health/animal_diseases/scrapie/downloads/yearly_rep
ort.pdf
Vergne, T., Calavas, D., Cazeau, G., Durand, B., Dufour, B., Grosbois, V., 2012. A Bayesian
zero-truncated approach for analysing capture-recapture count data from classical scrapie
surveillance in France. Prev Vet Med., 105 (1-2): 127-135.
Woolhouse, M.E.J., Matthews, L., Coen, P., Stringer, S.M., Foster, J.D., Hunter, N., 1999.
Population dynamics of scrapie in a sheep flock. Philosophical Transactions: Biological
Sciences: 354(No. 1384): 751-756.
Woolhouse, M.E.J., Coen, P., Matthews, L., Foster, J.D., Elsen, J., Lewis, R.M., Haydon, D.T.,
Hunter, N., 2001. A centuries-long epidemic of scrapie in British sheep? Trends
Microbiol., 9(2): 67-70.
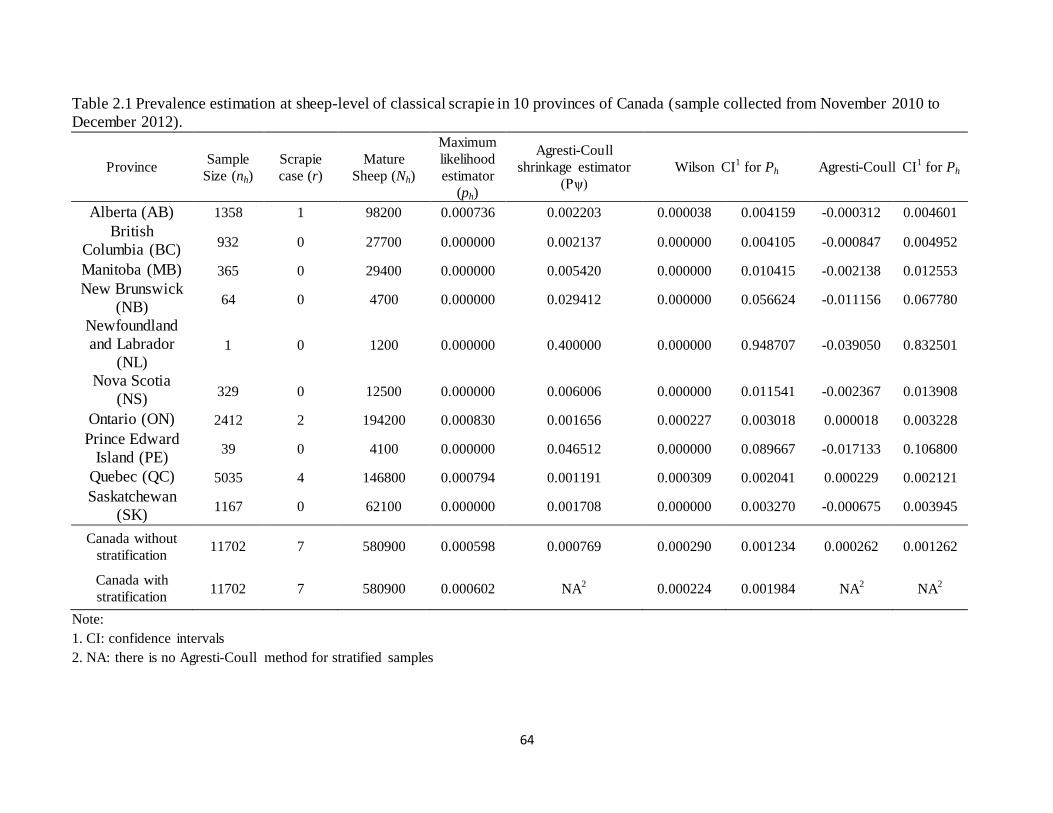
64
Table 2.1 Prevalence estimation at sheep-level of classical scrapie in 10 provinces of Canada (sample collected from November 2010 to
December 2012).
Province Sample
Size (nh)
Scrapie
case (r)
Mature
Sheep (Nh)
Maximum
likelihood
estimator
(ph)
Agresti-Coull
shrinkage estimator
(Pψ)
Wilson CI1 for Ph Agresti-Coull CI1 for Ph
Alberta (AB) 1358 1 98200 0.000736 0.002203 0.000038 0.004159 -0.000312 0.004601
British
Columbia (BC) 932 0 27700 0.000000 0.002137 0.000000 0.004105 -0.000847 0.004952
Manitoba (MB) 365 0 29400 0.000000 0.005420 0.000000 0.010415 -0.002138 0.012553
New Brunswick
(NB) 64 0 4700 0.000000 0.029412 0.000000 0.056624 -0.011156 0.067780
Newfoundland
and Labrador
(NL) 1 0 1200 0.000000 0.400000 0.000000 0.948707 -0.039050 0.832501
Nova Scotia
(NS) 329 0 12500 0.000000 0.006006 0.000000 0.011541 -0.002367 0.013908
Ontario (ON) 2412 2 194200 0.000830 0.001656 0.000227 0.003018 0.000018 0.003228
Prince Edward
Island (PE) 39 0 4100 0.000000 0.046512 0.000000 0.089667 -0.017133 0.106800
Quebec (QC) 5035 4 146800 0.000794 0.001191 0.000309 0.002041 0.000229 0.002121
Saskatchewan
(SK) 1167 0 62100 0.000000 0.001708 0.000000 0.003270 -0.000675 0.003945
Canada without
stratification 11702 7 580900 0.000598 0.000769 0.000290 0.001234 0.000262 0.001262
Canada with
stratification 11702 7 580900 0.000602 NA2 0.000224 0.001984 NA2 NA2
Note:
1. CI: confidence intervals
2. NA: there is no Agresti-Coull method for stratified samples

65
Table 2.2 Prevalence estimation at farm-level of classical scrapie in 10 provinces of Canada (sample collected from November 2010 to
December 2012).
Province
Farm
sampled
(nh)
Scrapie
case (r)
Farm in
Province
(Nh)
Maximum
likelihood
estimator
(ph)
Agresti-Coull
shrinkage estimator
(Pψ)
Wilson CI1 for Ph Agresti-Coull CI1 for Ph
Alberta (AB) 462 1 1747 0.002169 0.006452 0.000111 0.012157 -0.000898 0.013438
British
Columbia (BC) 303 0 1587 0.000000 0.006515 0.000000 0.012519 -0.002565 0.015084
Manitoba (MB) 153 0 521 0.000000 0.012739 0.000000 0.024493 -0.004966 0.029459
New Brunswick
(NB) 33 0 137 0.000000 0.054054 0.000000 0.104270 -0.019647 0.123917
Newfoundland
and Labrador
(NL)
1 0 47 0.000000 0.400000 0.000000 0.948707 -0.039050 0.832501
Nova Scotia
(NS) 120 0 293 0.000000 0.016129 0.000000 0.031019 -0.006254 0.037273
Ontario (ON) 964 2 3569 0.002075 0.004132 0.000569 0.007533 0.000049 0.008053
Prince Edward
Island (PE) 18 0 72 0.000000 0.090909 0.000000 0.175879 -0.030832 0.206711
Quebec (QC) 798 4 1166 0.005013 0.007481 0.001951 0.012817 0.001458 0.013310
Saskatchewan
(SK) 381 0 2488 0.000000 0.005195 0.000000 0.009982 0.009982 0.012032
Canada without
stratification 3233 7 11627 0.002166 0.002781 0.001050 0.004464 0.000950 0.004563
Canada with
stratification 3233 7 11627 0.001465 NA2 0.000602 0.006570 NA2 NA2
Note:
1. CI: confidence intervals
2. NA: there is no Agresti-Coull method for stratified samples
66
Chapter 3: Choropleth mapping the sampling intensity of a Canadian scrapie prevalence
study
Abstract
Scrapie is a fatal neurodegenerative disease in sheep and goats. To control scrapie in
Canada, the Canadian Food Inspection Agency (CFIA) has been sampling healthy sheep at
slaughter since 2005. To assure geographic representativeness, the sampling intensity by region
should be monitored. Sheep samples collected from November 2010 to December 2012 were
used to investigate the geographic distribution of sampling intensity with respect to the farm of
origin and number of sheep farms in the region.
A total of 11,702 sheep samples were traced back to their farm of origin. These samples
came from 3,233 farms or 233 Census Division (CD) regions, representing all 10 provinces of
Canada.
An index is proposed which measures for each CD the combined information available at
both farm and sheep level, to indicate where insufficient sampling may have occurred, increasing
the risk of missed cases. This index ranges from 0 to 1, where a smaller value indicates lower
sampling intensity and thus less accurate information. After dividing the distribution of the index
values from 283 CDs within 10 provinces of Canada into quartiles, a choropleth map was
constructed using a four colour scale: indices less than 0.2, between 0.2 and 0.3, between 0.3 and
0.4, and between 0.4 and 1. CDs with indices less than 0.1 are outlined on the map to emphasize
the need of intensified sampling. Those CDs cluster in the West Coast, the southern aspect of the
border between British Columbia and Alberta, southern Manitoba, northern Ontario and portions
of the Atlantic Provinces, indicates that sheep farms in those areas are under-sampled in the
current national scrapie surveillance program.

67
3.1 Introduction
Scrapie is a fatal and infectious neurological disease that occurs in sheep and goats. It is a
type of transmissible spongiform encephalopathy (TSE), or prion disease. Since 1945, scrapie
has been a reportable disease in Canada (Canadian Food Inspection Agency, 2012b). Despite its
long history (Detwiler and Baylis, 2003), scrapie prevalence is lower than 1% around the world
(The European Commission, 2012; United States Department of Agriculture et al, 2012), with
Australia and New Zealand being recognized as scrapie-free (Animal and Plant Health
Inspection Service, 2004; Animal Health Australia, 2009; Ministry for Primary Industries, 2014).
In Canada, the prevalence of scrapie is estimated at a level of about 1 case per 1,700 sheep by
abattoir surveillance over a two-year period (Chapter 2); no scrapie cases were found in goats for
the same sampling period (Leung, Berke, Ortegon, Brown, Menzies, 2013, in preparation).
However, scrapie is a public health concern and it has caused economic loss for farmers.
Once a scrapie case is detected, strict eradication measures are applied to the infected
sheep flock or goat herd. As is usual for infectious diseases, scrapie is expected to cluster on
affected farms as well as farms acquiring sheep or goats from affected farms. Even in the
situation whereby all infected animals had been euthanized in a region, prion diseases had been
found reoccurring several years later (Wiggins, 2009). Therefore, identifying the risk
geographically is critical to disease prevention and control.
The goal of this study is to advise the Canadian Food Inspection Agency (CFIA), the
facilitator of the Canadian Scrapie Eradication Program, regarding the geographic representation
of sheep scrapie samples collected during past surveillance activities, and thus to plan future
sampling. Since 2003, sheep have been required to be tagged using a tag compatible with the
mandatory Canadian Sheep Identification Program (CSIP), which allows for samples to be traced
68
to the farm of origin. Conversely, goat samples are excluded in this study because of the
difficulty of tracing the origin of goats due to lack of a mandatory national goat identification
program.
Specific objectives are (i) to develop an index that measures the intensity of sheep scrapie
sampling at both the farm and sheep level by region, i.e. Census Division (CD), (ii) to identify
those CDs with a low sampling information index, and (iii) to map the sampling information
indexes categorized by quartiles so as to identify areas which should be targeted for scrapie
sampling in the future.
3.2 Materials and methods
3.2.1 Study design
The sheep sample data used in this study was collected through active surveillance
conducted by the CFIA from November 2010 to December 2012. Samples were taken from both
federal and provincial abattoirs across the 10 provinces of Canada. No samples were collected
from the territories of Yukon, Nunavut or the North West Territories as the sheep data from
those provinces are not available and their estimated sheep populations are negligible (Koizumi
et al., 2011).
During the two year sampling period, the CFIA had collected data from 12,368 adult
sheep (adult status determined by presence of permanent incisors) to be used in this study. For
the purpose of this study, only sheep sampled from abattoirs were used; samples from other
locations (e.g. government agencies, farms) were excluded to ensure the samples were obtained
strictly through active rather than passive surveillance. Only sheep with CSIP tags, which
enables CFIA agents to trace their farm of origin, were included in the analysis.

69
Postal codes were obtained for the farm of origin of each sample; these were then linked
to CDs which represent larger areas but are not necessarily inclusive to postal code areas
(Statistics Canada, 2012a). The number of sheep farms in each CD was obtained through the
2011 Census of Agriculture (Statistics Canada, 2011a).
3.2.2 Sampling procedures
Samples were taken from 4 federally licensed abattoirs and 85 provincially licensed
abattoirs in all 10 provinces of Canada. The CFIA coordinated the sampling process and its
inspectors collected samples at abattoirs in all provinces except Alberta, where the Alberta
Agriculture and Rural Development (AARD) fulfilled this function.
Four federally licensed abattoirs across Canada slaughtered sheep during the study period:
one in Ontario, two in Quebec, and one in Alberta. Federally licensed abattoirs are staffed full
time with CFIA inspectors. Every mature sheep slaughtered in these abattoirs was sampled
(Heather Brown, CFIA, Scrapie Prevalence Study Sampling Plan, personal communication,
2011).
The methodology for sampling adult sheep slaughtered at provincially licensed abattoirs
varied by province. Provincially licensed abattoirs in British Columbia, Saskatchewan, and
Manitoba are staffed full-time with CFIA inspectors, and all mature sheep slaughtered in those
abattoirs were sampled. In Ontario and Quebec, the abattoirs were sampled by multi-stage
sampling. Only the abattoirs which slaughter more than 50 sheep per year were included in the
sampling frame. Those abattoirs were visited on a random basis, proportional to the size of
throughput of the abattoirs. All sheep slaughtered during those visits were sampled. In New
Brunswick, Prince Edward Island and Newfoundland and Labrador, the abattoirs were
conveniently sampled; CFIA inspectors sampled adult sheep whenever the abattoirs were visited.

70
In Nova Scotia, almost all of the sheep slaughtered were sampled because the provincial
inspectors agreed to collect samples on behalf of the CFIA. In Alberta, the provincial abattoirs
were conveniently sampled with the exception of the two largest abattoirs at which every mature
sheep was sampled, approximately 80% of all mature sheep slaughtered in Alberta.
3.2.3 Data management
The CSIP ID number of each sheep sampled at slaughter was recorded by the inspectors.
This number was linked to the postal code of the farm of origin, as well as the farm’s Public
Account Number and entered into an electronic database. For each sample, the result from the
Bio-Rad ELISA test was recorded and if positive, the results from the Western blot (WB) and
Immunohistochemistry (IHC) tests and determination of type of scrapie, i.e. atypical or classical
form of scrapie was also recorded. A confidentiality agreement between the CFIA and
researchers at the University of Guelph allowed for data sharing. The accuracy of data entry was
reviewed and necessary corrections were made in agreement with the responsible CFIA
supervising inspector, before data analysis began. The corrected data were then statistically
analyzed using R 3.1.0 (R Core Team, 2014). The R software add-on package “maptools” and
“rgdal” were used to draw a choropleth map.
The CSIP number recorded from the ear tag on sheep was used to determine the address
of the purchaser of the tag, assumed to be the address of the farm of origin of the sheep. The
address was not provided to researchers but rather the CFIA agent provided only the postal code
of the farms to protect the privacy of the farmers. The spatial unit of analysis chosen was Census
Divisions (CDs). CD refers to provincially legislated areas (such as county, municipalité
régionale de comté and regional district) or their equivalents (Statistics Canada, 2012a), which
make up the provinces or territories. Postal code areas are considered too small to be targeted in

71
future eradication programs and are lacking necessary census information. However, postal code
allowed for determination of the CD of the farms from which sheep were sampled.
The sheep farm distributions in each CD region were obtained from the 2011 census by
Statistics Canada (Statistics Canada, 2011a). The data used were from the “crop categorization”
which declares a farm as a sheep farm based on any sheep being present on the farm at the time
of the census, rather than the “industrial categorization” which is based on the major farming
activity.
Postal codes of the farms were converted to CD using a software routine in SAS
(Copyright © 2002-2003 by SAS Institute Inc., Cary, NC, USA) with the help of the Data
Resource Centre (DRC), University of Guelph. The conversion files in the SAS program were
last updated in 2013. Because the postal codes are updated every year and the study was
conducted from 2010 to 2012, the conversion did not work on all the postal codes. Therefore,
some “postal code to CD” conversions were provided by the CFIA using exact addresses.
The boundary file of Canada was obtained from Statistics Canada (Stats Canada, 2011b).
The boundary file contains the boundaries of 283 CDs for the 10 provinces of Canada.
3.2.4 Sampling information index
To determine how intensively the various CD's were sampled, an index was developed.
This index is to describe the risk of detecting a scrapie case in a particular area, i.e. CD. In
epidemiology, “risk” usually refers to the probability that a particular outcome (e.g. developing a
disease) will occur over a given period of time (Last, 2001). However for this study, the term
“risk” is the probability of finding a scrapie case by sampling adult sheep at an abattoir given the
CD of origin of the sheep. Specifically, the risk of having undetected scrapie cases was assumed
to be higher in areas in which fewer sheep and farms were sampled as compared to areas where

72
more sheep and farms were sampled. Thus the risk of having an undetected scrapie case in a CD
is considered higher the less information was collected in the past. This relates to the fraction of
farms sampled as well as the fraction (or number) of animals sampled in a CD.
The sheep level sampling proportion (the number of sheep sampled divided by the total
number of sheep) in each CD area was not available due to confidentiality reasons where the
number of sheep in certain regions cannot be revealed to the public. Also, the number of sheep
changes constantly and the sheep number being reported to Statistics Canada may not correspond
to the sampling period. Effectively this is down-weighting the sheep information for all but one
area, i.e. where the maximum was observed.
The farm level sampling proportion can be calculated using the number of farms with
sheep that were sampled divided by the number of total farms reported by the census. However,
some CDs had more farms sampled than the number reported by the census thus resulting in a
fraction greater than one. In such situations, the number of farms reported for that CD was
changed to the number of sampled farms to assure the fraction of sampled farms per CD is
always between 0 and 1. However, the sampling proportion calculation would need further
adjustments for geographic comparisons due to variations in regional sample sizes.
To assess the intensity of sampling of farms and sheep in a given CD, an index is used
which combines information from both farm level and individual level sampling proportions.
The index is partially based on the Freeman-Tukey Transformation (Cressie, 1993):
√
√
(Equation 3.1)
where Zi is the transformed attribute of region i, mi and ni are the number of samples and the
total population in region i respectively, and i is the region index ranging from 1 to the total
number of regions in the study area (N=283 for this study).

73
For the purpose of this study, the Freeman-Tukey Transformation has been modified.
Two farms were added in a CD to the total number of farms to be consistent with the Agresi-
Coull estimation applied in the prevalence study (Chapter 2 of this thesis). The modified index is
calculated as the following:
[(√
√
) ] (
)
(Equation 3.2)
where, Ii is the index estimator for CD i, fi is the number of farms sampled in CD i, Fi is the total
number of farms in this CD, ni is the number of sheep sampled in CD i, M is the maximum
number of sheep sampled in any CD, wf is a weight assigned to farm level sampling proportion,
and ws is a weight assigned to individual level sampling proportion. The weights wf and ws range
between 0 and 1 with the condition wf + ws = 1, and are introduced to assure that the index ranges
between 0 and 1 and is interpretable as a probability or level of information available regarding
sampling intensity at the farm and animal level. Furthermore, these weights can be changed to
increase the importance of information at sheep level or at the farm level, which can depend on
the suspected or measured level of clustering within farms. If clustering among sheep from the
same farm is strong, then sampling more sheep is unnecessary as the additional information is
mostly redundant and thus should be down weighted, i.e. ws should be small. Here no preference
is given, as no prior knowledge about the clustering of scrapie is available and all cases found in
this study were from different farms. Thus ws = wf = 0.5 was chosen.
3.2.5 Choropleth mapping
A disease map is usually constructed to show the spatial distribution of the disease and
identify any spatial patterns. The three basic types of disease maps are dot maps, choropleth
maps and isopleth maps. Choropleth maps visualize the spatial distribution of a regional attribute
(e.g. regional prevalence). Generally the attribute is categorized and its value range is

74
represented by a few (i.e. up to a maximum of 7) distinct gray or colour scales (Cressie, 1993,
Berke, 2001).
A Choropleth map was constructed in this study to compare the sampling intensity in the
administrative region type chosen, i.e., CDs. The choropleth map reveals areas of Canada that
lack information obtained by scrapie surveillance at abattoir. This map was based on the
Azimuthal equidistant projection in which all points on the map are at proportionately correct
distances from the center point.
3.3 Results
From November 2010 through to December 2012, a total of 13,057 diagnostic test
records were collected. Of those, 11,702 records were included in the statistical analysis. Of the
1,355 records excluded from analysis, 689 were not from sheep, 567 belonged to sheep with
missing or unreadable CSIP ID tags. Further records were excluded due to other reasons such as
repeated entries or non-abattoir sampling.
The final 11,702 samples were taken from 4 federal abattoirs and 85 provincial abattoirs
from all 10 provinces of Canada. The CSIP ear tags indicated that the sampled sheep came from
3,233 farms, or 1,957 postal code areas. After the postal codes were linked to CDs, the samples
represent 233 CD areas.
According to Statistics Canada’s 2011 Census of Agriculture, there were a total of 283
CDs across Canada excluding territories, of which 263 reported having one or more sheep farms.
However, of the 20 CDs reporting no sheep farms, 4 recorded samples taken. Another 19 CDs
had more farms sampled than were reported in that CD (Appendix C). The 23 CDs where more
farms were sampled than reported were assigned a 100% farm level sampling proportion. The 16

75
CDs which have no reported sheep farms and had no samples taken from were considered having
0% farm level sampling proportion, and were outlined in the map (Figure 3.1).
The sheep level sampling proportion for a CD area was calculated by dividing the
number of sheep sampled in this CD by the maximum number of sheep sampled in any CD,
which was 615 sheep and was observed for CD #2409 in Quebec (Appendix C).
The exact proportions of farms sampled in each of the 283 CDs and their corresponding
index values are shown in Appendix C. The CDs are listed in ascending order using the index
value. Rankings according to the farm level sampling proportion alone are shown in a separate
column.
Figure 3.1 is a choropleth map of the available sampling information according to the
newly developed index. The three territories of Canada (Yukon, Northwest Territories, Nunavut)
that were not sampled in this study are not shown on the map. The 283 CDs that make up the 10
provinces of Canada are classified approximately into quartiles: index values of less than 0.2,
between 0.2 and 0.3, between 0.3 and 0.4, and between 0.40 and 1. These quartiles are colour
coded for visual clarity, with those areas with higher index values being represented with darker
colours so as to reflect the higher level of sampling intensity. The approximation is due to the
index values that were rounded to two decimal places.
The choropleth map of Canada was divided into four close-up views (Figure 3.2, Figure
3.3, Figure 3.4, Figure 3.5) in order to show more detail. CDs with higher index values are
mostly located in Alberta (Figure 3.2), Saskatchewan (Figure 3.3), Ontario (Figure 3.4), Quebec
and Nova Scotia (Figure 3.5).
Three groups of CDs are outlined on the choropleth map to further illustrate the areas
with lower sampling intensity (Figure 3.1): CDs with no samples collected are outlined in purple;

76
CDs with no recorded sheep farms are outlined in blue. CDs with an index value of less than 0.1
are outlined in black. The CDs that are outlined by a black borderline are those CDs that are
proposed for intensified sampling in the future. From these figures, the CDs with low sampling
intensity can be seen to cluster on the West Coast (Figure 3.2), the southern aspect of the border
between British Columbia and Alberta (Figure 3.2), southern Manitoba (Figure 3.3), northern
Ontario (Figure 3.4) and portions of the Atlantic Provinces (Figure 3.5).
3.4 Discussion
This study presents a choropleth map of the sampling intensity of scrapie surveillance of
sheep farms in Canada at the farm and animal level and allows for geographic comparison. The
map was constructed based on an index proposed here as a new methodological approach. CDs
were chosen as the appropriate administrative regions for analysis and ultimately mapping,
because this level is considered as appropriate for the management of scrapie by the CFIA. The
next higher administrative level is at the provincial level and is too heterogeneous for targeted
disease control initiatives. On the other hand, the next lower administrative level (i.e. the more
than 2300 Census Consolidated Subdivisions) likely would result in tedious and inefficient
disease control activities.
Several CDs had more farms sampled than were reported according to census records and
this may be due to various reasons. It may be that the census information is out-dated; samples
were taken from 2010 to 2012 and census data was obtained during the early spring of 2011. The
sheep farms might have closed or switched to another type of farming during the two year
sampling duration, while the 2011 Census of Agriculture was only based on a period of time in
2011. It may also be that the farm owners’ addresses as registered with a sheep’s ID tag and
recorded by the Canadian Cattle Identification Agency (CCIA), or the Agri-Traçabilité Québec

77
(ATQ) in Quebec Province, does not match a farm location but rather the owners’ civic address
if they do not live full-time on the farm. Additionally, mailing addresses are not necessarily the
same as the farm’s locations. This is true in areas of Canada where mail is delivered to a post
office in a near-by town and not delivered directly to the farm. This could result in the farms
being categorized in the wrong CD. While it was possible to adjust the index for those CDs
where farms sampled exceeded those reported (see section 3.2.4), it cannot be determined if CDs
with low sampling information were classified as such because there were actually fewer farms
in the CD than reported in the 2011 census.
The new sampling information index proposed for this study ranges from 0 to 1 where
higher values indicate higher sampling intensity and information level or lower “risk” of
detecting scrapie in future studies. It combines two sources of information: 1) the farm level
sampling fraction per CD using modified Freeman-Tukey Transformation and 2) sheep level
sampling fraction using the number of sheep sampled in the same CD divided by the maximum
number of sheep sampled in any CD. The Freeman-Tukey transformation is a variance-
stabilizing transformation that removes the dependence of the variance on the mean of the
transformed proportion. It corrects for overdispersion and shows more stability than the original
data (Cressie, 1993). Even though logarithm and square root transformations can also be used to
make the variance homogeneous between CDs, the two different numerators of the Freeman-
Tukey transformation distinguish the zero counts between CDs with different farm numbers
which is the denominator. The modification of this transformation was done in order to restrict
the index within the boundaries between 0 and 1, and also be in consistency with Agresti-Coull
estimation applied in the scrapie prevalence study which used the same data. The sheep level
sampling proportion did not need this correction because a fixed number, i.e. the maximum

78
number of sheep sampled in one CD, was used in the denominator, the variance does not vary
between CDs.
This index allows flexibility in choosing how much weight is given to sheep and farm
level information. A single sheep sampled per farm is generally less informative than a sample of
2 or more sheep per farm. However, scrapie is an infectious disease and thus is expected to
cluster on farms leading to redundant information from repeated farm samples. Even though the
prevalence study (Chapter 2 of this thesis) did not reveal evidence for clustering (all 7 scrapie
cases came from 7 different farms), scrapie as an infectious disease is expected to cluster on
farms. However, the trace-out information of the confirmed scrapie cases found in the prevalence
study was not available.
Depending on the strength of clustering one can choose to emphasize farm level or sheep
level information, by choosing respective weights (i.e. ws and wf). If strong clustering is
expected, the farm level sampling proportion can be given more weight; conversely, if no
clustering on the farms is expected, sheep level sampling proportions can be given more weight.
Furthermore, the information at sheep level could be weighted in a nonlinear way via
application of certain power functions, e.g., when sheep level information is subjected to a
square root transformation then increasing sheep sample sizes per farm will have a limited effect
on the overall information index.
A choropleth map was constructed to visualize the geographic distribution of the
sampling intensities across Canada. Clusters of high risk or low information areas can be
identified from this map. The CFIA agents, however, can also inspect the data table in Appendix
C, which lists the exact values and full information of CDs. This allows them to adjust decision

79
making process by defining the high risk areas according to the ranking of the index or the farm
level sampling proportion alone; thus plan the next scrapie surveillance.
3.5 Conclusion
A sampling information index was proposed in order to monitor and map the information
gathered from a disease surveillance system for classical scrapie in the Canadian sheep industry.
This index combines information from both farm level and sheep level sampling proportion
which is a better scheme than just using only farm level or sheep level sampling proportion.
Application of the method results in a recommendation for the Canadian scrapie surveillance
system to intensify its sampling activities in certain Census Districts (CDs) out of 10 provinces
in Canada, and allows to further plan a future eradication program. This study provides insight
into the sampling intensity across the country and allows identification of underrepresented
areas, which are considered at higher risk for future scrapie observations. Specific ranking and
mapping of the index provides a means to prioritize future surveillance activities. According to
the choropleth map, the West Coast regions, the southern border regions between British
Columbia and Alberta, Northern Ontario and the Atlantic Provinces are the areas in need for
intensified sampling.
3.6 Acknowledgements
I would like to acknowledge the data compiling of Heather Brown at the Canadian Food
Inspection Agency (CFIA) and Hernan Ortegon at Alberta Agriculture and Rural Development
(AARD). I would like to further acknowledge the Data Resource Center (DRC) of the University
of Guelph library for providing consistent support of geospatial data. In addition, I would like to
thank the Canadian Sheep Federation for funding this study.

80
3.7 References
Animal and Plant Health Inspection Service, 2004. Scrapie. Retrieved Mar 2012 from:
http://www.aphis.usda.gov/animal_health/animal_diseases/scrapie/downloads/fs_ahscrap
ie.pdf
Animal Health Australia, 2009. Scrapie. Retrieved Mar 2014 from:
http://nahis.animalhealthaustralia.com.au/pmwiki/pmwiki.php?N=Factsheet.111-
2?Skin=factsheet
Berke, O., 2001. Choropleth mapping of regional count data of Echinococcus
multilocularis among red foxes in Lower Saxony, Germany. Prev Vet Med., 52 (2), 119-
31.
Canadian Food Inspection Agency (CFIA), 2012a. Flocks infected with scrapie in Canada in
2011. Retrieved Mar 2012 from: http://www.inspection.gc.ca/animals/terrestrial-
animals/diseases/reportable/2011/flocks-infected-in-
2011/eng/1329729421107/1329729572094
Canadian Food Inspection Agency (CFIA), 2012b. Fact Sheet – Scrapie.
Http://www.inspection.gc.ca/animals/terrestrial-animals/diseases/reportable/scrapie/fact-
sheet/eng/1356131973857/1356132310673
Canadian Food Inspection Agency (CFIA), 2012c. Scrapie - What to expect if your animals may
be infected. http://www.inspection.gc.ca/animals/terrestrial-
animals/diseases/reportable/scrapie/if-your-animals-may-be-
infected/eng/1355963623752/1355963789207
Cressie, N., 1993. Statistics for Spatial Data, Rev. Edition. Wiley, New York.
Detwiler, L.A., Baylis, M., 2003. The epidemiology of scrapie. Rev Sci Tech., 22(1),121-43.
The European Commission, 2012. Report on the monitoring of ruminants for the presence of
transmissible spongiform encephalopathies (tses) in the EU in 2011. Retrieved from:
http://ec.europa.eu/food/food/biosafety/tse_bse/monitoring_annual_reports_en.htm
Koizumi, C. L., J. Carey, M. Branigan, K. Callaghan, Yukon Environment, 2011. Status of
Dall’s Sheep (Ovis dalli dalli) in the Northern Richardson Mountains. Retrieved from:
http://www.env.gov.yk.ca/publications-maps/documents/dalls_sheep_richardson_status_report_2011.pdf
Last JM, ed. A dictionary of epidemiology. 4th edition, 2001. New York: Oxford University
Press.
Ministry of Primary Industries, 2014. NEW ZEALAND’S POSITION WITH REGARD TO
SCRAPIE. Retrieved Mar 2014 from: http://www.biosecurity.govt.nz/files/pests/tse/nz-
position-scrapie.pdf
Wiggins, R.C., 2009. Prion Stability and Infectivity in the Environment. Neurochemical
Research, 34(1): 158-168.
R Core Team (2014). R: A language and environment for statistical computing. R Foundation for
Statistical Computing, Vienna, Austria. URL: http://www.R-project.org/.
Statistics Canada, 2011a. Census of Agriculture, 2011 [Canada]: Farm Data and Farm Operator
Data, Initial Release [Excel files]. Accessed via ODESI, August 21, 2013.
Http://odesidownload.scholarsportal.info/documentation/AGRIC/AGCENSUS/2011/DO
CS/farm_data_tables_2011.html
Statistics Canada, 2011b. Census Division - Cartographic Boundary Files (CD-CBF), 2011
Census. Accessed via Scholars geoportal, August 21, 2013.

81
Http://geo1.scholarsportal.info/#r/search/_queries@=CENSUS%20DIVISION;&fields@
=;&sort=relevance&limit=entitled
Statistics Canada, 2012a. Census division (CD). Retrieved Sep 2013 from:
http://www12.statcan.gc.ca/census-recensement/2011/ref/dict/geo008-eng.cfm
Statistics Canada, 2012b. 2011 CENSUS OF AGRICULTURE QUESTIONNAIRE. Retrieved
Dec 2013 from: http://www.statcan.gc.ca/ca-ra2011/201108/q11-eng.htm.
United States Department of Agriculture (USDA), Animal Plant Health Inspection Service,
Veterinary Services (APHIS), National Center for Animal Health Programs, Ruminant
Health Programs, 2012. National Scrapie Eradication Program, Fiscal Year 2012 Report,
October 1, 2011 to September 30, 2012. Retrieved July 2013 from:
http://www.aphis.usda.gov/animal_health/animal_diseases/scrapie/downloads/yearly_rep
ort.pdf

82
Figure 3.1 Choropleth map of Canadian provinces based on the sampling information index of scrapie study, using Azimuthal equidistant projection:
CDs having no samples collected from are outlined in purple; CDs having no sheep farms recorded are outlined in blue. CDs with an index less than
0.1 are outlined in black1.
Note:
1. CDs having no samples collected (purple) were outlined first. CDs with index<0.1(black) were outlined later. CDs fall in both categories are
shown as black.
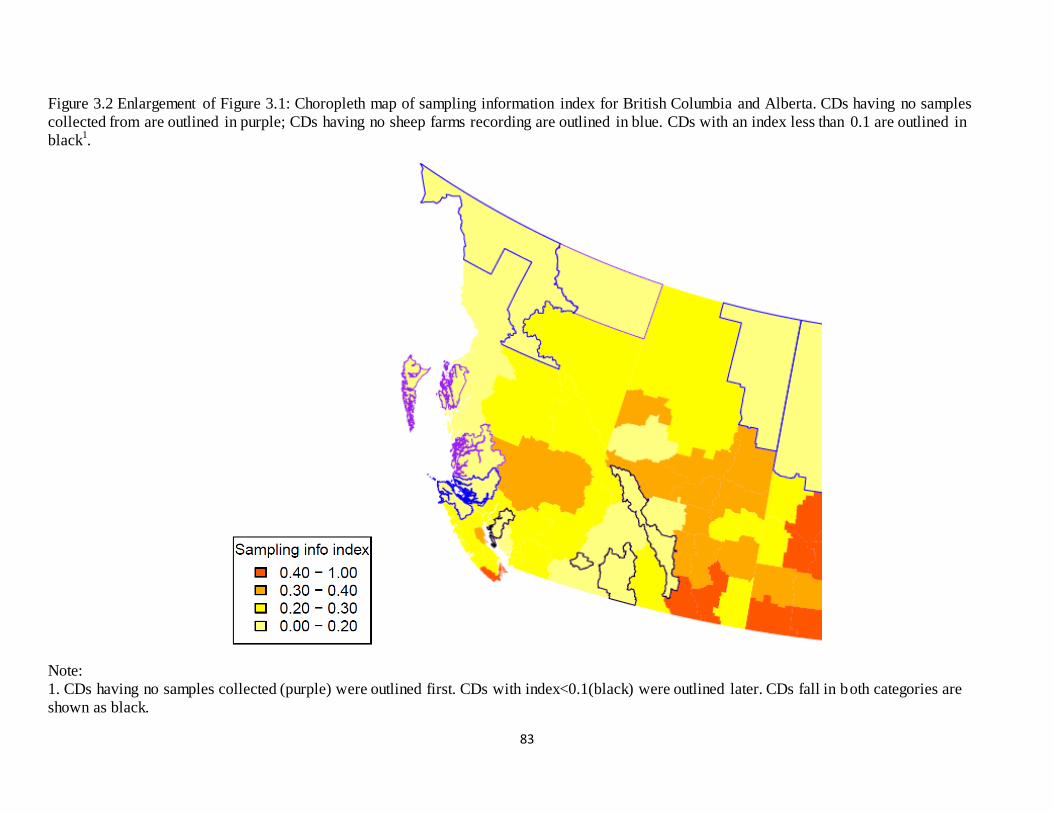
83
Figure 3.2 Enlargement of Figure 3.1: Choropleth map of sampling information index for British Columbia and Alberta. CDs having no samples
collected from are outlined in purple; CDs having no sheep farms recording are outlined in blue. CDs with an index less than 0.1 are outlined in
black1.
Note:
1. CDs having no samples collected (purple) were outlined first. CDs with index<0.1(black) were outlined later. CDs fall in both categories are
shown as black.

84
Figure 3.3 Enlargement of Figure 3.1: Choropleth map of sampling information index for Saskatchewan and Manitoba. CDs having no samples
collected from are outlined in purple; CDs having no sheep farms recording are outlined in blue. CDs with an index less than 0.1 are outlined in
black1.
Note:
1. CDs having no samples collected (purple) were outlined first. CDs with index<0.1(black) were outlined later. CDs fall in both categories are
shown as black.

85
Figure 3.4 Enlargement of Figure 3.1: Choropleth map of sampling information index for Ontario. CDs haveing no samples collected from are
outlined in purple; CDs having no sheep farms recording are outlined in blue. CDs with an index less than 0.1 are outlined in black1.
Note:
1. CDs having no samples collected (purple) were outlined first. CDs with index<0.1(black) were outlined later. CDs fall in both categories are
shown as black.

86
Figure 3.5 Enlargement of Figure 3.1: Choropleth map of sampling information index for Quebec and the Atlantic Provinces. CDs having no samples
collected from are outlined in purple; CDs having no sheep farms recording are outlined in blue. CDs with an index less than 0.1 are outlined in
black1.
Note:
1. CDs having no samples collected (purple) were outlined first. CDs with index<0.1(black) were outlined later. CDs fall in both categories are
shown as black.

87
Chapter 4: General Summary and Conclusion
4.1 Motivations for conducting scrapie surveillance
Scrapie is an economically important infectious prion disease of goats and sheep, and like
other transmissible spongiform encephalopathy (TSE) diseases it is fatal and cannot be cured. It
has been a reportable disease in Canada since 1945, but is not considered to be a zoonotic disease
(CFIA, 2012a). Scrapie has a long incubation period ranging from one to several years and is
difficult to detect in the pre-clinical state (Detwiler, 1992). The clinical signs mostly show in
animals of ages two and older, but the infection can be detected much earlier than the time of
onset of clinical signs (O’Rourke et al., 2002; Dennis et al., 2009). Once a scrapie case is
detected, its control requires rapid and accurate identification of the animal’s farm of origin and
any other farms it had lived on due to the infectious nature of the disease. Following the
identification of related flocks and herds the scrapie status of these populations is assessed.
Scrapie control and eradication is based on a systematic surveillance program and includes an
animal and farm ID system which allows for rapid traceability of livestock. Examples of these
are in place in the UK (Department for Environment Food and Rural Affairs, 2010) and Quebec
(CFIA, 2012b).
Several countries have initiated national scrapie eradication plans, e.g. the United
Kingdom (UK) (Department for Environment Food and Rural Affairs, 2010) and the United
States (US) (Animal and Plant Health Inspection Service, 2014). Canada established the
Canadian Sheep Identification Program (CSIP) in 2004 (CFIA, 2012) and the Canadian
surveillance program started in May 2005. New funding and strong endorsement were received
in 2010 from Agriculture and Agri-Food Canada (Scrapie Canada, 2013). Because the Canadian
scrapie surveillance program has not kept pace with other countries and its scrapie status has not

88
been adequately described, the US has not fully lifted the trading restrictions placed on importing
Canadian small ruminants, which was started upon the confirmation of the first bovine
spongiform encephalopathy (BSE) case in 2003 (CSF, 2011). Even though animals less than one
year old are allowed to be exported to the US for slaughter, the border has remained closed to
sheep and goat breeding stock (CSF, 2011). Hence, scrapie surveillance needs to be enhanced
and improved in order to facilitate regulatory change allowing the border to be more open. This
will help to reduce the great economic burden on small ruminant producers and the Canadian
government.
The ultimate goal of scrapie surveillance is to eradicate scrapie from affected flocks and
herds and therefore Canada. The national eradication of scrapie has been determined to be a goal
by the Scrapie Eradication Steering Committee, an appointed committee made up of producers,
industry groups, academia and government agencies (Scrapie Canada, 2014).
This study was a part of the national scrapie surveillance program, and its goal was to
estimate the national scrapie prevalence in sheep and assess the geographic distribution of
available sample information to inform future scrapie surveillance and possibly eradication. To
be precise, only classical (but not atypical) scrapie in adult sheep of 12 month and older (but not
in goats) was considered.
4.2 Review of the results
The animal samples were mainly collected at slaughter facilities, but also farms, auction
markets, animal diagnostic laboratories, and dead stock facilities (CFIA, 2012a). A total of
13,057 samples were collected through active surveillance in abattoirs from November 2010 to
December 2012. Of these, 1,355 samples were excluded from the analysis, because some

89
samples belonged to species other than sheep, some had missing animal ID information or other
recording errors.
The study has found classical scrapie to be rare among sheep in Canada. A total of 7
cases of classical scrapie were detected from 11,702 traceable sheep, or 3,233 sheep farms. Both
stratified and non-stratified prevalence estimation by province were conducted and compared.
Stratification by province did not improve the estimates, implying that there is no significant
difference between provinces. Therefore, the non-stratified results are presented as the national
scrapie prevalence. The national sheep-level prevalence is estimated at a level of 0.06%, or about
1 scrapie case per 1,700 sheep, with a 95% Wilson confidence interval ranging from 0.03% to
0.12%. The national farm-level prevalence is estimated at a level of 0.22%, or about 1 scrapie
case farm per 500 farms, with a 95% Wilson confidence interval ranging from 0.11% to 0.45%.
A choropleth map was constructed to assess the geographic distribution of available
sample information and thus identify the areas which need intensified sampling in the future. The
map has four colour scales which are based on the sampling information index proposed
specifically for this study. The sampling information index is composed of both farm level and
sheep level sampling proportion which describes the sampling intensity of the national scrapie
surveillance. According to the choropleth map, certain CDs at the West Coast, the southern
border between British Columbia and Alberta, southern Manitoba, northern Ontario and the
Atlantic Provinces are shown to have small index, indicating those areas are underrepresented in
the current national scrapie surveillance program.
4.3 Implications of the study
The study examines both the individual level and farm level prevalence of scrapie in the
Canadian sheep population. Several advanced methods to estimate the prevalence and respective

90
confidence intervals (CIs) of a rare event, such as scrapie in Canada, were reviewed. Scrapie has
been diagnosed in sheep and goats worldwide with prevalence estimates lower than 1% (Hunter
and Cairns, 1998; The European Commission, 2012; United States Department of Agriculture et
al, 2012). The individual level prevalence found in this study is within the range reported by
other countries. A national farm level prevalence estimate as reported here for Canada seems to
have never been established for other countries. This finding should give the Canadian sheep
producers and the government confidence in scrapie control because it is lower than the
prevalence estimated in 2008, which was about 1 case per 1000 sheep (Olaf Berke, Scrapie
among sheep in Canada-Sample size considerations for prevalence estimation, unpublished
report to the CFIA and CSF, University of Guelph, 2008). This apparent decrease is a sign that
the national scrapie surveillance has been effective in reducing scrapie cases. The surveillance
program needs to continue in order for Canada to reach scrapie free status.
According to the World Organization for Animal Health (OIE), a country or zone can be
considered scrapie free when a representative and sufficient number of sheep and goats over 18
months of age (sample size assuming 0.1% prevalence) are tested annually with no case found
for at least seven years (World Organization for Animal Health—OIE, 2013). According to this
standard, Canada needs to improve its scrapie surveillance with regards to following: 1) need to
have a traceable ID system for goats in order to adequately sample goats; 2) the sample needs to
be collected from not only the abattoirs (active surveillance) but also fallen stock (FT) and dead
in transit (DIT) (passive surveillance); 3) the current CSIP system needs to be improved to be
reliably and completely traceable.
This study does not present information on the prevalence of scrapie in goats. According
to the OIE standard of scrapie free status, both sheep and goats must be sampled. The goats

91
being collected by the CFIA was studied in another project and no scrapie cases were found
(Leung, Berke, Ortegon, Brown, Menzies, 2013, in preparation). However, fewer goat samples
were collected than required to give an appropriate estimate of ≤ 0.1%. Additionally, a
mandatory national traceable goat identification system should be in place before the sampling
collection in order for researchers to identify farm of origin, something that is currently lacking.
On the other hand, scrapie has been found in goats only in 2007 and 2013 during the past decade,
indicating its rareness in goats (Canadian National Goat Federation—CNGF, 2014). This low
apparent prevalence may not reflect the true state of nature. In December 2013, several goats
from an Ontario dairy goat herd was confirmed scrapie positive by the CFIA (Canadian National
Goat Federation—CNGF, 2014). Previous cases of goat scrapie were all goats residing in
infected sheep flocks. CFIA has not released information stating if this recent positive case was
associated with sheep flocks, but it has certainly further raised the awareness and needs of goats
surveillance in Canada.
In order to have an accurate estimation, OIE requires scrapie surveillance activities
collect animal samples representative of populations of healthy slaughtered animals as well as
dead stock which includes fallen stock (FT) on farm (includes those euthanized) or dead in
transit (DIT) (World Organization for Animal Health—OIE, 2013). For the purpose of this study,
only samples collected from healthy animals slaughtered at inspected abattoirs were used in the
statistical analysis. CFIA had also collected 158 samples in 2011 from other sources, such as
veterinarian submission and sheep markets. Risk from those populations may be different than
from animals sampled at abattoirs so it is recommended to include these animals in future
studies. Studies in other countries which included dead stock had found the prevalence of scrapie
92
is higher in this animal group (The European Commission, 2012). This higher prevalence is
expected because the abattoir samples are from a seemingly healthy population.
Currently, the CSIP (Scrapie Canada, 2012) has a mandatory requirement for producers
to tag the sheep with the pink metal tag, and is in transition to a more reliable and traceable
system, i.e. radio frequency identification (RFID) tags, which would record all the animal
movement (CSF, 2012; CSF, 2014). The national ID system for goats is currently voluntary. The
small ruminant industry needs to have the mandatory traceable ID system in place as soon as
possible in order for the surveillance to proceed.
4.4 Strengths and limitations
Various countries have reported extremely low scrapie prevalence. Therefore, advanced
methods for rare diseases were necessary for proper analysis and thus reviewed in this study. The
methods can be applied in other rare disease studies, such as BSE.
Given that 1,355 samples were excluded in the final analysis because of missing
information, and that all of these samples were scrapie-negative, the prevalence of scrapie is
likely over-estimated. This conservative estimate suggests the true prevalence in the abattoirs
samples should be less than or equal to the estimated value.
The benefit of constructing a disease map, compared to a data table, is that the
geographical distribution of the manually divided groups can be identified and it is easy to find
clustering of the similar groups. In this study, a choropleth map was constructed in order to
compare the sampling intensity in different administrative regions, i.e., CDs. In order to have
comparable values between CDs, a variance stabilizing index was proposed. This sampling
information index measures the combined information from both farm level and sheep level
sampling proportion to have a comprehensive estimation of the available samples. The farm level

93
sampling proportion is calculated based on the Freeman-Tukey transformation, which corrects
the overdispersion caused by the different number and size of farms in each CD. The sheep level
portion does not need this correction.
The choropleth map based on the sampling information index is able to show
geographically how close low ranking CDs are to each other. This clustering would suggest that
nearby abattoirs could be targeted by the CFIA for additional sampling. For those CDs have low
index and are isolated from other CDs in this group, CFIA should try to obtain samples from the
farms directly. In this situation, biopsy testing by sampling the recto-anal mucosa associated
lymphoid tissues (RAMALT) might be more appropriate to avoid the waiting time of sending the
animals to abattoirs, even though Bio-rad test has a higher sensitivity (Dennis et al., 2009).
However, the map is a snapshot of the information for the sampling period and the results
will change when new data are sampled and new census records become available. The industry
is changing as the number and the size of the farms fluctuate. Therefore, continuing surveillance
is needed to keep track of the scrapie status in Canada.
In order to speed up the process of scrapie eradication, producers are encouraged to
participate in the Voluntary Scrapie Flock Certification Program (VSFCP) in which the flocks
are under strict monitoring by the CFIA of infection in on-farm deaths (Scrapie Canada, 2012).
This program should continually recruit small ruminant producers since only a small portion of
farms have participated.
The results presented here do not include information from the VSFCP data: the
information was not released. As well, the “trace out” scrapie investigations, i.e. the scrapie
status of the positive cases’ farm of origin and its trading farms, were not looked into for this
study. Future studies are recommended to include that information.

94
4.5 Conclusion
In conclusion, the results of this research provide benchmarking information about the
prevalence of scrapie in Canada. This study informs a future scrapie eradication program for
Canada with the goal to remove trade restrictions and regain access to the world market.
Information about the baseline prevalence allows estimating the necessary sample size, i.e. how
many animals will need to be tested for future surveillance activities. Furthermore, this study
provides a spatial distribution of the available sampling information and this should be used as a
decision making tool to determine where to sample animals. The result should give the producers
and the Canadian government some confidence in controlling scrapie and encouraging the
implantation of a scrapie eradication plan. The eradication of scrapie will increase Canada’s
competitiveness on the international small ruminants markets and improve consumer satisfaction
among Canadians.

95
4.6 References
Animal and Plant Health Inspection Service (APHIS), 2014. National Scrapie Eradication
Program. Retrieved from:
http://www.aphis.usda.gov/wps/portal/aphis/ourfocus/animalhealth?1dmy&urile=wcm%
3apath%3a%2Faphis_content_library%2Fsa_our_focus%2Fsa_animal_health%2Fsa_ani
mal_disease_information%2Fsa_sheep_goat_health%2Fsa_scrapie%2Fct_scrapie_home
Canadian Food Inspection Agency (CFIA), 2012a. Fact sheet –
scrapie.http://www.inspection.gc.ca/animals/terrestrial-
animals/diseases/reportable/scrapie/fact-sheet/eng/1356131973857/1356132310673
Canadian Food Inspection Agency (CFIA), 2012b. Canadian sheep identification program.
http://www.inspection.gc.ca/animals/terrestrial-animals/traceability/sheep-
identification/eng/1328852777479/1328852957523
Canadian National Goat Federation—CNGF, 2014. Industry news: Goat in Ontario tests positive
for scrapie. Retrieved from:
http://www.cangoats.com/index.php?pageid=526¬iceid=120
Canadian Sheep Federation (CSF), 2011. Myth: Allowing sheep to transit through Canada from
the northern US states to Alaska puts the Canadian industry at a disadvantage. Retrieved
from: http://www.cansheep.ca/User/Docs/POV%20Summer%20Edition%202011.pdf
Canadian Sheep Federation (CSF), retrieved Aug 2012. Key Milestones for Mandatory RFID.
http://www.cansheep.ca/cms/en/key_milestones.aspx
Canadian Sheep Federation (CSF), retrieved May 2014. Update on the Sheep Industry’s Progress
Towards Mandatory RFID Tags.
http://cansheep.ca/User/Docs/Update%20RFID%20tags.pdf.
Dennis, M.M., Thomsen, B.V., Marshall, K.L., Hall, S.M., Wagner, B.A., Salman, M.D.,
Norden, D.K., Gaise,r C, Sutton, D.L., 2009. Evaluation of immunohistochemical
detection of prion protein in rectoanal mucosa-associated lymphoid tissue for diagnosis
of scrapie in sheep. Am J Vet Res 70:63-72.
Department for Environment Food and Rural Affairs (DEFRA), 2010. Archive: BSE: Other
TSEs - National Scrapie Plan for Great Britain. Retrieved from:
http://archive.defra.gov.uk/foodfarm/farmanimal/diseases/atoz/bse/othertses/scrapie/nsp.h
tm
Detwiler, L.A., 1992. Scrapie. Rev. Sci. Tech. Off. Int. Epiz. 11, 491-537.
The European Commission, 2012. Report on the monitoring of ruminants for the presence of
transmissible spongiform encephalopathies (tses) in the EU in 2011. Retrieved from:
http://ec.europa.eu/food/food/biosafety/tse_bse/monitoring_annual_reports_en.htm
Hongo A, Zhang J, Toukura Y, Akimoto M., 2004. Changes in incisor dentition of sheep
influence biting force. Grass Forage Sci, 59:293–297.
Hunter, N., Cairns, D., 1998. Scrapie-free Merino and Poll Dorset sheep from Australia and New
Zealand have normal frequencies of scrapie-susceptible PrP genotypes. J. Gen. Virol., 79
(Pt 8):2079-82.

96
Scrapie Canada, retrieved Aug 2012. Voluntary scrapie flock certification program,
http://www.scrapiecanada.ca/certification.html
Scrapie Canada, retrieved Jul 2013. Welcome to Scrapie Canada.
http://www.scrapiecanada.ca/home.html
Scrapie Canada, retrieved Apr 2014. Strategic planning for scrapie eradication. Retrieved from:
http://www.scrapiecanada.ca/eradication.html
United States Department of Agriculture (USDA), 2004. Phase II: Scrapie: Ovine Slaughter
Surveillance Study 2002-2003. USDA:APHIS:VS,CEAH, National Animal Health
Monitoring System, Fort Collins, CO., #N419.0104. Retrieved from:
http://www.aphis.usda.gov/animal_health/animal_diseases/scrapie/downloads/sossphase2
United States Department of Agriculture (USDA), Animal Plant Health Inspection Service,
Veterinary Services (APHIS), National Center for Animal Health Programs, Ruminant
Health Programs, 2012. National Scrapie Eradication Program, Fiscal Year 2012 Report,
October 1, 2011 to September 30, 2012. Retrieved July 2013 from:
http://www.aphis.usda.gov/animal_health/animal_diseases/scrapie/downloads/yearly_rep
ort.pdf
World Organization for Animal Health—OIE, 2013. Terrestrial Animal Health Code. Chapter
14.9. Scrapie.
http://www.oie.int/fileadmin/Home/eng/Health_standards/tahc/2010/en_chapitre_1.14.9.
htm

97
Appendix A: R-code for the Stratified Wilson Confidence Interval
Strat.Wilson.CI<-function(x,n,conf)
{
p<-x/n
k<-length(p)
#Step 1
conf.level <-conf
alpha <- 1 - conf.level
k<-length(x)
m<-1-(alpha^(1/k))
zy<-qnorm(1-((1-m)/2));zy
wnum<-c()
for(i in 1:k)
{
wnum[i]<-(((1+(zy^2)/n[i])^2)/(((p[i]*(1 -
p[i]))/n[i])+(zy^2/(4*n[i]^2))))
}
wdenom<-sum(wnum)
w<-wnum/wdenom
w # these are w0i
#step 2
z1<-c()
z2<-c()
for(i in 1:k)

98
{
z1[i]<-w[i]^2*((p[i]*(1 - p[i]))/n[i])
z2[i] <-w[i]*sqrt((p[i]*(1 - p[i]))/n[i])
}
znum<- sqrt(sum(z1))
zdenom <-sum(z2)
nalpha<-1-(0.5*alpha)
zy<-(znum/zdenom)*qnorm(1-((1-nalpha)/2))# These are z0y
#Step 3
wnum<-c()
for(i in 1:k)
{
wnum[i]<-(((1+(zy^2)/n[i])^2)/(((p[i]*(1 -
p[i]))/n[i])+(zy^2/(4*n[i]^2))))
}
wdenom<-sum(wnum)
w2<-wnum/wdenom
w2 # these are w0i #these are w_hat_i's.
#Step4
zgamma1<-c()
zgamma2<-c()
zgamma1;zgamma2
for(i in 1:k)
{

99
zgamma1[i]<-w2[i]^2*((p[i]*(1 - p[i]))/n[i])
zgamma2[i] <-w2[i]*sqrt((p[i]*(1 - p[i]))/n[i])
}
zgammanum<- sqrt(sum(zgamma1))
zgammadenom <-sum(zgamma2)
alpha <- 1 - conf.level
nalpha<-1-(0.5*alpha)
zy1<-(zgammanum/zgammadenom)*qnorm(1-((1-nalpha)/2))# These
are z0y
#step5
#The updated normal percentile zy is used to compute (Li ,
Ui ) and the updated weights w_hat_i's are used to
construct
#the stratified confidence interval (L, U).
L1<-c();L2<-c()
U1<-c();U2<-c()
for (i in 1:k)
{
L1[i]= (p[i]+(zy1^2/(2*n[i])))/(1+(zy1^2/n[i]))
L2[i]=(zy1/(1+(zy1^2/n[i])))*sqrt(((p[i]*(1 -
p[i]))/n[i]) + zy1^2/(4*(n[i]^2)))
U1[i]= (p[i]+(zy1^2/(2*n[i])))/(1+(zy1^2/n[i]))
U2[i]=(zy1/(1+(zy1^2/n[i])))*sqrt(((p[i]*(1 -
p[i]))/n[i]) + zy1^2/(4*(n[i]^2)))
}
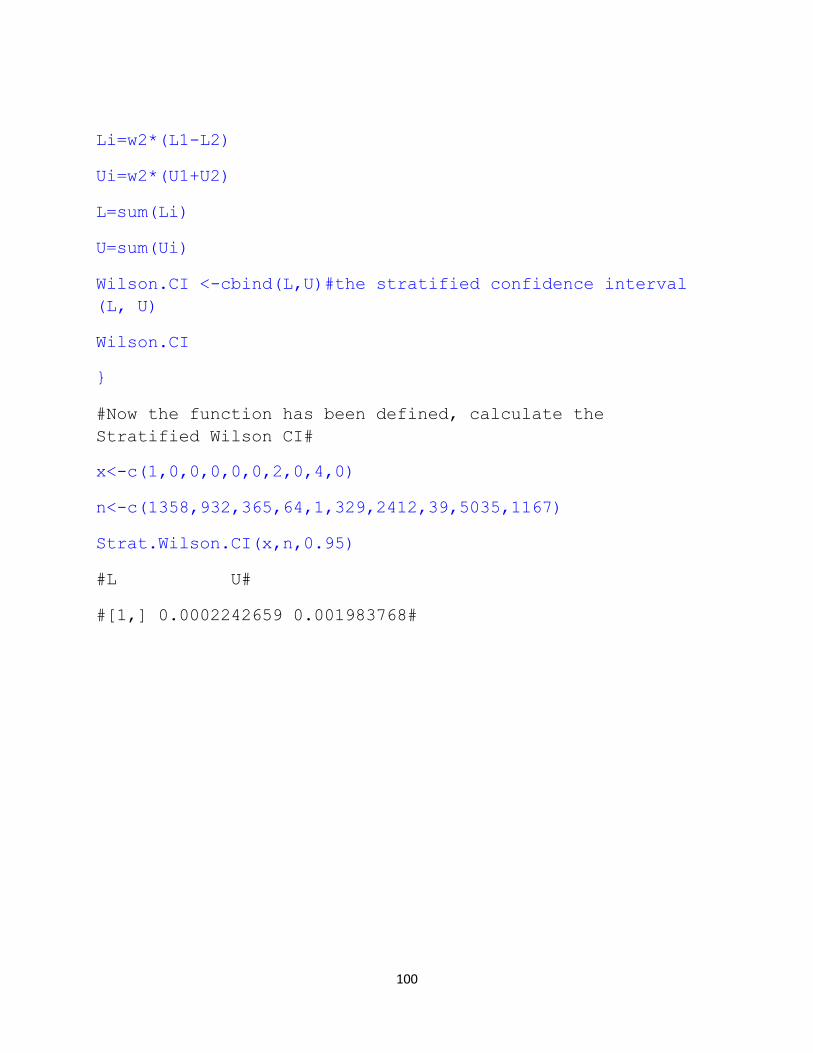
100
Li=w2*(L1-L2)
Ui=w2*(U1+U2)
L=sum(Li)
U=sum(Ui)
Wilson.CI <-cbind(L,U)#the stratified confidence interval
(L, U)
Wilson.CI
}
#Now the function has been defined, calculate the
Stratified Wilson CI#
x<-c(1,0,0,0,0,0,2,0,4,0)
n<-c(1358,932,365,64,1,329,2412,39,5035,1167)
Strat.Wilson.CI(x,n,0.95)
#L U#
#[1,] 0.0002242659 0.001983768#

101
Appendix B: Matlab code for the Stratified Wilson Confidence Interval
% Input
r=[1 0 0 0 0 0 2 0 4 0];
n=[1370 932 365 64 1 329 2411 39 5038 1167];
p=r./n;
% Find the number of populations
k=length(n);
% Set the confidence level
conf_level = 0.95;
alpha = 1 - conf_level;
% Constants
% alpha
h = 1-(0.5*alpha);
z_alpha = norminv(1-((1-h)/2));
% gamma
m=1-(alpha^(1/k));
z_initial=norminv(1-((1-m)/2),0,1);
z_gamma = z_initial;
% Output
num_iterations=3;
W = zeros(num_iterations,k);
Z = zeros(num_iterations,1);
L = zeros(num_iterations,1);
U = zeros(num_iterations,1);
A = zeros(num_iterations,1);

102
for qq=1:num_iterations
for ii=1:k
%calculate denominator of wi
w_denom = 0;
for jj=1:k
w_denom=w_denom+(1+z_gamma^2/n(jj))^2/(p(jj)*(1-
p(jj))/n(jj)+z_gamma^2/4/n(jj)^2);
end
%calculate numerator of wi
w_num =(1+z_gamma^2/n(ii))^2/(p(ii)*(1-
p(ii))/n(ii)+z_gamma^2/4/n(ii)^2);
%calculate wi
W(qq,ii)= w_num/w_denom;
end
% update z_gamma
z_num = 0;
for ii=1:k
z_num = z_num + W(qq,ii)^2*p(ii)*(1-p(ii))/n(ii);
end
z_gamma_num=sqrt(z_num);
z_denom=0;
for ii=1:k
z_denom = z_denom + W(qq,ii)*sqrt(p(ii)*(1-
p(ii))/n(ii));
end
z_gamma=z_gamma_num/z_denom*z_alpha;

103
%save to output
Z(qq)=z_gamma;
% Calculate L & U
for ii=1:k
first_part=(p(ii)+z_gamma^2/2/n(ii))/(1+z_gamma^2/n(ii));
second_part=z_gamma/(1+z_gamma^2/n(ii))*sqrt(p(ii)*(1-
p(ii))/n(ii)+z_gamma^2/4/n(ii)^2);
L(qq)=L(qq)+W(qq,ii)*(first_part-second_part);
U(qq)=U(qq)+W(qq,ii)*(first_part+second_part);
%calculate the point estimate
A(qq)= A(qq)+W(qq,ii)*(first_part);
end
end
W
Z
L

104
Appendix C: Scrapie surveillance sampling data ranking by index values
CD1 Farmexist2 Farmsam3 Ratio4 Sheepno5 Index Rankratio6 ProCod7 Pro
1 34 0 0.00 0 0.0417 1 59 BC
2 29 0 0.00 0 0.0449 1 59 BC
3 18 0 0.00 0 0.0559 1 59 BC
4 13 0 0.00 0 0.0645 1 46 MB
5 12 0 0.00 0 0.0668 1 35 ON
6 7 0 0.00 0 0.0833 1 10 NL
7 6 0 0.00 0 0.0884 1 10 NL
8 6 0 0.00 0 0.0884 1 24 QC
9 5 0 0.00 0 0.0945 1 12 NS
10 5 0 0.00 0 0.0945 1 24 QC
11 5 0 0.00 0 0.0945 1 48 AB
12 4 0 0.00 0 0.1021 1 10 NL
13 4 0 0.00 0 0.1021 1 12 NS
14 4 0 0.00 0 0.1021 1 13 NB
15 4 0 0.00 0 0.1021 1 24 QC
16 4 0 0.00 0 0.1021 1 24 QC
17 4 0 0.00 0 0.1021 1 35 ON
18 28 1 0.04 1 0.1126 51 10 NL
19 24 1 0.04 1 0.1212 52 35 ON
20 2 0 0.00 0 0.1250 1 24 QC
21 2 0 0.00 0 0.1250 1 24 QC
22 2 0 0.00 0 0.1250 1 24 QC
23 2 0 0.00 0 0.1250 1 46 MB
24 2 0 0.00 0 0.1250 1 59 BC
25 2 0 0.00 0 0.1250 1 59 BC
26 23 1 0.04 3 0.1253 53 35 ON
27 35 2 0.06 3 0.1334 54 59 BC
28 1 0 0.00 0 0.1443 1 10 NL
29 1 0 0.00 0 0.1443 1 10 NL
30 1 0 0.00 0 0.1443 1 12 NS
31 1 0 0.00 0 0.1443 1 13 NB
32 1 0 0.00 0 0.1443 1 13 NB
33 1 0 0.00 0 0.1443 1 24 QC
34 1 0 0.00 0 0.1443 1 24 QC
35 1 0 0.00 0 0.1443 1 24 QC
36 1 0 0.00 0 0.1443 1 24 QC
37 1 0 0.00 0 0.1443 1 46 MB
38 1 0 0.00 0 0.1443 1 59 BC
39 41 3 0.07 5 0.1479 55 59 BC
40 25 2 0.08 2 0.1557 56 46 MB
41 53 5 0.09 8 0.1659 60 35 ON
42 12 1 0.08 1 0.1675 57 35 ON
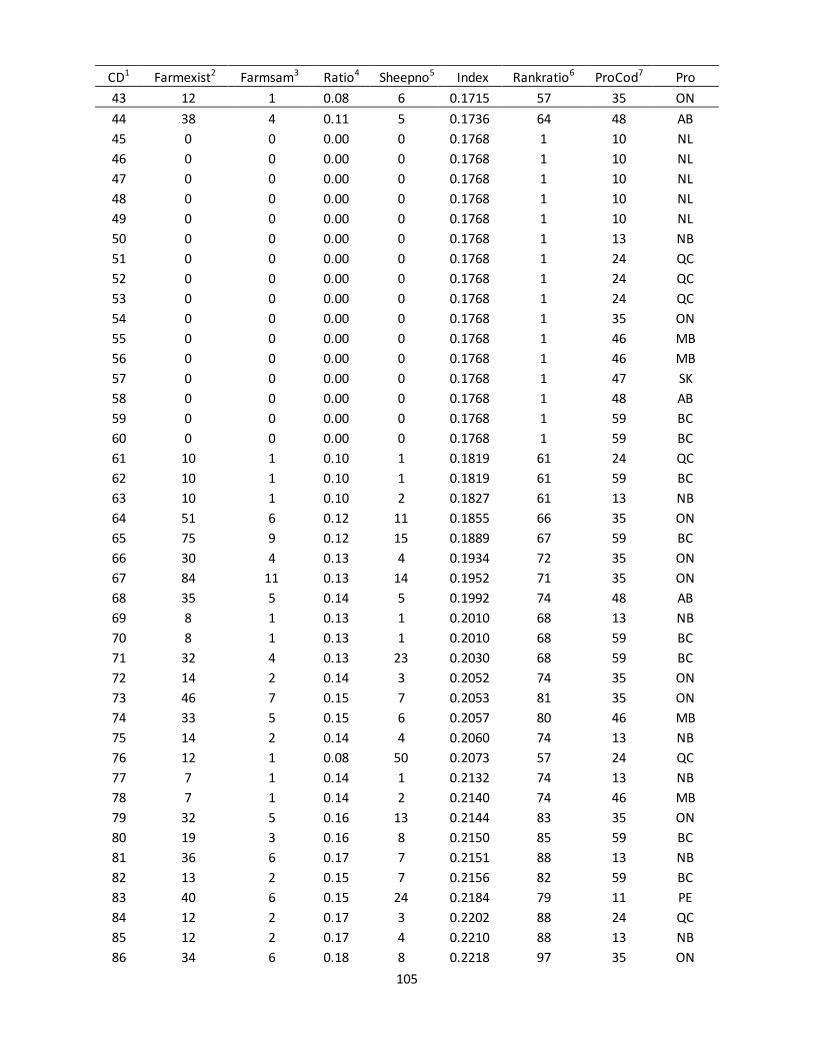
105
CD1 Farmexist2 Farmsam3 Ratio4 Sheepno5 Index Rankratio6 ProCod7 Pro
43 12 1 0.08 6 0.1715 57 35 ON
44 38 4 0.11 5 0.1736 64 48 AB
45 0 0 0.00 0 0.1768 1 10 NL
46 0 0 0.00 0 0.1768 1 10 NL
47 0 0 0.00 0 0.1768 1 10 NL
48 0 0 0.00 0 0.1768 1 10 NL
49 0 0 0.00 0 0.1768 1 10 NL
50 0 0 0.00 0 0.1768 1 13 NB
51 0 0 0.00 0 0.1768 1 24 QC
52 0 0 0.00 0 0.1768 1 24 QC
53 0 0 0.00 0 0.1768 1 24 QC
54 0 0 0.00 0 0.1768 1 35 ON
55 0 0 0.00 0 0.1768 1 46 MB
56 0 0 0.00 0 0.1768 1 46 MB
57 0 0 0.00 0 0.1768 1 47 SK
58 0 0 0.00 0 0.1768 1 48 AB
59 0 0 0.00 0 0.1768 1 59 BC
60 0 0 0.00 0 0.1768 1 59 BC
61 10 1 0.10 1 0.1819 61 24 QC
62 10 1 0.10 1 0.1819 61 59 BC
63 10 1 0.10 2 0.1827 61 13 NB
64 51 6 0.12 11 0.1855 66 35 ON
65 75 9 0.12 15 0.1889 67 59 BC
66 30 4 0.13 4 0.1934 72 35 ON
67 84 11 0.13 14 0.1952 71 35 ON
68 35 5 0.14 5 0.1992 74 48 AB
69 8 1 0.13 1 0.2010 68 13 NB
70 8 1 0.13 1 0.2010 68 59 BC
71 32 4 0.13 23 0.2030 68 59 BC
72 14 2 0.14 3 0.2052 74 35 ON
73 46 7 0.15 7 0.2053 81 35 ON
74 33 5 0.15 6 0.2057 80 46 MB
75 14 2 0.14 4 0.2060 74 13 NB
76 12 1 0.08 50 0.2073 57 24 QC
77 7 1 0.14 1 0.2132 74 13 NB
78 7 1 0.14 2 0.2140 74 46 MB
79 32 5 0.16 13 0.2144 83 35 ON
80 19 3 0.16 8 0.2150 85 59 BC
81 36 6 0.17 7 0.2151 88 13 NB
82 13 2 0.15 7 0.2156 82 59 BC
83 40 6 0.15 24 0.2184 79 11 PE
84 12 2 0.17 3 0.2202 88 24 QC
85 12 2 0.17 4 0.2210 88 13 NB
86 34 6 0.18 8 0.2218 97 35 ON
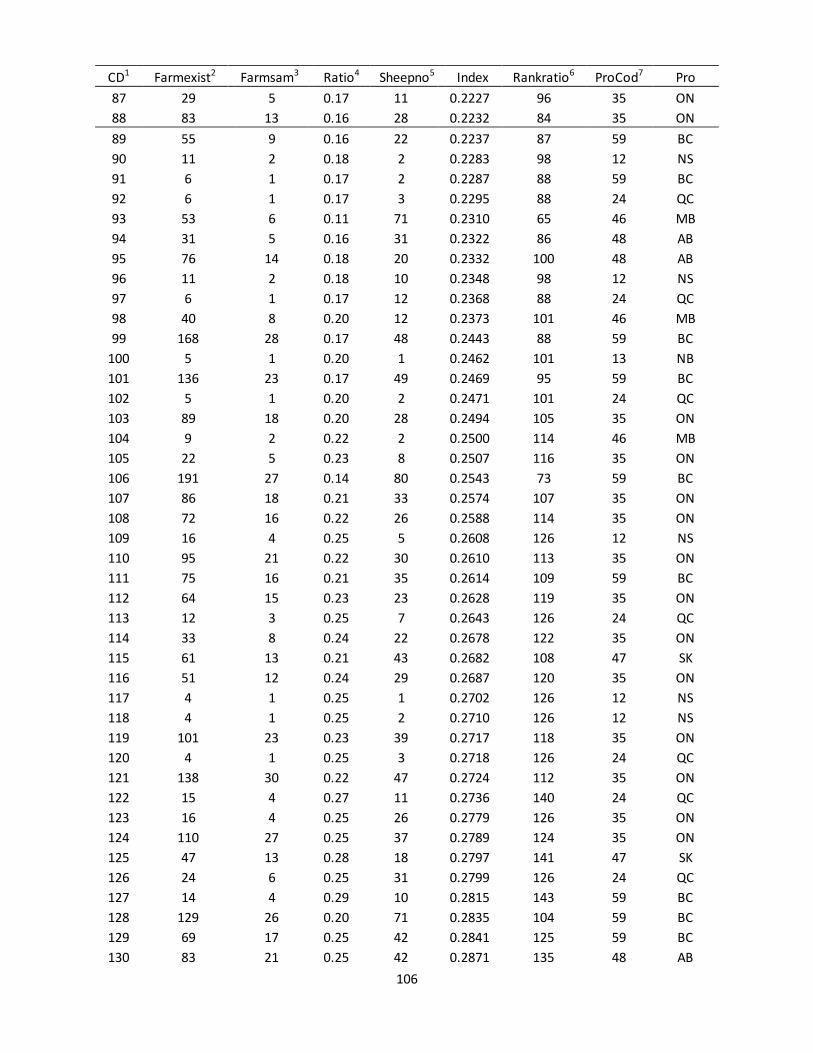
106
CD1 Farmexist2 Farmsam3 Ratio4 Sheepno5 Index Rankratio6 ProCod7 Pro
87 29 5 0.17 11 0.2227 96 35 ON
88 83 13 0.16 28 0.2232 84 35 ON
89 55 9 0.16 22 0.2237 87 59 BC
90 11 2 0.18 2 0.2283 98 12 NS
91 6 1 0.17 2 0.2287 88 59 BC
92 6 1 0.17 3 0.2295 88 24 QC
93 53 6 0.11 71 0.2310 65 46 MB
94 31 5 0.16 31 0.2322 86 48 AB
95 76 14 0.18 20 0.2332 100 48 AB
96 11 2 0.18 10 0.2348 98 12 NS
97 6 1 0.17 12 0.2368 88 24 QC
98 40 8 0.20 12 0.2373 101 46 MB
99 168 28 0.17 48 0.2443 88 59 BC
100 5 1 0.20 1 0.2462 101 13 NB
101 136 23 0.17 49 0.2469 95 59 BC
102 5 1 0.20 2 0.2471 101 24 QC
103 89 18 0.20 28 0.2494 105 35 ON
104 9 2 0.22 2 0.2500 114 46 MB
105 22 5 0.23 8 0.2507 116 35 ON
106 191 27 0.14 80 0.2543 73 59 BC
107 86 18 0.21 33 0.2574 107 35 ON
108 72 16 0.22 26 0.2588 114 35 ON
109 16 4 0.25 5 0.2608 126 12 NS
110 95 21 0.22 30 0.2610 113 35 ON
111 75 16 0.21 35 0.2614 109 59 BC
112 64 15 0.23 23 0.2628 119 35 ON
113 12 3 0.25 7 0.2643 126 24 QC
114 33 8 0.24 22 0.2678 122 35 ON
115 61 13 0.21 43 0.2682 108 47 SK
116 51 12 0.24 29 0.2687 120 35 ON
117 4 1 0.25 1 0.2702 126 12 NS
118 4 1 0.25 2 0.2710 126 12 NS
119 101 23 0.23 39 0.2717 118 35 ON
120 4 1 0.25 3 0.2718 126 24 QC
121 138 30 0.22 47 0.2724 112 35 ON
122 15 4 0.27 11 0.2736 140 24 QC
123 16 4 0.25 26 0.2779 126 35 ON
124 110 27 0.25 37 0.2789 124 35 ON
125 47 13 0.28 18 0.2797 141 47 SK
126 24 6 0.25 31 0.2799 126 24 QC
127 14 4 0.29 10 0.2815 143 59 BC
128 129 26 0.20 71 0.2835 104 59 BC
129 69 17 0.25 42 0.2841 125 59 BC
130 83 21 0.25 42 0.2871 135 48 AB

107
CD1 Farmexist2 Farmsam3 Ratio4 Sheepno5 Index Rankratio6 ProCod7 Pro
131 12 3 0.25 36 0.2879 126 24 QC
132 10 3 0.30 9 0.2886 151 24 QC
133 16 5 0.31 6 0.2890 157 12 NS
134 27 8 0.30 17 0.2892 150 46 MB
135 80 21 0.26 39 0.2893 138 59 BC
136 33 10 0.30 19 0.2932 154 46 MB
137 24 7 0.29 25 0.2940 146 24 QC
138 119 29 0.24 57 0.2942 123 35 ON
139 29 9 0.31 19 0.2967 156 47 SK
140 15 5 0.33 6 0.2977 162 11 PE
141 120 26 0.22 80 0.2990 111 35 ON
142 6 2 0.33 2 0.2991 162 12 NS
143 44 13 0.30 33 0.3006 149 12 NS
144 15 5 0.33 12 0.3026 162 24 QC
145 52 16 0.31 31 0.3041 155 46 MB
146 81 23 0.28 45 0.3042 142 35 ON
147 3 1 0.33 3 0.3049 162 13 NB
148 26 9 0.35 12 0.3062 176 46 MB
149 98 25 0.26 66 0.3074 136 59 BC
150 3 1 0.33 7 0.3081 162 24 QC
151 190 39 0.21 101 0.3095 106 48 AB
152 6 2 0.33 15 0.3096 162 24 QC
153 50 16 0.32 32 0.3104 159 35 ON
154 12 4 0.33 21 0.3108 162 24 QC
155 75 22 0.29 48 0.3111 147 35 ON
156 30 9 0.30 46 0.3141 151 24 QC
157 8 3 0.38 5 0.3153 184 35 ON
158 191 45 0.24 89 0.3158 121 48 AB
159 16 6 0.38 9 0.3163 184 24 QC
160 56 19 0.34 38 0.3233 172 48 AB
161 233 53 0.23 107 0.3261 117 48 AB
162 11 4 0.36 25 0.3261 180 24 QC
163 27 10 0.37 26 0.3273 182 46 MB
164 97 25 0.26 90 0.3282 137 35 ON
165 72 19 0.26 86 0.3283 139 35 ON
166 26 10 0.38 21 0.3288 186 46 MB
167 27 10 0.37 28 0.3289 182 13 NB
168 17 7 0.41 9 0.3300 191 11 PE
169 10 4 0.40 19 0.3349 190 24 QC
170 59 17 0.29 80 0.3350 144 47 SK
171 31 12 0.39 30 0.3368 187 12 NS
172 182 39 0.21 129 0.3372 110 48 AB
173 46 18 0.39 29 0.3373 188 47 SK
174 60 21 0.35 50 0.3375 177 47 SK

108
CD1 Farmexist2 Farmsam3 Ratio4 Sheepno5 Index Rankratio6 ProCod7 Pro
175 112 33 0.29 82 0.3389 148 35 ON
176 123 37 0.30 79 0.3392 153 35 ON
177 93 32 0.34 57 0.3403 175 47 SK
178 82 27 0.33 65 0.3406 160 47 SK
179 208 52 0.25 113 0.3425 126 35 ON
180 35 15 0.43 18 0.3427 198 48 AB
181 9 4 0.44 10 0.3433 203 24 QC
182 29 12 0.41 26 0.3438 194 47 SK
183 90 26 0.29 92 0.3446 145 48 AB
184 31 13 0.42 27 0.3467 196 46 MB
185 16 7 0.44 24 0.3515 202 24 QC
186 27 12 0.44 23 0.3527 203 46 MB
187 17 8 0.47 13 0.3541 208 12 NS
188 23 10 0.43 30 0.3551 200 48 AB
189 17 7 0.41 40 0.3552 191 24 QC
190 2 1 0.50 2 0.3552 212 12 NS
191 2 1 0.50 3 0.3560 212 12 NS
192 89 30 0.34 85 0.3602 170 47 SK
193 39 17 0.44 38 0.3616 201 47 SK
194 8 4 0.50 12 0.3633 212 24 QC
195 16 8 0.50 17 0.3674 212 46 MB
196 16 8 0.50 17 0.3674 212 46 MB
197 52 22 0.42 54 0.3697 197 46 MB
198 81 32 0.40 71 0.3725 189 48 AB
199 23 11 0.48 35 0.3746 210 24 QC
200 11 6 0.55 8 0.3746 221 24 QC
201 11 6 0.55 9 0.3754 221 24 QC
202 167 57 0.34 106 0.3787 174 48 AB
203 11 6 0.55 14 0.3795 221 24 QC
204 17 8 0.47 47 0.3818 208 24 QC
205 121 43 0.36 106 0.3847 178 35 ON
206 18 10 0.56 16 0.3848 224 24 QC
207 5 3 0.60 6 0.3875 231 46 MB
208 9 5 0.56 21 0.3880 224 24 QC
209 58 21 0.36 112 0.3929 179 59 BC
210 12 7 0.58 16 0.3929 228 24 QC
211 3 2 0.67 2 0.3994 238 24 QC
212 3 2 0.67 3 0.4002 238 24 QC
213 51 21 0.41 101 0.4036 191 35 ON
214 49 22 0.45 85 0.4045 205 47 SK
215 6 4 0.67 4 0.4050 238 24 QC
216 8 5 0.63 19 0.4067 236 24 QC
217 72 30 0.42 103 0.4069 195 35 ON
218 35 19 0.54 54 0.4119 220 12 NS
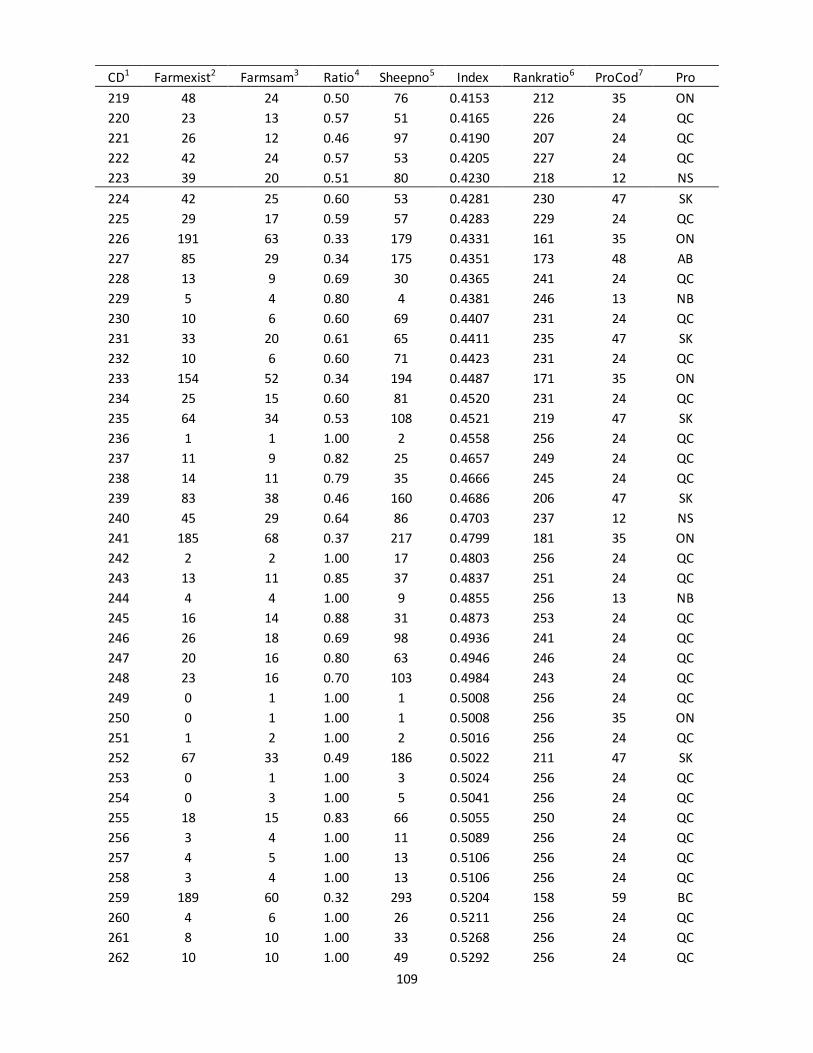
109
CD1 Farmexist2 Farmsam3 Ratio4 Sheepno5 Index Rankratio6 ProCod7 Pro
219 48 24 0.50 76 0.4153 212 35 ON
220 23 13 0.57 51 0.4165 226 24 QC
221 26 12 0.46 97 0.4190 207 24 QC
222 42 24 0.57 53 0.4205 227 24 QC
223 39 20 0.51 80 0.4230 218 12 NS
224 42 25 0.60 53 0.4281 230 47 SK
225 29 17 0.59 57 0.4283 229 24 QC
226 191 63 0.33 179 0.4331 161 35 ON
227 85 29 0.34 175 0.4351 173 48 AB
228 13 9 0.69 30 0.4365 241 24 QC
229 5 4 0.80 4 0.4381 246 13 NB
230 10 6 0.60 69 0.4407 231 24 QC
231 33 20 0.61 65 0.4411 235 47 SK
232 10 6 0.60 71 0.4423 231 24 QC
233 154 52 0.34 194 0.4487 171 35 ON
234 25 15 0.60 81 0.4520 231 24 QC
235 64 34 0.53 108 0.4521 219 47 SK
236 1 1 1.00 2 0.4558 256 24 QC
237 11 9 0.82 25 0.4657 249 24 QC
238 14 11 0.79 35 0.4666 245 24 QC
239 83 38 0.46 160 0.4686 206 47 SK
240 45 29 0.64 86 0.4703 237 12 NS
241 185 68 0.37 217 0.4799 181 35 ON
242 2 2 1.00 17 0.4803 256 24 QC
243 13 11 0.85 37 0.4837 251 24 QC
244 4 4 1.00 9 0.4855 256 13 NB
245 16 14 0.88 31 0.4873 253 24 QC
246 26 18 0.69 98 0.4936 241 24 QC
247 20 16 0.80 63 0.4946 246 24 QC
248 23 16 0.70 103 0.4984 243 24 QC
249 0 1 1.00 1 0.5008 256 24 QC
250 0 1 1.00 1 0.5008 256 35 ON
251 1 2 1.00 2 0.5016 256 24 QC
252 67 33 0.49 186 0.5022 211 47 SK
253 0 1 1.00 3 0.5024 256 24 QC
254 0 3 1.00 5 0.5041 256 24 QC
255 18 15 0.83 66 0.5055 250 24 QC
256 3 4 1.00 11 0.5089 256 24 QC
257 4 5 1.00 13 0.5106 256 24 QC
258 3 4 1.00 13 0.5106 256 24 QC
259 189 60 0.32 293 0.5204 158 59 BC
260 4 6 1.00 26 0.5211 256 24 QC
261 8 10 1.00 33 0.5268 256 24 QC
262 10 10 1.00 49 0.5292 256 24 QC

110
CD1 Farmexist2 Farmsam3 Ratio4 Sheepno5 Index Rankratio6 ProCod7 Pro
263 3 6 1.00 36 0.5293 256 24 QC
264 146 49 0.34 299 0.5332 169 48 AB
265 262 113 0.43 252 0.5333 199 35 ON
266 5 7 1.00 52 0.5423 256 24 QC
267 16 13 0.81 132 0.5531 248 24 QC
268 15 17 1.00 72 0.5585 256 24 QC
269 13 16 1.00 78 0.5634 256 24 QC
270 14 16 1.00 85 0.5691 256 24 QC
271 45 34 0.76 168 0.5696 244 24 QC
272 14 19 1.00 86 0.5699 256 24 QC
273 13 11 0.85 146 0.5723 251 24 QC
274 14 21 1.00 109 0.5886 256 24 QC
275 12 16 1.00 109 0.5886 256 24 QC
276 8 14 1.00 118 0.5959 256 24 QC
277 17 15 0.88 167 0.6000 255 24 QC
278 4 8 1.00 138 0.6122 256 24 QC
279 40 35 0.88 253 0.6710 253 24 QC
280 22 22 1.00 258 0.7045 256 24 QC
281 22 23 1.00 280 0.7276 256 24 QC
282 24 29 1.00 360 0.7927 256 24 QC
283 44 50 1.00 615 1.0000 256 24 QC
Note:
1. Actual CD id are not revealed here due to confidentiality issues
2. Farmexist: the number of farms in the CD according to the 2011 Census of Aguriculture
3. Farmsam: the number of farms in the CD that had samples taken from
4. Ratio: farm level sampling proportion. If ratio>1, manually changed to ratio=1.
5. Sheepno: the number of sheep collected in the CD
6. Rankratio: the ranking of ratio. Equal values are all assigned the minimum rank.
7. ProCod: the province code corresponding to the name of the province which is used in all the
Canadian Census.


![Geometric versus Geographic Models for the … versus Geographic Models for the Estimation of an FTTH Deployment ... FTTx networks [13-14].](https://static.fdocuments.net/doc/165x107/5aa72a4a7f8b9a50528bf7cc/geometric-versus-geographic-models-for-the-versus-geographic-models-for-the.jpg)


