Prevalence and Risk Factors Associated with Injurious ...
9
Research Article Prevalence and Risk Factors Associated with Injurious Falls among Community-Dwelling Older Adults in Indonesia Supa Pengpid 1,2 and Karl Peltzer 3,4 1 ASEAN Institute for Health Development, Mahidol University, Salaya, ailand 2 Department of Research & Innovation, University of Limpopo, Turfloop, South Africa 3 Department for Management of Science and Technology Development, Ton Duc ang University, Ho Chi Minh City, Vietnam 4 Faculty of Pharmacy, Ton Duc ang University, Ho Chi Minh City, Vietnam Correspondence should be addressed to Karl Peltzer; [email protected] Received 9 January 2018; Accepted 19 February 2018; Published 3 June 2018 Academic Editor: Jacek Witkowski Copyright © 2018 Supa Pengpid and Karl Peltzer. is is an open access article distributed under the Creative Commons Attribution License, which permits unrestricted use, distribution, and reproduction in any medium, provided the original work is properly cited. Objective. To assess the prevalence and health correlates of fall-related injury in a national population-based community-dwelling sample of older Indonesians. Methods. Participants were 6698 older adults, 50 years and older (median age 58.0 years, IQR=11.0, and age range of 50–101 years), who took part in in the Indonesia Family Life Survey (IFLS-5) in 2014-15. ey provided information about sociodemographic, various health variables, including a falling down and received treatment history in the last two years. Results. Overall, 12.8% had one or more fall-related injuries in the past two years, 14.0% among women and 11.5% among men, 7.6% had a single fall, and 5.2% multiple fall-related injuries in the past two years. In multivariable logistic regression models, having two or more chronic conditions, urinary problems, and functional disability was independently associated with multiple fall-related injuries in the past two years in both sexes. Sex-specific risk factors were former tobacco use, having or having had a cataract, sleep disturbance, and sleep impairment in men and poorer economic background, depression symptoms, and low cognitive functioning in women. Conclusion. A significant proportion of older adults in Indonesia have fall-related injury. Several homogenous between the sexes and sex-specific risk factors for fall-related injury were identified that can help in designing fall-prevention strategies. 1. Introduction Fall-related injury in older adults has been recognized as a major public health issue [1–3]. In a study among older adults (50 years and older) in six middle-income countries, the prevalence of past-year fall-related injuries was 4.0%, ranging from 6.6 % in India and 3.1% in China to 1.0 % in South Africa [4]. In older adults (60 years and older) in Singapore, the prevalence rate of past one year falls was 17.2%, of which one-third had recurrent falls [5], and among community- dwelling older adults (60 years and older) in ailand, 18.7% reported having had one or more falls in the past six months [6]. In a local community-based study among older adults in Malaysia, the past-year prevalence of falls was 4.1% [7]. In a review on falls among older adults in Southeast Asia, Romli et al. [8] found that more research is needed from all Southeast Asian countries, including Indonesia, to get ready for the management of falls in an ageing society. Effective fall reduction programmes need to include a comprehensive fall risk assessment and targeted interven- tions [9]. “Most of these falls are associated with one or more identifiable risk factors (e.g., weakness, unsteady gait, confusion, and certain medications), and research has shown that attention to these risk factors can significantly reduce rates of falling” [9, p.37]. Various risk factors for fall injuries in older adults have been identified, including sociode- mographic, health status, and health behaviour variables. Sociodemographic risk factors include increasing age [5, 10– 13], being female [4, 5, 14], lower socioeconomic status [14], and residing in rural areas [4, 15]. Health status risk factors for fall-related injuries among older adults may include nutritional risk [16], multimorbidity [4, 12, 13, 16] (including specific chronic conditions such as hypertension [5], stroke [14, 17, 18], and diabetes [18]), low hand grip strength [19], and poor cognitive functioning [4, 14]. Other health risk factors include functional disability, Hindawi Current Gerontology and Geriatrics Research Volume 2018, Article ID 5964305, 8 pages https://doi.org/10.1155/2018/5964305
Transcript of Prevalence and Risk Factors Associated with Injurious ...

Research ArticlePrevalence and Risk Factors Associated with Injurious Fallsamong Community-Dwelling Older Adults in Indonesia
Supa Pengpid1,2 and Karl Peltzer 3,4
1ASEAN Institute for Health Development, Mahidol University, Salaya, Thailand2Department of Research & Innovation, University of Limpopo, Turfloop, South Africa3Department for Management of Science and Technology Development, Ton Duc Thang University, Ho Chi Minh City, Vietnam4Faculty of Pharmacy, Ton Duc Thang University, Ho Chi Minh City, Vietnam
Correspondence should be addressed to Karl Peltzer; [email protected]
Received 9 January 2018; Accepted 19 February 2018; Published 3 June 2018
Academic Editor: Jacek Witkowski
Copyright © 2018 Supa Pengpid andKarl Peltzer.This is an open access article distributed under theCreative CommonsAttributionLicense, which permits unrestricted use, distribution, and reproduction in anymedium, provided the originalwork is properly cited.
Objective. To assess the prevalence and health correlates of fall-related injury in a national population-based community-dwellingsample of older Indonesians. Methods. Participants were 6698 older adults, 50 years and older (median age 58.0 years, IQR=11.0,and age range of 50–101 years), who took part in in the Indonesia Family Life Survey (IFLS-5) in 2014-15.They provided informationabout sociodemographic, various health variables, including a falling down and received treatment history in the last two years.Results. Overall, 12.8% had one or more fall-related injuries in the past two years, 14.0% among women and 11.5% among men, 7.6%had a single fall, and 5.2%multiple fall-related injuries in the past two years. In multivariable logistic regressionmodels, having twoor more chronic conditions, urinary problems, and functional disability was independently associated with multiple fall-relatedinjuries in the past two years in both sexes. Sex-specific risk factors were former tobacco use, having or having had a cataract, sleepdisturbance, and sleep impairment inmen and poorer economic background, depression symptoms, and low cognitive functioningin women. Conclusion. A significant proportion of older adults in Indonesia have fall-related injury. Several homogenous betweenthe sexes and sex-specific risk factors for fall-related injury were identified that can help in designing fall-prevention strategies.
1. Introduction
Fall-related injury in older adults has been recognized as amajor public health issue [1–3]. In a study among older adults(50 years and older) in six middle-income countries, theprevalence of past-year fall-related injuries was 4.0%, rangingfrom 6.6 % in India and 3.1% in China to 1.0 % in SouthAfrica [4]. In older adults (60 years and older) in Singapore,the prevalence rate of past one year falls was 17.2%, of whichone-third had recurrent falls [5], and among community-dwelling older adults (60 years and older) in Thailand, 18.7%reported having had one or more falls in the past six months[6]. In a local community-based study among older adultsin Malaysia, the past-year prevalence of falls was 4.1% [7].In a review on falls among older adults in Southeast Asia,Romli et al. [8] found that more research is needed from allSoutheast Asian countries, including Indonesia, to get readyfor the management of falls in an ageing society.
Effective fall reduction programmes need to include acomprehensive fall risk assessment and targeted interven-tions [9]. “Most of these falls are associated with one ormore identifiable risk factors (e.g., weakness, unsteady gait,confusion, and certain medications), and research has shownthat attention to these risk factors can significantly reducerates of falling” [9, p.37]. Various risk factors for fall injuriesin older adults have been identified, including sociode-mographic, health status, and health behaviour variables.Sociodemographic risk factors include increasing age [5, 10–13], being female [4, 5, 14], lower socioeconomic status [14],and residing in rural areas [4, 15].
Health status risk factors for fall-related injuries amongolder adults may include nutritional risk [16], multimorbidity[4, 12, 13, 16] (including specific chronic conditions suchas hypertension [5], stroke [14, 17, 18], and diabetes [18]),low hand grip strength [19], and poor cognitive functioning[4, 14]. Other health risk factors include functional disability,
HindawiCurrent Gerontology and Geriatrics ResearchVolume 2018, Article ID 5964305, 8 pageshttps://doi.org/10.1155/2018/5964305
2 Current Gerontology and Geriatrics Research
such as limitations of Activities of Daily Living (ADL) andInstrumental Activities of Daily Living (IADL) [4, 11, 20, 21],gait problems [22], inadequate standing balance [13], visualdifficulties [14, 18], having cataracts [12], hearing problems[23, 24], urinary incontinence [13, 14, 18], and depression[4, 13]. Health risk behaviour variables associated with anincreased risk of fall injuries may include physical inactivity[5, 14, 18, 24, 25], alcohol use [15, 25], cigarette smoking [26],obesity [12, 27], and sleeping problems [4, 28].
Governments in Southeast Asian countries, such as inIndonesia, need epidemiological data on fall-related injuriesin order to successfully include falls prevention health careprogramming [4, 17]. In order to address this gap, the studyaims to assess the prevalence and health correlates of fall-related injury in a national population-based community-dwelling sample of older Indonesians who participated in theIndonesia Family Life Survey (IFLS-5) in 2014-15.
2. Methods
2.1. Sample and Procedure. Data were analysed from the“Indonesia Family Life Survey (IFLS-5)”, a continuing demo-graphic and health survey that began in 1993 and had sincefour rounds of data collection, with the fifth wave (IFLS-5) having been completed in 2015 [29]. The communitysurvey collected data on household and individual levelusing a multistage stratified sampling [29]. The samplingframe of the first survey in 1993 was based on householdsfrom 321 enumeration areas (EAs) (20 households wererandomly chosen from each urban EA and 30 householdsfrom each rural EA) in 13 out of 27 provinces that wereselected representing 83% of the Indonesian population in1993, more details in Strauss et al. [29]. At household level,several randomly selected members of the household wereasked for detailed individual information. In the IFLS-56698 individuals 50 years and older were interviewed withcomplete fall-related injury measurements. In the IFLS-5,“the dynasty recontact rate was 92% and for the individualtarget households (including split off households as separate)the recontact rate was 90.5%.” [29]. Although the survey islongitudinal, we restricted our analysis to the IFLS-5 cross-sectional survey for persons 50 years and older, being themost recent national survey available assessing fall injuries.The IFLS has been approved by ethics review boards ofRAND and University of Gadjah Mada in Indonesia [29].Informed consent was attained from all respondents prior toassessments.
2.2. Measures
2.2.1. Outcome Variable. Fall-related injurywas assessed withthe questions, “Have you fallen down in the last two years andreceived treatment?” and “How many have you fallen downand received treatment in the last two years?” [29]
2.2.2. Exposure Variables. Sociodemographic factor questionsincluded age, sex, education, and residential status. Subjectiveeconomic status was assessed the question “Please imagine a
six-step ladder where on the bottom (the first step), stand thepoorest people, and on the highest step (the sixth step), standthe richest people. Onwhich [economic] step are you today?”The answers ranged from (1) poorest to (6) richest [29].
AnthropometricMeasurements.Heights weremeasured to thenearest millimetre with a Seca plastic height board [29].Weights were taken to the nearest tenth of a kilogram using aCamry model EB1003 scale [29]. Body mass index (BMI) of30+ kg/m2 was categorized as having obesity class II, usingAsian criteria [30].
Tobacco use was assessed with two questions: (1) “Haveyou ever chewed tobacco, smoked a pipe, smoked self-enrolled cigarettes, or smoked cigarettes/cigars?” (Yes, No);(2) “Do you still have the habit or have you totally quit?” (Stillhave, Quit) [29]. Responses were grouped into never, quittersand current tobacco users.
Physical activity was assessed with an abbreviated versionof the “International Physical Activity Questionnaire (IPAQ)short version, for the last 7 days (IPAQ-S7S)” [31]. Physicalactivity was categorized according to the IPAQ scoringprotocol [32] as low, moderate, and high physical activity.
Nutrition riskwas assessedwith the question “Concerningyour food consumption, which of the following is true? 1=It isless than adequate for my needs, 2=It is just adequate for myneeds, and 3=It is more than adequate for my needs.” (Coded1=1, 2-3=0)
Chronic medical conditions were assessed with the ques-tion “Has a doctor/paramedic/nurse/midwife ever told youthat you had. . .?” (“hypertension, diabetes or high bloodsugar, heart attack, coronary heart disease, angina orother heart problems, stroke, tuberculosis, asthma, otherlung conditions, liver, cancer or malignant tumor, arthri-tis/rheumatism, uric acid/gout, and depression”) (Yes, No)[29]. All chronic medical conditions were summed up toindicate if an individual had no, one, or two or more medicalconditions
Urinary problems were measured with the question “Doyou often get up during the night to urinate?” (Yes or No)[29].
Vision and hearing problems were assessed with thequestions “Did a health care provider ever diagnose you witha vision problem, hearing problem?” “Do you/have you everhad a cataract?” (Yes or No) [29].
Functional disability was measured by ADL (5 items) andIADL (6 items) [33, 34]. ADL included the degree of havingdifficulty in performing dressing, eating, and other activities(Cronbach alpha of these five items was 0.84). Answerswere categorized as “have no difficulty; have difficulty butcan still do it; have difficulty and need help; cannot do it”.Responses were dichotomized into 1=one or more difficultiesand 0=able, no difficulty. IADL included the degree of havingdifficulty in doing household chores, such as preparingmeals and shopping (Cronbach alpha 0.91). A dichotomizedfunctional disability total score was constructed and ADL/IADL disability classified as having problems with in one ormore ADL/IADL items.
Depression symptoms were assessed with the Centres forEpidemiologic Studies Depression Scale (CES-D: 10 items), and

Current Gerontology and Geriatrics Research 3
score 15 or more was indicative severe depression symptoms[35] (Cronbach alpha 0.67).
Sleep disturbance was assessed with five items fromthe “Patient-Reported Outcomes Measurement InformationSystem (PROMIS)” sleep disturbancemeasure [36]. A sampleitem was “I had difficulty falling a asleep.” Responses rangedfrom 1=not at all to 5= very much (Cronbach’s alpha = 0.68).Sleep disturbance was defined as a score of three to five on theaveraged mean items.
Sleep related impairment was assessed with five itemsfrom the PROMIS sleep impairment measure [37]. A sampleitem was “I had a hard time concentrating because of poorsleep.” Response options ranged from 1=not at all to 5= verymuch. (Cronbach’s alpha = 0.82). Sleep related impairmentwas defined as a score of three to five on the averaged meanitems.
The balance test (full tandem stand) was conductedaccording to standardized procedures [29], coded with <10seconds or no attempt=1 and 10+ seconds=0.
Hand grip strengthwas estimated using a “Baseline Smed-ley Spring type dynamometer”, on each hand twice, begin-ning with the dominant hand, alternating hands in betweenmeasurements [29]. A maximum grip strength (kg) variablewas created from all four measurements. Weak handgrip wasclassified as <20 kg for women and <30kg for men [38].
Cognitive functioning was assessed with questions fromthe Telephone Survey of Cognitive Status (TICS) [39], whichwas administered in a face-to-face interview in this study.The TICS included awareness of the date and day of theweek and a self-reported memory question, with responseoptions of excellent, very good, good, fair, and poor.Then therespondent was asked to serially subtract 7s from 100. Thenan immediate and delayed word recall of 10 nouns was given[29]. Total scores ranged from 0-34; a score of 13 or lower wasconsidered low.
2.3. Data Analysis. Descriptive statistics were calculated todescribe the sample and occurrence of fall injuries.
Multinomial logistic regression analysis was computedto calculate the relative risk ratios (RRR) with 95% confi-dence interval (CI) to determine the associations betweensociodemographic and health variables and single fall injuryand multiple fall injuries, with no fall injury in the past twoyears as reference category. Associations between predictorvariables and multiple fall injuries (with no fall injury asreference) were evaluated calculating odds ratios (OR) usingunconditional multivariable logistic regression. All variablesstatistically significant at the p < .05 level in bivariate analyseswere included in the multivariable models. Potential mul-ticollinearity between variables was assessed with varianceinflation factors, none of which exceeded critical value. P< 0.05 was considered significant. “Cross-section analysisweights were applied to correct both for sample attritionfrom 1993 to 2014 and then to correct for the fact thatthe IFLS1 sample design included oversampling in urbanareas and off Java. The cross-section weights are matchedto the 2014 Indonesian population, again in the 13 IFLSprovinces, in order to make the attrition-adjusted IFLSsample representative of the 2014 Indonesian population in
those provinces.” [29]. Both the 95% confidence intervals andP-values were adjusted considering the survey design of thestudy. All analyses were done with STATA software version13.0 (Stata Corporation, College Station, TX, USA).
3. Results
3.1. Sample Characteristics and Prevalence Rate of Fall-RelatedInjury. The total sample included 6698 adults, 50 years andolder (median age 58.0 years, IQR=11.0, and age range of 50-101 years) in Indonesia. The proportion of women was 51.9%,72.2% had no or elementary education, 42.4% describedthemselves as having medium economic status, and 52.1%resided in urban areas. Regarding health variables, 18.0%of the participants reported nutrition risk, 7.4% measuredhaving obesity, 48.4%had onemore chronic condition, 56.2%had urinary problems, 1.3% had vision problems, 6.6% hador ever had a cataract, 3.4% had hearing problems, and24.9% had one more functional disability. Almost one in five(17%) had depression symptoms, 14.7% sleep disturbance,14.1% sleep impairment, 1.7% balance problems, 29.3% lowcognitive functioning, and 61.5% weak hand grip strength.
Overall, 12.8% had one or more fall-related injuries in thepast two years, 14.0% among women and 11.5% among men;7.6% had a single fall and 5.2%multiple fall-related injuries inthe past two years (see Table 1).
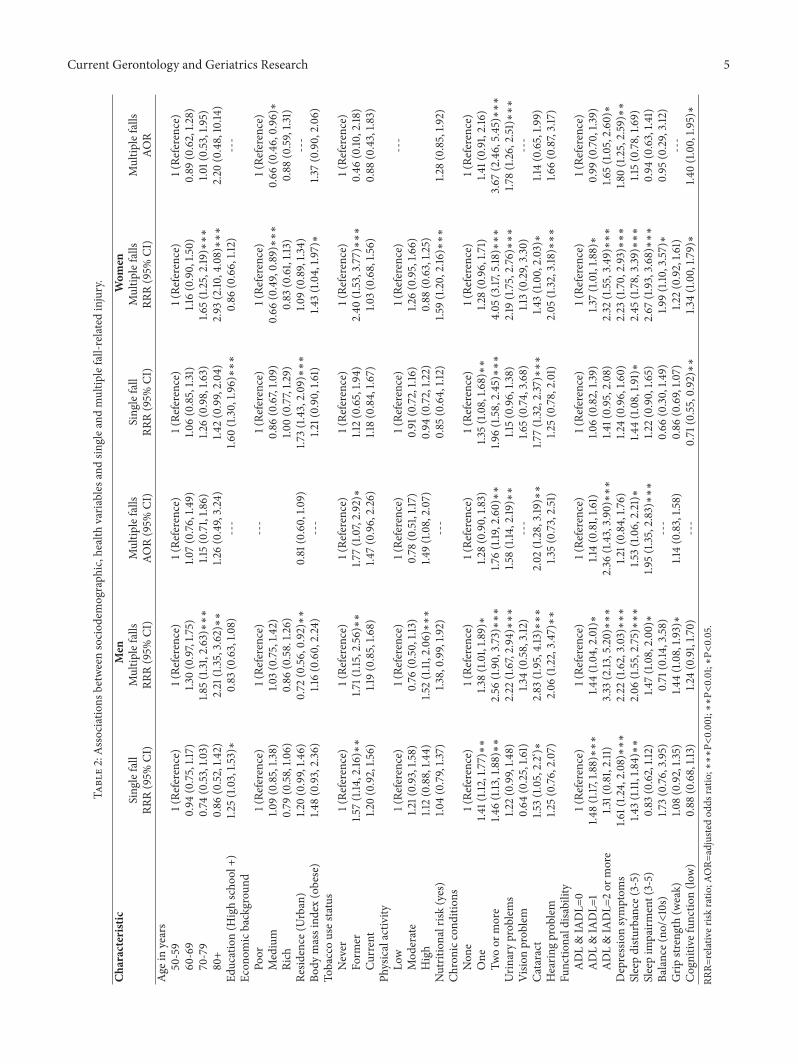
3.2. Associations with Fall-Related Injury. In adjusted analysisamong both men and women, having two or more chronicconditions, urinary problems, and functional disability wasassociated with multiple fall-related injuries in the past twoyears. In addition, among men, former tobacco use, havingor having had a cataract, sleep disturbance, and sleep impair-ment and, among women, poorer economic background,depression symptoms, and low cognitive functioning wereassociated with multiple fall-related injuries in the past twoyears (see Table 2).
4. Discussion
The study aimed to investigate the prevalence and healthcorrelates of fall-related injury in a national sample of olderIndonesians in 2014-15. A significant proportion of olderadults in Indonesia had had a single and multiple fall-relatedinjury, probably similar to previous studies in the region, e.g.,China, India [4], Singapore [5], and Thailand [6]. Increasingage is a significant risk factor for fall-related injuries [5, 10–13]. In our study of adults 50 years and older, in unadjustedanalysis, older age was not associated with a single fall injurybut with multiple falls injury in the past two years, while theeffect of older age disappeared in the fully adjusted modelsfor both sexes. Possible reasons for this are under-reportingof fall injuries in the older age groups; only 5.5% of our samplewas 80 years and older, due to higher fall-related mortality inthe older age groups [4].
In agreement with previous studies [4, 5, 14], this studyfound that women were more likely than men to have anyfall-related injury, in particular multiple falls. This gender

4 Current Gerontology and Geriatrics Research
Table 1: Sample characteristics.
Characteristic Sample No Falls Single fall Multiple falls P-Value% % % %
All 6698 5897 (87.2) 502 (7.6) 299 (5.2)Sex
Male 3145 (48.1) 2786 (88.5) 233 (7.3) 126 (4.3) <0.001Female 3553 (51.9) 3111 (86.0) 269 (7.9) 173 (6.1)
Age in years50-59 3772 (52.6) 3325 (88.2) 289 (7.6) 158 (4.2) <0.00160-69 1964 (27.9) 1725 (87.4) 143 (7.5) 96 (5.1)70-79 820 (14.0) 721 (85.3) 62 (7.6) 37 (7.2)80+ 142 (5.5) 126 (81.1) 8 (8.2) 8 (10.7)
Education (High school +) 2087 (27.8) 1811 (86.4) 194 (9.3) 82 (4.3) <0.001Economic background
Poor 2070 (31.0) 1808 (87.4) 153 (7.6) 109 (5.0) 0.347Medium 2842 (42.4) 2511 (88.4) 215 (7.5) 116 (4.1)Rich 1786 (26.7) 1578 (88.6) 134 (7.0) 74 (4.3)
Residence (Urban) 3738 (52.1) 3260 (86.2) 316 (8.9) 162 (4.9) <0.001Body mass index (obese) 526 (7.4) 443 (84.1) 52 (9.2) 31 (6.7) 0.003Tobacco use status
Never 3895 (56.9) 3430 (87.0) 289 (7.5) 176 (5.5) <0.001Former 634 (9.8) 546 (84.3) 54 (8.9) 34 (6.8)Current 2169 (33.3) 1921 (88.3) 159 (7.3) 89 (4.3)
Physical activityLow 3079 (44.3) 2713 (88.5) 234 (7.3) 132 (4.2) 0.663Moderate 1880 (27.7) 1656 (88.0) 139 (7.6) 85 (4.4)High 1739 (28.1) 1528 (87.7) 129 (7.4) 82 (4.9)
Nutritional risk (yes) 1259 (18.0) 1100 (87.0) 86 (6.9) 73 (6.1) <0.001Chronic conditions
None 3451 (51.6) 3132 (90.3) 212 (6.3) 107 (3.4) <0.001One 1834 (27.4) 1620 (87.2) 143 (8.4) 71 (4.4)Two or more 1413 (21.0) 1145 (79.6) 147 (9.8) 121 (10.6)
Urinary problems 3775 (56.2) 3262 (85.3) 297 (8.0) 216 (6.8) <0.001Vision problem 75 (1.3) 65 (86.2) 6 (7.5) 4 (6.3) 0.828Cataract 451 (6.6) 367 (79.9) 46 (11.3) 38 (8.8) <0.001Hearing problem 218 (3.4) 182 (81.5) 16 (8.8) 20 (9.7) <0.001Functional disability
ADL & IADL=0 4955 (75.1) 4423 (89.1) 344 (7.0) 188 (3.9) <0.001ADL & IADL=1 1315 (19.5) 1125 (86.2) 119 (8.6) 71 (5.2)ADL & IADL=2 or more 428 (5.5) 349 (81.5) 39 (8.7) 40 (9.8)
Depression symptoms 1166 (17.0) 966 82.9 109 9.2 91 7.8 <0.001Sleep disturbance (3-5) 1050 (14.7) 864 (82.6) 101 (9.4) 85 (8.0) <0.001Sleep impairment (3-5) 974 (14.1) 839 (85.5) 70 (7.1) 65 (7.4) <0.001Balance (no/<10s) 79 (1.7) 69 (85.0) 6 (7.0) 4 (8.0) 0.082Cognitive function (low) 1794 (29.3) 1558 (88.0) 129 (6.5) 107 (5.5) <0.001Grip strength (weak) 4027 (61.5) 3546 (87.9) 290 (7.5) 190 (5.0) <0.015
disparitymay be due to differences in higher levels of physicalactivity, muscle strength, bone density, and fatal fall ratesin men than in women [40]. Although some studies foundan association between lower socioeconomic status [14] andresiding in rural areas [4, 15], this study only found an
association between lower economic status and multiple fallinjuries in women. It is possible that women with a lowereconomic status have more inadequate housing and otherenvironments more prone for fall injuries to happen [8]. Aprevious study [16] found an association between nutritional
Current Gerontology and Geriatrics Research 5
Table2:As
sociations
betweensociod
emograph
ic,health
varia
bles
andsin
glea
ndmultip
lefall-related
injury.
Characteristic
Men
Wom
enSing
lefall
Multip
lefalls
Multip
lefalls
Sing
lefall
Multip
lefalls
Multip
lefalls
RRR(95%
CI)
RRR(95%
CI)
AOR(95%
CI)
RRR(95%
CI)
RRR(95%
CI)
AOR
Age
inyears
50-59
1(Re
ference)
1(Re
ference)
1(Re
ference)
1(Re
ference)
1(Re
ference)
1(Re
ference)
60-69
0.94
(0.75,1.17)
1.30(0.97,1.7
5)1.0
7(0.76
,1.49)
1.06(0.85,1.3
1)1.16(0.90,1.5
0)0.89
(0.62,1.2
8)70-79
0.74
(0.53
,1.03)
1.85(1.31
,2.63)∗∗∗
1.15(0.71,1.8
6)1.2
6(0.98,1.6
3)1.6
5(1.25,2.19)∗∗∗
1.01(0.53,1.95)
80+
0.86
(0.52
,1.42)
2.21
(1.35,3.62)∗∗
1.26(0.49,3.24)
1.42(0.99,2.04)
2.93
(2.10
,4.08)∗∗∗
2.20
(0.48,10.14
)Ed
ucation(H
ighscho
ol+)
1.25(1.03,1.5
3)∗
0.83
(0.63,1.0
8)---
1.60(1.30,1.9
6)∗∗∗
0.86
(0.66,1.12)
---
Econ
omicbackgrou
ndPo
or1(Re
ference)
1(Re
ference)
---
1(Re
ference)
1(Re
ference)
1(Re
ference)
Medium
1.09(0.85,1.3
8)1.0
3(0.75,1.4
2)0.86
(0.67,1.0
9)0.66
(0.49,0.89)∗∗∗
0.66
(0.46,0.96)∗
Rich
0.79
(0.58,1.0
6)0.86
(0.58.1.2
6)1.0
0(0.77,1.2
9)0.83
(0.61,1.13)
0.88
(0.59,1.3
1)Re
sidence
(Urban)
1.20(0.99,1.4
6)0.72
(0.56,0.92)∗∗
0.81
(0.60,1.0
9)1.7
3(1.43,2.09)∗∗∗
1.09(0.89,1.3
4)---
Body
massind
ex(obese)
1.48(0.93,2.36)
1.16(0.60,2.24)
---
1.21(0.90,1.61)
1.43(1.04,1.9
7)∗
1.37(0.90,2.06)
Tobaccouses
tatus
Never
1(Re
ference)
1(Re
ference)
1(Re
ference)
1(Re
ference)
1(Re
ference)
1(Re
ference)
Form
er1.5
7(1.14
,2.16
)∗∗
1.71(1.15,2.56)∗∗
1.77(1.07,2.92)∗
1.12(0.65,1.9
4)2.40
(1.53
,3.77)∗∗∗
0.46
(0.10
,2.18
)Cu
rrent
1.20(0.92,1.5
6)1.19(0.85,1.6
8)1.4
7(0.96,2.26)
1.18(0.84,1.6
7)1.0
3(0.68,1.5
6)0.88
(0.43,1.8
3)Ph
ysicalactiv
ityLo
w1(Re
ference)
1(Re
ference)
1(Re
ference)
1(Re
ference)
1(Re
ference)
---
Mod
erate
1.21(0.93,1.58)
0.76
(0.50,1.13)
0.78
(0.51,1.17)
0.91
(0.72,1.16)
1.26(0.95,1.6
6)High
1.12(0.88,1.4
4)1.5
2(1.11,2.06)∗∗∗
1.49(1.08,2.07)
0.94
(0.72,1.2
2)0.88
(0.63,1.2
5)Nutritionalrisk
(yes)
1.04(0.79,1.3
7)1.3
8,0.99,1.92)
---
0.85
(0.64,1.12)
1.59(1.20,2.16)∗∗∗
1.28(0.85,1.9
2)Ch
ronicc
onditio
nsNon
e1(Re
ference)
1(Re
ference)
1(Re
ference)
1(Re
ference)
1(Re
ference)
1(Re
ference)
One
1.41(1.12,1.7
7)∗∗
1.38(1.01,1.8
9)∗
1.28(0.90,1.8
3)1.3
5(1.08,1.6
8)∗∗
1.28(0.96,1.7
1)1.4
1(0.91,2.16
)Tw
oor
more
1.46(1.13
,1.88)∗∗
2.56
(1.90,3.73)∗∗∗
1.76(1.19
,2.60)∗∗
1.96(1.58,2.45)∗∗∗
4.05
(3.17,5.18
)∗∗∗
3.67
(2.46,5.45)∗∗∗
Urin
aryprob
lems
1.22(0.99,1.4
8)2.22
(1.67,2.94)∗∗∗
1.58(1.14
,2.19
)∗∗
1.15(0.96,1.3
8)2.19
(1.75,2.76)∗∗∗
1.78(1.26,2.51)∗∗∗
Visio
nprob
lem
0.64
(0.25,1.6
1)1.3
4(0.58,3.12)
---
1.65(0.74
,3.68)
1.13(0.29,3.30)
---
Cataract
1.53(1.05,2.2‘)∗
2.83
(1.95,4.13)∗∗∗
2.02
(1.28,3.19)∗∗
1.77(1.32
,2.37
)∗∗∗
1.43(1.00,2.03)∗
1.14(0.65,1.9
9)Hearin
gprob
lem
1.25(0.76
,2.07)
2.06
(1.22,3.47)∗∗
1.35(0.73,2.51)
1.25(0.78,2.01)
2.05
(1.32
,3.18
)∗∗∗
1.66(0.87,3.17)
Functio
nald
isability
ADL&IADL=
01(Re
ference)
1(Re
ference)
1(Re
ference)
1(Re
ference)
1(Re
ference)
1(Re
ference)
ADL&IADL=
11.4
8(1.17,1.88)∗∗∗
1.44(1.04,2.01)∗
1.14(0.81,1.6
1)1.0
6(0.82,1.3
9)1.3
7(1.01,1.8
8)∗
0.99
(0.70,1.3
9)ADL&IADL=
2or
more
1.31(0.81,2.11)
3.33
(2.13
,5.20)∗∗∗
2.36
(1.43,3.90)∗∗∗
1.41(0.95,2.08)
2.32
(1.55,3.49)∗∗∗
1.65(1.05,2.60)∗
Depressionsymptom
s1.6
1(1.2
4,2.08)∗∗∗
2.22
(1.62,3.03)∗∗∗
1.21(0.84,1.76
)1.2
4(0.96,1.6
0)2.23
(1.70,2.93)∗∗∗
1.80(1.25,2.59)∗∗
Sleepdistu
rbance
(3-5)
1.43(1.11,1.84)∗∗
2.06
(1.55,2.75)∗∗∗
1.53(1.06,2.21)∗
1.44(1.08,1.9
1)∗
2.45
(1.78,3.39)∗∗∗
1.15(0.78,1.6
9)Sleepim
pairm
ent(3-5)
0.83
(0.62,1.12)
1.47(1.08,2.00)∗
1.95(1.35,2.83)∗∗∗
1.22(0.90,1.6
5)2.67
(1.93,3.68)∗∗∗
0.94
(0.63,1.4
1)Ba
lance(no
/<10s)
1.73(0.76
,3.95)
0.71
(0.14
,3.58)
---
0.66
(0.30,1.4
9)1.9
9(1.10
,3.57)∗
0.95
(0.29,3.12)
Grip
strength(w
eak)
1.08(0.92,1.3
5)1.4
4(1.08,1.9
3)∗
1.14(0.83,1.5
8)0.86
(0.69,1.0
7)1.2
2(0.92,1.6
1)---
Cognitiv
efun
ction(lo
w)
0.88
(0.68,1.13)
1.24(0.91,1.7
0)---
0.71
(0.55,0.92)∗∗
1.34(1.00,1.7
9)∗
1.40(1.00,1.9
5)∗
RRR=
relativer
iskratio
;AOR=
adjuste
dod
dsratio
;∗∗∗P<
0.001;∗∗P<
0.01;∗
P<0.05.

6 Current Gerontology and Geriatrics Research
risk and fall injury, while this study only found such anassociation in bivariate analysis in women. It is possible thatthe single item measure of nutrition risk was imprecise.
Previous studies [13, 19] found evidence that deficits inbalance and in hand grip strength are risk factors for fallsamong older adults, while in this study only in crude analysisweak grip strength was associated with multiple fall injuriesin men and balance problems in women. Moreland et al. [41]found in a systematic review of prospective cohort studiesamong older adults 65 years and above muscle strength,especially lower extremity muscles, was a significant riskfactor for falls. Future studies should assess lower extremitymuscles [13].
In agreement with previous evidence [4, 11–13, 16, 20, 21],this study found a dose-response relationship between thenumber of chronic conditions, functional disabilities, andfall-related injury. Having an increasing number of chronicconditions may negatively impact on one’s mobility con-tributing to a higher fall risk. Urinary incontinence is aknown risk factor for fall injury [13, 14, 18, 42], and we alsofound an association between urinary problems andmultiplefalls. Our measure of urinary problems consisted only of oneitem and the response option yes or no. This did not allowassessing the severity and type of urinary problems and haveled to the overly high prevalence rate. Future studies shouldassess urge urinary incontinence, which was found in asystematic review to be associated with falls [42]. It is possiblethat urge urinary incontinence may lead to a loss of balancewhen rushing to the toilet or else urinary incontinence is amaker of frailty that is associated with higher fall risk [43].
Visual difficulties [14, 18], having cataracts [12], and hear-ing problems [23, 24] have previously been found risk factorsfor falls, while in this study only having cataracts was asso-ciated with multiple falls among men, and hearing problemswere only significant in bivariate analysis in both sexes.Visionproblems and/or having cataracts may increase the risk forfalling because of obstacle avoidance based on diminishedperception of spatial relationships and distances [16, 44].
Poor cognitive functioning has been found a risk factorfor falls [4, 14], while in this study this was only found amongwomen. Sleep problems and depression may be common inolder people and there is evidence of an increased fall risk [4,13, 28]. This study found that among men sleep disturbanceand sleep impairment and among women depression symp-toms were associated with single and multiple falls. Someresearchers [45, 46] argue that “functional decline, history offalls, and cognitive impairment have been separately linkedto both depression and fall.”
While most studies [5, 14, 18, 24, 25] found a protectiveeffect of physical activity or exercise from fall injuries, thisstudy found among men that high physical activity wasassociatedwith an increased risk ofmultiple falls.Thismay bepartially explained “by reported changes in postural controlamong older men following lower or moderate physicalactivity that may be related to fatigue levels [43].”
Although obesity has been found a risk for falls insome studies in high income countries [12, 27], this studyonly found such an association in bivariate analysis amongwomen. Some studies found an association between tobacco
use and falls risk [26], while in this study an associationbetween former tobacco use and falls was found amongmen.It is possible that former tobacco users had stopped the habitbecause of chronic diseases and increasing functional decline,which may explain why this group is at greater risk for fallinjuries.
5. Limitations of the Study
This study had several limitations. The self-reported assess-ment of most study measures may have its limitations. Recallbias of two years fall injury and survivor bias may limit therobustness of the findings. Furthermore, this study was basedon cross-sectional data, and we can therefore not ascribecausality to any of the associated factors in the study. Circum-stances of falls and consequences in terms of type of injurywere not assessed and should be assessed in future studies.
6. Conclusions
This study showed that a significant proportion of older adultsin a national population-based survey in Indonesia had fall-related injuries in the past two years. Several homogenousbetween the sexes (multimorbidity, functional disability,and urinary problems) and sex-specific risk factors (sleepdisturbance, sleep impairment, having cataracts and formertobacco use in men and depression and poor cognitivefunctioning in women) for fall-related injury were identifiedthat can help in designing fall-prevention strategies.
Data Availability
The data underlying this study belong to the IndonesiaFamily Life Survey and are accessible via the RAND websitehttp://www.rand.org/labor/FLS/IFLS.html. The authors didnot have special access privilege.
Additional Points
Policy Impact. Fall-related injuries were found to affect a sig-nificant proportion of adults 50 years and older in Indonesia.This representative community-based survey identified mul-tiple risk factors that increase the likelihood of individualshaving a single or multiple falls. Practice Impact. Agenciesfocusing on community-based fall prevention programmesshould practice an integrated approach taking into accountseveral homogenous between the sexes and sex-specific riskfactors for fall-related injury.
Conflicts of Interest
The authors declare that they have no conflicts of interest.
Acknowledgments
The research was conducted based on the IFLS-5 carried outby RAND (http://www.rand.org/labor/FLS/IFLS.html). Theauthors thank RAND for granting access to the survey dataand the study participants who provided the survey data.

Current Gerontology and Geriatrics Research 7
References
[1] Global Burden of Disease Study 2013 Collaborators, “Global,regional, and national incidence, prevalence, and years livedwith disability for 301 acute and chronic diseases and injuriesin 188 countries, 1990-2013: a systematic analysis for the GlobalBurden of Disease Study 2013,” Lancet, vol. 386, pp. 743–800.,2015.
[2] World Health Organization, WHO global report on falls pre-vention in older age, World Health Organization, Geneva,Switzerland, 2008.
[3] J. Jiang, J. Long, W. Ling, G. Huang, X. Guo, and L.Su, “Incidence of old people in mainland China,” Archivesof Gerontology and Geriatrics, vol. 61, no. 2, pp. 10–1016,10.1016/j.archger.2015.06.003.
[4] J. Stewart Williams, P. Kowal, H. Hestekin et al., “Prevalence,risk factors and disability associated with fall-related injury inolder adults in low- and middle-incomecountries: results fromthe WHO Study on global AGEing and adult health (SAGE),”BMCMedicine, vol. 13, no. 1, 2015.
[5] K. M. Chan, W. S. Pang, C. H. Ee, Y. Y. Ding, and P. Choo,“Epidemiology of Falls among the Elderly CommunityDwellersin Singapore,” SingaporeMedical Journal, vol. 38, no. 10, pp. 427–431, 1997.
[6] S. Jitapunkul, M. N. Songkhla, N. Chayovan et al., “Falls andtheir associated factors: a national survey of the Thai elderly.,”Journal of the Medical Association of Thailand = ChotmaihetThangphaet, vol. 81, no. 4, pp. 233–242, 1998.
[7] U. Y. Yeong, S. Y. Tan, J. F. Yap, and W. Y. Choo, “Prevalenceof falls among community-dwelling elderly and its associatedfactors: A cross-sectional study in Perak, Malaysia,” MalaysianFamily Physician, vol. 11, no. 1, pp. 7–14, 2016.
[8] M. H. Romli, M. P. Tan, L. Mackenzie, M. Lovarini, P. Suttanon,and L. Clemson, “Falls amongst older people in Southeast Asia:a scoping review,” Public Health, vol. 145, pp. 96–112, 2017.
[9] L. Z. Rubenstein, “Falls in older people: epidemiology, riskfactors and strategies for prevention,” Age and Ageing, vol. 35,supplement 2, pp. ii37–ii41, 2006.
[10] S. A.D’souza, A. Shringarpure, and J. Karol, “Circumstances andconsequences of falls in Indian older adults,” Indian Journal ofOccupational Therapy, vol. 40, no. 1, pp. 3–11, 2008.
[11] J. S. Schiller, E. A. Kramarow, and A. N. Dey, “Fall injuryepisodes among noninstitutionalized older adults: UnitedStates, 2001-2003.,” Advance Data Reports, no. 392, pp. 1–16,2007.
[12] R. J. Mitchell, W. L. Watson, A. Milat, A. Z. Chung, and S. Lord,“Health and lifestyle risk factors for falls in a large population-based sample of older people in Australia,” Journal of SafetyResearch, vol. 45, pp. 7–13, 2013.
[13] C. R. Gale, C. Cooper, and A. Aihie Sayer, “Prevalence andrisk factors for falls in older men and women: The EnglishLongitudinal Study of Ageing,” Age and Ageing, vol. 45, no. 6,pp. 789–794, 2016.
[14] D. Zhang, Y. He, M. Liu et al., “Study on incidence andrisk factors of the elderly in a rural community in Beijing,”Zhonghua Liu Xing Bing Xue Za Zhi, vol. 37, no. 5, pp. 624–628,2016.
[15] P. Raina, N. Sohel, M. Oremus et al., “Assessing global risk fac-tors for non-fatal injuries from road traffic accidents and falls inadults aged 35–70 years in 17 countries: a cross-sectional anal-ysis of the Prospective Urban Rural Epidemiological (PURE)study,” Injury Prevention, vol. 22, no. 2, pp. 92–98, 2016.
[16] M. T. Chang, “Risk factors for falls among seniors: implicationsof gender,” American Journal of Epidemiology, vol. 181, no. 7, pp.521-31, 2015.
[17] S. Tuminah, W. Riyadina, and AN. Sapardin, “Women andstroke patients are more at risk for fall-related injury amongolder persons,” in Universa Med, vol. 35, p. 10e8, 2016.
[18] C. Mancini, D. Williamson, N. Binkin, and F. Michieletto, “DeGiacomi GV; di Lavoro Studio Argento. Epidemiology of fallsamong the elderly,” Ig Sanita Pubbl, vol. 61, no. 2, pp. 117-32,2005.
[19] P. A. Stalenhoef, J. P. M. Diederiks, J. A. Knottnerus, A. D.M. Kester, and H. F. J. M. Crebolder, “A risk model for theprediction of recurrent falls in community-dwelling elderly: aprospective cohort study,” Journal of Clinical Epidemiology, vol.55, no. 11, pp. 1088–1094, 2002.
[20] T. Yamashita, D. A. Noe, andA. J. Bailer, “Risk Factors of Falls inCommunity-Dwelling Older Adults: Logistic Regression TreeAnalysis,”The Gerontologist, vol. 52, no. 6, pp. 822–832, 2012.
[21] C. Lukaszyk, K. Radford, K. Delbaere et al., “Risk factors forfalls among older Aboriginal and Torres Strait Islander peoplein urban and regional communities,” Australasian Journal onAgeing.
[22] P. A. Stalenhoef, J. P. M. Diederiks, L. P. De Witte, K. H.Schiricke, and H. F. J. M. Crebolder, “Impact of gait problemsand falls on functioning in independent living persons of 55years and over: A community survey,” Patient Education andCounseling, vol. 36, no. 1, pp. 23–31, 1999.
[23] L. Walther, J. Kleeberg, G. Rejmanowski et al., “Sturze undSturzrisikofaktoren,” HNO, vol. 60, no. 5, pp. 446–456, 2012.
[24] C. Lukaszyk, L. Harvey, C. Sherrington et al., “Risk factors,incidence, consequences and prevention strategies for falls andfall-injury within older indigenous populations: a systematicreview,” Australian and New Zealand Journal of Public Health,vol. 40, no. 6, pp. 564–568, 2016.
[25] M. T. Do, V. C. Chang, N. Kuran, and W. Thompson, “Fall-related injuries amongCanadian seniors, 2005–2013: an analysisof the Canadian Community Health Survey,”Health Promotionand Chronic Disease Prevention in Canada, vol. 35, no. 7, pp. 99–108, 2015.
[26] W. Li, T.H.M.Keegan, B. Sternfeld, S. Sidney, C. P.QuesenberryJr., and J. L. Kelsey, “Outdoor falls amongmiddle-aged and olderadults: a neglected public health problem,” American Journal ofPublic Health, vol. 96, no. 7, pp. 1192–1200, 2006.
[27] J. Ren, A. Waclawczyk, D. Hartfield et al., “Analysis of FallInjuries by BodyMass Index,” SouthernMedical Journal, vol. 107,no. 5, pp. 294–300, 2014.
[28] G. S. Brassington, A. C. King, andD. L. Bliwise, “Sleep problemsas a risk factor for falls in a sample of community-dwellingadults aged 64–99 years,” Journal of the American GeriatricsSociety, vol. 48, no. 10, pp. 1234–1240, 2000.
[29] J. Strauss, F. Witoelar, and B. Sikoki, The Fifth Wave of theIndonesia Family Life Survey (IFLS5): Overview and FieldReport, vol. 1, RAND Corporation, 2016.
[30] C. P. Wen, T. Y. David Cheng, S. P. Tsai et al., “Are Asians atgreater mortality risks for being overweight than Caucasians?Redefining obesity for Asians,” Public Health Nutrition, vol. 12,no. 4, pp. 497–506, 2009.
[31] C. L. Craig, A. L. Marshall, and M. Sjostrom, “Internationalphysical activity questionnaire: 12-country reliability and valid-ity,” Medicine & Science in Sports & Exercise, vol. 35, no. 8, pp.1381–1395, 2003.
8 Current Gerontology and Geriatrics Research
[32] International Physical Activity Questionnaire (IPAQ), “IPAQScoring Protocol,” https://sites.google.com/site/theipaq/.
[33] S. Katz, A. B. Ford, R. W. Moskowitz, B. A. Jackson, and M.W. Jaffe, “Studies of illness in the aged. the index of adl: astandardized measure of biological and psychosocial function,”Journal of the American Medical Association, vol. 185, pp. 914–919, 1963.
[34] M. P. Lawton and E. M. Brody, “Assessment of older people:self-maintaining and instrumental activities of daily living,”TheGerontologist, vol. 9, no. 3, pp. 179–186, 1969.
[35] E. M. Andresen, J. A. Malmgren,W. B. Carter, and D. L. Patrick,“Screening for depression in well older adults: evaluation ofa short form of the CES-D (Center for Epidemiologic StudiesDepression Scale),” American Journal of Preventive Medicine,vol. 10, no. 2, pp. 77–84, 1994.
[36] L. Yu, D. J. Buysse, A. Germain et al., “Development of shortforms from the PROMIS sleep disturbance and Sleep-RelatedImpairment item banks,” Behavioral Sleep Medicine, vol. 10, no.1, pp. 6–24, 2011.
[37] D. J. Buysse, L. Yu, D. E. Moul et al., “Development andvalidation of patient-reported outcome measures for sleepdisturbance and sleep-related impairments,” SLEEP, vol. 33, no.6, pp. 781–792, 2010.
[38] A. J. Cruz-Jentoft, J. P. Baeyens, J. M. Bauer et al., “Sarcopenia:European consensus on definition and diagnosis,” Age andAgeing, vol. 39, no. 4, Article ID afq034, pp. 412–423, 2010.
[39] A. R. Herzog and R. B. Wallace, “Measures of CognitiveFunctioning in the AHEAD Study,”The Journals of GerontologySeries B: Psychological Sciences and Social Sciences, vol. 52B, no.Special, pp. 37–48, 1997.
[40] J. A. Stevens and E. D. Sogolow, “Gender differences for non-fatal unintentional fall related injuries among older adults,”Injury Prevention, vol. 11, no. 2, pp. 115–119, 2005.
[41] J. D. Moreland, J. A. Richardson, C. H. Goldsmith, and C. M.Clase, “Muscle weakness and falls in older adults: a systematicreview and meta-analysis,” Journal of the American GeriatricsSociety, vol. 52, no. 7, pp. 1121–1129, 2004.
[42] P. E. Chiarelli, L. A. Mackenzie, and P. G. Osmotherly, “Urinaryincontinence is associated with an increase in falls: a systematicreview,” Australian Journal of Physiotherapy, vol. 55, no. 2, pp.89–95, 2009.
[43] C. H. Orces, “Prevalence and determinants of falls amongolder adults in Ecuador: an analysis of the SABE I survey,”Current Gerontology and Geriatrics Research, vol. 2013, ArticleID 495468, 7 pages, 2013.
[44] S. R. Lord, S. T. Smith, and J. C. Menant, “Vision and Falls inOlder People: Risk Factors and Intervention Strategies,” Clinicsin Geriatric Medicine, vol. 26, no. 4, pp. 569–581, 2010.
[45] A. Iaboni and A. J. Flint, “The complex interplay of depressionand falls in older adults: A clinical review,”TheAmerican Journalof Geriatric Psychiatry, vol. 21, no. 5, pp. 484–492, 2013.
[46] A. Biderman, J. Cwikel, A. V. Fried, and D. Galinsky, “Depres-sion and falls among community dwelling elderly people: asearch for common risk factors,” Journal of Epidemiology andCommunity Health, vol. 56, no. 8, pp. 631–636, 2002.

Stem Cells International
Hindawiwww.hindawi.com Volume 2018
Hindawiwww.hindawi.com Volume 2018
MEDIATORSINFLAMMATION
of
EndocrinologyInternational Journal of
Hindawiwww.hindawi.com Volume 2018
Hindawiwww.hindawi.com Volume 2018
Disease Markers
Hindawiwww.hindawi.com Volume 2018
BioMed Research International
OncologyJournal of
Hindawiwww.hindawi.com Volume 2013
Hindawiwww.hindawi.com Volume 2018
Oxidative Medicine and Cellular Longevity
Hindawiwww.hindawi.com Volume 2018
PPAR Research
Hindawi Publishing Corporation http://www.hindawi.com Volume 2013Hindawiwww.hindawi.com
The Scientific World Journal
Volume 2018
Immunology ResearchHindawiwww.hindawi.com Volume 2018
Journal of
ObesityJournal of
Hindawiwww.hindawi.com Volume 2018
Hindawiwww.hindawi.com Volume 2018
Computational and Mathematical Methods in Medicine
Hindawiwww.hindawi.com Volume 2018
Behavioural Neurology
OphthalmologyJournal of
Hindawiwww.hindawi.com Volume 2018
Diabetes ResearchJournal of
Hindawiwww.hindawi.com Volume 2018
Hindawiwww.hindawi.com Volume 2018
Research and TreatmentAIDS
Hindawiwww.hindawi.com Volume 2018
Gastroenterology Research and Practice
Hindawiwww.hindawi.com Volume 2018
Parkinson’s Disease
Evidence-Based Complementary andAlternative Medicine
Volume 2018Hindawiwww.hindawi.com
Submit your manuscripts atwww.hindawi.com