Prevalence and Proportionality of English Language ...
107
St. Cloud State University theRepository at St. Cloud State Culminating Projects in Communication Sciences and Disorders Department of Communication Sciences and Disorders 5-2016 Prevalence and Proportionality of English Language Learners in Minnesota Special Education Hanna M. Zerfas St. Cloud State University, [email protected] Follow this and additional works at: hps://repository.stcloudstate.edu/csd_etds is esis is brought to you for free and open access by the Department of Communication Sciences and Disorders at theRepository at St. Cloud State. It has been accepted for inclusion in Culminating Projects in Communication Sciences and Disorders by an authorized administrator of theRepository at St. Cloud State. For more information, please contact [email protected]. Recommended Citation Zerfas, Hanna M., "Prevalence and Proportionality of English Language Learners in Minnesota Special Education" (2016). Culminating Projects in Communication Sciences and Disorders. 1. hps://repository.stcloudstate.edu/csd_etds/1
Transcript of Prevalence and Proportionality of English Language ...

St. Cloud State UniversitytheRepository at St. Cloud StateCulminating Projects in Communication Sciencesand Disorders
Department of Communication Sciences andDisorders
5-2016
Prevalence and Proportionality of EnglishLanguage Learners in Minnesota Special EducationHanna M. ZerfasSt. Cloud State University, [email protected]
Follow this and additional works at: https://repository.stcloudstate.edu/csd_etds
This Thesis is brought to you for free and open access by the Department of Communication Sciences and Disorders at theRepository at St. CloudState. It has been accepted for inclusion in Culminating Projects in Communication Sciences and Disorders by an authorized administrator oftheRepository at St. Cloud State. For more information, please contact [email protected].
Recommended CitationZerfas, Hanna M., "Prevalence and Proportionality of English Language Learners in Minnesota Special Education" (2016).Culminating Projects in Communication Sciences and Disorders. 1.https://repository.stcloudstate.edu/csd_etds/1

Prevalence and Proportionality of English Language Learners in Minnesota Special Education
by
Hanna M. Zerfas
A Thesis
Submitted to the Graduate Faculty of
St. Cloud State University
in Partial Fulfillment of the Requirements
for the Degree
Master of Science
Communication Sciences and Disorders
May, 2015
Thesis Committee: Dr. Theresa Estrem, Chairperson
Dr. Rebecca Crowell Dr. Kathryn Johnson

2
Abstract
Disproportionality of services to some groups of students in special education is a national problem in the United States due to the risk that students are missed for important intervention services, or students are being pulled from the general education curriculum when they are not in need of extra services. This study consisted of a statistical analysis of the Minnesota Automated Recording Student System data set to determine the extent of disproportionality amongst English-, Spanish-, Hmong-, Somali-, and “Other”- speaking students in each of the 14 special education categorical labels over the academic years 2006-07, 2009-10, and 2012-13. Prevalence rates, percentage change, risk ratios, analysis of variance, and Tukey’s Honest Significant Difference Test were used to determine if differences existed between home language groups in each special education category. Results indicate that, overall, English Language Learning (ELL) students in Minnesota were at risk for underrepresentation compared to English Primary Language students in special education, although there were also instances of overrepresentation in some special education categories for some language groups. There were significant differences in enrollment in 9 of the 14 special education categories (Specific Learning Disability (SLD), Speech-Language Impairment (SLI), Emotional Behavioral Disorder, Other Health Impairment, Developmental Delay, Autism Spectrum Disorder (ASD), Developmental Cognitive Delay Mild, Deaf/Hard of Hearing (D/HH), and Deaf-Blind), with over- and underrepresentation related to interactions between language groups and special education categories. Because SLD, SLI, ASD, and D/HH are special education categories in which students are frequently served by speech-language pathologists (SLPs), these categories were further examined to determine which home language groups in particular were significantly different. The results of this research has implications for special education professionals, education policy makers, and SLPs when serving students from culturally and linguistically diverse backgrounds. More research is needed to determine why disproportionality exists between language groups, if special education enrollment is beneficial for ELL students, and to determine prevalence rates of language groups in other states and within Minnesota school districts.

3
Acknowledgments
I would like to thank Randy Kolb and Dustin Revermann from the St. Cloud State University Statistical Consulting and Research Center for the time and effort they put into this large-scale analysis. I would also like to thank the American Speech-Language and Hearing Association and the Minnesota Speech-Language and Hearing Association for allowing me to present this study to other professionals in the field of Communication Sciences and Disorders, and St. Cloud State University for providing funding to attend those conferences. I am also very thankful for the guidance, hard work, and continuous optimism my thesis advisor, Dr. Estrem, has put into this project, and the valuable input I received from Drs. Crowell and Johnson to make this project a success. Key Words: English Language Learners, Special Education, Prevalence and Proportionality
4
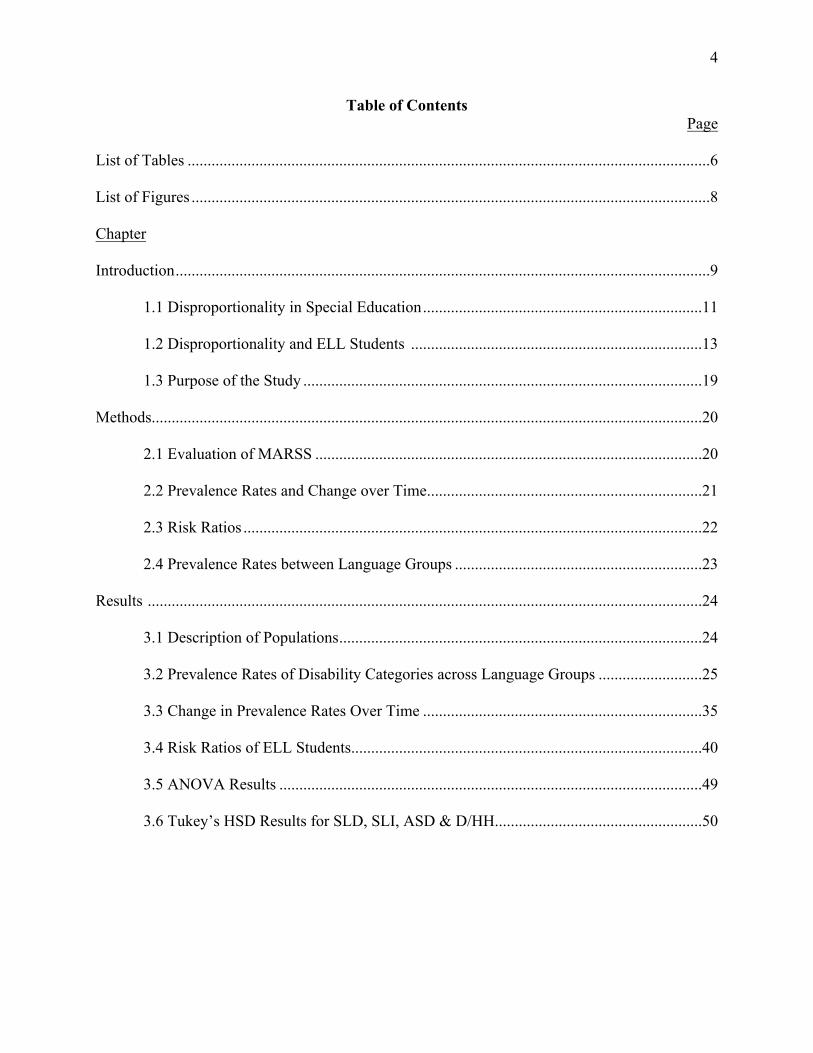
Table of Contents Page
List of Tables ...................................................................................................................................6
List of Figures ..................................................................................................................................8
Chapter
Introduction ......................................................................................................................................9
1.1 Disproportionality in Special Education ......................................................................11
1.2 Disproportionality and ELL Students .........................................................................13
1.3 Purpose of the Study ....................................................................................................19
Methods..........................................................................................................................................20
2.1 Evaluation of MARSS .................................................................................................20
2.2 Prevalence Rates and Change over Time .....................................................................21
2.3 Risk Ratios ...................................................................................................................22
2.4 Prevalence Rates between Language Groups ..............................................................23
Results ...........................................................................................................................................24
3.1 Description of Populations ...........................................................................................24
3.2 Prevalence Rates of Disability Categories across Language Groups ..........................25
3.3 Change in Prevalence Rates Over Time ......................................................................35
3.4 Risk Ratios of ELL Students........................................................................................40
3.5 ANOVA Results ..........................................................................................................49
3.6 Tukey’s HSD Results for SLD, SLI, ASD & D/HH....................................................50

5
Chapter Page
Discussion ......................................................................................................................................54
4.1 Disproportionality in Minnesota Public Schools .........................................................54
4.2 General Disproportionality ..........................................................................................55
4.3 Disproportionality in Special Education Categories ....................................................60
4.4 Resolution of Disproportionality .................................................................................73
4.5 Limitations ...................................................................................................................76
Conclusion .....................................................................................................................................78
References ......................................................................................................................................79
Appendices
Appendix A – MDE (2012) Criteria for Special Education. .............................................87
Appendix B – Minnesota Home Language Survey .........................................................105
Appendix C – IRB Approval Form ..................................................................................106

6
List of Tables Table Page Table 1.1 Summary of Results Presented in Samson and Lesaux (2009) .....................................14
Table 3.1 Total Population Data of the Language Groups across the Academic Years 2006-07,
2009-10, and 2012-13 ........................................................................................................25
Table 3.2 Prevalence Rates per 1000 of English-, Spanish-, Hmong-, Somali-, and “Other”-
Speaking Students in the 14 Special Education Categorical Labels across the Academic
Years 2006-07, 2009-10, 2012-13 .....................................................................................27
Table 3.3. Rankings of Disability Categories Based on Primary Language across the Academic
Years 2006-07, 2009-10, and 2012-13 ..............................................................................29
Table 3.4. Percentage Change in Prevalence Rates between the Academic Years 2006-07
to 2012-13 ..........................................................................................................................35
Table 3.5. Overall Risk Ratios of ELL Students Compared to EPL Students in Special
Education ...........................................................................................................................40
Table 3.6. Risk Ratios of ELL Students Compared to EPL Students ............................................40
Table 3.7. Results of the ANOVAs to Compare Language Group (English, Spanish, Hmong,
Somali, Other) Representativeness in each of the 14 Special Education Categories
in the 2006-07, 2009-10, and 2012-13 Academic Years ...................................................50
Table 3.8. Results of Tukey’s HSD Significance Values between Language Groups in SLD
in each Academic Year ......................................................................................................51
Table 3.9. Results of Tukey’s HSD Significance Values between Language Groups in SLI
in each Academic Year ......................................................................................................52
Table 3.10. Results of Tukey’s HSD Significance Values between Language Groups in ASD
in each Academic Year ......................................................................................................52

7
Table Page
Table 3.11. Results of Tukey’s HSD Significance Values between Language Groups in D/HH
in each Academic Year ......................................................................................................53

8
List of Figures
Figure Page
Figure 3.1. ELL Student Enrollment in Special Education from 2006-07 to 2012-13 ..................26
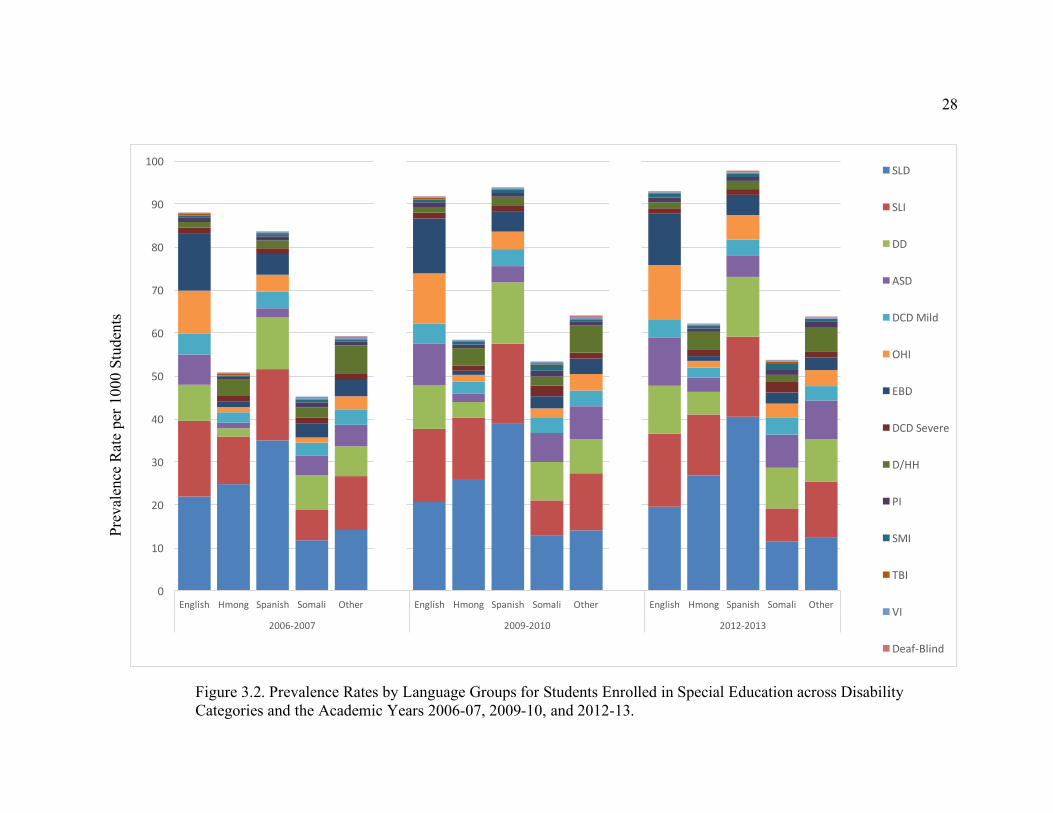
Figure 3.2. Prevalence Rates by Language Groups for Students Enrolled in Special Education
across Disability Categories and the Academic Years ......................................................28
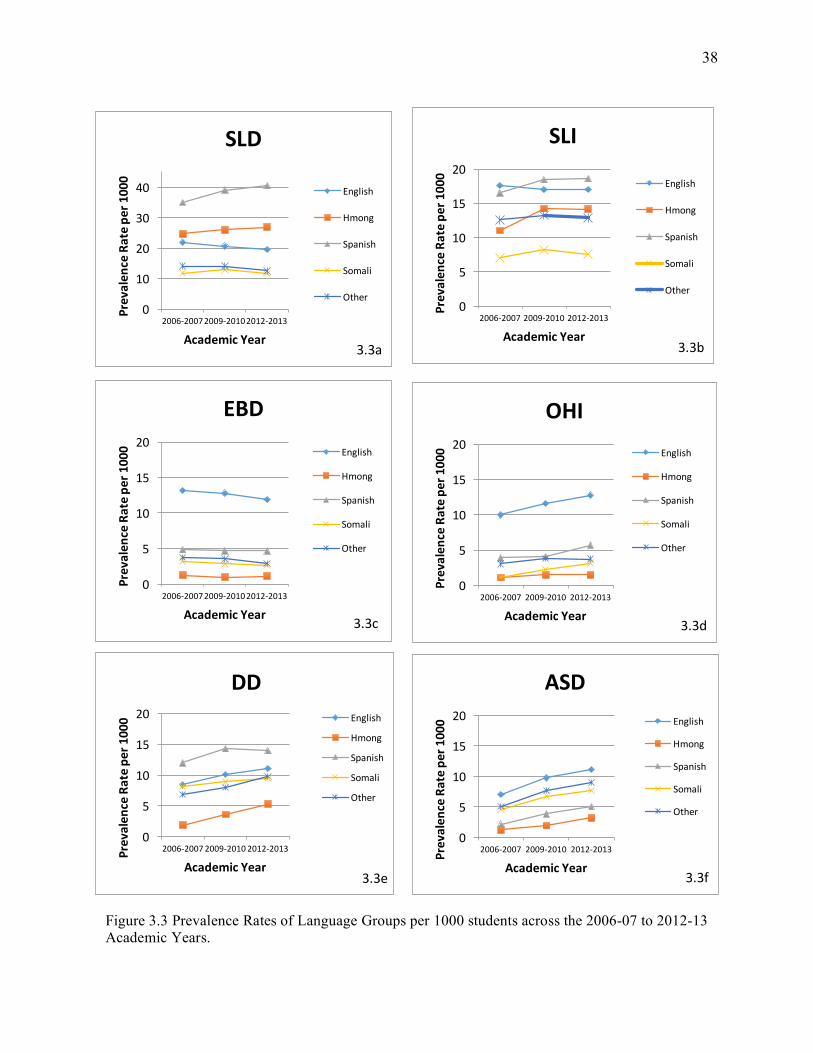
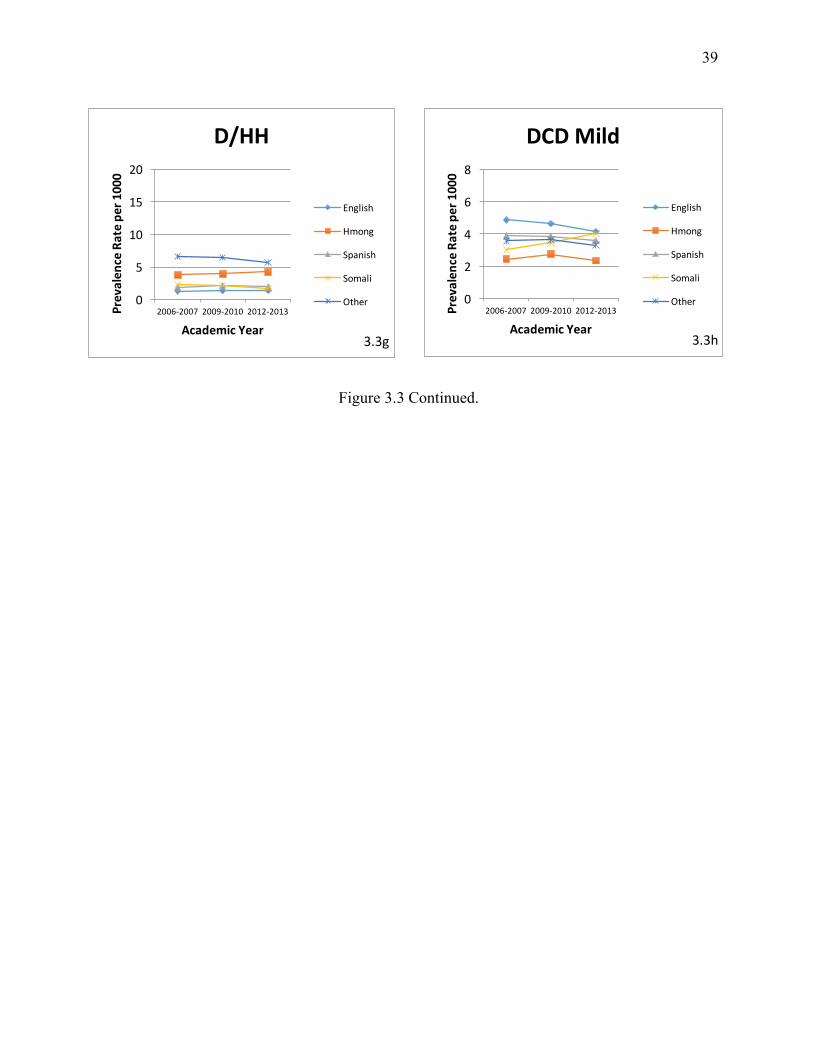
Figure 3.3. Prevalence Rates of Language Groups per 1000 Students across the
2006-07 to 2012-13 Academic Years ................................................................................38
9
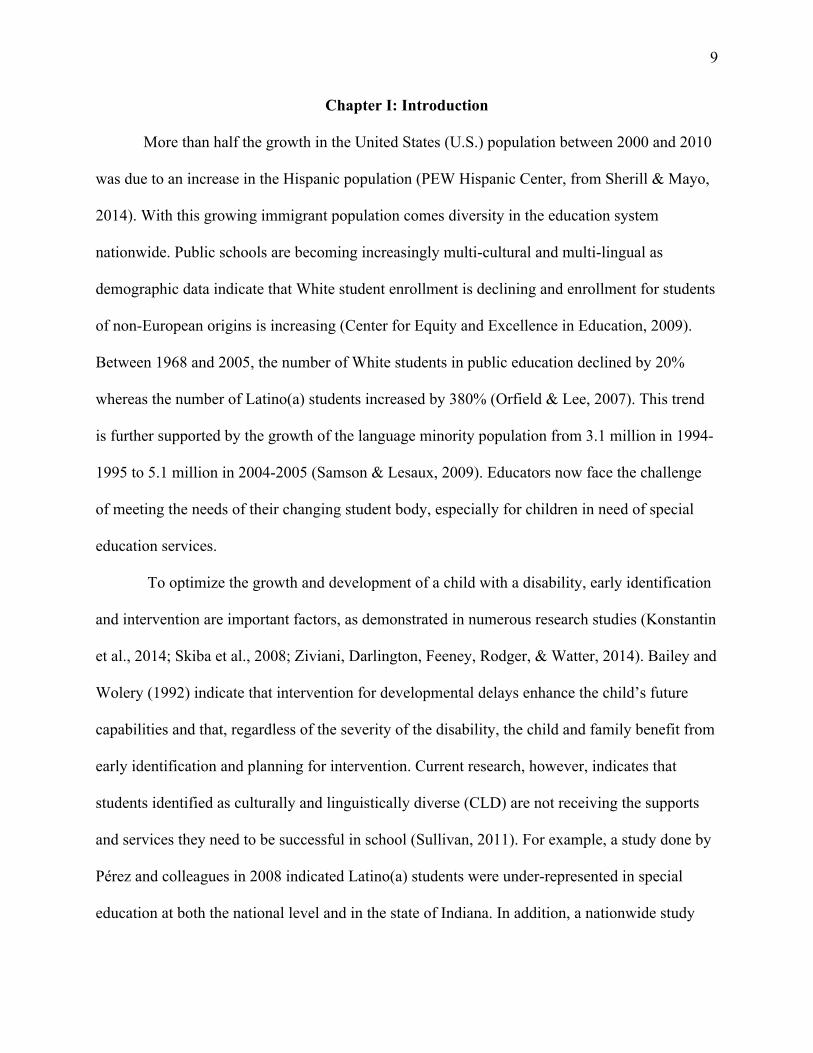
Chapter I: Introduction
More than half the growth in the United States (U.S.) population between 2000 and 2010
was due to an increase in the Hispanic population (PEW Hispanic Center, from Sherill & Mayo,
2014). With this growing immigrant population comes diversity in the education system
nationwide. Public schools are becoming increasingly multi-cultural and multi-lingual as
demographic data indicate that White student enrollment is declining and enrollment for students
of non-European origins is increasing (Center for Equity and Excellence in Education, 2009).
Between 1968 and 2005, the number of White students in public education declined by 20%
whereas the number of Latino(a) students increased by 380% (Orfield & Lee, 2007). This trend
is further supported by the growth of the language minority population from 3.1 million in 1994-
1995 to 5.1 million in 2004-2005 (Samson & Lesaux, 2009). Educators now face the challenge
of meeting the needs of their changing student body, especially for children in need of special
education services.
To optimize the growth and development of a child with a disability, early identification
and intervention are important factors, as demonstrated in numerous research studies (Konstantin
et al., 2014; Skiba et al., 2008; Ziviani, Darlington, Feeney, Rodger, & Watter, 2014). Bailey and
Wolery (1992) indicate that intervention for developmental delays enhance the child’s future
capabilities and that, regardless of the severity of the disability, the child and family benefit from
early identification and planning for intervention. Current research, however, indicates that
students identified as culturally and linguistically diverse (CLD) are not receiving the supports
and services they need to be successful in school (Sullivan, 2011). For example, a study done by
Pérez and colleagues in 2008 indicated Latino(a) students were under-represented in special
education at both the national level and in the state of Indiana. In addition, a nationwide study

10
involving 3,338 families (53% White, 21% Black, 16% Hispanic, 4% Asian/Pacific Islander, and
5% mixed race or “other”) with a child who has a disability, or has a child at risk for a disability,
indicated minority families were more likely to report negative experiences with early
intervention services compared to White families (Bailey, Hebbeler, Scarborough, Spiker, &
Mallik, 2004). To examine why minority families report negative experiences, researchers have
studied the role of the early child intervention professionals, including that of speech-language
pathologists (SLPs).
Hammer, Detwiler, Detwiler, Blood, and Qualls (2004) recruited education-based SLPs
from rural and urban, diverse and non-diverse communities through the American Speech-
Language and Hearing Association’s (ASHA) membership list to participate in a survey
regarding their training for working with CLD populations and their confidence in serving CLD
clients. Two hundred and thirteen survey responses were returned and organized into three
groups: (1) 59 responses from non-diverse rural areas, (2) 24 responses from non-diverse urban
areas, and (3) 121 responses from diverse urban areas. Responses from SLPs in diverse-rural
areas were omitted because only nine surveys were returned. Analysis of these surveys revealed,
“approximately one third of participants in each of the three groups indicated they did not
receive training on multicultural issues as a student” (Hammer, Detwiler, Detwiler, Blood, &
Qualls, 2004, p. 97). Without this education, SLPs may classify English language learner (ELL)
students who are typically developing bilinguals as having a speech-language impairment (SLI)1
leading to overrepresentation of ELL students in this category. On the other hand, SLPs may opt
to postpone assessment of a bilingual child for SLI because they do not understand the typical
1 Special education categorical labels have changed over time. For example, the label mental retardation has been replaced with developmental cognitive delay. In this paper, the categorical labels identified by the MN Department of Education are used throughout for consistency, even if the authors of the texts cited used alternative labels for the disability category. See Appendix A for diagnostic criteria.

11
development patterns of a bilingual student leading to underrepresentation of ELL students in
this special education category (Muñoz, White, & Horton-Ikard, 2014). Hammer and colleagues
concluded that SLPs, especially those in the education setting, are in need of education and
training for working with CLD populations.
The present study will examine the disproportionality of ELL students who are receiving
special education services under each of the 14 categorical labels in Minnesota public schools.
Disproportionality has been defined as “the extent to which membership in a given (ethnic,
socioeconomic, linguistic, or gender) group affects the probability of being placed in a specific
disability category” (Oswald, Coutinho, Best, & Singh, 1999, p. 198). Examination of
disproportionality is valuable to researchers, education professionals, and policy makers because
it provides baseline data and methods for monitoring progress in reducing disparity, as well as
supporting efforts for change (Skiba et al., 2008; Sullivan, 2011).
Disproportionality in Special Education
Disproportionality of minority students within the special education system is among the
most critical and enduring problems in special education because it presents the possibility that
students are receiving inappropriate labels and services (Skiba et al., 2008; Sullivan, 2011). The
problem of disproportionality stems from the oppression and discrimination patterns that have
characterized racial relationships throughout America’s history (Skiba et al., 2008). There has
been consensus on factors hypothesized to lead to disproportionality. These include: a)
demographic factors (e.g., minority enrollment, proportion of teachers from minority
backgrounds), b) poverty, c) difficulty meeting requirements for special education due to the
limited availability of evaluation tools in ELL native languages, d) the size of the district, e) test
bias, and f) the availability of alternative programs such as bilingual education (Artiles, Rueda,
12
Salazar, & Higareda, 2005; Shifrer, Muller, & Callahan, 2011; Skiba et al., 2008; Sullivan,
2011). However, research is limited regarding the extent each of these factors plays in
disproportionality.
Studies conducted on special education populations have primarily focused on the race of
the child receiving services, and there is limited research available regarding the potential impact
of language proficiency (Artiles et al., 2005). Researchers have consistently reported African
American and Native American students are overrepresented in “high-incidence” disability
categories based on national data analysis (Artiles et al., 2010). High incidence categories,
including Specific Learning Disability (SLD), Developmental Cognitive Disability (DCD),
Emotional/Behavioral Disorders (EBD), and SLI, have been the main focus of studies because
they constitute a large percentage of students receiving services (DeMatthews, Edwards, &
Nelson, 2014; Sullivan, 2011). It has been further noted that these special education categories
have vague and inconsistent definitions across contexts, and the diagnostic practices differ
considerably among states, school systems, and individual practitioners (Artiles, Kozleski, Trent,
Osher, & Ortiz 2010; Sullivan, 2011). Skiba and colleagues (2008) reported that disproportionate
representation was greater in the “judgmental” disability categories of DCD, EBD or SLD
compared to the “nonjudgmental” disability categories, such as Deaf/Hard of Hearing (D/HH) or
Blind-Visually Impaired (Blind-VI; Skiba et al., 2008, p. 269).
In addition to race, the role of poverty in disproportionality has been evaluated. The
argument has been made that poverty justifies disproportionality because children growing up in
low-income households are more likely to experience stressors and developmental threats due to
their environment. In addition, low-income students are more likely to have limited English
proficiency, have immigrant parents, and be retained in school (Komenski, Jamieson, &

13
Martinez, 2001). However, recent research indicates that poverty alone makes a “weak and
inconsistent contribution to the prediction of disproportionality across a number of disability
categories” (Artiles et al., 2010, p. 282). Skiba and colleagues (2008) also concluded “…research
to this point has not supported the hypothesis that poverty is the sole or even primary cause of
racial and ethnic disparities in special education” (p. 273-4). Therefore, research needs to shift to
other factors that influence the likelihood of special education enrollment, such as a child’s
English proficiency level.
Disproportionality and English Language Learning Students
According to the U.S. Department of Education Office of Special Education Programs
(2002), the number of ELL students enrolled in special education programs has increased by
14.2% from 1987 to 2001. In addition, recent literature suggests that ELL students begin
receiving special education services two to three years later than the average student whose
primary language is English (EPL; Artiles et al., 2005; Samson & Lesaux, 2009; Sullivan, 2011).
It is common for a student’s bilingual language acquisition to be confused with learning
problems, leading to an ELL student’s increased chance of misclassification with a disability
(DeMatthews et al., 2014; Shifrer et al., 2011; Pérez, et al., 2008; Sullivan, 2011). In terms of
language impairment, this may present as a challenge in distinguishing between a language
difference and a language disorder. A language difference describes an individual who speaks a
language or dialect other than Standard American English (SAE) and has no language disorder or
delay present. An individual with a language difference may have errors when they speak SAE,
though the errors arise from the nature of their native language rather than a disorder. A language
disorder is an impairment in the morphology, phonology, syntax, semantic, or pragmatic areas of
language in any combination not related to cultural or linguistic factors (Paul & Norbury, 2012).

14
Overrepresentation in special education is problematic for students because the
trajectories of students in special education are often marked by school failure and low academic
attainment (Pérez et al., 2008). However, there are also ELL students who are underrepresented
in special education due to educators assuming their academic struggles are attributed to their
emerging English language proficiency, and thus do not consider the option the student has a
disability (Muñoz et al., 2014; Pérez et al., 2008; Sullivan, 2011).
Researchers have examined disproportionality for ELL students at the local and national
levels, and have used a variety of research designs. Samson and Lesaux (2009) performed a cross
sectional study to determine if ELL students were represented in special education to the same
degree as their EPL peers. The authors used public data from the Early Childhood Longitudinal
Study – Kindergarten Cohort, a nationally representative sample of 22,782 children enrolled in
kindergarten during the 1998-1999 academic year. From these data, Samson and Lesaux
included 2,470 ELL students and 8,517 EPL students from across the nation. Results indicated a
lower initial rate of identification for ELL students in comparison to EPL students, followed by
overrepresentation beginning in third grade. Table 1.1 shows the percentages of ELL and EPL
students being identified for special education services.
Table 1.1. Summary of results presented in Samson and Lesaux (2009)
Grade Level Percentage of ELL Students
Identified for Special Education Services
Percentage of EPL Students Identified for Special Education Services
Kindergarten 4.03% 5.50% 1st Grade 8.48% 8.99% 3rd Grade 16.31% 12.76%
In addition, the representation of EPL learners in special education increased by 132% from
kindergarten to third grade, while ELL students increased by 305% in the same time frame. The
authors posited the differences of identification in the data signify ELL students were missed for

15
special education services during the important early intervention years, birth to six years of age
(Samson & Lesaux, 2009). Delayed delivery of services is detrimental to children because they
are not provided the means to adapt and accommodate to their disability. Later identification also
influences their later development and response to intervention as established maladaptive habits
must be overcome before new, healthy, habits can be developed (Riffel, 2011).
A study conducted by Artiles, Rueda, Salazar, and Higareda (2005) found results similar
to Samson and Lesaux (2009). In this study, the authors used the databases of 11 urban school
districts located in southern California for the 1998-1999 academic year. These school districts
serve one of the most diverse student populations in the country with enrollment data indicating
the population was 69% Latino(a)/Chicano(a), 10.5% White, 13.6% African American, 4.3%
Asian, 1.9% Filipino, 0.4% Pacific Islander, and 0.3% American Indian/Alaska Native. Latino(a)
students represented 94% of the ELL elementary education population, and 91% of the ELL
secondary education population. For this study, four subgroups were examined, ELLs with
limited home/primary language (L1) proficiency, ELLs with limited L1 and limited secondary
language (L2) proficiency, EPL students, and White students. The authors focused on the special
education categories typically affected by overrepresentation – that is, DCD, SLI, and SLD
(Artiles et al., 2005, p. 288). Statistical analysis included the calculation of a composition index,
a risk index, and an odds ratio to determine if ELL students were over- or underrepresented in
the specified special education categories. Results indicate that compared to White learners, ELL
students were underrepresented in the special education categories in grades K-5. However, in
grade 6 they became overrepresented. When compared to EPL students, ELLs became
overrepresented in special education in fourth grade. The authors noted that ELL students were
more likely to be placed in special education under the categorical label of SLD or SLI than the

16
categorical label of DCD. In addition, ELL students in English immersion programs were more
likely to be placed in special education programs than ELL students placed in other language
support programs (Artiles et al., 2005).
DeMatthews, Edwards, and Nelson (2014) completed a study on U.S. – Mexico border
states including Texas, Arizona, New Mexico, and California. To determine if districts and
individual schools had implemented policies to identify ELL students for special education, a
qualitative study was designed that included observations in the schools, review of documents,
and interviews with teachers, principals, school district administrators, and state education
agency administrators. Results of the study indicate a severe shortage of information regarding
how states are to provide guidance to districts or schools regarding ELL student placement in
special education. In addition, the authors noted that teachers were often confused about when an
ELL student may be evaluated for services, as many teachers stated they must wait one to two
years until after the child enters the school before they may qualify for services. This is incorrect
and in direct violation of the Individuals with Disabilities Act (IDEA), which mandates all
students be evaluated for special education services as soon as it is suspected the student has a
disability (DeMatthews et al., 2014). Therefore, due to the lack of information or misinformation
passed down from the state to the local school districts, teachers did not have the appropriate
knowledge needed to identify an ELL student with a disability (DeMatthews et al., 2014).
A longitudinal study by Estrem and Zhang (2010) further supports disproportionate
identification of ELL children with disabilities. The purpose of their study was to quantify and
characterize the trends in prevalence rates of children who received special education services
for autism spectrum disorders (ASD) in Minnesota, with a focus on children of immigrants
(Estrem & Zhang, 2010, p. 7). The authors examined the four most common languages spoken in

17
Minnesota (i.e., Spanish, Somali, Hmong, and English). Data from the Minnesota Department of
Education (MDE) across six years were analyzed for prevalence rates, proportionality, and age
of classification under the special education categorical label of ASD. Across the six years,
results indicate disproportionality of children served under the categorical label of ASD amongst
ELLs, compared to EPL students. Specifically, there was a greater increase over time in English
and Somali children being served under the categorical label of ASD when compared to Spanish
or Hmong. In addition, the age of entry into special education services varied among language
groups, with Spanish- and Somali-speaking students identified at a younger age than Hmong-
and English-speaking students. Their findings support results of other studies on
disproportionality of ELL students, and extends previous research with inclusion of specific
languages.
Sullivan (2011) examined disproportionality at the statewide and district level for ELL
students in general (i.e., no home language was specified) over a span of eight years
(1999 – 2006). A southwestern state constituting 1.1 million students, 16% of whom were ELL,
was selected for the analysis. General special education enrollment and enrollment in the high-
incidence categories of DCD, EBD, SLD, and SLI was examined. Relative risk ratios were used
to calculate the likelihood of identification of ELL students compared to White (not necessarily
EPL) students; a range of 0.80 to 1.20 was deemed acceptable. Results indicate that at the state
and district levels, ELL students were increasingly overrepresented over time in the special
education categories of DCD, SLI, and SLD. Analysis of the data indicate that within the eight-
year period, ELL students went from 30% less likely to be identified to being 30% more likely to
be identified. Finally, districts with higher proportions of ELL students were less likely to have
disproportionality in special education generally, and in the categories of SLD or SLI

18
specifically. To better understand disproportionality of ELL students in special education, the
author concluded more research is needed to examine the effects of language support, preservice
training, and professional development on ELL’s academic performance.
Other researchers have focused on the Hispanic population specifically. In a meta-
analysis, Guiberson (2009) examined patterns of Hispanic representation in special education.
Using a seven-step process that involved identifying relevant articles in computerized databases,
organizing and summarizing the articles into broad categories, and assembling the literature
review based on themes, important concepts, and future research. Results indicate that the pattern
of Hispanic representation in special education varied with state, school district, and disability.
More Hispanic students were identified as having SLD or SLI compared to their non-Hispanic
peers, but fewer Hispanic students were receiving services for DCD compared to their non-
Hispanic peers (Guiberson, 2009). Guiberson posited this might be due to cultural incompetence
on the part of the education specialist, or the school officials’ use of a “default” system to
identify students (i.e., if a student, regardless of language and culture background, is struggling
academically he/she is automatically referred, and likely enrolled, in special education). In
particular, results of this study may be an indicator of the challenge of determining a language
difference from a language disorder.
The present study will contribute to the research base of the disproportionate
representation of ELL students with specific home languages specified for each of the 14 special
education categories identified by MDE. To date, no study has included a cross-sectional
approach across seven years that examined all 14 special education categories across multiple
language groups. With this information, policy makers, education professionals, and health care
professionals will gain a better understanding of the distribution of ELL students in special

19
education, and thus be able to make improved educated decisions regarding intervention
procedures for ELL students.
Purpose of the Study:
This study examines the prevalence and proportionality of students whose home language
was English, Spanish, Hmong, Somali and “Other”2, and who were receiving services for special
education in Minnesota public schools during the academic years 2006-07, 2009-10, and 2012-
13. Specific research questions included:
1. What are the prevalence rates of 5 to 18-year-olds who speak English, Spanish, Hmong,
Somali, and “Other” languages in the 14 special education categories in Minnesota public
schools during the 2006-07, 2009-10, and 2012-13 academic years?
2. How has the population and prevalence rates of English-, Spanish-, Hmong-, Somali-,
and “Other”- speaking 5 to 18-year-olds changed between the academic years 2006-07
and 2012-13?
3. When compared to English-speaking students, is there a risk of disproportionality for
Spanish-, Hmong-, Somali-, and “Other”- speaking 5 to 18-years-old in the 14 special
education categories in 2006-07, 2009-10, and 2012-13?
4. Is there a statistically significant difference between the language groups in the 14 special
education categories in 2006-07, 2009-10, and 2012-13?
5. For the special education categories of SLD, SLI, ASD, and D/HH, which language
groups (English, Spanish, Hmong, Somali, “Other”) were significantly different from
each other?
2 In this data set, 153 languages were included in the “Other” category. These languages included those documented as being spoken in MN public schools, but were not the most prevalent and thus not examined individually.

20
Chapter II: Methods
Evaluation of the MARSS data
In accordance with IDEA, MDE has 14 categorical disability areas under which students
may qualify to receive special education services (see Appendix A for qualification information).
IDEA mandates all states collect annual data on the number of individuals receiving services that
are provided, or paid for, by the state under each categorical label. In Minnesota, these data are
collected and stored in a system known as the Minnesota Automated Reporting Student System
(MARSS).
MARSS data were received for the academic years 2000-2001 through 2012-2013 for
individual students who received special education services under each of the 14 primary
categorical labels. The data set included demographic information of each student including age
as of December 1, gender, ethnicity, home language/ELL (identified with home language survey;
Appendix B), limited English proficiency, and free or reduced price lunch eligibility. Within the
data set, disability codes for 3,165 out of 439,473 (0.72%) students across the seven years were
not available and thus these data points were not included in the study. Enrollment data included
region, school district, number of attendance hours, total membership hours (direct and indirect
services), and district special education enrollment totals. Before releasing the data set, the MDE
encrypted student identification numbers to preserve anonymity and confidentiality. General
population data for proportionality calculations was retrieved through the MDE data and
analytics webpage (http://w20.education.state.Minnesota.us/MDEAnalytics/Data.jsp).

21
This study focused on the prevalence of children whose home language was English
(EPL3) or English language learners (ELL4) who speak Spanish, Somali, Hmong, or “Other”
languages. These languages were selected because they are the most predominate in Minnesota.
In addition, the largest Somali community and second largest Hmong community residing in the
U.S. are in Minnesota (Dimayuga-Bruggeman & Schleicher, 2014). To make this large data set
more manageable for analysis, data from the academic years 2006-07, 2009-10, and 2012-13
including students 5 to 18-years-old were examined to determine how the prevalence rate of each
language group receiving special education services in each of the 14 categorical labels changed
over time.
Prevalence Rates (Question 1) and Change Over Time (Question 2)
To determine a language population’s prevalence rate, the total number of students who
were enrolled in a special education category who spoke a specific language was divided by the
total number of students who spoke that language in Minnesota public schools. The value given
was then multiplied by 1000 to provide prevalence rates per 1000 students in each special
education category. To determine how language populations changed over time in the special
education categories, percentage change was calculated for each language group in each of the
14 special education categories. To determine the percentage change, the language group’s
prevalence rate in 2006-07 was subtracted from the prevalence rate in 2012-13, then divided by
3 The term “English as a primary language (EPL)” is used in this report to describe students whose home language is English, distinct from students who speak English though have parents who speak another language in the home. 4 The term “English language learner (ELL)” is used in this report to describe a student whose home language is not English, but who may speak English in addition to other languages. This is the same definition used by the MDE who uses the Home Language Survey (Appendix B) to identify a home language other than English.

22
the prevalence rate in 2006-07 and multiplied by 100. A negative value signified a decrease in
enrollment from 2006-07 to 2012-13.
Calculation of Risk Ratios (Question 3)
To determine the specific risk ELL students had of receiving special education services
under each of the categorical labels in Minnesota public schools compared to EPL students, risk
ratios (RR) were calculated. The MDE (2008) has used RR calculations, and the statistic is
recommended for calculating disproportionality because it is easy to interpret and does not
require reference to other data (Bollmer, Bethel, Garrison-Mogren, & Brauen, 2007). In this
study, the comparison group was EPL students because the majority of students enrolled in
Minnesota public schools have a home language of English, and public perception of
discrimination is based on a comparison to the majority group (Coutinho & Oswald, 2000). The
equation for RR is modeled below:
Risk ratio = Risk for language group Risk for comparison group
For this study, the student’s home language spoken was considered the risk factor for over- or
underrepresentation of special education services. Therefore, the equation for Spanish-speaking
students, for example, may be written as follows:
RR = Spanish-speaking students in special education category ÷ All Spanish-speaking students EPL students in special education category ÷ All EPL students
A RR of 1.00 indicates no difference between the ELL group and the EPL group in receiving
services for that category of special education. A RR less than 1.00 indicates the language group
is at a lesser risk of receiving services (i.e., they are underrepresented for that categorical group),
and a RR greater than 1.00 indicates the language group is at a greater risk for receiving special
education services (i.e., they are overrepresented for that categorical group) when compared to
EPL students (Bollmer, et al., 2007).

23
Prevalence Rates between Language Groups (Questions 4 and 5)
To determine if the prevalence rates of children receiving services under each of the 14
categorical labels in Minnesota public schools were significantly different between language
groups and years, an analysis of variance (ANOVA) was conducted in conjunction with a post
hoc Tukey Honest Significance Difference test (Tukey’s HSD). ANOVA is a particular form of
statistical hypothesis testing that compares the means of two or more groups to determine if there
is statistical significance across the groups. In this study, the prevalence rates of each language
group were compared to one another to determine if prevalence rates in each special education
category were statistically significant at p < 0.01. Tukey’s HSD was then calculated to provide
specific information about the significant differences (p < 0.01) in prevalence rates between
language groups in SLD, SLI, ASD, and D/HH.
The St. Cloud State University International Review Board approved this methodology
(Appendix C).
24
Chapter III: Results
Description of Populations:
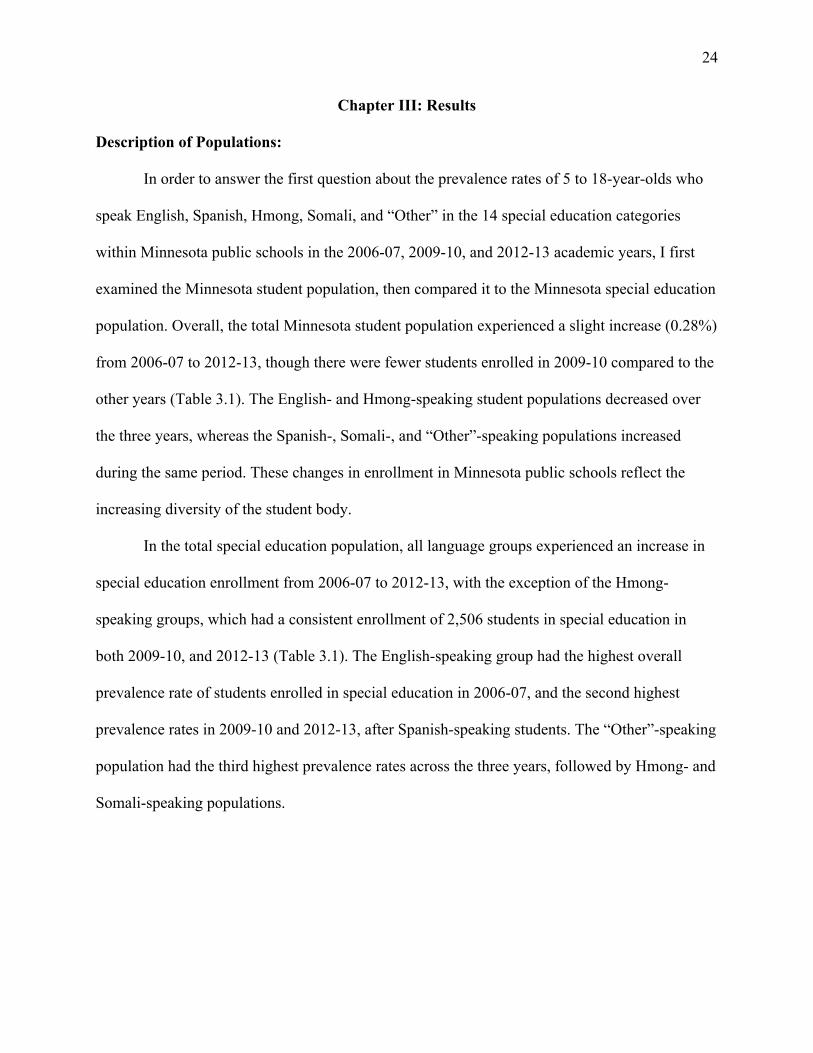
In order to answer the first question about the prevalence rates of 5 to 18-year-olds who
speak English, Spanish, Hmong, Somali, and “Other” in the 14 special education categories
within Minnesota public schools in the 2006-07, 2009-10, and 2012-13 academic years, I first
examined the Minnesota student population, then compared it to the Minnesota special education
population. Overall, the total Minnesota student population experienced a slight increase (0.28%)
from 2006-07 to 2012-13, though there were fewer students enrolled in 2009-10 compared to the
other years (Table 3.1). The English- and Hmong-speaking student populations decreased over
the three years, whereas the Spanish-, Somali-, and “Other”-speaking populations increased
during the same period. These changes in enrollment in Minnesota public schools reflect the
increasing diversity of the student body.
In the total special education population, all language groups experienced an increase in
special education enrollment from 2006-07 to 2012-13, with the exception of the Hmong-
speaking groups, which had a consistent enrollment of 2,506 students in special education in
both 2009-10, and 2012-13 (Table 3.1). The English-speaking group had the highest overall
prevalence rate of students enrolled in special education in 2006-07, and the second highest
prevalence rates in 2009-10 and 2012-13, after Spanish-speaking students. The “Other”-speaking
population had the third highest prevalence rates across the three years, followed by Hmong- and
Somali-speaking populations.

25
Table 3.1 Total Population Data of Language Groups across the Academic Years 2006-07, 2009-10, and 2012-13 Total population of each language group
2006-07 2009-10 2012-13 Percent Change
English 1,477,128 (89.2%) 1,449,962 (88.1%) 1,443,854 (86.9%) -2.25% Spanish 64,478 (3.9%) 73,900 (4.5%) 81,346 (4.9%) 20.74% Hmong 45,248 (2.7%) 42,940 (2.6%) 40,310 (2.4%) -10.91% Somali 19,166 (1.2%) 22,342 (1.4%) 29,752 (1.8%) 55.23% Other 50,462 (3.0%) 56,862 (3.5%) 65,930 (4.0%) 30.65%
Total Population 1,656,482 (100%) 1,646,006 (100%) 1,661,192 (100%) 0.28%
Total number of students enrolled in special education English 129,988 (91.8%) 133,091 (90.3%) 134,294 (89.2%) 3.31% Spanish 5,393 (3.8%) 6,941 (4.7%) 7,953 (5.3%) 47.47% Hmong 2,300 (1.6%) 2,506 (1.7%) 2,506 (1.7%) 8.96% Somali 866 (0.6%) 1,191 (0.8%) 1,599 (1.1%) 84.64% Other 2,994 (2.1%) 3,641 (2.5%) 4,210 (2.8%) 40.61%
Total Population 141,541 (100%) 147,370 (100%) 150,562 (100%) 6.37%
Overall prevalence rate of language group in special education per 1000 students English 87.98 91.79 93.00 5.71% Spanish 81.65 93.93 97.77 19.74% Hmong 50.82 58.35 62.18 22.35% Somali 45.29 53.31 53.73 18.64% Other 59.24 64.02 63.86 7.80%
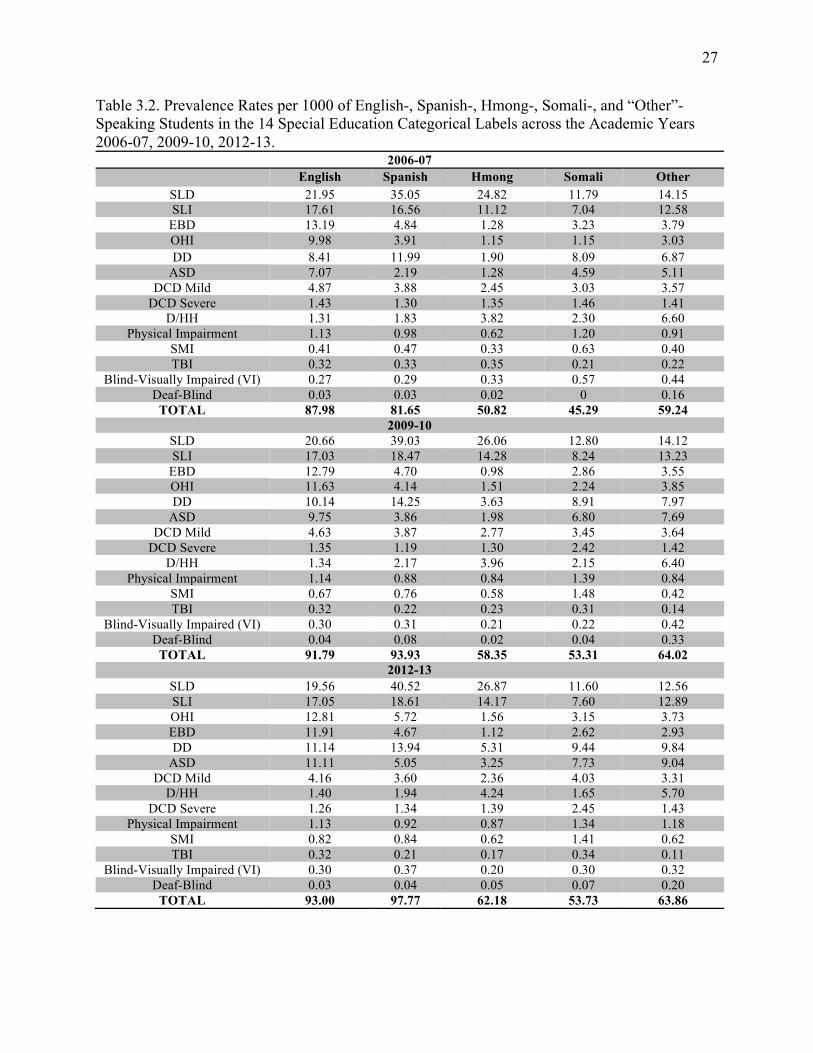
Prevalence Rates of Disability Categories across Language Groups Prevalence rates for the five language populations in each of the 14 special education
categorical labels were then examined for the academic years 2006-07, 2009-10, and 2012-13.
To calculate a language populations’ prevalence rate, the total number of students who spoke a
specific language enrolled in a special education category was divided by the total number of
students who spoke that language in Minnesota public schools. Results were reported per 1,000
students (Table 3.2) and indicate that each language group experienced an increase in special
education enrollment between 2006-07 and 2012-13. This is further illustrated in Figure 3.2.
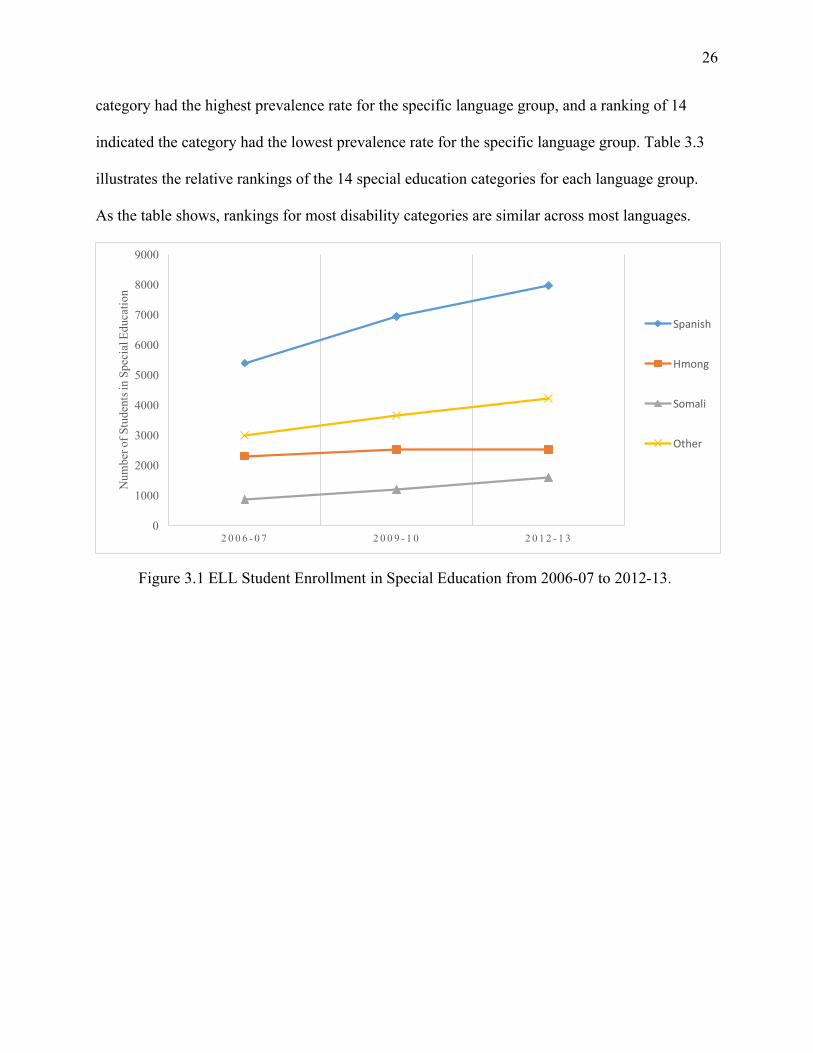
Rankings of special education categories were then examined. A ranking of 1 indicated the
26
category had the highest prevalence rate for the specific language group, and a ranking of 14
indicated the category had the lowest prevalence rate for the specific language group. Table 3.3
illustrates the relative rankings of the 14 special education categories for each language group.
As the table shows, rankings for most disability categories are similar across most languages.
0
1000
2000
3000
4000
5000
6000
7000
8000
9000
2 0 0 6 - 0 7 2 0 0 9 - 1 0 2 0 1 2 - 1 3
Num
ber o
f Stu
dent
s in
Spec
ial E
duca
tion
Spanish
Hmong
Somali
Other
Figure 3.1 ELL Student Enrollment in Special Education from 2006-07 to 2012-13.
27
Table 3.2. Prevalence Rates per 1000 of English-, Spanish-, Hmong-, Somali-, and “Other”-Speaking Students in the 14 Special Education Categorical Labels across the Academic Years 2006-07, 2009-10, 2012-13.
2006-07 English Spanish Hmong Somali Other
SLD 21.95 35.05 24.82 11.79 14.15 SLI 17.61 16.56 11.12 7.04 12.58
EBD 13.19 4.84 1.28 3.23 3.79 OHI 9.98 3.91 1.15 1.15 3.03 DD 8.41 11.99 1.90 8.09 6.87
ASD 7.07 2.19 1.28 4.59 5.11 DCD Mild 4.87 3.88 2.45 3.03 3.57
DCD Severe 1.43 1.30 1.35 1.46 1.41 D/HH 1.31 1.83 3.82 2.30 6.60
Physical Impairment 1.13 0.98 0.62 1.20 0.91 SMI 0.41 0.47 0.33 0.63 0.40 TBI 0.32 0.33 0.35 0.21 0.22
Blind-Visually Impaired (VI) 0.27 0.29 0.33 0.57 0.44 Deaf-Blind 0.03 0.03 0.02 0 0.16
TOTAL 87.98 81.65 50.82 45.29 59.24 2009-10
SLD 20.66 39.03 26.06 12.80 14.12 SLI 17.03 18.47 14.28 8.24 13.23
EBD 12.79 4.70 0.98 2.86 3.55 OHI 11.63 4.14 1.51 2.24 3.85 DD 10.14 14.25 3.63 8.91 7.97
ASD 9.75 3.86 1.98 6.80 7.69 DCD Mild 4.63 3.87 2.77 3.45 3.64
DCD Severe 1.35 1.19 1.30 2.42 1.42 D/HH 1.34 2.17 3.96 2.15 6.40
Physical Impairment 1.14 0.88 0.84 1.39 0.84 SMI 0.67 0.76 0.58 1.48 0.42 TBI 0.32 0.22 0.23 0.31 0.14
Blind-Visually Impaired (VI) 0.30 0.31 0.21 0.22 0.42 Deaf-Blind 0.04 0.08 0.02 0.04 0.33
TOTAL 91.79 93.93 58.35 53.31 64.02 2012-13
SLD 19.56 40.52 26.87 11.60 12.56 SLI 17.05 18.61 14.17 7.60 12.89 OHI 12.81 5.72 1.56 3.15 3.73 EBD 11.91 4.67 1.12 2.62 2.93 DD 11.14 13.94 5.31 9.44 9.84
ASD 11.11 5.05 3.25 7.73 9.04 DCD Mild 4.16 3.60 2.36 4.03 3.31
D/HH 1.40 1.94 4.24 1.65 5.70 DCD Severe 1.26 1.34 1.39 2.45 1.43
Physical Impairment 1.13 0.92 0.87 1.34 1.18 SMI 0.82 0.84 0.62 1.41 0.62 TBI 0.32 0.21 0.17 0.34 0.11
Blind-Visually Impaired (VI) 0.30 0.37 0.20 0.30 0.32 Deaf-Blind 0.03 0.04 0.05 0.07 0.20
TOTAL 93.00 97.77 62.18 53.73 63.86
28 Pr
eval
ence
Rat
e pe
r 100
0 St
uden
ts
Figure 3.2. Prevalence Rates by Language Groups for Students Enrolled in Special Education across Disability Categories and the Academic Years 2006-07, 2009-10, and 2012-13.
0
10
20
30
40
50
60
70
80
90
100
English Hmong Spanish Somali Other English Hmong Spanish Somali Other English Hmong Spanish Somali Other
2006-2007 2009-2010 2012-2013
SLD
SLI
DD
ASD
DCDMild
OHI
EBD
DCDSevere
D/HH
PI
SMI
TBI
VI
Deaf-Blind

29
2006-2007 2009-2010 2012-2013 Rank Eng. Hmo. Spa. Som. Oth. Eng. Hmo. Spa. Som. Oth. Eng. Hmo. Spa. Som. Oth.
1 SLD SLD SLD SLD SLD SLD SLD SLD SLD SLD SLD SLD SLD SLD SLI
2 SLI SLI SLI DD SLI SLI SLI SLI DD SLI SLI SLI SLI DD SLD
3 EBD D/HH DD SLI DD EBD D/HH DD SLI DD OHI DD DD ASD DD
4 OHI DCD Mild
EBD ASD D/HH OHI DD EBD ASD ASD EBD D/HH OHI SLI ASD
5 DD DD OHI EBD ASD DD DCD Mild
OHI DCD Mild
D/HH DD ASD ASD DCD Mild
D/HH
6 ASD DCD Sev.
DCD Mild
DCD Mild
EBD ASD ASD DCD Mild
EBD OHI ASD DCD Mild
EBD OHI OHI
7 DCD Mild
ASD
EBD
ASD D/HH DCD Mild
DCD Mild
OHI ASD DCD Sev.
DCD Mild
DCD Mild
OHI DCD Mild
EBD DCD Mild
8 DCD Sev.
D/HH
DCD Sev. OHI DCD Sev.
DCD Sev.
D/HH OHI EBD D/HH DCD Sev.
D/HH DCD Sev.
EBD
9 D/HH OHI DCD Sev.
PI DCD Sev.
D/HH EBD DCD Sev. D/HH DCD Sev.
DCD Sev.
EBD DCD Sev.
D/HH DCD Sev.
10 PI PI PI OHI PI PI PI PI SMI PI PI PI PI SMI PI
11 SMI TBI SMI SMI VI SMI SMI SMI PI SMI
VI SMI SMI SMI PI SMI
12 TBI SMI
VI TBI VI SMI TBI TBI VI TBI TBI VI VI TBI VI
13 VI VI TBI TBI VI VI TBI VI Deaf-Blind
VI TBI TBI VI Deaf-Blind
14 Deaf-Blind
Deaf- Blind
Deaf-Blind
Deaf-Blind
Deaf-Blind
Deaf-Blind
Deaf-Blind
Deaf-Blind
Deaf-Blind
TBI Deaf-Blind
Deaf-Blind
Deaf-Blind
Deaf-Blind
TBI
Table 3.3. Rankings of Disability Categories Based on Primary Language across the Academic Years 2006-07, 2009-10, and 2012-13

30
Specific Learning Disability
SLD was the special education category with the greatest number of students enrolled
across all three years (Figure 3.2). Across the three academic years (2006-07, 2009-10, 2012-13),
Spanish-speaking students had the highest prevalence rates (35.05, 39.03, 40.52, respectively),
followed by Hmong- (24.82, 26.06, 26.87), English- (21.95, 20.66, 19.56), “Other”- (14.15,
14.12, 12.56) and Somali- (11.79, 12.80, 11.60) speaking students (Table 3.2). SLD was ranked
first for all language groups across the three academic years, with the exception of “Other”-
speaking students, which had SLD ranked second behind SLI in 2012-13 (Table 3.3).
Speech Language Impairment
As shown in Table 3.2, SLI was another special education category that contained high
prevalence rates across the three academic years and across all language groups. English-
speaking students had the highest prevalence rate in 2006-07 (17.61), and Spanish-speaking
students had the highest prevalence rates in 2009-10 and 2012-13 (18.47, 18.61, respectively).
Somali-speaking students had the lowest prevalence rates in SLI across the three academic years
(7.04, 8.24, 7.60, respectively). Figure 3.3b shows the distribution of the language groups in SLI
across the three academic years. SLI was consistently ranked second for English-, Spanish-, and
Hmong-speaking students. For Somali-speaking students, SLI ranked third in 2006-07 and 2009-
10, and fourth in 2012-13. For “Other”-speaking students, SLI ranked second in 2006-07 and
2009-10, and first in 2012-13.
Emotional/Behavioral Disorder
Examination of the special education category EBD revealed English-speaking students
had much higher prevalence rates compared to the other language groups at rates of 13.19, 12.79,
and 11.91 across the three academic years (Table 3.2). Spanish-speaking students had the next
highest prevalence rates (4.84, 4.70, 4.67) followed by “Other”- (3.79, 3.55, 2.93), Somali- (3.23,

31
2.86, 2.62) and Hmong- (1.28, 0.98, 1.12) speaking students across the three academic years.
EBD decreased in ranking for all language groups across the three academic years (Table 3.3).
English-speaking students had EBD ranked third (the highest among all language groups) in
2006-07 and 2009-10, and fourth in 2012-13. Hmong-speaking students with EBD ranked the
lowest, at seventh in 2006-07, and ninth in 2009-10 and 2012-13. The Spanish, Somali, and
“Other” language groups had EBD ranked from fourth to eighth within the three academic years.
Other Health Impairment
English-speaking students had much greater prevalence rates than the other language
groups in the category of Other Health Impairment (OHI) across the three academic years (9.98,
11.63, 12.81, respectively; Table 3.2). In fact, English-speaking students’ prevalence rates were
over twice as high as those for Spanish-speaking students who had the next highest prevalence
rates at 3.91, 4.14, and 5.72 across the three academic years. “Other”-speaking students had the
third highest prevalence rates (3.03, 3.85, 3.73) followed by Somali- (1.15, 2.24, 3.15) and
Hmong- (1.15, 1.51, 1.56) speaking students. OHI increased in ranking across the three academic
years for each of the five language groups (Table 3.3). When all language groups were compared
to each other, OHI was ranked highest for English-speaking students (fourth in 2006-07 and
2009-10, and third in 2012-13), followed by Spanish-speaking students (fifth in 2006-07 and
2009-10, and fourth in 2012-13). OHI increased in ranking from ninth to seventh for Hmong-
speaking students across the three academic years. Somali-speaking students had OHI ranked
lowest at tenth in 2006-07, though this increased to eighth in 2009-10, and to sixth in 2012-13.
Developmental Delay
Examination of the Developmental Delay (DD) category revealed Hmong-speaking
students had much lower prevalence rates (1.90, 3.63, 5.31) compared to the other language

32
groups (Spanish = 11.99, 14.25, 13.94; English = 8.41, 10.14, 11.14; Somali = 8.09, 8.91, 9.44;
Other = 6.87, 7.97, 9.84; Table 3.2). DD was ranked fifth for English-speaking students, third for
Spanish- and “Other”- speaking students, and second for Somali-speaking students across the
three academic years (Table 3.3). DD increased in ranking for Hmong-speaking students from
fifth in 2006-07, to third in 2012-13.
Autism Spectrum Disorder
Similar to DD, Hmong-speaking students had the lowest prevalence rates in the category
of ASD across the three academic years with prevalence rates of 1.28, 1.98, and 3.25,
respectively (Table 3.2). English-speaking students had the highest prevalence rates (7.07, 9.75,
11.11) across the three academic years, followed by “Other”- (5.11, 7.69, 9.04), Somali- (4.59,
6.80, 7.73) and Spanish- (2.19, 3.86, 5.05) speaking students. Examination of the ranking of
ASD within the language groups revealed ASD increased in prevalence for all language groups
across the three academic years, with the exception of English, which stayed consistent at a
ranking of sixth (Table 3.3). Somali-speaking students with ASD ranked highest compared to the
other language groups: fourth in 2009-10 and 2012-13, and third in 2012-13. ASD was ranked
seventh for Spanish- speaking students in 2006-07 and 2009-10, and then increased to fifth in
2012-13. For Hmong-speaking students, ASD was tied with EBD at a ranking of seventh in
2006-07, and then increased to sixth in 2009-10, and fifth in 2012-13. ASD increased in ranking
for “Other”-speaking students as well, moving from fifth in 2006-07, to fourth in 2009-10 and
2012-13 (Table 3.3).
Deaf/Hard of Hearing
“Other”-speaking students had markedly higher prevalence rates in the category of D/HH
compared to the other language groups across the three academic years at rates of 6.60, 6.40, and

33
5.70, respectively (Table 3.2). Hmong- (3.82, 3.96, 4.24) speaking students had the second
highest prevalence rates across the three academic years, followed by Somali- (2.30, 2.15, 1.65),
Spanish- (1.83, 2.17, 1.94), and English- (1.31, 1.34, 1.40) speaking students. D/HH was
subsequently ranked higher for Hmong- and “Other”-speaking students at rankings between third
and fifth across the three academic years. For English-, Spanish-, and Somali-speaking students,
D/HH was ranked seventh to ninth across the three academic years (Table 3.3).
Developmental Cognitive Delay Mild
In the special education category DCD Mild, prevalence rates for the five language
groups were similar. English-speaking students had the highest prevalence rates across the three
academic years at 4.87, 4.63, and 4.16, followed closely by Spanish- (3.88, 3.87, 3.60), “Other”-
(3.57, 3.64, 3.31), Somali- (3.03, 3.45, 4.03), and Hmong- (2.45, 2.77, 2.36) speaking students
(Table 3.2). English- and “Other”-speaking student groups maintained their rankings for DCD
Mild at seventh across the three academic years (Table 3.3). Hmong-speaking students, who had
a ranking of fourth, had DCD Mild ranked higher than the other language groups in 2006-07,
though their ranking decreased to fifth in 2009-10, and sixth in 2012-13. Spanish-speaking
students who were DCD Mild decreased in ranking from sixth in 2006-07 and 2009-10, to
seventh in 2012-13. Somali-speaking students were the only language group to experience an
increase in ranking of DCD Mild from a ranking of sixth in 2006-07, to a ranking of fifth in
2009-10 and 2012-13 (Table 3.3).
Low Incidence Special Education Categories
Developmental Cognitive Delay Severe
Somali-speaking students had the highest prevalence rates in the category of DCD Severe
across the three academic years (1.46, 2.42, 2.45, respectively). English- (1.43, 1.35, 1.26),

34
Spanish- (1.30, 1.19, 1.34), Hmong- (1.35, 1.30, 1.39), and “Other”- (1.41, 1.42, 1.43) speaking
students had similar prevalence rates across the three academic years (Table 3.2).
Physical Impairment
In the Physical Impairment (PI) special education category, Somali-speaking students had
the highest prevalence rates (1.20, 1.39, 1.34, respectively) compared to the other language
groups. English-speaking students had the next highest prevalence rates at 1.13, 1.14, and 1.13
followed by Spanish- (0.98, 0.88, 0.92), “Other”- (0.91, 0.84, 1.18) and Hmong- (0.62, 0.84,
0.87) speaking students (Table 3.2).
Severely Multiply Impaired
In the category of Severely Multiply Impaired (SMI), Somali-speaking students had the
highest prevalence rates 0.63, 1.48, and 1.41 across the three academic years. The other language
groups had similar prevalence rates, with Spanish-speaking students having the next highest
prevalence rates (0.47, 0.76, 0.84), followed by English- (0.41, 0.67, 0.82), “Other”- (0.40, 0.42,
0.62) and Hmong- (0.33, 0.58, 0.62) speaking students.
Traumatic Brain Injury, Blind-Visual Impairment, Deaf-Blind
The remaining special education categories (Traumatic Brain Injury (TBI), Blind-
Visually Impaired (Blind-VI), and Deaf-Blind) ranked lowest and had the lowest prevalence
rates across the five language groups and the three academic years. In the special education
categories of TBI and Blind-VI, prevalence rates were consistent across language groups. In the
category of Deaf-Blind, it was interesting to note that “Other”-speaking students had relatively
higher prevalence rates (0.16, 0.33, 0.20) compared to the other language groups, which had
prevalence rates less than or equal to 0.08 (Table 3.2; Table 3.3).
35
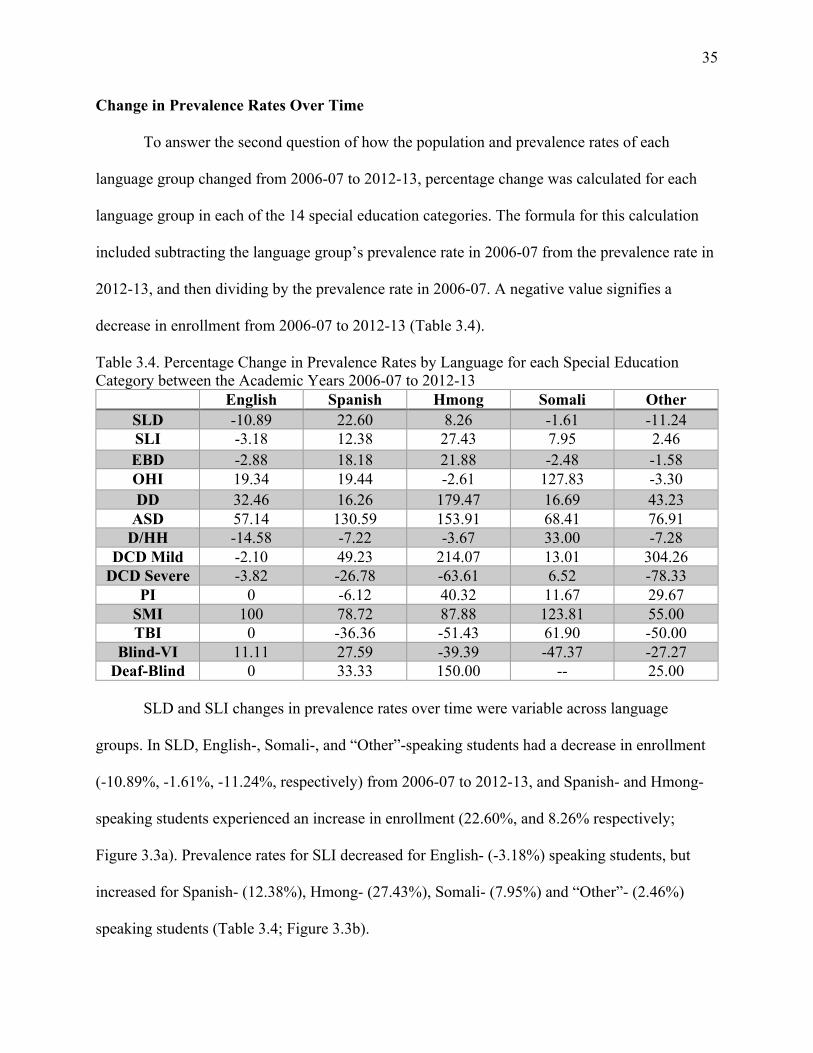
Change in Prevalence Rates Over Time
To answer the second question of how the population and prevalence rates of each
language group changed from 2006-07 to 2012-13, percentage change was calculated for each
language group in each of the 14 special education categories. The formula for this calculation
included subtracting the language group’s prevalence rate in 2006-07 from the prevalence rate in
2012-13, and then dividing by the prevalence rate in 2006-07. A negative value signifies a
decrease in enrollment from 2006-07 to 2012-13 (Table 3.4).
Table 3.4. Percentage Change in Prevalence Rates by Language for each Special Education Category between the Academic Years 2006-07 to 2012-13
English Spanish Hmong Somali Other SLD -10.89 22.60 8.26 -1.61 -11.24 SLI -3.18 12.38 27.43 7.95 2.46 EBD -2.88 18.18 21.88 -2.48 -1.58 OHI 19.34 19.44 -2.61 127.83 -3.30 DD 32.46 16.26 179.47 16.69 43.23
ASD 57.14 130.59 153.91 68.41 76.91 D/HH -14.58 -7.22 -3.67 33.00 -7.28
DCD Mild -2.10 49.23 214.07 13.01 304.26 DCD Severe -3.82 -26.78 -63.61 6.52 -78.33
PI 0 -6.12 40.32 11.67 29.67 SMI 100 78.72 87.88 123.81 55.00 TBI 0 -36.36 -51.43 61.90 -50.00
Blind-VI 11.11 27.59 -39.39 -47.37 -27.27 Deaf-Blind 0 33.33 150.00 -- 25.00
SLD and SLI changes in prevalence rates over time were variable across language
groups. In SLD, English-, Somali-, and “Other”-speaking students had a decrease in enrollment
(-10.89%, -1.61%, -11.24%, respectively) from 2006-07 to 2012-13, and Spanish- and Hmong-
speaking students experienced an increase in enrollment (22.60%, and 8.26% respectively;
Figure 3.3a). Prevalence rates for SLI decreased for English- (-3.18%) speaking students, but
increased for Spanish- (12.38%), Hmong- (27.43%), Somali- (7.95%) and “Other”- (2.46%)
speaking students (Table 3.4; Figure 3.3b).

36
EBD and OHI had some language groups increase in prevalence rates and some groups
decrease from 2006-07-2012-13. In the EBD special education category, Hmong- (21.88%)
speaking students experienced the greatest increase, followed by Spanish- (18.18%) speaking
students. English- (-2.88%), Somali- (-2.48%), and “Other”- (-1.58%) speaking students
experienced a decrease in prevalence rates in the EBD category. In the OHI special education
category, Somali- (127.83%) speaking students experienced the greatest increases in prevalence
rate, followed by Spanish- (19.44%) and English- (19.34%) speaking students. Hmong- (-2.61%)
and “Other”- (-3.30%) speaking students experienced a decrease in prevalence rate in OHI.
The DD and ASD special education categories had increased prevalence rates from 2006-
07 to 2012-13 (Table 3.4). In the DD category, Hmong- (179.47%) speaking students had the
greatest increase in prevalence rate, followed by “Other”- (43.23%), English- (32.46%), Somali-
(16.69%), and Spanish- (16.26%) speaking students. For ASD, although Hmong-speaking
students prevalence rates were low they showed the greatest increase from 2006-07 to 2012-13
(153.91%), followed by Spanish- (130.59%), “Other”- (76.91%), Somali- (68.41%), and
English- (57.14%) speaking students (Figure 3.3f).
The D/HH category showed variation in trends among language groups. Prevalence rates
increased for Somali- (33.00%) speaking students, but decreased for English- (-14.58%),
Spanish- (-7.22%), Hmong- (-3.67%), and “Other”- (-7.28%) speaking students (Figure 3.3g).
For DCD Mild, as reflected in Figure 3.3h, “Other”- (304.26%) speaking students had a large
increase in prevalence rates, as did Hmong- (214.07%), Spanish- (49.23%), and Somali-
(13.01%) speaking students. English- (-2.10%) speaking students were the only group to
experience a decrease in prevalence rate in DCD Mild.

37
Low Incidence Special Education Categories
Changes in prevalence rates for language groups were variable for the low incidence
special education categories. In DCD Severe, Somali- (6.52%) speaking students were the only
group to experience an increase in prevalence rates from 2006-07 to 2012-13. English- (-3.82%)
Spanish- (-26.78%), Hmong- (-63.61%), and “Other”- (-78.33%) speaking students decreased in
prevalence rates. In PI, “Other”- (29.67%), Hmong- (40.32%), and Somali- (11.67%) speaking
students had increased prevalence rates, although prevalence rates for Spanish-speaking students
decreased (-6.12%), and there was no change for English-speaking students. In SMI, prevalence
rates of all language groups increased from 2006-07 to 2012-13 with Somali-speaking students
having the greatest increase (123.81%), followed by English- (100.00%), Hmong- (87.88%),
Spanish- (78.72%) and “Other”- (55.00%) speaking students.
In the TBI category, there was no change in prevalence rates of the English-speaking
group. Somali- (61.90%) speaking students increased in prevalence, and Spanish- (-36.36%),
Hmong- (-51.43%), and “Other”- (-50.00%) speaking groups decreased in prevalence over time.
In the category of Blind-VI, prevalence rates for English- (11.11%) and Spanish- (27.59%)
speaking students increased, while prevalence rates for Hmong- (-39.39%), Somali-
(-47.37%) and “Other”- (-27.27%) speaking students decreased. Finally, for the category of
Deaf-Blind, prevalence rates increased for Hmong- (150.00%), Spanish- (33.33%), and “Other”-
(25.00%) speaking students. English- speaking students experienced no change in prevalence.
Prevalence rates for Somali-speaking students increased, but could not be calculated due to their
zero prevalence in 2006-07.
38
0
5
10
15
20
2006-2007 2009-2010 2012-2013
Prevalen
ceRatep
er1000
AcademicYear
SLI
English
Hmong
Spanish
Somali
Other
3.3b
0
5
10
15
20
2006-20072009-20102012-2013
Prevalen
ceRatep
er1000
AcademicYear
EBDEnglish
Hmong
Spanish
Somali
Other
3.3c
0
10
20
30
40
2006-20072009-20102012-2013
Prevalen
ceRatep
er1000
AcademicYear
SLD
English
Hmong
Spanish
Somali
Other
3.3a
0
5
10
15
20
2006-2007 2009-2010 2012-2013
Prevalen
ceRatep
er1000
AcademicYear
OHIEnglish
Hmong
Spanish
Somali
Other
3.3d
0
5
10
15
20
2006-2007 2009-2010 2012-2013Prevalen
ceRatep
er1000
AcademicYear
DDEnglish
Hmong
Spanish
Somali
Other
3.3e
0
5
10
15
20
2006-2007 2009-2010 2012-2013Prevalen
ceRatep
er1000
AcademicYear
ASDEnglish
Hmong
Spanish
Somali
Other
3.3f
Figure 3.3 Prevalence Rates of Language Groups per 1000 students across the 2006-07 to 2012-13 Academic Years.
39
0
2
4
6
8
2006-2007 2009-2010 2012-2013Prevalen
ceRatep
er1000
AcademicYear
DCDMild
English
Hmong
Spanish
Somali
Other
3.3h
0
5
10
15
20
2006-2007 2009-2010 2012-2013Prevalen
ceRatep
er1000
AcademicYear
D/HH
English
Hmong
Spanish
Somali
Other
3.3g
Figure 3.3 Continued.

40
Risk Ratios of ELL Students
To answer the third question about risk of disproportionality for Spanish-, Hmong-,
Somali-, and “Other”- speaking groups compared to English-speaking students in the 14 special
education categories in the 2006-07, 2009-10, and 2012-13 academic years, risk ratios (RR) were
calculated. The formula for RR involves dividing the prevalence rate of each ELL group (i.e.,
Spanish, Hmong, Somali, and “Other”) per 1000 students by the prevalence rate of the EPL
group per 1000 students. A value equal to 1.0 signified the ELL group was represented in the
special education category to the same degree as the EPL group. Values greater than 1.0
signified over-representation of the ELL group compared to EPL students, and values less than
1.0 signified underrepresentation of the ELL group compared to EPL students. Table 3.5 reflects
the results for the risk ratio calculations for the overall population in special education, and Table
3.6 reflects the RR broken down by special education category.
Table 3.5. Overall Risk Ratios of ELL Students Compared to EPL Students in Special Education. Language Group RR 2006-07 RR 2009-10 RR 2012-13
Spanish 0.93 1.02 1.05 Hmong 0.58 0.64 0.67 Somali 0.51 0.58 0.58 Other 0.67 0.70 0.69
Table 3.6. Risk Ratios of ELL Students Compared to EPL Students.
Home Language Special Education Category RR per Year 2006-07 2009-10 2012-13 SLD Actual RR per Year
Spanish 1.60 1.89 2.07 Hmong 1.13 1.26 1.37 Somali 0.54 0.62 0.59 Other 0.64 0.68 0.64
SLI Actual RR per Year Spanish 0.94 1.08 1.09 Hmong 0.63 0.84 0.83 Somali 0.40 0.48 0.45 Other 0.71 0.78 0.76

41
2006-07 2009-10 2012-13 EBD Actual RR per Year
Spanish 0.37 0.37 0.39 Hmong 0.10 0.08 0.09 Somali 0.25 0.22 0.22 Other 0.29 0.28 0.25
OHI Actual RR per Year Spanish 0.39 0.36 0.45 Hmong 0.12 0.13 0.12 Somali 0.11 0.19 0.25 Other 0.30 0.33 0.29
DD Actual RR per Year Spanish 1.42 1.41 1.25 Hmong 0.23 0.26 0.48 Somali 0.96 0.88 0.85 Other 0.81 0.79 0.88
ASD Actual RR per Year Spanish 0.18 0.20 0.29 Hmong 0.31 0.40 0.45 Somali 0.65 0.70 0.70 Other 0.72 0.79 0.81
DCD Mild Actual RR per Year Spanish 0.80 0.84 0.87 Hmong 0.50 0.60 0.57 Somali 0.62 0.74 0.97 Other 0.73 0.79 0.79
DCD Severe Actual RR per Year Spanish 0.91 0.88 1.06 Hmong 0.94 0.97 1.10 Somali 1.02 1.79 1.95 Other 0.98 1.06 1.13
D/HH Actual RR per Year Spanish 1.39 1.62 1.39 Hmong 2.91 2.97 3.03 Somali 1.75 1.61 1.18 Other 5.03 4.79 4.07
PI Actual RR per Year Spanish 0.86 0.77 0.81 Hmong 0.55 0.73 0.77 Somali 1.06 1.21 1.19 Other 0.80 0.74 1.04
SMI Actual RR per Year Spanish 1.13 1.12 1.02 Hmong 0.81 0.86 0.76 Somali 1.53 2.19 1.72 Other 0.97 0.63 0.76

42
2006-07 2009-10 2012-13 TBI Actual RR per Year
Spanish 1.02 0.67 0.66 Hmong 1.10 0.72 0.55 Somali 0.65 0.97 1.06 Other 0.68 0.44 0.34
Blind-VI Actual RR per Year Spanish 1.08 1.03 1.22 Hmong 1.22 0.69 0.66 Somali 1.73 0.74 1.00 Other 2.04 1.39 1.06
Deaf-Blind Actual RR per Year Spanish 0.95 2.31 1.16 Hmong 0.68 0.66 1.56 Somali 0.00 1.27 2.10 Other 4.87 9.50 6.19
RR indicates over-representation in special education category (i.e., RR >1.20) RR indicates under-representation in special education category (i.e., RR < 0.80)
RR indicates proportional representation in special education category (i.e., RR = 0.80-1.20)
To be consistent with previous studies that included risk ratios, values between 0.80 and
1.20 were considered proportional to EPL student populations (Sullivan, 2011). Examination of
Table 3.5 indicates Hmong-, Somali-, and “Other”-speaking students were underrepresented in
special education when compared to EPL students across the three academic years (Hmong =
0.58, 0.64, 0.67, Somali = 0.51. 0.58, 0.58, Other = 0.67, 0.70, 0.69, respectively). Overall,
Spanish-speaking students were considered to be proportionately represented when compared to
EPL students across the three academic years (0.95, 1.03, 1.05, respectively). All language
groups had relatively consistent RRs over the three years, although there was variation in some
special education categories for some language groups.

43
Specific Learning Disability
In the special education category of SLD, Spanish- speaking students were
overrepresented across the three academic years (1.60, 1.89, 2.07), and Somali- (0.54, 0.62, 0.59)
and “Other”- (0.64. 0.68, 0.64) speaking students were underrepresented. In 2006-07, Hmong-
speaking students were proportionately represented (1.13), though were overrepresented in 2009-
10 (1.26) and 2012-13 (1.37; Figure 3.3a). RRs over time in the category of SLD increased for
Spanish-, Hmong-, and Somali-speaking students across the three academic years (Table 3.6).
Speech Language Impairment
In the special education category of SLI, representation of Spanish-speaking students was
proportional to English-speaking students across the three academic years (0.94, 1.08, 1.09), and
Hmong-speaking students were proportional to English-speaking students in 2009-10 (0.84), and
2012-13 (0.83). Hmong-speaking students were underrepresented in 2006-07 (0.63; Figure 3.3b).
Somali- and “Other”-speaking students were underrepresented with RR values ranging from
0.40-0.48 for Somali-speaking students, and 0.71-0.78 for “Other”-speaking students across the
three academic years. Although RRs for Spanish-speaking students across the three academic
years indicated proportional representation, the RR’s did slightly increase during those years
(0.94, 1.08, 1.09; Table 3.6).
Emotional Behavioral Disorder
In the special education category of EBD, all language groups were underrepresented
across the three academic years (Table 3.6; Figure 3.3c). Hmong- (0.10, 0.08, 0.09) speaking
students had the greatest risk of underrepresentation in this special education category, followed
by Somali- (0.25, 0.22, 0.22), “Other”- (0.29, 0.28, 0.25), and Spanish- (0.37, 0.37, 0.39)
44
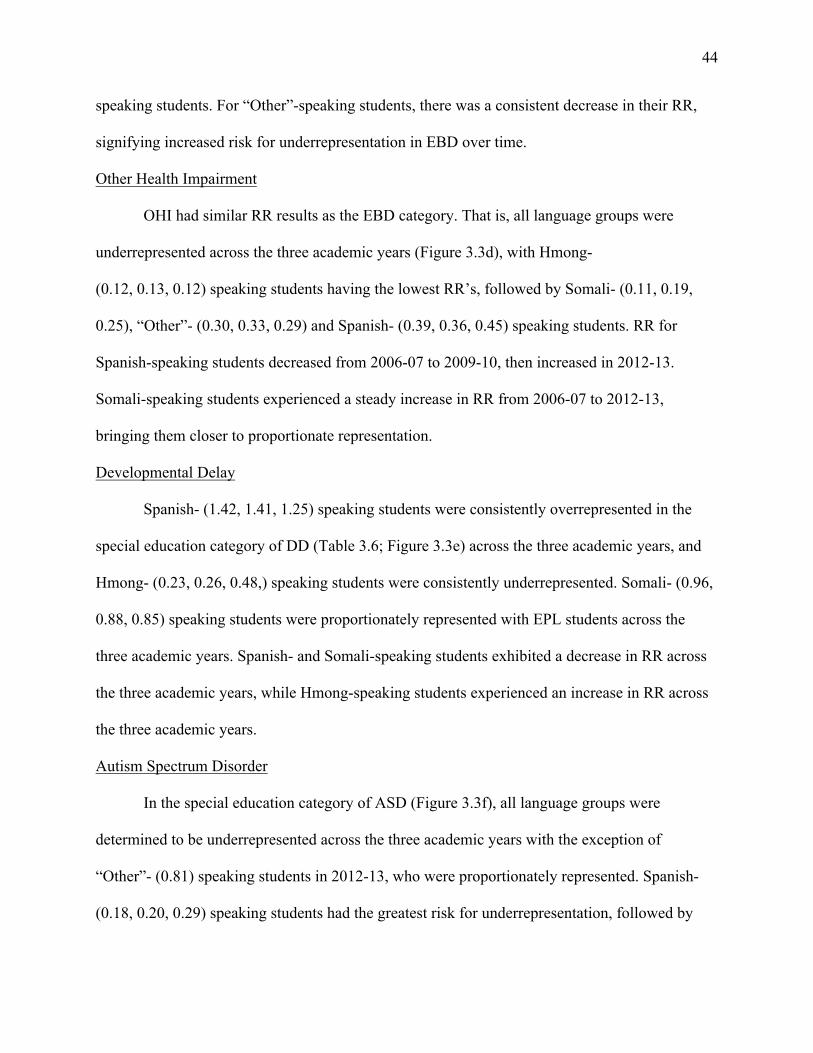
speaking students. For “Other”-speaking students, there was a consistent decrease in their RR,
signifying increased risk for underrepresentation in EBD over time.
Other Health Impairment
OHI had similar RR results as the EBD category. That is, all language groups were
underrepresented across the three academic years (Figure 3.3d), with Hmong-
(0.12, 0.13, 0.12) speaking students having the lowest RR’s, followed by Somali- (0.11, 0.19,
0.25), “Other”- (0.30, 0.33, 0.29) and Spanish- (0.39, 0.36, 0.45) speaking students. RR for
Spanish-speaking students decreased from 2006-07 to 2009-10, then increased in 2012-13.
Somali-speaking students experienced a steady increase in RR from 2006-07 to 2012-13,
bringing them closer to proportionate representation.
Developmental Delay
Spanish- (1.42, 1.41, 1.25) speaking students were consistently overrepresented in the
special education category of DD (Table 3.6; Figure 3.3e) across the three academic years, and
Hmong- (0.23, 0.26, 0.48,) speaking students were consistently underrepresented. Somali- (0.96,
0.88, 0.85) speaking students were proportionately represented with EPL students across the
three academic years. Spanish- and Somali-speaking students exhibited a decrease in RR across
the three academic years, while Hmong-speaking students experienced an increase in RR across
the three academic years.
Autism Spectrum Disorder
In the special education category of ASD (Figure 3.3f), all language groups were
determined to be underrepresented across the three academic years with the exception of
“Other”- (0.81) speaking students in 2012-13, who were proportionately represented. Spanish-
(0.18, 0.20, 0.29) speaking students had the greatest risk for underrepresentation, followed by

45
Hmong- (0.31, 0.40, 0.45), Somali- (0.65, 0.70, 0.70) and “Other”- (0.72, 0.79, 0.81) speaking
students. RRs for all language groups increased across the three academic years, possibly a
positive indicator that they were moving toward proportional representation with EPL students,
especially the Somali-speaking students with a RR of 0.70 in 2012-13.
Deaf/Hard of Hearing
In the special education category of D/HH (Figure 3.3g), all language groups were
determined to be overrepresented when compared to English-speaking students across the three
academic years, with the exception of Somali-speaking students in 2012-13 (Table 3.6). “Other”-
(5.03, 4.79, 4.07) speaking students were overrepresented to the greatest degree, followed by
Hmong- (2.91, 2.97, 3.03), Spanish- (1.39, 1.62, 1.39), and Somali- (1.75, 1.61, 1.18) speaking
students. Hmong-speaking students were the only language group to experience an increase in
RR across the three academic years. Somali- and “Other”-speaking students experienced a
decrease in RR across the three academic years, and Spanish-speaking students experienced an
increase from 2006-07 to 2009-10, then decreased in 2012-13.
Developmental Cognitive Disability Mild
Spanish- (0.80, 0.84, 0.87) speaking students were proportionately represented with
English-speaking students in the category of DCD Mild (Figure 3.3h) across the three academic
years. Somali- speaking students were proportionately represented with English-speaking
students in 2012-13 (0.97), though had been underrepresented in 2006-07 (0.62) and 2009-10
(0.74). Hmong- (0.50, 0.60, 0.57) and “Other”- (0.73, 0.79, 0.79) speaking students were
underrepresented across the three academic years. RRs for Spanish-, Somali-, and “Other”-
speaking students increased from 2006-07 to 2012-13, moving closer to a proportionate value of

46
1.00. RRs for Hmong-speaking students increased from 2006-07 to 2009-10, but then slightly
decreased from 2009-10 to 2012-13 (Table 3.6).
Low Incidence Special Education Categories
Developmental Cognitive Delay Severe
In the special education category of DCD Severe, Spanish-, Hmong-, and “Other”-
speaking students were proportionately represented with EPL students across the three academic
years, and Somali-speaking students were proportionately represented in 2006-07 with EPL
students (Table 3.6). However, from 2006-07 to 2012-13, Somali-speaking students’ RR almost
doubled (1.02, 1.95, respectively) and they were overrepresented when compared to EPL
students. RRs for all language groups increased from 2006-07 to 2012-13 (Table 3.6).
Physical Impairment
Hmong- (0.55, 0.73, 0.77) speaking students were consistently underrepresented in the
special education category of PI across the three academic years. Spanish- and “Other”- speaking
students were underrepresented in 2009-10 (0.77, 0.74, respectively), but proportionately
represented in 2006-07 (0.86, 0.80, respectively) and 2012-13 (0.81, 1.04, respectively). Somali-
speaking students were proportionately represented in 2006-07 (1.06) and 2012-13 (1.19), and
overrepresented in 2009-10 (1.21). RRs for Hmong-speaking students gradually increased across
the three academic years, bringing them closer to proportionate representation with EPL
students. RRs for Spanish- and “Other”- speaking students decreased from 2006-07 to 2009-10,
leading to underrepresentation in 2009-10, but increased to a proportional RR in 2012-13. RRs
for Somali-speaking students spiked from 2006-07 to 2009-10, leading to overrepresentation in
2009-10, however, the group’s RR then decreased in 2012-13, which returned them to the
proportionate range (Table 3.6).

47
Severely Multiply Impaired
In the special education category of SMI, Somali- (1.53, 2.19, 1.72) speaking students
were consistently overrepresented across the three academic years. Hmong-speaking students
were underrepresented in 2012-13 (0.76), and “Other”-speaking students were underrepresented
in 2009-10 (0.63), and 2012-13 (0.76). Spanish-speaking students were proportionately
represented with EPL students across the three academic years (1.13, 1.12, and 1.02). Hmong-
speaking students were proportionately represented in 2006-07 (0.81), and 2009-10 (0.86), and
“Other”-speaking students were proportionately represented in 2006-07 (0.97). RRs over time in
the special education category of SMI revealed a consistent decrease in RR for Spanish-speaking
students, while Hmong- and Somali-speaking students increased from 2006-07 to 2009-10, then
decreased from 2009-10 to 2012-13. “Other”-speaking students showed an opposite trend, where
there was a decrease in RR from 2006-07 to 2009-10, followed by an increase in 2009-10 to
2012-13 (Table 3.6).
Traumatic Brain Injury
In the special education category of TBI, language groups were either proportionately
represented, or underrepresented across the three academic years. Spanish- and Hmong-speaking
students were proportionately represented in 2006-07 (1.02, 1.10, respectively), and
underrepresented in 2009-10 and 2012-13 (Spanish = 0.67, 0.66, Hmong = 0.72, 0.55). Somali-
speaking students were underrepresented in 2006-07 (0.65), and proportionately represented in
2009-10 and 2012-13 (0.97, 1.06, respectively). “Other”- (0.68, 0.44, 0.34) speaking students
were underrepresented across the three academic years. Examination of RRs over time revealed
an increase for Somali-speaking students across the three academic years, and a decrease across
the three academic years for Spanish-, Hmong-, and “Other”-speaking students.

48
Blind-Visually Impaired
Variability in RRs were noted in the special education category of Blind-VI. Spanish-
speaking students were proportionately represented in 2006-07 (1.08) and 2009-10 (1.03), and
overrepresented in 2012-13 (1.22). Hmong-speaking students were overrepresented in 2006-07
(1.22), and underrepresented in 2009-10 and 2012-13 (0.69, 0.66, respectively). Somali-speaking
students were overrepresented in 2006-07 (1.73), underrepresented in 2009-10 (0.74), and then
proportionately represented in 2012-13 (1.00). “Other”-speaking students were overrepresented
in 2006-07 and 2009-10 (2.04, 1.39, respectively), and proportionately represented in 2012-13
(1.06). RRs over time decreased for Hmong- and “Other”-speaking students across the three
academic years. For Spanish- and Somali-speaking students, there was a decrease from 2006-07
to 2009-10, followed by an increase in RR from 2009-10 to 2012-13.
Deaf-Blind
“Other”-speaking students were overrepresented in the special education category Deaf-
Blind with RRs of 4.87, 9.50, and 6.19 across the three academic years, respectively. Spanish-
speaking students were overrepresented in 2009-10 (2.31), Hmong-speaking students were
overrepresented in 2012-13 (1.56), and Somali-speaking students were overrepresented in
2009-10 (1.27), and 2012-13 (2.10). Hmong- and Somali-speaking students were
underrepresented in 2006-07 (0.68, 0.00, respectively), and Hmong-speaking students were also
underrepresented in 2009-10 (0.66). Spanish-speaking students were proportionately represented
to EPL students in 2006-07 (0.95), and 2012-13 (1.16). Somali-speaking students had a gradual
increase in RR from 2006-07 to 2012-13. RRs for Spanish- and “Other”-speaking students
increased from 2006-07 to 2009-10, followed by a decrease from 2009-10 to 2012-13. RRs for

49
Hmong-speaking students decreased from 2006-07 to 2009-10, followed by an increase in 2009-
10 to 2012-13 (Table 3.6).
ANOVA Results
In order to answer question four regarding if there are significant differences in
prevalence rates within and across special education categories, an analysis of variance
(ANOVA) was completed for the 14 special education categories in each of the three academic
years (2006-07, 2009-10, and 2012-13). ANOVA is a form of statistical hypothesis testing that
compares the means, in this case prevalence rates, of two or more groups to determine if there is
a significant difference between the groups.
Results of the ANOVA (Table 3.7) for the academic year 2006-07 indicate significant
differences in language group prevalence rates for 11 out of 14 of the special education
categories – SLD, SLI, EBD, OHI, DD, ASD, DCD Mild, D/HH, PI, Blind-VI, and Deaf-Blind.
This left DCD Severe, SMI, and TBI as the categories that did not have a significant difference
between language groups. In 2009-10, SLD, SLI, EBD, OHI, DD, ASD, DCD Mild, D/HH,
Deaf-Blind, and now DCD Severe and SMI had significant differences in prevalence rates of
language groups. There was no significant difference between language groups in the category of
PI, TBI or Blind-VI (Table 3.7). In 2012-13, there continued to be no significant difference
between language groups in the categories of PI and Blind-VI. Results indicate a significant
difference between language groups in the remaining 12 special education categories (Table 3.7).

50
Table 3.7. Results of the ANOVAs to Compare Language Group (English, Spanish, Hmong, Somali, “Other”) Representativeness in each of the 14 Special Education Categories in the 2006-07, 2009-10, and 2012-13 Academic Years.
2006-07 (df = 4, 1656477)
2009-10 (df = 4, 1646001)
2012-13 (df = 4, 1661187)
Special Education Category
F-Value Level of Significance
F-Value Level of Significance
F-Value Level of Significance
SLD 189.132 0.000 352.448 0.000 527.525 0.000 SLI 74.243 0.000 44.286 0.000 63.218 0.000 EBD 322.357 0.000 342.756 0.000 344.936 0.000 OHI 241.829 0.000 293.072 0.000 329.838 0.000 DD 86.469 0.000 84.313 0.000 50.146 0.000
ASD 115.585 0.000 138.785 0.000 131.208 0.000 DCD Mild 23.196 0.000 13.937 0.000 11.539 0.000
DCD Severe 0.235 0.918 5.108 0.000 8.351 0.000 D/HH 257.620 0.000 258.830 0.000 217.245 0.000
PI 3.388 0.009 3.245 0.011 1.735 0.139 SMI 0.832 0.505 6.972 0.000 4.467 0.001 TBI 0.631 0.640 2.203 0.066 3.526 0.007
Blind-VI 4.127 0.002 1.091 0.359 0.671 0.612 Deaf-Blind 5.691 0.000 26.389 0.000 11.018 0.000
Tukey’s HSD Results for SLD, SLI, ASD, and D/HH
To further explore how language groups differed from each other (Question 5), Tukey’s
Honest Significance Difference (HSD) Test was used. Due to the large amount of data, the post
hoc analysis was limited to the special education categories most closely related to speech-
language pathology (i.e., SLD, SLI, ASD, and D/HH).
Specific Learning Disability
Tukey’s HSD post hoc analysis reported significant differences in prevalence rates
between English-, Spanish-, and Hmong-speaking students, but not between Somali- and
“Other”-speaking students across the three academic years. These results align with risk ratios
for Spanish- and Hmong-speaking students who were overrepresented in SLD, and Somali- and
“Other”-speaking students who were underrepresented in SLD compared to the EPL group

51
(Table 3.8). Results also indicate that prevalence rates between Spanish and Hmong, Spanish and
Somali, Spanish and “Other”, Hmong and Somali, and Hmong and “Other” were significantly
different from each other across the three academic years. One can gain a better understanding of
these differences by reviewing Figure 3.3a.
Table 3.8. Results of Tukey’s HSD Significance Values between Language Groups in SLD in each Academic Year. 2006-07
2009-10 2012-13
English PR = 0.022 Spanish PR = 0.035 Hmong PR = 0.025 Somali PR = 0.012 Other PR = 0.014
English PR = 0.021 Spanish PR = 0.039 Hmong PR = 0.026 Somali PR = 0.013 Other PR = 0.014
English PR = 0.200 Spanish PR = 0.041 Hmong PR = 0.027 Somali PR = 0.012 Other PR = 0.013
Eng. Spa. Hmo. Som. Eng. Spa. Hmo. Som. Eng. Spa. Hmo. Som. Spa. 0.000 -- -- -- 0.000 -- -- -- 0.000 -- -- --
Hmo. 0.000 0.000 -- -- 0.000 0.000 -- -- 0.000 0.000 -- -- Som. 0.000 0.000 0.000 -- 0.000 0.000 0.000 -- 0.000 0.000 0.000 -- Oth. 0.000 0.000 0.000 0.324 0.000 0.000 0.000 0.775 0.000 0.000 0.000 0.866
Speech-Language Impairment
Tukey’s HSD indicated Hmong-, Somali- and “Other”-speaking students were
significantly different from the English-speaking group. In 2006-07, prevalence rates for
Spanish- and English-speaking students were not significantly different from each other, though
over time, prevalence rates for Spanish-speaking students increased, whereas prevalence rates for
English-speaking students decreased resulting in Spanish-speaking students moving toward
significant overrepresentation in 2012-13. Hmong- and “Other”-speaking students were
proportionately represented across the three academic years, though all other language groups
were significantly different from each other (Table 3.9).

52
Table 3.9. Results of Tukey’s HSD Significance Values between Language Groups in SLI in each Academic Year. 2006-07
2009-10 2012-13
English PR = 0.018 Spanish PR = 0.017 Hmong PR = 0.011 Somali PR = 0.007 Other PR = 0.013
English PR = 0.017 Spanish PR = 0.019 Hmong PR = 0.014 Somali PR = 0.008 Other PR = 0.013
English PR = 0.017 Spanish PR = 0.019 Hmong PR = 0.014 Somali PR = 0.008 Other PR = 0.013
Eng. Spa. Hmo. Som. Eng. Spa. Hmo. Som. Eng. Spa. Hmo. Som. Spa 0.259 -- -- -- 0.024 -- -- -- 0.007 -- -- --
Hmo. 0.000 0.000 -- -- 0.000 0.000 -- -- 0.000 0.000 -- -- Som. 0.000 0.000 0.002 -- 0.000 0.000 0.000 -- 0.000 0.000 0.000 -- Oth. 0.000 0.000 0.405 0.000 0.000 0.000 0.704 0.000 0.000 0.000 0.517 0.000
Autism Spectrum Disorder
The post-hoc analysis indicated the EPL group in ASD was significantly different from
the other four language groups. When prevalence rates for ELL groups are reviewed, one finds
that all ELL groups examined are underrepresented, and the difference is significant across the
three academic years. The Spanish- and Hmong-, and Somali- and “Other”- speaking groups
were not significantly different from each other across the three academic years (Table 3.10).
Table 3.10. Results of Tukey’s HSD Significance Values between Language Groups in ASD in each Academic Year. 2006-07
2009-10 2012-13
English PR = 0.007 Spanish PR = 0.002 Hmong PR = 0.001 Somali PR = 0.005 Other PR = 0.005
English PR = 0.010 Spanish PR = 0.004 Hmong PR = 0.002 Somali PR = 0.007 Other PR = 0.008
English PR = 0.011 Spanish PR = 0.005 Hmong PR = 0.003 Somali PR = 0.008 Other PR = 0.009
Eng. Spa Hmo. Som. Eng. Spa. Hmo. Som. Eng. Spa Hmo. Som. Spa. 0.000 -- -- -- 0.000 -- -- -- 0.000 -- -- --
Hmo. 0.000 0.363 -- -- 0.000 0.010 -- -- 0.000 0.030 -- -- Som. 0.000 0.003 0.000 -- 0.000 0.000 0.000 -- 0.000 0.001 0.000 -- Oth. 0.000 0.000 0.000 0.943 0.000 0.000 0.000 0.767 0.000 0.000 0.000 0.350

53
Deaf/Hard of Hearing
The post hoc analysis indicates all language groups were significantly different from the
EPL group in 2006-07 with the exception of Spanish-speaking students. In 2009-10 and 2012-13,
the Somali-speaking group was not significantly different from the English-speaking group,
though the Spanish-, Hmong-, and “Other”-speaking groups were significantly different from the
English-speaking group. A review of prevalence rates in Table 3.2 reveals significant
overrepresentation in this category. Another interesting finding was that Spanish- and Somali-
speaking students were not significantly different from each other across the three academic
years, though Hmong- and “Other”-speaking populations were significantly different from all
language groups across the academic years (Table 3.11).
Table 3.11. Results of Tukey’s HSD Significance Values between Language Groups in D/HH in each Academic Year. 2006-07
2009-10 2012-13
English PR = 0.001 Spanish PR = 0.002 Hmong PR = 0.004 Somali PR = 0.002 Other PR = 0.007
English PR = 0.001 Spanish PR = 0.002 Hmong PR = 0.004 Somali PR = 0.002 Other PR = 0.006
English PR = 0.001 Spanish PR = 0.002 Hmong PR = 0.004 Somali PR = 0.002 Other PR = 0.006
Eng. Spa. Hmo. Som. Eng. Spa. Hmo. Som. Eng. Spa. Hmo. Som. Spa. 0.010 -- -- -- 0.000 -- -- -- 0.002 -- -- --
Hmo. 0.000 0.000 -- -- 0.000 0.000 -- -- 0.000 0.000 -- -- Som. 0.006 0.609 0.000 -- 0.023 1.000 0.000 -- 0.843 0.823 0.000 -- Oth. 0.000 0.000 0.000 0.000 0.000 0.000 0.000 0.000 0.000 0.000 0.000 0.000

54
Chapter IV: Discussion
This retrospective study of prevalence rates in Minnesota public schools extends previous
research by examining proportionality in special education based on home languages rather than
race or socioeconomic status. In addition, five language groups (English, Spanish, Hmong,
Somali, and “Other”), and 14 disability categories were examined, whereas previous researchers
have limited their analysis to one or two language groups, or ELL versus non-ELL, and the high
incidence special education categories (e.g., SLD, SLI, EBD). Finally, data that spans six
academic years were analyzed, which provided a glimpse of academic trends over time.
Results of this study indicate that in the state of Minnesota students are
disproportionately represented in special education based on their home language, with
disproportionality, mainly underrepresentation, occurring in 9 of the 14 special education
categories across all three academic years. In this discussion, I will summarize the findings of
this study, address challenges with disproportionality in general, and with SLD, SLI, ASD, and
D/HH specifically. I will also explore available information on how to resolve the issue of
disproportionality.
Disproportionality in Minnesota Public Schools
Overall, English- and Spanish-speaking students were equally represented in special
education, whereas Somali-, Hmong-, and “Other”- speaking students experienced lower
representation in special education. Although there was an overall decrease in prevalence for
English- and Hmong-speaking students from 2006-07 to 2012-13, and an increase for Spanish-,
Somali-, and “Other”-speaking students, prevalence rates in special education increased for all
language groups in those years. To date, no published study has examined all special education
categories for proportionality of language groups, though studies that examined representation of

55
ELLs in “high-incidence” special education categories have reported overrepresentation of ELL
students (Artiles et al., 2005; Sullivan, 2011).
Disproportionality of ELL students was present in 9 of the 14 special education
categories (SLD, SLI, EBD, OHI, DD, ASD, DCD Mild, D/HH, and Deaf-Blind) across the three
academic years. In SLD, there was overrepresentation of Spanish- and Hmong-speaking
students, and underrepresentation of Somali- and “Other”-speaking students. In SLI, EBD, OHI,
ASD, and DCD Mild, there was significant underrepresentation of ELL students across the three
academic years. In the DD special education category, there was overrepresentation of Spanish-
speaking students, and underrepresentation of Hmong-speaking students across the three
academic years, and in the D/HH special education category there was significant
overrepresentation of Spanish, Hmong, and “Other” language groups. Thus, this study
demonstrates that Minnesota ELL students are not represented in special education to the same
degree as their EPL peers. The question now becomes why this disproportionality exists.
General Disproportionality
Special Education Process
There are many steps in the special education process where potential misidentification of
ELL students as special education students can lead to disproportionate representation. To begin,
the identification process for students in need of special education begins with a referral.
Previous research indicates that not all education professionals are aware of when it is
appropriate to refer an ELL student for special education services, and school district
administrators have acknowledged the difficulty in distinguishing a difference versus a disorder,
though they have not taken action to set guidelines to clarify the definitions for special education
teams (DeMatthews, et al., 2014). Studies have shown that federal, state, and district

56
rules/regulations regarding ELL enrollment in special education are broad and do not give
sufficient information for the identification and assessment process for ELL students as potential
special education students. Therefore, professionals in school settings have various policies and
beliefs about when, why, and how to refer an ELL student for special education (DeMatthews et
al., 2014).
Following a referral, the next step in the special education process is assessment of the
child’s abilities in the area he/she is experiencing difficulty to determine if he/she presents with a
disorder. For special education providers working with children and families who speak
languages other than English, the assessment process may be perceived as complex. It becomes
crucial that the evaluating professional distinguishes a student’s language and cultural
differences from and a biological-cognitive based disorder in order to report an accurate
measurement of the student’s abilities. Standardized assessments typically used to qualify
students for special education services generally do not account for the language development
patterns of a bilingual speaker, the normal language variability of bilingual speakers, and
differences in cultural experiences (Muñoz et al., 2014). Researchers have criticized the use of
standardized assessments for ELL students, stating the test becomes a measure of English-
language proficiency rather than a true assessment measure for the skill area being targeted
(Skiba et al., 2008). In order to truly measure an ELL student’s ability level and need for special
education services, assessment materials, protocols, and procedures should be provided in the
student’s dominate and secondary language, and cultural norms should be considered
(DeMatthews et al., 2014).
Based on assessment results, a student either qualifies for special education services and
an individualized education program (IEP) is developed, or the student does not qualify and

57
he/she resumes attending school in the general education curriculum. Within the general
education curriculum, language-learning programs (e.g., English as a second language; ESL) are
available to support ELL students in English language acquisition. These programs may include
pull-out services where the ELL students attend lessons in an ELL classroom, or push-in
programs where an ELL teacher provides lessons within the general education classroom
(Romero, 2014). More research is needed to determine the extent to which ELL students benefit
from special education and language acquisition programs, if one special education category
(e.g., SLD vs. SLI) provides greater benefit, if enrollment in special education has aversive
effects on ELL students’ social and academic performances overall, and if special education
enrollment impacts a student’s enrollment in ESL services.
State Policies on ESL/Bilingual Education
State policies regarding bilingual education have been examined in previous research to
discern if they impact proportionality of students from different language groups in special
education. In 2001, the Elementary and Secondary Education Act PL 89-10, 79 Stat. 27, 20
U.S.C. ch. 70 was reauthorized as the No Child Left Behind Act (NCLB), PL 107-110 leading to
a shift in the main objective of bilingual education programs from native and home language
maintenance to English acquisition (Romero, 2014). In addition, NCLB “drastically cut funding
for bilingual programs, limited the length of these programs, and did not endorse the three
criteria set up by the Castenda v. Pickard case…” (Romero, 2014, p. 15). The three criteria
established by Castenda v. Pickard included: 1) sound educational theory must be the foundation
of school programs for ELLs; 2) implementation of bilingual programs must include adequate
resources, personnel, and fidelity; and 3) continuous monitoring of student progress in language
acquisition and academic performance to ensure adequate results are achieved (Romero, 2014).

58
With these changes and deviance from “best practice” bilingual education guidelines, it is
arguable that NCLB has failed to adequately support ELLs in the academic setting (Romero,
2014). The present study may provide pivotal data regarding over- and underrepresentation of
ELL students to help guide policy formation in ELL education.
Research has indicated that enrollment in ESL or Bilingual Education (BE) programs
impacts an ELL student’s probability of enrollment in special education programs, especially for
SLD. Shifrer, Muller, and Callahan (2011) reported that students in ESL courses had a 1.55%
greater chance of identification for SLD services in comparison to students who were not
enrolled in ESL services. However, the authors were unable to determine the temporal order of
identification (i.e., was a student in ESL classes before or after being identified with a SLD),
leading them to three hypotheses: 1) English language learning struggles were misperceived as
SLD, 2) ESL placement limited learning opportunities for students resulting in lower
achievement, or 3) a student’s enrollment in ESL services brought them to the attention of
educators increasing their chance of dual identification (Shifrer et al., 2011).
Romero (2014) also reported that in a school district in a southwest state there was a
significantly lower proportion of ELL students identified with a disability in alternative language
services (ALS; a broad term used to describe language programs for ELLs) compared to ELL
students not identified with a disability. Similar to the findings of Shifrer and colleagues (2011),
Romero reported students identified with SLD had a significantly higher representation in ALS
compared to students identified with other primary disability codes. However, similar to Shifrer
and colleagues, a temporal order of enrollment was not established. While the present study does
not test these hypotheses, they add to the body of evidence about the challenges and inequities in
59
serving ELL students. More research is needed to determine causal factors for disproportionality
and risk is greatly needed.
Although the present study clearly shows that disproportionality exists among ELL
students in Minnesota, the state has made some changes. In 2011, the MDE adopted the World-
Class Instructional Design and Assessment (WIDA) standards. These standards emphasize ELL
language development that is focused on academic content areas (e.g., math, social studies), and
uses the Assessing Comprehension and Communication in English State-to-State for English
Language Learners (ACCESS for ELLs), a secure, large-scale English proficiency test to identify
ELL students (Minnesota Minority Education Partnership Inc., 2012). The MDE has established
criteria for ELL identification and English acquisition programs in accordance with NCLB for all
districts to follow. These criteria include: “1) identification and MARSS classification, 2)
placement into a program with an articulated amount and scope of service, 3) parent
communication and engagement, 4) annual assessment of progress in English language
proficiency – ACCESS for ELLs, and 5) Exit and MARSS reclassification” (Al Nouri, 2015, p.
17). Historically, Minnesota has noted a decrease in ELL dropout rates from 17% in 2006 to
10.2% in 2011, though as of 2011 there was still a 6% gap in dropout rates between ELL
students and non-ELL students. With WIDA now implemented, the expectation is the gap
between ELLs and non-ELLs will decrease (Minnesota Minority Education Partnership Inc.,
2012).
ELL student enrollment in language acquisition programs (ESL, BE, ALS) in Minnesota
was beyond the scope of the present study. However, perusal of published research revealed no
studies regarding Minnesota trends for ELL student enrollment in special education and language
acquisition programs. Future research should investigate if a correlation between ELL
60
identification and special education enrollment in Minnesota exists, as previous studies have
noted a relationship in other states (Romero, 2014; Shifrer et al., 2011), and Minnesota has
recently changed their policies regarding ELL programs.
Disproportionality in Special Education Categories
Speech-Language Impairment
SLI is broad special education category that includes articulation, language, fluency,
voice, resonance, and phonological disorders. A speech-language pathologist (SLP) is
responsible for diagnosing and treating children who are classified with a SLI. Standardized,
norm-referenced, and criterion referenced assessments are typically used to determine if a
student has a speech/language disorder. However, if a test is not available, there are other options
available to qualify a student for special education services (Appendix A). In the present study,
Spanish- and English-speaking students were equally represented across the academic years, and
Hmong-, Somali-, and “Other”-speaking students were significantly underrepresented across the
three academic years. These results were consistent with other studies, which found ELL
students (language not specified) to be underrepresented at the elementary district level (Artiles
et al., 2005), and equal representation of ELL students at the district level (Romero, 2014).
The cause of a speech-language disorder is unknown, though the American Speech-
Language-Hearing Association (ASHA) identified potential contributing factors to a preschool
language disorder including family history (genetics), premature birth, low birth-weight, hearing
loss, autism, intellectual disabilities, syndromes (e.g., Down syndrome, Fragile X syndrome),
fetal alcohol spectrum disorder, stroke, brain injury, tumors, cerebral palsy, poor nutrition, and
failure to thrive (ASHA, 2015c). The diagnosis of SLI is made when a child’s language
development is deficient for no apparent reason, he/she demonstrates challenges with articulation

61
and intelligibility, and/or he/she has deviant voice or fluency characteristics. The leading theory
is that disorders that fall under SLI are caused by a combination of genetics and environmental
factors that affect the child’s development (Bishop, 2006).
Diagnosis of an ELL student with SLI is challenging because the SLP must discern what
language characteristics are due to a disorder, and which are due to the student’s bilingual
language status. Unfortunately, bilingual language assessment is rarely realistic because there are
few bilingually trained SLPs, and even if an SLP who speaks the student’s home language is
available, there are limited norm-referenced bilingual assessment materials that can be used to
qualify a student for services (Paradis, 2014). According to ASHA (2014), 5% (7,214 out of
161,163) of audiologists, SLPs, speech-language and hearing scientists, and audiology and SLP
support personnel in the United States identify themselves as bilingual care providers. Of that
5%, 6,491 were ASHA certified SLPs, and 189 were ASHA certified audiologists. In the state of
Minnesota, the Minnesota Speech Language Hearing Association (MSHA; 2013) reported 57
bilingual SLPs and audiologists; 32 Spanish-English bilinguals, 1 Hmong-English bilingual, and
23 “Other” (e.g., ASL, French, German, Mandarin) language bilinguals.
Researchers and SLPs have collaborated to develop dynamic assessment models designed
specifically for bilingual students. In these models, a pre-referral process is recommended where
the SLP will meet with a child to determine his/her language learning potential rather than
current language knowledge, which is intermixed with their cultural experiences. This can be
done through informal assessment/therapy probes where the SLP structures the environment to
determine the level of support the student needs to learn language skills in his/her native
language (with the help of an interpreter), and English. It is important for the SLP to examine the

62
student’s language abilities in all their languages because SLI may only be diagnosed if deficits
are present across all languages (ASHA, 2015c).
The proportionality of Spanish-speaking students to English-speaking students reported
in the present study shows promising results for future proportionality of ELL students. As
mentioned previously, the majority of bilingual SLPs in Minnesota are Spanish-English
bilinguals (MSHA, 2013), and Spanish is the second most common language spoken in the
United States (Ryan, 2013) and in Minnesota. Romero (2014) reported a significant difference
between Spanish bilingual students receiving ALS and their non-Spanish bilingual peers,
hypothesizing the availability of Spanish-English bilingual instructors and resources accounted
for increased enrollment of Spanish-English bilingual students. Proportionality of Spanish- and
English-speaking students in SLI, and increased enrollment of Spanish-speaking students in ALS
are positive indicators that with proper education and training of professionals, and bilingual
resources, ELL students can be identified proportionately for special education services. It is
therefore important to educate, train, and produce materials in other languages to support
proportionality of other language groups.
Specific Learning Disability
SLD is a difficult special education category to study because it encompasses many skill
areas, has varying definitions, and the diagnostic criteria is variable across settings.
Disproportionate identification within the category of SLD is considered a central problem to the
education system because: “(a) Students may be referred to special education in response to
issues other than a learning disability, (b) the identification process may be inconsistent and/or
inaccurate, and (c) the disproportionately under-identified may not receive services” (Shifrer et
al., 2011, p. 247). In the present study, disproportionate representation of ELL students in SLD

63
was found across the three academic years. Spanish- and Hmong-speaking students were
significantly overrepresented, and Somali- and “Other”-speaking students were significantly
underrepresented compared to the EPL population. Findings for Spanish- and Hmong-speaking
students are consistent with those reported in other studies that found overrepresentation of ELLs
in SLD at the district level (Artiles et al., 2005; Romero, 2014), and at the state level (Sullivan,
2011). However, the finding that Somali- and “Other”- speaking students were underrepresented
indicates the importance of examining proportionality among specific language groups rather
than aggregating findings for all ELL students. Indeed, disproportionate representation that
varies across language groups strongly suggests that there are different variables that influence
over- versus underrepresentation of each language group.
The cause of SLD is unknown, though the dominant assumption is “some children have
biologically-based cognitive deficits or cognitive dysfunctions that hinder their adequate
acquisition of fundamental academic skills” (Büttner & Hasselhorn, 2011, p. 78-79). However,
researchers have not been able to link specific cognitive dysfunctions directly to SLDs, and there
is uncertainty if identified cognitive deficits cause SLDs, are a result of SLDs, or are a covariate
of the overall disability (Büttner & Hasselhorn, 2011).
For education professionals, the task of identifying an ELL student as having a learning
disability is challenging for three reasons. First, there are overlapping characteristics of ELL and
SLD students that make it difficult to discern the cause of a student’s challenges (Ortiz, 1997).
These characteristics may include errors in the student’s syntax or pragmatics, challenges with
literacy-related activities (e.g., problem solving, synthesis, analysis of information), and
difficulties with narrative activities (e.g., organization of information, sequencing of events,
drawing conclusions, and evaluating actions). Both ELL students and students with SLD may

64
have difficulties in these academic areas, though the reason for the difficulty is different and thus
intervention should be structured appropriately to address the child’s root problem (Ortiz, 1997).
The second reason that accurately identifying ELLs with SLD is challenging is that
education providers must indicate the student’s current level of English proficiency, which may
be difficult to determine by simply interviewing the student or asking the parent or teacher. Two
general levels of language proficiency have been identified: Basic Interpersonal Communication
Skills (BICS), and Cognitive Academic Language Proficiency (CALP). BICS are a student’s
ability to communicate with his/her peers and use a language fluidly in general conversation.
Typically, social conversations are centered on an immediate context, require a lower cognitive
demand, and the language is not specialized allowing students to develop BICS within six-
months to two-years of immersion in a new language (Ohio University, n.d.; Ortiz, 1997).
CALP, on the other hand, is the student’s ability to use verbal and written language to learn
complex material and abstract concepts, which typically takes between five to seven-years for a
student to develop (Ohio University, n.d.). Therefore, teachers may observe a student in general
conversation and perceive their language skills to be “proficient” when, in fact, they are not at a
level to use their second language for academic learning (Shifrer et al., 2011).
A third reason that correctly categorizing an ELL student as SLD is challenging is
because there are no clear definitions or criteria used to identify students with SLD, and this is
amplified when a student is an ELL (See Appendix A for Minnesota diagnostic criteria; Pérez et
al., 2008). In the 1997 reauthorization of IDEA, it was mandated that the diagnosis of SLD could
not be associated with “cultural factors, environmental or economic disadvantage, or being of
limited English proficiency” (Shifrer et al., 2011, p. 247), though no information was provided
regarding educational practices after an ELL student was identified with a disability (Romero,

65
2014). Thus, the correlation of limited English proficiency and low academic achievement
continues to put some ELL students at risk for overrepresentation in this category. However, as
the present study highlights with the underrepresentation of Somali and “Other”-speaking
students in SLD, examination of proportionality based on specific language groups, rather than
“ELL versus non-ELL”, is important because differences in prevalence rates may be noted based
on language. This information is valuable for education professionals and policy makers to
discern which specific language groups need further investigation regarding special education
identification and assessment processes.
Currently, students are often identified with SLD through a process known as Response
to Intervention (RTI). RTI includes a three-tier system that includes supports within a classroom
setting before a student is referred for special education (Romero, 2014). In Tier I, all students
are monitored for learning progress. Students noted to have difficulty with learning may advance
to Tier II, which involves small group sessions that supplement the core curriculum. If
difficulties continue to persist, a school psychologist may become involved along with the
child’s family to determine if there is an underlying disorder that impacts the child’s learning
abilities (Romero, 2014). Before a child is diagnosed with SLD, other causes of learning
difficulty (e.g., emotional disorders, intellectual disabilities, developmental delay, brain diseases,
etc.) must be ruled out with medical examinations and speech/language assessments (Eunice
Kennedy Shriver National Institute of Child Health and Human Development, 2014).
Through RTI, a team approach is crucial to assisting students in need of extra support in
the classroom. Ideally, the team should consist of professionals with varying views,
backgrounds, and perceptions so different opinions regarding the child’s status may be evaluated,
and thus reduce bias in referrals to special education (Romero, 2014). Bos and Reyes (1996; as

66
cited in Romero, 2014), reported four interactive teaching strategies a team may use in Tier I or
II to support CLD students. These strategies include: a) use of a natural approach to language
acquisition involving play and discovery, b) incorporation of sociocultural experiences, c)
practice English skills with peers of varying skill levels, and d) use of direct instruction and
practice to generalize skills.
Another interesting trend noted in this study and previous research (Romero, 2014) was
that ELL students had greater prevalence rates in the category of SLD in comparison to SLI, a
special education category for difficulties with language. It is possible that ELL students are
referred for SLD because they struggle with learning specific topics that require understanding of
complex, abstract concepts (e.g., math, science) as a result of a language barrier (i.e., acquisition
of CALP), or that ELL students may have difficulty mastering reading/writing in English. More
research is needed to determine what factors influence the prevalence rate of ELL students in the
SLD category, if SLD services are beneficial/necessary for learning, and if there is a differential
performance when ELL students are categorized as SLD versus SLI.
Overall, more research is needed in the category of SLD to determine trends on a larger
scale (i.e., at the national level), on a smaller scale (i.e., at the district level), and to determine
patterns in other states. Data analysis at the national level would provide an understanding of
how the U.S. is doing as a whole in identifying ELL students for special education, and may set a
benchmark for comparison to smaller scale analyses. District level analysis would help increase
professionals’ awareness of the proportionality of their students in special education, and perhaps
provide administrators with valuable information to guide their policy decisions. All educators
would become more aware and more accountable in the referral, assessment, and intervention
process. Finally, state level analysis would be beneficial because it would allow for comparison
67
of proportionality between states. Because there are no federal laws mandating the use of
specific assessments or intervention processes for ELL students, a comparison of state referral
and assessment programs, in conjunction with the examination of the proportion of ELL students
in special education, would be beneficial in identifying optimal referral and assessment
protocols.
Autism Spectrum Disorder
ASD has gained the attention of medical and educational professionals as awareness of
this disorder has increased among the general public, and as the national prevalence rate of ASD
has increased from 1 in 150 children in 2000, to 1 in 68 in 2010 (Center for Disease Control and
Prevention, 2015). Results of this study indicate that in the state of Minnesota, English-speaking
students had the highest prevalence rates in ASD, followed by “Other”-, Somali-, Spanish-, and
Hmong-speaking students. There were significant differences between all language groups in this
category.
Research has dispelled the ideas that parents and vaccinations cause ASD (National
Institute of Neurological Disorders and Stroke, 2015). The leading hypothesis for the etiology of
this developmental disability includes genetic components that impact brain development, which
in turn impact a child’s communication skills (National Institute of Neurological Disorders and
Stroke, 2015). Autism is a spectrum disorder, meaning symptoms and severity vary across
individuals, making it difficult to diagnosis. A child’s primary care doctor is often responsible
for completing behavioral, psychological, genetic, and neurological assessments to make an ASD
diagnosis, though ideally a team approach would be used that includes an SLP, occupational
therapist, physician, and psychologist (ASHA, 2015a). Generally, a child’s home language does
not impact their diagnosis of ASD because a professional is able to observe a child’s behaviors

68
(e.g., repetitive behaviors, increased sensory awareness, rigidity to routine) and communication
overall (e.g., use of eye contact, topic initiations, and response to interactions) to make a
diagnosis (Hewitt et al., 2013). However, language barriers are a concern when communicating
effectively with parents to ensure they understand the diagnosis and intervention options
available.
In Minnesota, the Somali population has stood out in the ASD special education category
due to the perception that Somali students were being identified with ASD at a higher rate than
other racial/ethnic groups. Due to civil war in Somalia, thousands of Somali refugees migrated to
Minnesota in the 1990’s and since that time their families have joined them making Minnesota
home to the largest Somali population in the U.S. (Hewitt et al., 2013). Within this large Somali
community, parents and professionals became concerned that Somali students were being
identified with ASD at a greater rate than other racial/ethnic groups. This led to the development
of the Minneapolis Somali Autism Spectrum Disorder Prevalence Project (Hewitt et al.).
The Minneapolis project involved calculation of prevalence rates of school aged children
amongst different racial/ethnic groups (Somali, White, Black, Hispanic) in the state of Minnesota
by reviewing records from schools and pediatric clinics, and then having clinicians skilled in
ASD confirm the diagnosis. Results of the Minneapolis project were consistent with the present
study: English (White) students had the highest prevalence rate (1 in 36) followed by Somali (1
in 32), Black (1 in 62), and Hispanic (1 in 80). The Minneapolis Project also examined the
number of students in ASD who had a secondary diagnosis of intellectual disability and found
that 100% of Somali students examined with ASD had an intellectual disability, compared to
20% of White students, 30% of Black students, and 22% of Hispanic students.

69
Similar to the present study, the Minneapolis Project was only able to speculate about
why these differences occurred in Minneapolis ethnic/racial groups. One speculation from the
Minneapolis project included the idea that Somali students present with more severe forms of
ASD, which makes it easier, and perhaps more urgent, to identify them compared to children
with milder forms of the disorder. Additional support for this hypothesis was presented in a study
by Estrem and Zhang (2010) who found the mean age of entry into the ASD special education
category was earlier for Somali-speakers (6.46 years) compare to English-speakers (10.53 years).
More research is needed to determine if there is a difference in symptoms/severity across
racial/ethnic/language populations that could account for disproportionality patterns observed.
Looking at Somali-speaking students prevalence rates in other categories, it was noted
they were underrepresented in the SLD and SLI special education categories, and had high
representation in the SMI special education category compared to other language groups in this
study. One hypothesis for these findings is the role of culture in parenting and perspectives of
developmental disabilities. In Somali culture, there is a taboo surrounding intellectual,
developmental, or mental health disabilities. In fact, there are only two words to describe a
person’s mental health in Somali, “crazy” and “sane” (Hewitt et al., 2013). Therefore, for
disabilities that are “invisible” or subtle and academically linked (e.g., SLD, SLI), Somali
parents may not be aware of the academic difficulties their child is experiencing, believe in the
remediation process, and/or pursue outside services. On the other hand, for health conditions that
present with more severe and overt signs/symptoms, Somali parents may be more willing to seek
help from outside resources. More information is needed in the potential causes of more severe
disabilities, their possible relation to genetics, race, or immigration, and understanding the

70
Somali culture to shed light on the prevalence rate trends observed in the present and previous
studies.
Deaf/Hard of Hearing
The special education category of D/HH has not been investigated in previous
proportionality research, presumably because it is considered an objective, low incidence
category (Artiles et al., 2010). D/HH was studied specifically in this project because it is
pertinent to speech-language pathology. Results indicate Hmong- and “Other”-speaking students
were significantly overrepresented in D/HH compared to English-, Spanish-, and Somali-
speaking students. These results were consistent with a study done in 2002 at the University of
Minnesota, which reported Hmong-speaking students made up 40% of the D/HH population in
the St. Paul school district (Wathum-Ocama & Rose, 2002).
The American Speech-Language-Hearing Association (2015b) states genetic factors
(heredity) account for 50% of all cases of hearing loss. With genetic mutations, a child may be
born with a hearing loss, or lose their hearing as they mature. The majority of genetic hearing
loss can be attributed to autosomal recessive (70% of cases) or autosomal dominate (15% of
cases) patterns of inheritance, but in rare cases x-linked or mitochondrial inheritance patterns
have also been observed (ASHA, 2015b). Researchers and health care professionals have
identified genetic syndromes that typically include hearing loss, such as Down Syndrome, Usher
Syndrome, Treacher Collins Syndrome, Crouzon Syndrome, Alpert Syndrome, and
Waardenburg Syndrome (ASHA, 2015b). In addition to genetic factors, there are other, non-
genetic factors that may cause congenital hearing loss, including maternal infections (rubella,
cytomegalovirus), prematurity, low birth weight, birth injuries, toxins (e.g., drugs, alcohol)
71
consumed during pregnancy, maternal diabetes, toxemia during pregnancy, and/or lack of
oxygen (anemia; ASHA, 2015b).
All 50 states have established an Early Hearing Detection and Intervention program, and
43 states plus the District of Columbia and Puerto Rico have formed state laws that mandate
newborns be screened for hearing loss (National Institute of Health, 2010). However, rules and
regulations in other countries vary on hearing screenings, and when people immigrate to the U.S.
the mandatory medical evaluation performed prior to entering the country does not include a
hearing evaluation. Therefore, immigrant children may not have their hearing assessed until it is
performed in the school setting in the U.S. (Pape, Kennedy, Kaf, & Zahirsha, 2014).
Researchers have reported that families leave their home country for the United States
because they suspect or have confirmed that their child has a hearing loss and they believe the
opportunities, resources, and services for their child with a hearing loss will be greater in the
U.S., and their child will face less discrimination (Steinberg, Bain, Li, Delgado, & Ruperto,
2003). In other countries, and even in certain areas of the United States, hearing loss
identification may be challenging due to a lack of hearing professionals, lack of organized
national newborn hearing screening databases, and limited medical care in rural areas, resulting
in challenges with evaluating children and providing follow-up care for hearing intervention
(Pape et al., 2014). For example, in Mexico children are typically identified with hearing loss at
the age of 42- months, an age when their language skills should be rapidly developing (Pape et
al., 2014). As mentioned previously, late identification of hearing loss potentially results in
children with delayed speech, language and cognitive skills, which may have long lasting
consequences. For minority children with hearing loss in the U.S., research has indicated that

72
achievement levels of D/HH children are significantly lower compared to the majority
population (Wathum-Ocama & Rose, 2002).
Because the diagnosis of a hearing loss requires objective measures (see Appendix A for
Minnesota diagnostic criteria), more research is needed to determine proportionality of hearing
loss across race/ethnic groups, and determine why disproportionality exists. Research in this area
may include examination of genetic factors, environmental factors, and craniofacial
development. Of particular interest is the high prevalence rate of Hmong- and “Other”-speaking
students in D/HH compared to the other language groups. Due to the mixed nature of the “Other"
language category, it is difficult to speculate on the reason for their overrepresentation. However,
for the Hmong-speaking group there are two hypotheses that future research may investigate.
The first hypothesis to investigate is the prevalence of home births versus hospital births
in the Hmong community. Olusanya and Somefun (2009) investigated the relationship of
sensorineural hearing loss (SNHL) and birth location in infants from Lagos, Nigeria. Their
results indicate a significant difference in the prevalence of SNHL based on birth location, with
prevalence rates of SNHL ranging from to 4.0 per 1000 for infants born in government based
hospitals, to 23 per 1000 for infants born in family homes. The authors also noted that mothers
who gave birth outside of the hospital setting preferred to use herbal medication in pregnancy,
deliver vaginally, and did not have skilled attendants present at delivery. Therefore, there are
multiple factors present in Olusanya’s and Somefun’s study that could account for the increased
prevalence of SNHL in births outside the hospital. More research is needed in this area, and it
may be worth investigating birthing beliefs and trends in the Hmong-speaking populations to
determine if similar patterns exist that may account for the high prevalence rates in D/HH
reported in the present study.

73
A second hypothesis to investigate is the access Hmong families have to medical
services. Huang, Yu, and Ledsky (2006) analyzed the 1999 National Survey of America’s
Families (NSAF) Child Public Use File (N = 35,938) to determine the relationship of citizenship
status, health status, and demographic characteristics to health care access. Results of their study
indicate that “parental citizenship status plays a strong role in children’s health care access”
(Huang, Yu, & Ledsky, 2006, p. 637). In fact, foreign-born, noncitizen children were four times
more likely to lack health care insurance coverage, 40% less likely to have visited a doctor in the
previous year, and twice as likely to lack a usual source of care when compared to native-born
children (Huang et al., 2006). Even children who were born in the U.S. but who have immigrant
parents were found to have declining rates of health insurance coverage (Huang et al., 2006). In
the case of hearing, continued medical care is important because hearing loss may be caused by
treatable conditions (e.g., gradual buildup of cerumen, otitis media; Mayo Clinic Staff, 2015). If
families do not have access to a usual source of care, a child may then be at increased risk for
hearing loss, which may explain the increased prevalence of Hmong and “Other” language
populations. More research is needed to determine the validity of this hypothesis.
Resolution of Disproportionality
The issue of disproportionality is complex. Yet, several authors have described how to
resolve the issue in the special education system. First, it is crucial that education professionals
understand what disproportionality is and why it is a problem. In order to do this, research
studies such as this need to be completed to identify the problem and raise awareness. In
addition, proportionality studies should serve as a baseline measure to compare progress over
time (Skiba et al., 2008). Second, education professionals and policy makers must be open to
discussing proportionality research results, and hold in-depth, open conversations regarding the

74
impact a student’s race, ethnicity, gender, socioeconomic status, culture, and language have on
the potential or risk for special education identification (Skiba et al., 2008). Third, it is important
for education professionals to diversify the curriculum to cater to all their students. This may
include incorporation of content and instructional materials that take into account the experiences
and history of students from diverse culture and language backgrounds. By incorporating
materials that pertain to a student’s cultural/linguistic background, the student will find greater
meaning in the lesson, and be able to form a connection between what they are learning in school
and what they are learning in their home. This may help to alleviate some difficulties students of
culturally and linguistically diverse backgrounds face in the academic setting. Teachers can also
create an academic environment that fosters the feeling of empowerment, reflection, and analysis
in their students (Salend & Garrick Duhaney, 2005).
A fourth component in the resolution of disproportionality within special education is the
inclusion of the family and community in the academic setting. Research has indicated that the
participation of families in school-based activities has a positive impact on a child’s academic
and social performance (Salend & Garrick Duhaney, 2005; Skiba et al., 2008; Wathum-Ocama &
Rose, 2002). A meta-analysis conducted by Guiberson (2009) indicated the majority of Hispanic
parents were satisfied with special education services. However, 17% of parents surveyed
reported they were mostly or entirely unsatisfied with special education. According to survey
results, Hispanic parents reported being confused with the special education assessment and
classification process, receiving limited contact from the school, believing school professionals
demonstrated minimal effort for intervention, and perceiving school professionals as having
negative attitudes toward their child and themselves. A qualitative study with Hmong parents of
a child with hearing loss indicated parents did not know their legal rights in terms of special

75
education services, parents were frustrated by the need of a translator to communicate with
school personnel, and parents had limited participation in academic events (Wathum-Ocama &
Rose, 2002). Results such as these indicate that efforts need to be taken to educate families about
the special education process, their role on the special education team, and the legal rights they
have to special education services.
In terms of special education identification, training of more CLD education
professionals should be promoted to allow increased diversity in multidisciplinary education
teams. In addition, all members should receive ongoing education on cultural and linguistic
differences they may see within the student body. A high-quality pre-referral process should also
be developed in the school setting. Within the pre-referral process, the education professional
should take into account the student’s strengths and needs, his/her educational and social issues,
medical history, the student’s experiential, cultural, and linguistic background, and the family’s
and teacher’s perspective of the student’s performance (Salend & Garrick Duhaney, 2005).
Documentation of the student’s performance in multiple classroom-based educational
interventions should be completed prior to a referral to special education (Skiba et al., 2008).
If educational intervention strategies within the classroom do not meet the student’s
needs, a referral to special education may be warranted and further assessment would be needed
to determine if the student has a biological-cognitive condition that impacts his/her learning
abilities. However, as mentioned above, standardized assessments do not meet the needs of the
majority of bilingual students. Alternatives to standardized assessments cited in research include:
performance and portfolio assessment, curriculum-based measurements, rubrics, dynamic
assessments, learning logs and student journals, think-alouds, and self-evaluation techniques
(Salend & Garrick Duhaney, 2005). In addition, assessment procedures should focus on context

76
to provide the education professional a better understanding of a student’s academic or
behavioral difficulty (Skiba et al., 2008).
Following the classification of a student in a special education category, the education
professional needs to continue taking into account the cultural and linguistic background of the
student to ensure special education services provide optimal benefits to the student. There is
limited research regarding the effectiveness of special education intervention for ELL students,
signifying that more information is needed to determine approaches that best meet the needs of
CLD students.
Limitations
This study included a state-level analysis of enrollment in special education based on
home language. Previous research including state and district level analysis has indicated that a
small proportion of districts that have special education identification practices that result in
increased risk for disproportionate representation of subgroups can strongly affect statewide rates
of identification (Sullivan, 2011). Therefore, it is inappropriate to assume that because
disproportionality is indicated at the statewide level that all school districts are practicing
inappropriate identification measures. On the other hand, disproportionality that is not indicated
at the state level may still be a concern within a district (Skiba et al., 2008). Further research is
needed to determine which Minnesota districts in particular have challenges with
disproportionality, which language groups are affected, and which special education categories
have disproportionate representation so remediation procedures can be implemented
appropriately.
A second limitation to this study includes the generalizability of the results to other states
or the national level. Though federal laws mandate programs for ELL students and their rights to

77
special education services as needed, there are no federal regulations outlining general ELL
identification or language acquisition programs, nor the assessments and intervention techniques
used for identifying and supporting ELL students with disabilities. As a result, states and districts
are responsible for developing programs appropriate for their student populations. Therefore,
research studies conducted in different states may report trends that vary from what was
observed in the present study. It is important to identify these differences and discern what is
different between states to support optimal education, identification, assessment, and treatment
of ELL students.
Finally, this study did not delve into why there was a disproportionate representation of
students based on home language in Minnesota special education programs, or how ELL students
perform in special education programs. Ideally, the special education identification process
would not have professional bias, mislabeling of students, or students who “fall through the
cracks” and do not get needed services. Additional factors, such as students’ demographic
information, family involvement, language acquisition services, professional’s education, and
assessment procedures should be examined at the local level to determine the reason behind
disproportionality. In addition, there is a perception that special education services are more
important than language acquisition services for ELL students, often resulting in ELL students
receiving only special education services and no extra language support (Romero, 2014).
However, this study and other similar studies have not explored how a bilingual child responds
to special education services compared to language acquisition programs.

78
Chapter V: Conclusion
Results of this study indicate that in the state of Minnesota, there is both under- and
overrepresentation of students in special education based on home language. The four special
education categories examined more thoroughly (SLD, SLI, ASD, and D/HH) indicate that
different language groups are at risk for over- and underrepresentation, and this varies with
special education category. Prevalence rates and RRs over time for each language group were
fairly consistent from 2006-07 to 2012-13. Further research is needed to determine what
Minnesota districts in particular are experiencing challenges in disproportionality based on home
language, and if the trends are similar to what is observed in other states and at the national level.
In addition, more information is needed to determine why disproportionality exists
(e.g., educational professional bias, poor assessment materials, genetic factors, immigration
status) so policies can be put in place to educate professionals about, and enforce appropriate
identification of students for special education services. It is crucial that information regarding
disproportionality be discussed amongst education professionals and policy makers to increase
understanding of the problem, and promote collaboration in devising plans to resolve the
problem one district at a time.

79
References
Al Nouri, B. (2015). Overview of Minnesota English learner education program requirements.
Minnesota Department of Education, [PowerPoint slides]. Retrieved from:
http://static1.squarespace.com/static/547c987ae4b05e2320dfe857/t/55283020e4b09a5f8a
b321a3/1428697120841/EL+Prog+RqrMinnesotats+3+19+2015+%281%29.pdf
American Speech Language Hearing Association (ASHA; 2014). Demographic profile of ASHA
members providing bilingual services December 2014. Retrieved from:
http://www.asha.org/uploadedFiles/Demographic-Profile-Bilingual-Spanish-Service-
Members.pdf
American Speech Language Hearing Association (ASHA; 2015a). Autism (autism spectrum
disorder). Retrieved from: http://www.asha.org/public/speech/disorders
/Autism.htm#three
American Speech Language Hearing Association (ASHA; 2015b). Hearing loss at birth
(congenital hearing loss). Retrieved from: http://www.asha.org/public/hearing
/Congenital-Hearing-Loss/
American Speech Language Hearing Association (ASHA; 2015c). Preschool language disorders.
Retrieved from: http://www.asha.org/public/speech/disorders/Preschool-Language-
Disorders/#causes
Artiles, A.J., Kozleski, E.B., Trent, S.C., Osher, D., & Ortiz, A. (2010). Justifying and explaining
disproportionality, 1968-2008: A critique of underlying views of culture. Exceptional
Children, 76(3), 279-299.
Artiles, A. J., Rueda, R. Salazar, J.J., & Higareda, I. (2005). Within-group diversity in minority
disproportionate representation: English language learners in urban school districts.
Exceptional Children, 71(3), 283-300.

80
Bailey, D. J., Hebbeler, K., Scarborough, A., Spiker, D., & Mallik, S. (2004). First experiences
with early intervention: A national perspective. Pediatrics, 113(4 Part 1), 887-896.
Bailey, D., & Wolery, M. (1992). Teaching infants and preschoolers with disabilities (2 ed., pp.
1-12). New York: Macmillan Publishing Company.
Bishop, D.V. M. (2006). What causes specific language impairment in children? Current
Directions in Psychological Sciences, 15(5), 217-221. doi: 10.1111/j.1467-
8721.2006.00439.x
Bollmer, J., Bethel, J., Garrison-Mogren, R., & Brauen, M. (2007). Using the risk ratio to
assess racial/ethnic disproportionality in special education at the school-district level. The
Journal of Special Education, 41(3), 186–198.
Büttner, G., & Hasselhorn, M. (2011). Learning Disabilities: Debates on definitions,
causes, subtypes, and responses. International Journal of Disability, Development &
Education, 58(1), 75-87. doi:10.1080/1034912X.2011.548476
Center for Disease Control and Prevention (2015). Autism spectrum disorder (ASD)
data and statistics. Retrieved from: http://www.cdc.gov/ncbddd/autism/data.html
Center for Equity and Excellence in Education. (2009). The over-representation and under-
representation of minority students in special education and gifted and talented programs.
Mid-Atlantic Equity Center. Retrieved from: http://files.eric.ed.gov/fulltext
/ED543517.pdf
Coutinho, M. J., & Oswald, D. P. (2000). Disproportionate representation in special
education: A synthesis and recommendations. Journal of Child & Family Studies, 9(2),
135-156.

81
DeMatthews, D.E., Edwards, D.B., & Nelson, T.E. (2014). Identification problems: US special
education eligibility for English language learners, 68, 27-34. doi:
http://dx.doi.org/10.1010/j.ijer.2014.08.002
Dimayuga-Bruggeman, E. & Schleicher, L. (2014). New English learner education legislation:
2014 legislative session. Minnesota Department of Education [PowerPoint slides].
Retrieved from: http://www.Minnesotaasa.org/cms/lib6/Minnesota07001305/
Centricity/Domain/38/New%20English%20Learner%20Education.pdf
Estrem, T., & Zhang, S. (2010). Prevalence and disproportionality of autism spectrum disorders
among English language learners in Minnesota. Multiple Voices for Ethnically Diverse
Exceptional Learners, 12(2), 5-20.
Eunice Kennedy Shriver National Institute of Child Health and Human Development (2014).
How are learning disabilities diagnosed? Retrieved from:
https://www.nichd.nih.gov/health/topics/learning/conditioninfo/Pages/diagnosed.aspx
Guiberson, M. (2009). Hispanic representation in special education: Patterns and implications.
University of Northern Colorado, 53(3), 167-176.
Hammer, C. S., Detwiler, J. S., Detwiler, J., Blood, G. W., & Qualls, C. D. (2004). Speech-
language pathologists' training and confidence in serving Spanish-English bilingual
children. Journal of Communication Disorders, 37(2), 91-108.
doi:10.1016/j.jcomdis.2003.07.002
Hewitt, A., Gulaid, A., Hamre, K., Esler, A., Punyko, J., Reichle, J., & Reiff, M. (2013).
Minneapolis Somali autism spectrum disorder prevalence project: Community report
2013. Minneapolis, Minnesota: University of Minnesota, Institutes on Community
Integration, Research and Training Center on Community Living.

82
Huang, Z.J., Yu, S., & Ledsky, R. (2006). Health status and health service access and use among
children in U.S. immigrant families. American Journal of Public Health, 96(4), 634-640.
Retrieved from: http://www.ncbi.nlm.nih.gov/pmc/articles/PMC1470552/
pdf/0960634.pdf
Komenski, R., Jamienson, A., & Martinez, G. (2001). At risk condition of U.S. school-age
children. [Working paper series No. 52]. Washington, D.C.: U.S. Bureau of the Census,
Population Division.
Konstantin, N., Eleni, F., Evangelos, K., Paraskevi, G., Vasilis, T., & Maria, S. (2014). Parental
satisfaction with early intervention services for children with visual impairments and
multiple disabilities in Greece. Journal of Physical Education & Sport, 14(1), 60-65.
Mayo Clinic Staff (2015). Diseases and conditions: Hearing loss. Retrieved from:
http://www.mayoclinic.org/diseases-conditions/hearing-loss/basics/causes/con-20027684
Minnesota Department of Education (2013-2014). Fall enrollment by home primary
language by district. Retrieved from: http://w20.education.state/
.Minnesota.us/ibi_apps/WFServlet?IBIF_ex=mdea_ddl_driver&TOPICID=2&DDL_VA
RS=4&NoCache=14.44.15
Minnesota Department of Education (2012). Eligibility criteria. Retrieved from:
http://education.state.Minnesota/.us/MDE/SchSup/ComplAssist/Monitoring/Checklists/
Minnesota Minority Education Partnership, Inc. (2012). English learners in Minnesota schools:
Key policy issues to accelerate academic achievement for more English learners in
Minnesota [Policy Brief]. Retrieved from: http://Minnesotaeep.org/wp-
content/uploads/2015/02/el.pdf
83
Minnesota Speech-Language Hearing Association (2013). Bilingual speech-language
pathologists and audiologists in Minnesota. Retrieved from:
www.msha.net/resource/resmgr/.../MSHA_BilingualProfsinMinnesota.doc
Muñoz, M.L., White, M., & Horton-Ikard, R. (2014). The identification conundrum. The ASHA
Leader, 19, 48-53. doi: 10.1044/leader.FTR3.19112014.48
National Institutes of Health (NIH; 2010). Newborn Hearing Screening [Fact Sheet].
Retrieved from: http://report.nih.gov/NIHfactsheets/Pdfs/Newborn
HearingScreening(NIDCD).pdf
National Institute of Neurological Disorders and Stroke (2015). Autism spectrum
disorder [Fact Sheet]. Retrieved from: http://www.ninds.nih.gov/disorders/
autism/detail_autism.htm
Ohio University (n.d.) BICS & CALP. Retrieved from: http://linguistics.ohio.edu/opie/wp-
content/uploads/2014/03/BICS-and-CALPS.pdf
Olusanya, B.O., & Somefun, A.O. (2009). Place of birth and characteristics of infants with
congenital and early-onset hearing loss in a developing country. International Journal of
Pediatric Otorhinolaryngology, 73, 1263-1269. doi: 10.1016/j.ijporl.2009.05.018
Orfield, G., & Lee, C. (2007). Historic reversals, accelerating re-segregation, and the need for
new integration strategies. The Civil Rights Project, 1-49. Retrieved from:
http://files.eric.ed.gov/fulltext/ED500611.pdf
Ortiz, A. (1997). Learning disabilities occurring concomitantly with linguistic differences.
Journal of Learning Disabilities, 30(3), 321-33.

84
Oswald, D.P., Coutinho, M.J., Best, A.M., & Singh, N.N. (1999). Ethnic representation in
special education: The influence of school-related economic and demographic variables.
The Journal of Special Education, 32(1), 194-206.
Pape, L., Kennedy, K., Kaf, W., & Zahirsha, Z. (2014). Immigration within the
United States: Prevalence of childhood hearing loss revisited. American Journal of
Audiology, 23, 238-241. doi: 10.1044/2014_AJA-13-0058
Paradis, J. (2014). Discriminating children with SLI among English language-learners.
Clinical Research Education Library. doi: 10.1044/cred-pvd-c14002
Paul, R., & Norbury, C.F. (2012). Child language disorders in a pluralistic society. In
Language disorders from infancy through adolescence: Listening, speaking, reading,
writing, and communicating (Fourth edition, p. 137-182). St. Louis: Elsevier Mosby.
Pérez, B., Skiba, R.J., & Chung, C. (2008). Latino students and disproportionality in special
education. Center for Evaluation and Education Policy, 6(2), 1-7.
Riffel, L. (2011). Overview of functional behavior assessment. In Positive Behavior
Support at the Tertiary Level (p. 3). California: Corwin.
Romero, C. (2014). An investigation of alternative language services (ALS) received by English
language learners (ELLs) identified with a disability. University of New Mexico
[Dissertation].
Ryan, C. (2013). Language use in the United States: 2011. U.S. Census Bureau. Retrieved from:
https://www.census.gov/prod/2013pubs/acs-22.pdf
Salend, S. J., & Garrick Duhaney, L. M. (2005). Understanding and addressing the
disproportionate representation of students of color in special education. Intervention in
School and Clinic, 40(4), 213-221.
85
Samson, J., & Lesaux, N. (2009). Language minority learners in special education: Rates and
predictors of identification for services. Journal of Learning Disabilities, 42(2), 148-162.
Retrieved from: http://ldx.sagepub.com.libproxy.stcloud/state.edu/content/42/2/
148.full.pdf+html
Sherill, W.W., & Mayo, R. (2014). Medical and nursing student communication skills:
Preparing to treat Latino patients. Journal of Communication in Healthcare, 7(2), 128-
136. Retrieved from: http://eds.b.ebscohost.com.libproxy.stcloudstate.edu/eds/
pdfviewer/pdfviewer?vid=3&sid=ec9af529-b411-4708-93a3-2effb169a1b4%
40sessionmgr111&hid=114
Shifrer, D., Muller, C., & Callahan, R. (2011). Disproportionality and learning disabilities:
Parsing apart race, socioeconomic status, and language. Journal of Learning Disabilities,
44(3), 246. doi:10.1177/0022219410374236
Skiba, R.J., Simmons, A.B., Gibb, A.C., Rausch, M.K., Cuadrado, J., & Chung, C. (2008).
Achieving equity in special education: History, status, and current challenges.
Exceptional Children, 74(3), 264 – 288.
Steinberg, A., Bain, L., Li, Y., Delgado, G., & Ruperto, V. (2003). Decisions Hispanic families
make after the identification of deafness. Journal of Deaf Studies and Deaf Education,
8(3). doi: 10.1093/deafed/eng016
Sullivan, A.L. (2011). Disproportionality in special education identification and placement of
English language learners. Exceptional Children, 77(3), 317-334. Retrieved from:
http://eds.b.ebscohost.com.libproxy.stcloudstate.edu/eds/pdfviewer/pdfviewer?sid
=ec9af529-b411-4708-93a3-2effb169a1b4%40sessionmgr111&vid=10&hid=114

86
U. S. Department of Education: Office of Special Education Programs (2009). OSEP’s 31st
annual report to Congress on the implementation of the Individuals with Disabilities
Education Act (IDEA). Washington, D.C.: US Department of Education: Office of
Special Education Programs Retrieved from: http://www2.ed.gov/about/reports/annual
/osep/2008/parts-b-c/index.html (Author)
Wathum-Ocama, J.C., & Rose, S. (2002). Hmong immigrants’ views on the education
of their deaf and hard of hearing child. American Annals of the Deaf, 147(3).
Ziviani, J., Darlington, Y., Feeney, R., Rodger, S., & Watter, P. (2014). Early intervention
services of children with physical disabilities: Complexity of child and family
needs. Australian Occupational Therapy Journal, 61(2), 67-75. doi:10.1111/1440-
1630.12059
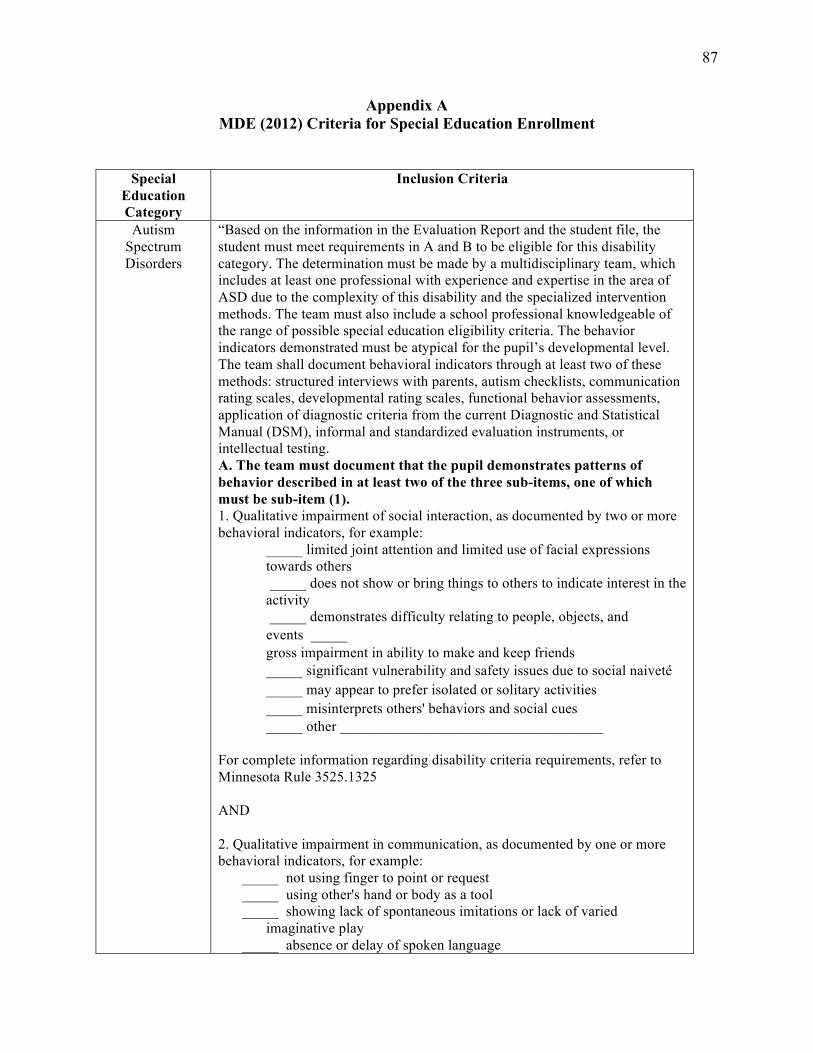
87
Appendix A MDE (2012) Criteria for Special Education Enrollment
Special Education Category
Inclusion Criteria
Autism Spectrum Disorders
“Based on the information in the Evaluation Report and the student file, the student must meet requirements in A and B to be eligible for this disability category. The determination must be made by a multidisciplinary team, which includes at least one professional with experience and expertise in the area of ASD due to the complexity of this disability and the specialized intervention methods. The team must also include a school professional knowledgeable of the range of possible special education eligibility criteria. The behavior indicators demonstrated must be atypical for the pupil’s developmental level. The team shall document behavioral indicators through at least two of these methods: structured interviews with parents, autism checklists, communication rating scales, developmental rating scales, functional behavior assessments, application of diagnostic criteria from the current Diagnostic and Statistical Manual (DSM), informal and standardized evaluation instruments, or intellectual testing. A. The team must document that the pupil demonstrates patterns of behavior described in at least two of the three sub-items, one of which must be sub-item (1). 1. Qualitative impairment of social interaction, as documented by two or more behavioral indicators, for example:
_____ limited joint attention and limited use of facial expressions towards others _____ does not show or bring things to others to indicate interest in the activity _____ demonstrates difficulty relating to people, objects, and events�_____ gross impairment in ability to make and keep friends _____ significant vulnerability and safety issues due to social naiveté� _____ may appear to prefer isolated or solitary activities� _____ misinterprets others' behaviors and social cues� _____ other ____________________________________
For complete information regarding disability criteria requirements, refer to Minnesota Rule 3525.1325 AND 2. Qualitative impairment in communication, as documented by one or more behavioral indicators, for example:
_____ not using finger to point or request _____ using other's hand or body as a tool _____ showing lack of spontaneous imitations or lack of varied
imaginative play _____ absence or delay of spoken language

88
_____ limited understanding and use of nonverbal communication skills such as gestures, facial expressions, or voice tone
_____ odd production of speech, including intonation, volume, rhythm, or rate
_____ repetitive or idiosyncratic language _____ inability to initiate or maintain conversation when speech is present _____ other _______________________________________________OR
3. Restricted, repetitive, or stereotyped patterns of behavior, interests, and activities as documented by one or more behavioral indicators, for example:
_____ insistence on following routines or rituals _____ demonstrating distress or resistance to change in activity� _____ repetitive hand or finger mannerism� _____ lack of true imaginative play versus reenactment _____ overreaction or under-reaction to sensory stimuli� _____ rigid or rule-bound thinking� _____ intense, focused preoccupation with a limited range of play, interests, or conversation topics _____ other ____________________________________
B. Verification The evaluation report must include documentation with supporting data in all four areas below that verifies ASD adversely affects the pupil’s performance and that the pupil is in need of special education instruction and related services.
_____ Present levels of performance in each core feature identified in A (subitem 1 and either subitem 2 or 3).
_____ Education needs in each core feature identified in A (subitem 1 and either subitem 2 or 3).
_____ Observations of the pupil in two different settings, on two different days.
_____ Summary of the pupil's developmental history and behavior patterns. �
Review of Eligibility Determination �
To determine compliance with eligibility determination, one of the following MUST be checked.
____The documentation supports the team decision.� ____ The documentation does not support the team decision.” (MDE,
2012) Blind-Visually
Impaired “Based on information in the Evaluation Report and the student file, the student must meet the requirements in A and B below. A. Visual Impairment The student's file must include documentation of visual impairment by a licensed eye specialist in at least ONE of the following:
_____ Visual acuity of 20/60 or less in better eye with best conventional correction. Estimation of acuity for difficult-to-test pupils
for pre-kindergarten, measured acuity must be significantly deviant

89
from what is developmentally age appropriate _____ Visual field of 20 degrees or less, or bilateral scotomas. _____ Congenital or degenerative condition:
______________________________________ • e.g., progressive cataract, glaucoma, retinitis pigmentosa
B. Functional Evaluation The student's file must include a functional evaluation of visual abilities. A licensed teacher of the visually impaired must determine the student has or experiences at least ONE of the following:
_____ Limited ability in visually accessing program-appropriate educational media without modification.
_____ Limited ability to visually access full range of program-appropriate media and materials without accommodating actions such as changes in posture, body movement, squinting, focal distance, etc.
_____ Variable visual ability due to environmental factors that cannot be controlled such as contrast, weather, color, or movement.
_____ Reduced or variable visual acuity due to visual fatigue or factors common to the eye condition.
Review of Eligibility Determination To determine compliance with eligibility determination, one of the following MUST be checked.
____ The documentation supports the team decision. ____ The documentation does not support the team decision.” (MDE, 2012)
Deaf-Blind “Based on information in the Evaluation Report and the student file, the student
must meet the requirements below. Deaf and Blind: Documentation verifies meeting criteria for both disability areas below: _____ Visual Impairment�See Minnesota Rule 3525.1345 for criteria. _____ Deaf and Hard of Hearing�See Minnesota Rule 3525.1331 for criteria. Review of Eligibility Determination To determine compliance with eligibility determination, one of the following MUST be checked.
____ The documentation supports the team decision. ____ The documentation does not support the team decision.” (MDE,
2012)
Deaf/Hard of Hearing
“Based on information in the Evaluation Report and in the student file, the student must meet the requirements in A and either B, C, or D below. A. Measurements

90
Audiological documentation from a certified audiologist must be provided to demonstrate that the pupil has ONE of the following:
_____ Sensorineural hearing loss with an unaided pure tone average, speech threshold, or auditory brainstem response threshold of 20 decibels hearing level (HL) or greater in the better ear;
_____ Conductive hearing loss with an unaided pure tone average or speech threshold of 20 decibels hearing level (HL) or greater in the better ear persisting over 3 months or occurring at least 3 times in the previous 12 months as verified by audiograms with at least one measure provided by a certified audiologist;
_____ Unilateral sensorineural or persistent conductive loss with an unaided pure tone average or speech threshold of 45 decibels hearing level (HL) or greater in the affected ear; or
_____ Sensorineural hearing loss with unaided pure tone thresholds at 35 decibels hearing level (HL) or greater at 2 or more adjacent frequencies (500 hertz, 1000 hertz, 2000 hertz or 4000 hertz) in the better ear.
B. Effect on Educational Performance The student's hearing loss affects educational performance as demonstrated by:
_____ The student needs to consistently use amplification appropriately in educational settings as determined by audiological measures and systematic observation data; �OR
_____ The student has an achievement deficit showing performance in the 15th percentile or 1.0 standard deviation or more below the mean in one area. Achievement Test _____________________________________________
For complete information regarding disability criteria requirements, refer to Minnesota Rule 3525.1331 Basic reading skills Reading comprehension Written language General knowledge C. Use or Understanding of Spoken English Basic Reading Skills Results ___________ Reading Comprehension Results ___________ Written Language Results ___________ General Knowledge Results ___________ The student's hearing loss affecting the use or understanding of spoken English as documented by one or both of the following:
_____ Under typical classroom conditions, the student's classroom interaction is limited as measured by systematic observation of communication behaviors; �OR
_____ The use of American Sign Language or one or more alternative or
augmentative systems of communication, alone or in combination with oral language as documented by parent or teacher reports and language sampling conducted by a professional with knowledge in the area of communication with persons who are deaf or hard of hearing.
D. Effect on Adaptive Behavior

91
_____ The student's hearing loss affects the adaptive behavior required for age-appropriate social functioning as supported by documented systematic observation within the student's primary learning environments by a licensed professional and the student, when appropriate; �AND
_____ Below average scores of same-aged peers on a standardized scale of social skill development.
Test Name ___________________________________ Results ____________________ �Review of Eligibility Determination �
Review of Eligibility Determination
To determine compliance with eligibility determination, one of the following MUST be checked.
____ The documentation supports the team decision.� ____ The documentation does not support the team decision.” (MDE, 2012)
Developmental Cognitive Delay
– Mild & Developmental Cognitive Delay
- Severe
Based on information in the Evaluation Report and the student file, the student must meet the requirements in A and B below. A. Adaptive Behavior
_____ The student demonstrates below-average adaptive behavior in school by a composite score at or below the 15th percentile on a nationally normed, technically adequate measure of adaptive behavior. �Adaptive behavior test name _______________________________ �Composite score percentile ________________________________
The student demonstrates below average adaptive behavior at home by a
composite score at or below the 15th percentile on a nationally normed, technically adequate measure of adaptive behavior. �Adaptive behavior test name: _______________________________ �Composite score percentile ________________________________ �
AND�Documentation of needs and the level of support required in at least
four of the seven adaptive �behavior domains across multiple environments.
Domain Home School Community Needs and
Level of Support
Required Daily Living
and Independent Living Skills
Social and Interpersonal
Skills

92
Communication Skills
Academic Skills
Recreation and Leisure Skills
Community Participation
Skills
Work and Work-Related
Skills
AND Is supported by BOTH of the following: _____ A systemic observation _____ Parent input Other sources of documentation may include checklists, classroom or work samples, interviews, criterion-referenced measures, educational history, medical history, or pupil self-report. B. General Intellectual Functioning The student demonstrates significantly below-average general intellectual functioning as measured by an individually administered, nationally normed test of intellectual ability. Intellectual Ability Test:_________________ Full Scale Score:_______ SD: _______ ____ Mild-moderate range = 2 standard deviations below the mean (+ or – 1 standard error of measurement) ____ Severe-profound range = 3 standard deviations below the mean (+ or – 1 standard error of measurement) AND�The student’s significantly below-average general intellectual functioning is verified through: ____ A written summary of results from at least two systematic observations with consideration for culturally relevant information, medical and education history and at least one of the following: ____ Supplemental tests of specific abilities� ____ Alternative methods of intellectual assessment� ____ Criterion-referenced tests� ____ Clinical interviews with family members� ____ Observation and analysis of behavior across multiple environments Note: DCD does not include conditions primarily due to a sensory or physical impairment, traumatic brain injury, autism spectrum disorder, severe multiple impairments, cultural influences, or inconsistent educational programming. Review of Eligibility Determination

93
To determine compliance with eligibility determination, one of the following MUST be checked. ____ The documentation supports the team decision.� ____ The documentation does not support the team decision.” (MDE, 2012)
Developmental Delay – Ages 3-
6
“Based on information in the Evaluation Report and the student file, a child identified as eligible under Developmental Delay criteria must meet the requirements in 1 and 2 below. 1. Developmental Delay The child must meet one of the following to be determined eligible for Early Childhood Special Education services under Developmental Delay:
____ A diagnosed physical or mental condition or disorder that has a high probability of resulting in developmental delay. �OR
____ A delay of 1.5 standard deviations or more below the mean in two or more developmental areas: ____Cognitive Development� Standard Deviation ____ ____Physical Development (including vision and hearing) Standard Deviation ____ ____Communication Development� Standard Deviation ____ ____Social or Emotional Development� Standard Deviation ____ ____Adaptive Development Standard Deviation ____
2. Need for Special Education The child’s need for special education is supported by ALL of the following: ____ At least one documented systematic observation in the child’s daily routine setting by an appropriate professional or, if observation in the daily routine setting is not possible, the alternative setting must be justified. ____ Developmental history For complete information regarding disability criteria requirements, refer to Minnesota Rule 3525.1351. Developmental Delay (Three through Six Years of Age) ____ At least one other evaluation procedure in each area of identified delay that is conducted on a different day than the medical or norm-referenced evaluation; which may include criterion- referenced instruments, language samples, or curriculum-based measures. Area of identified delay: _________ Evaluation procedure: _______________ Area of identified delay: _________ Evaluation procedure: _______________ Review of Eligibility Determination To determine compliance with eligibility determination, one of the following MUST be checked.
____ The documentation supports the team decision.�
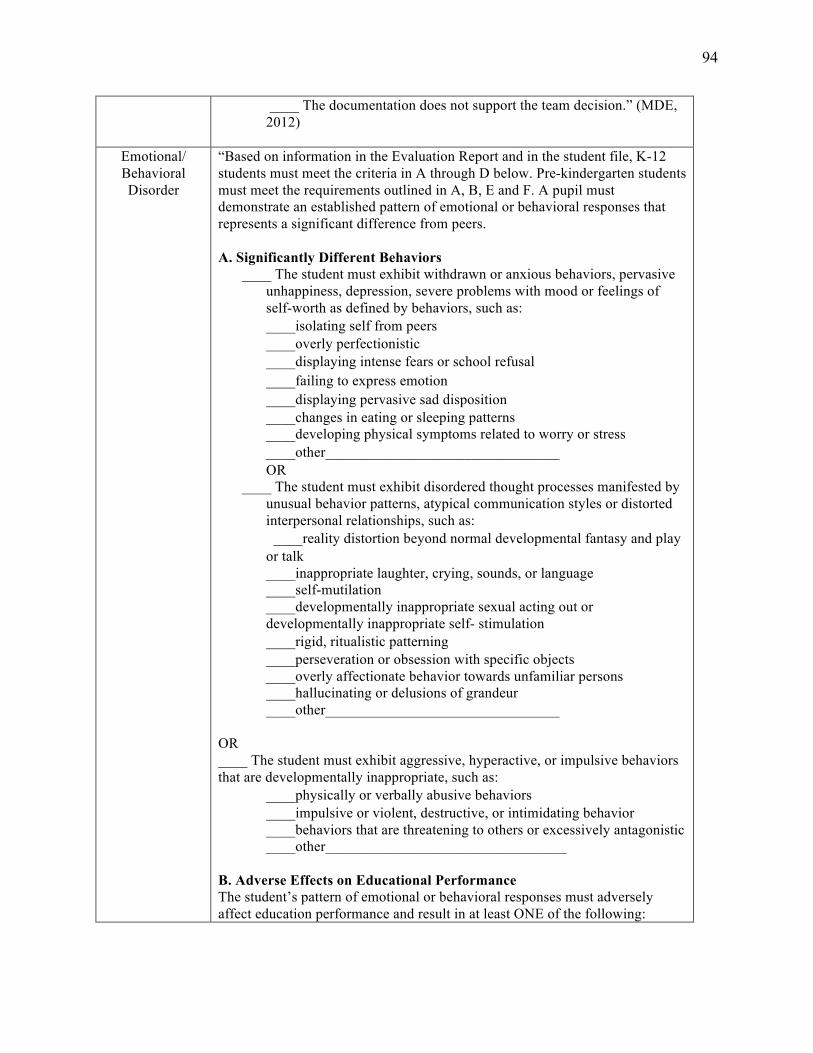
94
____ The documentation does not support the team decision.” (MDE, 2012)
Emotional/ Behavioral Disorder
“Based on information in the Evaluation Report and in the student file, K-12 students must meet the criteria in A through D below. Pre-kindergarten students must meet the requirements outlined in A, B, E and F. A pupil must demonstrate an established pattern of emotional or behavioral responses that represents a significant difference from peers. A. Significantly Different Behaviors
____ The student must exhibit withdrawn or anxious behaviors, pervasive unhappiness, depression, severe problems with mood or feelings of self-worth as defined by behaviors, such as:
____isolating self from peers� ____overly perfectionistic ____displaying intense fears or school refusal� ____failing to express emotion� ____displaying pervasive sad disposition� ____changes in eating or sleeping patterns ____developing physical symptoms related to worry or stress
____other________________________________ � OR ____ The student must exhibit disordered thought processes manifested by
unusual behavior patterns, atypical communication styles or distorted interpersonal relationships, such as:
�____reality distortion beyond normal developmental fantasy and play or talk
____inappropriate laughter, crying, sounds, or language ____self-mutilation
____developmentally inappropriate sexual acting out or developmentally inappropriate self- stimulation ____rigid, ritualistic patterning� ____perseveration or obsession with specific objects ____overly affectionate behavior towards unfamiliar persons ____hallucinating or delusions of grandeur ____other________________________________
OR ____ The student must exhibit aggressive, hyperactive, or impulsive behaviors that are developmentally inappropriate, such as:
____physically or verbally abusive behaviors� ____impulsive or violent, destructive, or intimidating behavior ____behaviors that are threatening to others or excessively antagonistic ____other_________________________________
B. Adverse Effects on Educational Performance The student’s pattern of emotional or behavioral responses must adversely affect education performance and result in at least ONE of the following:
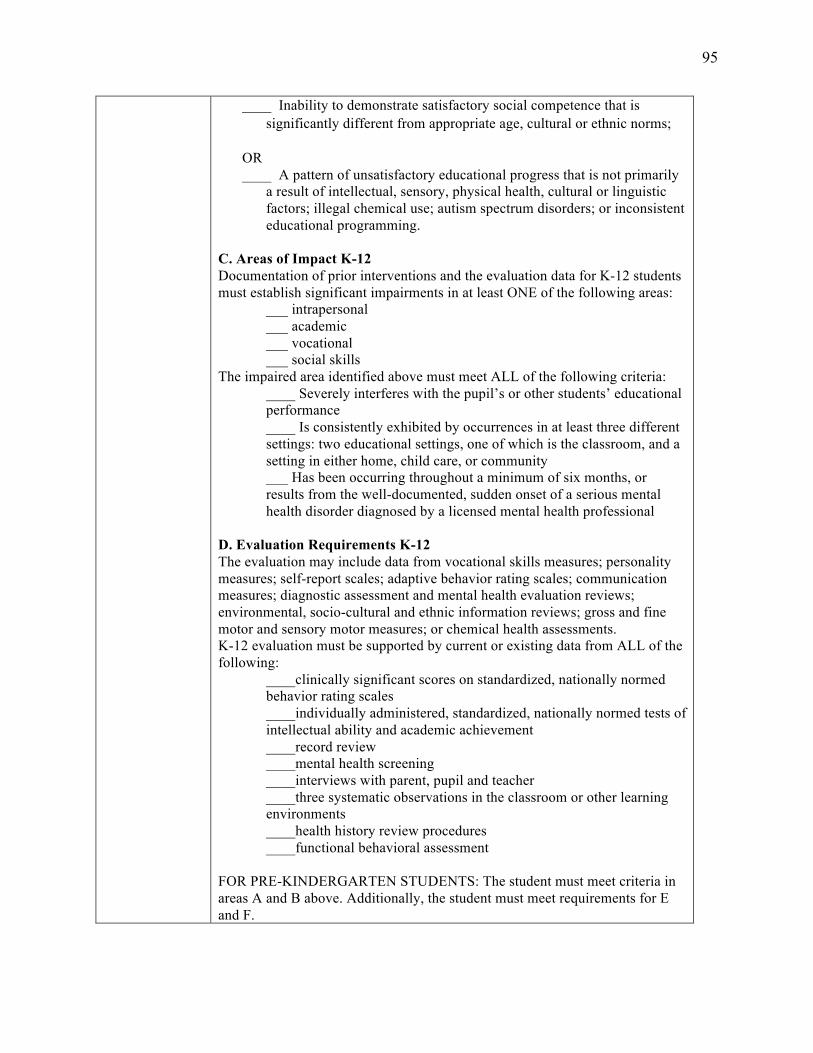
95
____ Inability to demonstrate satisfactory social competence that is significantly different from appropriate age, cultural or ethnic norms; �
OR ____ A pattern of unsatisfactory educational progress that is not primarily
a result of intellectual, sensory, physical health, cultural or linguistic factors; illegal chemical use; autism spectrum disorders; or inconsistent educational programming.
C. Areas of Impact K-12 Documentation of prior interventions and the evaluation data for K-12 students must establish significant impairments in at least ONE of the following areas:
___ intrapersonal ___ academic ___ vocational ___ social skills
The impaired area identified above must meet ALL of the following criteria: ____ Severely interferes with the pupil’s or other students’ educational performance
____ Is consistently exhibited by occurrences in at least three different settings: two educational settings, one of which is the classroom, and a setting in either home, child care, or community
___ Has been occurring throughout a minimum of six months, or results from the well-documented, sudden onset of a serious mental health disorder diagnosed by a licensed mental health professional
D. Evaluation Requirements K-12 The evaluation may include data from vocational skills measures; personality measures; self-report scales; adaptive behavior rating scales; communication measures; diagnostic assessment and mental health evaluation reviews; environmental, socio-cultural and ethnic information reviews; gross and fine motor and sensory motor measures; or chemical health assessments. K-12 evaluation must be supported by current or existing data from ALL of the following:
____clinically significant scores on standardized, nationally normed behavior rating scales ____individually administered, standardized, nationally normed tests of intellectual ability and academic achievement ____record review ____mental health screening ____interviews with parent, pupil and teacher ____three systematic observations in the classroom or other learning environments ____health history review procedures ____functional behavioral assessment
FOR PRE-KINDERGARTEN STUDENTS: The student must meet criteria in areas A and B above. Additionally, the student must meet requirements for E and F.

96
E. Areas of Impact Pre-K�Evaluation data must establish and define developmentally significant impairments in at least ONE of the following areas for pre-kindergarten students:
____ self-care ____ social relations ____ social or emotional growth
The area(s) identified above must meet ALL of the following criteria: ____ data must document that emotional or behavioral responses are exhibited in at least one setting including either in the home, at childcare, or in the community ____ has been occurring throughout a minimum of six months, or results from the well-documented, sudden onset of a serious mental health disorder diagnosed by a licensed mental health professional
F. Evaluation of Pre-K Pre-K evaluations must be supported by current or existing data from each of the following areas:
____ two or more systematic observations, including one in the home� ____ a case history, including medical, cultural and developmental information� ____ information on the student’s cognitive ability, social skills and communication abilities ____ standardized and informal interviews, including parent, teacher, caregiver and childcare provider ____ standardized adaptive behavior scales
Review of Eligibility Determination To determine compliance with eligibility determination, one of the following MUST be checked.
____ The documentation supports the team decision. ____ The documentation does not support the team decision.” (MDE, 2012)
Other Health Impairment
“Based on information in the Evaluation Report and the student file, the student must meet the requirements in A through C below. A. Health Condition _____Medical documentation written and signed by a licensed physician of a medically diagnosed chronic or acute health condition. For initial evaluations, documentation must be dated within the previous 12 months. Health Condition______________________________________________ OR _____In the case of Attention Deficit Disorder (ADD) or Attention Deficit Hyperactivity Disorder (ADHD), written and signed documentation of a medical diagnosis by a licensed physician. For initial evaluation, documents must be dated within the past 12 months. The documentation must show the

97
student meets DSM-IV criteria in items A-E. The DSM-IV criteria documentation must be provided by a licensed physician, mental health or medical professional licensed to diagnose the condition. A licensed physician, an advanced practice nurse, or a licensed psychologist is qualified to make a diagnosis and determination of attention deficit disorder or attention deficit hyperactivity disorder for purposes of identifying a child with a disability. Minn. Stat. 125A.02 Subd.1. B. Adverse Effects In comparison with peers, the health condition adversely affects the pupil’s ability to complete educational tasks within routine timelines as documented in at least THREE of the following areas:
_____excessive absenteeism linked to the health condition (e.g., hospitalizations, medical treatments, surgeries or illnesses) _____specialized health care procedures that are necessary during the school day _____medications that adversely affect learning and functioning in terms of comprehension, memory, attention or fatigue _____limited physical strength resulting in decreased capacity to perform school activities _____limited endurance resulting in decreased stamina and decreased ability to maintain performance _____heightened or diminished alertness resulting in impaired abilities (e.g., prioritizing environmental stimuli, maintaining focus, or sustaining effort or accuracy) _____impaired ability to manage and organize materials and complete classroom assignments within routine timelines _____impaired ability to follow directions or initiate and complete a task
C. Unsatisfactory Educational Progress The student’s health condition results in a pattern of unsatisfactory educational progress as determined by a comprehensive evaluation. Documentation must include EACH of the following:
_____An individually administered, nationally normed standardized evaluation of the pupil’s academic performance _____Documented, systematic interviews conducted by a licensed special education teacher with classroom teachers and the pupil’s parent or guardian _____One or more documented, systematic observations in the classroom or other learning environment by a licensed special education teacher _____A review of the pupil’s health history, including the verification of a medical diagnosis of a health condition _____Records review
Review of Eligibility Determination

98
To determine compliance with eligibility determination, one of the following MUST be checked.
____ The documentation supports the team decision.� ____ The documentation does not support the team decision.” (MDE, 2012)
Physically Impaired
“Based on information in the Evaluation Report and the student file, the student must meet the requirements in 1 and 2 below. A. Documentation of Physical Impairment
_____There must be documentation of a medically diagnosed physical impairment Physical Impairment ___________________________________
B. Evaluation� At least ONE of the following must be documented in the evaluation report. Functional Skills
_____The student’s need for special education instruction and service is supported by a lack of functional level in organizational or independent work skills as verified by a minimum of two or more documented, systematic observations in daily routine settings, one of which is completed by a physical and health disabilities teacher.
Motor Skills _____The student’s need for special education instruction and service is supported by an inability to manage or complete motoric portions of classroom tasks within time constraints as verified by a minimum of two or more documented systematic observations in daily routine settings, one of which is completed by a physical and health disabilities teacher.
Educational Performance _____The student’s physical impairment interferes with educational performance as shown by an achievement deficit of 1.0 standard deviation or more below the mean on an individually administered, nationally normed standardized evaluation of the student’s academic achievement.
Achievement Test ______________________ Standard Deviation _________ Review of Eligibility Determination To determine compliance with eligibility determination, one of the following MUST be checked.
____ The documentation supports the team decision.� ____ The documentation does not support the team decision.” (MDE, 2012)
Specific Learning Disability
“Information about each item must be sought from the parent and included as part of the evaluation data. The evaluation data must confirm that the disabling effects of the child’s disability occur in a variety of settings. The child must receive two interventions prior to evaluation unless the parent requests an evaluation or the team waives the requirement due to urgency. Based on information in the Evaluation Report and the student file, a pupil has a specific

99
learning disability and is in need of special education and related services when the pupil meets the criteria in A, B, and C OR A, B, and D below. A. Documentation of Inadequate Achievement The child does not achieve adequately in one or more of the following areas in response to appropriate classroom instruction:
_____Oral Expression _____Listening Comprehension _____Written Expression _____Basic Reading Skills _____Reading Comprehension _____Reading Fluency _____Mathematics Calculation _____Mathematical Problem Solving
AND _____The child does not make adequate progress to meet age or state-approved grade-level standards in one or more of the areas listed above when using a process based on the child's response to scientific, research-based intervention; OR _____The child exhibits a pattern of strengths and weaknesses in performance, achievement, or both, relative to age, state-approved grade-level standards, or intellectual development, that is determined by the group to be relevant to the identification of a specific learning disability (SLD).
AND _____Documentation to support this finding must be both representative of the pupil's curriculum and useful for developing instructional goals and objectives. Documentation includes evidence of low achievement from the following sources, when available:
_____Cumulative record reviews� _____Class work samples� _____Anecdotal teacher records� _____Statewide and district-wide assessments� _____Formal, diagnostic, and informal tests� _____Results from targeted support programs in general education _____Curriculum based evaluation results
B. Information Processing The child has a disorder in one or more of the basic psychological processes, which includes an information processing condition that is manifested in a variety of setting by behaviors such as inadequate:
_____Acquisition of information� _____Organization� _____Planning and sequencing� _____Working memory, including verbal, visual, or spatial _____Visual and auditory processing

100
_____Speed of processing� _____Verbal and nonverbal expression� _____Transfer of information� _____Motor control for written tasks (pencil and paper assignments, drawing, and copying) _____Other: ___________________________________________
C. Severe Discrepancy The child demonstrates a severe discrepancy between general intellectual ability and achievement in at least one of the identified areas of achievement. The demonstration of a severe discrepancy shall not be based solely on the use of standardized tests. The instruments used to assess the child’s general intellectual ability and achievement must be individually administered and interpreted by an appropriately licensed person using standardized procedures. For initial placement, the severe discrepancy must be equal to or greater than 1.75 standard deviations below the mean on a distribution of regression scores for the general population at the student's chronological age. General Intellectual Ability Assessment Measure: _____________________________________ Overall Composite Score: ________ Regression Score: _____________ Achievement Measure: ________________________________________________________________ Cluster Area Composite Score _____________ Oral Expression� Composite Score _____________ Listening Comprehension Composite Score _____________ Written Expression� Composite Score _____________ Basic Reading Skills� Composite Score _____________ Reading Fluency Skills Composite Score _____________ Reading Comprehension Composite Score _____________ Mathematical Calculation Composite Score _____________ Mathematical Problem Solving Composite Score ____________ D. Inadequate rate of progress in response to scientific research-based intervention (SRBI) The child demonstrates an inadequate rate of progress in response to intensive SBRI and the following components are documented:

101
_____Rate of progress is measured over at least 7 school weeks on a minimum of 12 data points; _____Rate of improvement is minimal and continued intervention will not likely result in reaching age or state-approved grade-level standards; _____Progress will likely not be maintained when instructional supports are removed; _____Level of performance in repeated assessment of achievement falls below the child’s age or state- approved grade-level standards; and _____Level of achievement is at or below the 5th percentile on one or more valid and reliable achievement tests using either state or national comparisons. Local comparison data that is valid and reliable may be used in addition to either state or national data, but if it differs from either state or national data, the group must provide a rationale to explain the difference.
Review of Eligibility Determination To determine compliance with eligibility determination, one of the following MUST be checked.
____ The documentation supports the team decision.� ____ The documentation does not support the team decision.” (MDE, 2012)
Specific Language
Impairment
“Based on information in the Evaluation Report and the student file, the student must meet the requirements in any one of the four areas below. 1. Fluency Disorder A student who meets all of the fluency disorder criteria below is eligible for speech or language special education services:
_____ A. The pattern interferes with communication as determined by an educational speech language pathologist and either another adult or the pupil.
_____ B. Dysfluent behaviors occur during at least five percent of the words spoken on two or more speech samples. Scores_____________________________
_____ C. Fluency patterns are not attributed only to dialectical, cultural or ethnic difference, or to the influence of a foreign language.
2. Voice Disorder A student with a voice disorder must meet all criteria below to be eligible for speech or language special education services.
_____ A. The pattern interferes with communication as determined by an educational speech language pathologist and either another adult or the pupil.
_____ B. Achievement of a moderate to severe vocal severity rating is demonstrated on a voice evaluation profile administered on two separate occasions, two weeks apart, at different times of the day. �
Voice Profile # 1�Results: ____ moderate ____ severe Date __________ Time ____________

102
Voice Profile # 2�Results: ____ moderate ____ severe Date __________ Time ____________ _____ C. Voice patterns are not attributed only to dialectical, cultural, or ethnic differences, or to the influence of a foreign language. 3. Articulation Disorder A student with an articulation disorder qualifies for speech or language special education services if the student meets both A and D and either B or C:
_____ A. The pattern interferes with communication as determined by an educational speech language pathologist and either another adult or the pupil.
_____ B. Test performance falls 2.0 standard deviations below the mean on a technically adequate, norm-referenced articulation test. Test______________________________________________________ Score ________________________
_____ C. The pupil is nine years of age or older and a sound is consistently in error as documented by two three-minute conversational speech samples.
_____ D. Articulation patterns are not attributed only to dialectical, cultural, or ethnic differences, or to the influence of a foreign language.
4. Language Disorder A student with a language disorder qualifies for speech or language special education the student meets both A, B, and E and either C or D.
A. The pattern interferes with communication as determined by an educational speech language pathologist and either another adult or the child. B. Analysis of language sample or documented observation of communication interaction indicates that language behavior is below or different from expectations based on age, developmental level, or cognitive level. C. The pupil scores 2.0 standard deviations or more below the mean on two norm-referenced, technically adequate language tests. Test name_________________________________ Standard Deviation_________ Test name_________________________________ Standard Deviation_________ D. If technically adequate, norm-referenced language tests are not available to provide evidence of a deficit of 2.0 standard deviations below the mean in the area of language, two documented measurement procedures indicate a substantial difference from expectations, based on age, developmental level, or cognitive level. Procedure #1 _________________________________________________________ Results _________________________________________________________
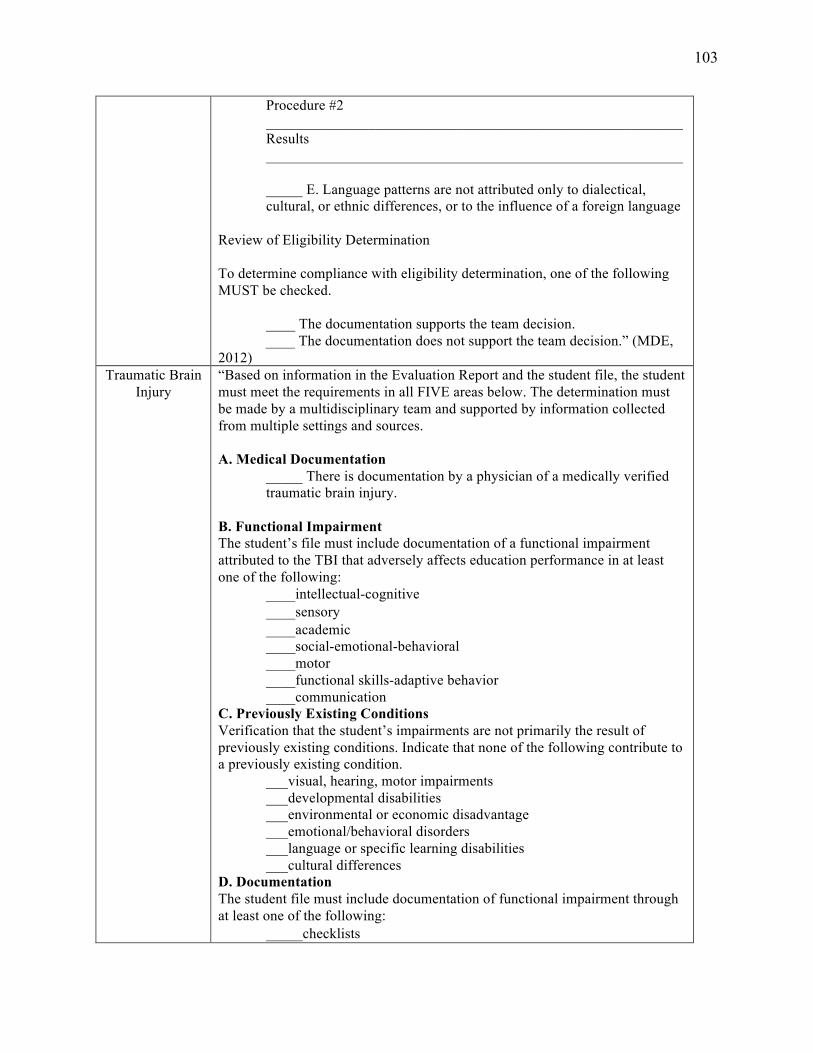
103
Procedure #2 _________________________________________________________ Results _________________________________________________________ _____ E. Language patterns are not attributed only to dialectical, cultural, or ethnic differences, or to the influence of a foreign language
Review of Eligibility Determination To determine compliance with eligibility determination, one of the following MUST be checked.
____ The documentation supports the team decision. ____ The documentation does not support the team decision.” (MDE, 2012)
Traumatic Brain Injury
“Based on information in the Evaluation Report and the student file, the student must meet the requirements in all FIVE areas below. The determination must be made by a multidisciplinary team and supported by information collected from multiple settings and sources. A. Medical Documentation
_____ There is documentation by a physician of a medically verified traumatic brain injury.
B. Functional Impairment The student’s file must include documentation of a functional impairment attributed to the TBI that adversely affects education performance in at least one of the following:
____intellectual-cognitive ____sensory� ____academic ____social-emotional-behavioral ____motor ____functional skills-adaptive behavior ____communication
C. Previously Existing Conditions Verification that the student’s impairments are not primarily the result of previously existing conditions. Indicate that none of the following contribute to a previously existing condition.
___visual, hearing, motor impairments ___developmental disabilities ___environmental or economic disadvantage ___emotional/behavioral disorders ___language or specific learning disabilities ___cultural differences
D. Documentation The student file must include documentation of functional impairment through at least one of the following:
_____checklists�

104
_____classroom or work samples� _____documented, systematic behavioral observations _____educational/medical history� _____interviews with parent, student, and other knowledgeable individuals
E. Documentation The student's file must include documentation of functional impairment based on at least one of the following:
_____criterion-referenced measures _____personality or projective measures _____sociometric measures _____standardized assessment measures (academic, cognitive, communication, neuropsychological, or motor)
Review of Eligibility Determination To determine compliance with eligibility determination, one of the following MUST be checked.
____ The documentation supports the team decision.� ____ The documentation does not support the team decision.” (MDE, 2012)
Severely Multiply Impaired
“Based on information in the Evaluation Report and the student file, the student must meet ALL requirements below. Multiple Disabilities� Identify at least TWO disabilities that are documented in the student’s file.
____Deaf or Hard of Hearing� ____Physically Impaired� ____Developmental Cognitive Disability – Severe-Profound range ____Blind/Visually Impaired� ____Emotional or Behavioral Disorders� ____Autism Spectrum Disorders
Review of Eligibility Determination To determine compliance with eligibility determination, one of the following MUST be checked.
____ The documentation supports the team decision.� ____ The documentation does not support the team decision.” (MDE, 2012)

105
Appendix B Home Language Questionnaire ED-01336-08E
The following is to be completed by School District Personnel:
STUDENT IDENTIFICATION INFORMATION Student’s Full Name Date Of Birth Age Grade Level
DISTRICT INFORMATION/VERIFICATION INFORMATION
School name District number I hereby verify that the above information is true and accurate to the best of my knowledge and belief.
Name (Printed)
_____________________________ _____________________ _______________ Signature – Responsible Authority Title Date
The following is to be completed by Parent/Guardian:
STUDENT LANGUAGE INFORMATION Dear Parents and Guardians: In order to help your child learn, your child’s teachers need to determine which language your child uses most. Please respond to the questions below by checking the appropriate box. 1. Which language did your child learn first? � English � Other (specify):_______ 2. Which language is most often spoken in your home? � English � Other (specify)_______ 3. Which language does your child usually speak? � English � Other (specify):______
PARENT/GUARDIAN INFORMATION
I hereby verify that the above information is true and accurate to the best of my knowledge and belief.
Name (Printed)
_______________________________________________ _______________ Signature – Responsible Authority Date
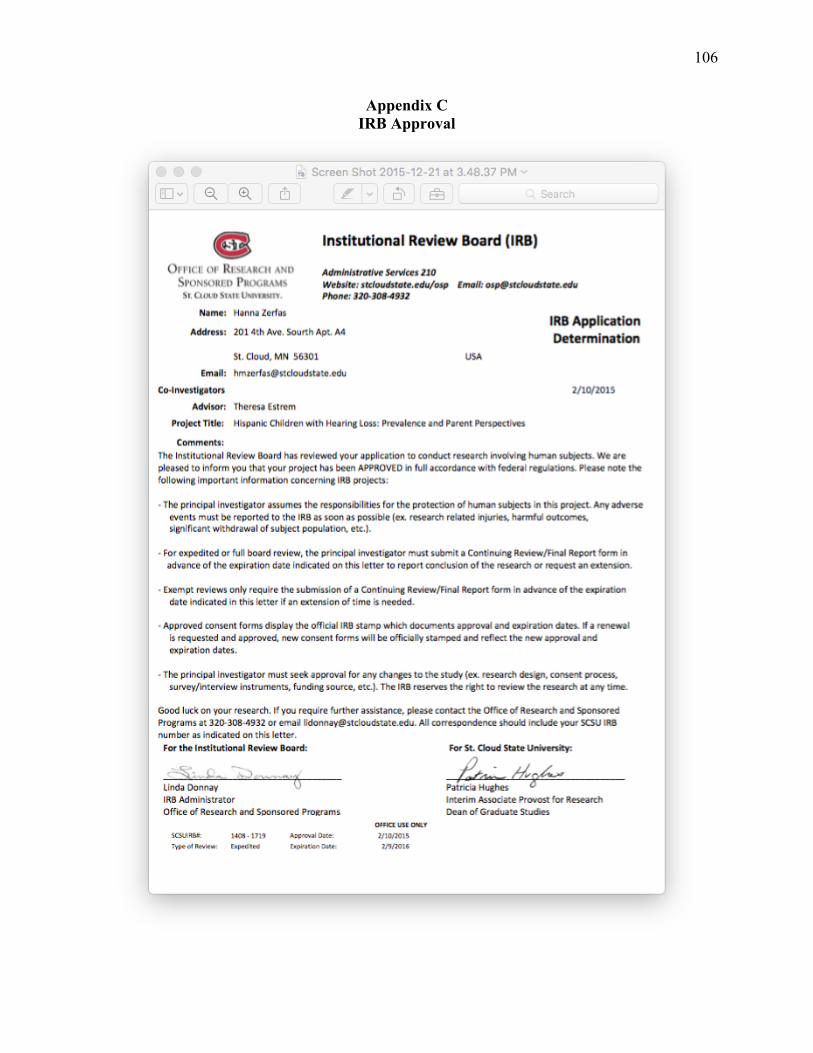
106
Appendix C IRB Approval