PRESTRESSED CONCRETE HIGHWAY PAVEMENT AT DULLES ...
19
PRESTRESSED CONCRETE HIGHWAY PAVEMENT AT DULLES INTERNATIONAL AIRPORT Bengt F. Friberg, Consultant, St. Louis; and Thomas J. Pasko, Jr., Federal Highway Administration A prestressed concrete highway pavement was constructed in late 1971 at the Dulles International Airport near Washington, D.C. The pavement is 3,200 ft long and consists of six slabs ranging in length from 400 to 760 ft. The concrete is 6 in. thick and 24 ft wide. Measurements made during construction, and for 3% months thereafter, included concrete strengths, strand elongations during stressing, concrete temperatures and gradients, slab movements, and profile changes. In addition, prior to opening to traffic, the pavement was subjected to controlled tests with axle loadings of 20 and 33 kip at joints and edges while deflections and strains were measured. The prestressing tendons are %-in. diameter 7-wire strands spaced at 24 in. and tensioned to 29 kip by jacking at both ends of each slab. In order from the west end, three slabs 400, 500, and 600 ft long were prestressed with the strand in smooth-wall steel tubing that was grouted after stressing, and three slabs 760, 500, and 400 ft long were prestressed with polypropylene-encased, greased strands. Friction in the encasements produced average strand effectiveness of 90 percent for the strand in ste el tubing and 80 percent for the plastic-encased strand. The strands placed at % in. below middepth produce a favorable stress distri- bution and keep the slab ends from warping upward. The double layer of polyethylene over the cement-treated subbase allows daily slab end move- ments from 0.2 to 0.4 in., indicating a maximum diurnal friction coeffi- cient of less than 0.5. •ORDINARILY, pavement slabs dry at the top surface, whereas the bottom surface, which is in contact with the subbase, remains nearly saturated. This moisture differ- ential, with drying and shrinkage at the surface, produces upward warping at the pave- ment edges and ends. Longitudinal stresses from restrained warping of a long slab keep the slab flat on the subbase except at the ends. The longitudinal compressive stress at the bottom of the slab is a natural stress condition except within a few feet of the ends ( 6). This residual compressive stress is available to counter the high tension stresses af the bottom sur- face caused by axle loads in the longitudinal direction. Longitudinal prestress can preserve the favorable natural stresses in the pavement away from the ends. Magnitude of the pres tress at the ends is selected to induce some compressive stress in the top surface to counter corner load stresses and yet hold the ends down with much higher compressive prestress at the bottom. It is desirable to aim for optimum dimensions of monolithic prestress pavement slabs by finding the practical maximum distance between transverse joints in normal construction practices, and by early application of prestress, before the developing tension stresses in the drying slab reach critical values. Publication of this paper sponsored by Committee on Rigid Pavement Design. 1
Transcript of PRESTRESSED CONCRETE HIGHWAY PAVEMENT AT DULLES ...

PRESTRESSED CONCRETE HIGHWAY PAVEMENT AT DULLES INTERNATIONAL AIRPORT Bengt F. Friberg, Consultant, St. Louis; and Thomas J. Pasko, Jr., Federal Highway Administration
A prestressed concrete highway pavement was constructed in late 1971 at the Dulles International Airport near Washington, D.C. The pavement is 3,200 ft long and consists of six slabs ranging in length from 400 to 760 ft. The concrete is 6 in. thick and 24 ft wide. Measurements made during construction, and for 3% months thereafter, included concrete strengths, strand elongations during stressing, concrete temperatures and gradients, slab movements, and profile changes. In addition, prior to opening to traffic, the pavement was subjected to controlled tests with axle loadings of 20 and 33 kip at joints and edges while deflections and strains were measured. The prestressing tendons are %-in. diameter 7-wire strands spaced at 24 in. and tensioned to 29 kip by jacking at both ends of each slab. In order from the west end, three slabs 400, 500, and 600 ft long were prestressed with the strand in smooth-wall steel tubing that was grouted after stressing, and three slabs 760, 500, and 400 ft long were prestressed with polypropylene-encased, greased strands. Friction in the encasements produced average strand effectiveness of 90 percent for the strand in steel tubing and 80 percent for the plastic-encased strand. The strands placed at % in. below middepth produce a favorable stress distribution and keep the slab ends from warping upward. The double layer of polyethylene over the cement-treated subbase allows daily slab end movements from 0.2 to 0.4 in., indicating a maximum diurnal friction coefficient of less than 0.5.
•ORDINARILY, pavement slabs dry at the top surface, whereas the bottom surface, which is in contact with the subbase, remains nearly saturated. This moisture differential, with drying and shrinkage at the surface, produces upward warping at the pavement edges and ends.
Longitudinal stresses from restrained warping of a long slab keep the slab flat on the subbase except at the ends. The longitudinal compressive stress at the bottom of the slab is a natural stress condition except within a few feet of the ends ( 6). This residual compressive stress is available to counter the high tension stresses af the bottom surface caused by axle loads in the longitudinal direction.
Longitudinal prestress can preserve the favorable natural stresses in the pavement away from the ends. Magnitude of the pres tress at the ends is selected to induce some compressive stress in the top surface to counter corner load stresses and yet hold the ends down with much higher compressive prestress at the bottom.
It is desirable to aim for optimum dimensions of monolithic prestress pavement slabs by finding the practical maximum distance between transverse joints in normal construction practices, and by early application of prestress, before the developing tension stresses in the drying slab reach critical values.
Publication of this paper sponsored by Committee on Rigid Pavement Design .
1

2
Some reduction from normal pavement thickness is indicated for prestressed pavements because of the prestress and the favorable stress conditions in long monolithic slabs. At the transverse joints of this thinner pavement, adequate strength can be secured by joint-edge reinforcements and effective joint load transfer. Repeated, excessive yielding of a foundation, however , leads to deterioration of the support and failure of the system even if the thinner pavement itself can flex initially without failure. Permissible pavement deflections, rather than stresses, place a lower limit on prestressed concrete pavement thicknesses over normal road foundations.
PAVEMENT DESIGN
Project Site
The prestressed highway pavement project is located at Dulles International Airport in northern Virginia and consists of 3,200 ft of prestressed slabs 6 in. thick.
The soil in the area is a silty clay classi:Eied as an AASHO A-6(12). At a 2- to 4-ft depth, the project was underlain by a rippable shale. At about midlength of the project, the roadway crosses twin 7-ft diameter concrete culverts approximately 3 ft below the bottom of the pavement.
As given in Table 1, various vertical and horizontal alignments are incorporated in the demonstration project. The slab lengths are given in the table in the order in which they were built, from west to east. The first three slabs were grouted construction and the latter three ungrouted. Cross slopes in general are 2 percent toward the north shoulder on tangents, but on superelevated curves the slope ranges to 6 percent. The north and south edges are bounded with 2-ft deep drainage ditches (4, 7, 9). Figure 1 shows some of the distinguishing features of the project. - - -
Structural Analysis
Preliminary structural analysis indicated that the design could consist of a 6-in. slab laid over a 6-in. cement-treated subbase having a modulus of subgrade reaction of 400 lb/in.3
• Slab ends contain 1 %-in. diameter dowels 12 in. on center that span a 3-in. wide joint and have a dowel looseness of less than 0.005 in. Traffic loading for design analysis was a 20-kip axle load for a single axle and two 20-kip axles spaced at 50 in. for tandem loading.
Sector analysis (8) was used to determine the stresses caused by the design axle loadings. Results compared favorably with values measured in the slab. Calculated deflections under loads were tolerable.
Details of Materials
The subbase is a crushed-stone material 6 in. deep and stabilized with 4 percent cement by weight. It is 28 ft wide and cured with a sprayed asphalt membrane.
A double layer of 4-mil thick high-slip polyethylene sheeting was placed as a bond breaker for the slabs.
The steel was preset over the polyethylene prior to concreting. It consists of the bulkhead I-beams at the ends of each slab and transverse reinforcing bars number 3 or 4, 30 in. on center, that support the 12 longitudinal tendons. Number 4 tie bars 36 in. long and 30 in. on cente1: were used across the longitudinal joint .
The post-tensioned tendons are 1/2-in. nominal diameter 7-wire s b:ands spaced 24 in . on center and 1/2 in. below middepth. The str and confo1'ms to ASTM A 416, grade 270, with a minimum breaking strength of 41,300 lb . The tendons were supported and tied on the transverse reinforcing bars. Bare strands, enclosed in thin-wall smooth steel tubing, having a 0.68-in. inside diameter and a 0.035-in. wall thickness, were used in the three slabs in the west part of the project. The continuity of the tubing was interrupted every 100 ft with a 4-in. expansion space and a grout inlet that projected to the pavement surface. The butting tube ends and the expansion space were covered with close-fitting outer sleeves. The three slabs on the east end contained strand that is greased and encased in tight-fitting extruded polypropylene coating 0.02 in. thick.

The concrete was made with 1-in. maximum-sized crushed trap rock and type II cement. The air content was about 6 percent. The specified compressive strength of 4,000 psi at 28 days was easily met.
3
The ends of the prestressed slabs are 6-in., 17 .25-lb/ft steel I-beams with holes 2% in. above the bottom flange for the prestressing strands. The 1 Y4-in. diameter sleeves are 4 in. long and 12 in. on center and were carefully aligned and welded in place for the joint dowels. The two 12-ft I-beams are hinged at the center joint. They serve to reinforce the transverse joint edge, distribute the concentrated strand forces, position the strands and dowels, confine the joint filler, and permit accurate squaring of the joints.
Steel I-beams, matching those at the prestressed slab ends, were slipped over the projecting dowels, shimmed to grade and to a position that provided an expansion joint at each end of the prestressed slab. The joint was dimensioned to close at 110 F. These 6-in. I-beams are integrated with the joint slab and reinforce the joint edges. Figure 2 shows the 8-ft space between the slabs with the beams in place, ready for the double layer of reinforcement and concrete.
At both ends of each joint, sliding steel end plates were installed to prevent infiltration of debris between the joint I-beams. A galvanized sheet-metal drain box was installed at the low end of each joint, through which water can drain from the bottom of the joint to the side under the shoulder through a 21/2-in. PVC pipe.
CONSTRUCTION
Paving
The cement-treated subbase was constructed during the last of September 1971. The concrete was placed November 30 through December 4, starting at the west end. The rate of paving was 400 ft on the first day and 900 ft on the last day because of the slow methods used to transfer concrete from the ready-mix trucks to the single Maxon spreader and the CMI slip-form paver.
Ready-mixed concrete was delivered at 65 to 70 F, whereas air temperatures ranged from 15 to 48 F. The burlap-polyethylene-straw curing kept the internal temperatures from dropping below 47 F. Subsequently a warming trend brought air temperatures above 50 F on December 7 and higher on the following days. Air and concrete temperatures are shown in Figure 3.
Post-Tensioning
Three steps were specified for stressing the strands to full tension of 29 kip per strand. The first step (to 10 kip per strand) was applied at 2 days of age when the concrete had a strength of more than 1,000 psi, the second step (to 20 kip) took place at 3 days and a concrete strength of 2,000 psi, and the third step (to full strand tension) was achieved when the concrete strength was a minimum of 3,000 psi. The corresponding concrete prestress at the slab end was 70, 140, and 200 psi respectively. The concrete placing and prestressing reco:rds are shown in Figure 3; full prestress was applied at a 7-day maximum to 4-day minimum age. In contrast, on a 300-ft slab placed during July in the state of Delaware (5), full prestress was applied on the day following con-struction. -
Post-tensioning was done with two portable hydraulic jacks, one at each slab end. The strands were jacked against both slab ends in a specified sequence to produce a uniform stress distribution across the 24-ft width.
In the first two stressing steps, to 10 and 20 kip, the west ends of the strand were tensioned first, prior to the east end being jacked to the same specified tension. In the third step, the east end was stressed before the west end of the strand.
Strand elongations at each end were measured for each step of prestressing from the slab end to a mark on the strand. The slab shortening during stressing was not measured directly because the elastic deformations, which did not exceed 0.1 in. at the end, were masked by thermal movements. Typical force-elongation diagrams for the 600- and 760-ft slabs are shown in Figure 4 and are discussed later.

4
Table 1. Site features of the prestressed pavement.
Approximate Vertical Approximate Hori-Alignment zontal Alignment
Slab Curve Curve Cuts and Length strand Grade Length Degree Length Fllls (ft) Encasement (percent) (ft) of Curve (ft) (ft)
400 Steel tube -1.4 0 0 0 0 to 3 C 500 steel tube -1.4 to -0.1 400 4 306 0 to 4 F 600 Steel tube -0.1 0 6'/, 615 4 F to 10 F 760 Plastic -0.1 to +3.5 600 3 533 4 F to 0 500 Plastic +3.5 to -2.0 600 0 0 0 to 3 C 400 Plastic -2.0 0 0 0 3 C to 0
Figure 1. Plastic-coated tendons and bulkhead beam with dowels in place.
Figure 2. Supplemental I-beams shimmed to proper opening and elevation just prior to concreting.
Figure 3. Air and concrete temperature.
••----- I --1 3 ~00 )loll•--------,-- 2 !----1500 ~ ,--a 3-~
~ --a s ·150 -----1--1--J 500 Ill I -- a .J - 1100
70
60
...-,--:::: CONCRETE-FIRST SLAB
.: 50 ci
w C w· a: ::, 40 ... < a: w ... :; w JO ...
20
10 .__._ ___ __..__ _ _ __...._ __ _._ ___ ._ __ __.. ___ __..__ __ __...._ __ _._ ___ ._ __ _.J._ _ _J
NOV. JO DEC. 1 4 8 7 DEC.10
DATE, 1971

5
The total measured elongation is compared with the elongation that would take place if there were no friction of the strand in its enclosure; the ratio shows the average strand effectiveness from end to end of the slab. The minimum strand force, and the corresponding minimum section prestress, occurs near midlength.
The effectiveness of the initial stressing for all the slabs is given in Table 2. The zero-frictio11 elongation was calculated using a modulus of elasticity of 28 x 106 psi and an area of steel equal to O .153 in. 2 •
The relatively low effectiveness for the 10-kip loading on the 400-ft slab with strand in steel tubing probably resulted from bends and mortar in the tubing. Although the resistance for the steel-tube tendons decreased with load, the resistance was high in the plastic-coated tendons at all levels of loading. It is possible that excessive wobble, plastic helical deformation around the individual strand wires, and high-viscosity grease could have caused the high resistance in the plastic-coated tendons.
Each strand was checked and adjusted to 30 kip prior to grouting on December 14 and 15. Because 1/a and 1/4 in. of the elongation is lost in seating the strand chucks, the final strand force is estimated to be about 29.5 kip, or 205 psi on the concrete. The additional elongation of the strand during adjustment ranged up to a total of 3 in. depending on the slab length.
Following final stressing, the strand ends were cut with a Carborundum saw close to the strand chucks. The ends were sealed with 2-in. pipe caps, which were threaded into half couplings welded to the webs of the I-beams. The cap end was sealed with a standard pipe plug after it was grouted.
Grouting
Standard pipe tee fittings with extensions were attached to the tubing for injecting grout. The inlets were covered with metal caps that had short lengths of spring wire projecting upward from them to mark their locations in the concrete.
The grout mixture was made with both types III and I cement mixed with approximately 5 gal of water per sack to produce a flow cone viscosity of 11 sec.
The tubing was blown with air at 250 psi. The grout injection hose, coupled to the %-in. pipe fittings with quick-closing shutoff valves, was used to grout the tubing progressively, advancing in 100-ft increments.
Joint Slabs
The joint slabs were constructed about a month after the main slabs. The joint slab I-beams were carefully leveled and spaced adjacent to the heavier prestressed slab end beams. At the time of construction of these joint slabs, all prestressed slabs had shortened % to % in. independently of temperature.
Joint Filler
Polyurethane was formed in place to about 10 lb/ft3 between the two I-beams at all joints. Four batches per joint were poured and foamed against temporary vertical bulkheads in the joint. The fillers were placed on January 12 and 13, when the air temperatures were 40 to 50 F, and it was necessary to heat the steel surfaces in the joints to obtain a foaming reaction.
Shoulders
The aggregate shoulders were roller-compacted to 3 in. below finished grade from January 10 to 12. The 3-in. bituminous surface was placed 10 ft wide on the north side on January 20 and 21 and 4 ft wide on the south side on February 1. The road was opened to traffic March 6 and was immediately put into use by heavy construction traffic.
Difficulties
Several minor problems that occurred are listed here so that they might be avoided on future projects:

6
1. Wind damage resulted from lifting of the polyethylene; 2. Use of excessively stiff concrete at the start made spreading difficult, caused
excessive thickness at the first joint, and made visible the steel because of inadequate expansion space in the tubing;
3, The I-beams were difficult for the paver to traverse; 4, Grouting and fittings were inadequate; 5, One strand anchor split under 29 kip when 3 jaws were placed in a 2-jaw anchor
body; 6. Dowel sleeves had to be reamed by hand to install dowels; and 7. The joint beams were difficult to align.
ANALYSIS
Strand Friction
Figure 4 shows the strand forces and the measured average strand elongation during each step of jacking. The incremental trapezoidal and triangular areas in the figure are dimensioned to represent the strand elongation, based on the steel stress imposed at the end and the assumption of a linear decrease in stress away from the end. The intersecting sloping lines show the elongation increments when the west ends were tensioned first, to 10 and 20 kip, and when the east ends were tensioned first, from 20 to 29 kip.
In the 600-ft slab, for a 29-kip strand force at the ends, the total measured strand elongation was 44.1 in.-compared to a 48.7-in. zero-friction elongation, an average efficiency of 91 percent, and about 82 percent minimum strand tension near midlength or 24 kip, which is equal to 165-psi minimum effective prestress. The sloping lines from the ends for 10-, 20-, and 29-kip strand force are nearly parallel, indicating a strand friction of the bare strand in the smooth steel tubing of less than 15 lb/ft relatively independent of force.
In the 760-ft slab, the total measured strand elongation for a 29-kip force was 43.4 in.-compared to a 61.7-in. zero-friction elongation, an average efficiency of 70 percent, and minimum strand force near 40 percent of 29 kip, about 12 kip near midlength, which is equal to about 85-psi minimum effective prestress. The greater slopes of the lines from the ends with increasing strand forces indicate that strand friction increases with force as well as distance in the plastic-encased tendons.
The term "wobble friction" is used to define the "friction caused by the unintended deviation of the prestressing steel from its specified profile" (2). It is often designated as the coefficient K per foot of strand length. In structural work its value is normally assumed from 0.0005 to 0.002 for 7-wire strand in metal sheathing and from 0.0003 to 0.002 for greased strand. For a rigid conduit with adequate clearance between the strand and the conduit, K is normally considered as zero.
"Curvature friction" is defined as "friction resulting from bends or curves in the specified prestressing cable profile." It is often designated as the coefficient U per radian of angular change. Its value normally is assumed from 0.05 to 0.15 for greased strand and from 0.15 to 0.25 for strand in metal sheathing.
The tensile force (T,) in the strand at a distance x-feet from the end is computed by the exponential equation
T. = To X e·(Kx + Ua)
where T 0 is the jacking load; a is the curvature, in radians; and K, U, T., and x are the symbols defined previously.
The maximum curvature on the Dulles roadway is a 61/2-deg curve, or 0.0011 rad per ft, causing the curvature friction to be insignificant compared to the wobble friction.
For a constant K and equal loads at each end of a strand, the decrease in tension from each end should be equal and, hence, symmetrical about midlength. Because each end was tensioned separately, some shifting of the point of minimum load occurred as shown in Figure 4.

The incremental strand elongation, d(, in a length dx is
d( = T x dx a. E,
where a, is the strand cross section. Integration produces the total elongation of
X
( = _!_E f T, dx a, '
0
7
The integral is the area under the curve of force along the strand length. Figure 5 shows the variation in strand force away from the end for increasing values of Kx ; also, the corresponding area, equal to the average strand force , is shown in units of T 0 •
The total elongation, as measured, is proportional to the average force that acts over each half-slab. Knowing the distance x, K may be computed. Straight-line and exponential strand force variations are compared in Figure 5 where a, and E, are assumed as unity to simplify the discussion. It shows that, for the assumed conditions and Kx = 1, the strand stress at midlength is approximately 0.1 T 0 higher for an exponential distribution of friction forces than with a linear distribution in this example.
The wobble friction coefficients K, which in this analysis include some curvature friction, were evaluated from the measured elongations and efficiency values given in Table 2. They are 0.0018, 0.0005, and 0.0006 for strands in tubing in the 400-, 500-, and 600-ft long slabs respectively. For the plastic-coated strand, the values are 0.0020, 0.0017, and 0.0020 for the 760-, 500-, and 400-ft long slabs respectively at full initial strand force.
The final calculated average minimum strand loads near the midlengths of the slabs for 29-kip strand force at the ends were 20.3, 25.8, 24.1, 13.3, 19.4, and 19.7 kip for the slabs from west to east respectively, assuming exponential, rather than linear, decrease in strand force.
Continued observations of the transverse crack at the midlength of the 760-ft long slab have not indicated any readjustment of prestress to an age of 100 days.
Slab Friction
Effective prestress counteracts the frictional tension stresses in contracting long slabs. The effective prestress, 200 psi at the slab ends in all slabs and from 135 to 180 psi near midlength in the 400-, 500-, and 600-ft slabs, has been sufficient to prevent transverse cracking of those slabs to date.
By frequent joint measurements, a complete record of principal slab end movements and slab temperatures was obtained for a 3-day period and is shown in Figure 6 for the 600-ft long slab. The figure shows the average joint opening at the two ends in relation to average slab temperature, from 58 F maximum to 34 F minimum. The solid lines are for sustained temperature drop and rise as indicated; the transition between the two lines occurred over several degrees change in temperature, as indicated above the low temperature for the period. The average 24-hour temperature cycle was about 20 F with significant contraction during 15 hours and expansion for 6 hours.
Short-period measurements of length changes were made with a 50-in. long gauge in the transverse and longitudinal directions near the relatively unrestrained ends of the slabs to determine the t hermal coefficient of expansion for the trap rock concrete. Its average value was approxim ately 5.5 >< 10- s per deg F.
The typical slab end movements, as shown in Figure 6 for temperature changes in excess of a few degrees, were similar in all the slabs, with quantitative differences. The contraction and expansion movements occurred at rates linearly related to temperature change, less than the thermal coefficient. The apparent coefficients were 5.1, 4.8, 4.7, and 4.6 millionths per deg F for the half-lengths of the 400-, 500-, 600-, and 760-ft slabs respectively. The measured joint widths were wider during rising

Figure 4. Loading sequence and strand elongations for the 600-ft long slab with strand in tubing and the 760-ft slab with plastic-coated tendons.
0. :ii w 0 a: 0 ... 0 z <t a: 29 Ii;
20
10
Table 2.
29 29
20 20
600-FT. SLAB
O'-----'------'------'-----..L..-----'------'o W 300 200 100 0 100 200 300 E
300 200 100 100 200 300
DISTANCE FROM MID LENGTH, FT.
Effectiveness of Strand Plastic Slab Steel Tubing Slab stressing at various loading Load steps. (kips) 400-Ft 500-Ft 600-Ft 760-Ft 500-Ft
10 67 85 80 20 80 94 86 29 84 94 91
. l'ltt ual elongarlon Note: Effectiveness - thC?Orctlcal eior,gatfon x 100 percent.
68 71 71
80 81 82
Figure 5. Comparison of linear friction distribution with exponental distribution for equal effectivensess.
1.0 "",--,-- -,---.--.-- -,--...,..--.----,---.---,----,-- -,---, 1.0
- ........ X
• ........ - .......... _~ Ave.StrandFo,.,. - J. ··:x dx
-.......... K
" ~,eJ:o
'---; ----. ...._ . , 0 ...... w <.J a: 1r 0 z : 0.5 Ii;
T Strand Force Variation, T:
-...._ -...._ 0.63 - - - - - - - - - -,"'-.: __ ----
0.5
0.2 .__ _ _._ __ ..__ _ _.._ _ _ ..L.. _ __. __ ...... __ ._ _ _,__ __ ._ _ __._ _ _ ..L.. _ _.. __ _, 0.2
0 0.5 1.0 1.3
VALUE OF Kx
" w· u a: !2 0 z <t a: Ii; w
" <t a: w > <t
29
20
10
400-Ft
89 85 83
9
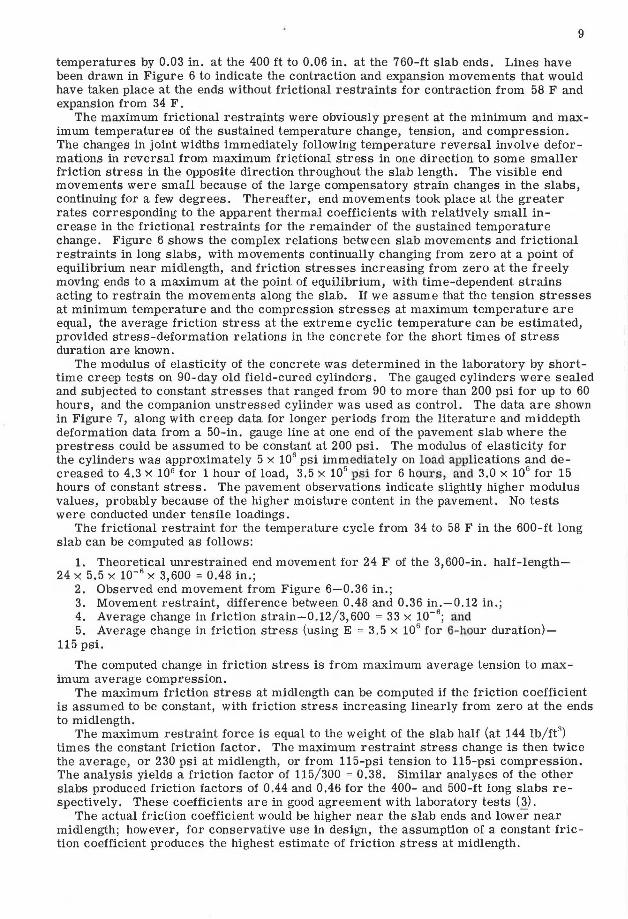
temperatures by 0.03 in. at the 400 ft to 0.06 in. at the 760-ft slab ends. Lines have been drawn in Figure 6 to indicate the contraction and expansion movements that would have taken place at the ends without frictional restraints for contraction from 58 F and expansion from 34 F.
The maximum frictional restraints were obviously present at the minimum and maximum temperatures of the sustained temperature change, tension, and compression. The changes in joint widths immediately following temperature reversal involve deformations in reversal from maximum frictional stress in one direction to some smaller friction stress in the opposite direction throughout the slab length. The visible end movements were small because of the large compensatory strain changes in the slabs, continuing for a few degrees. Thereafter, end movements took place at the greater rates corresponding to the apparent thermal coefficients with relatively small increase in the frictional restraints for the remainder of the sustained temperature change. Figure 6 shows the complex relations between slab movements and frictional restraints in long slabs, with movements continually changing from zero at a point of equilibrium near midlength, and friction stresses increasing from zero at the freely moving ends to a maximum at the point of equilibrium, with time-dependent strains acting to restrain the movements along the slab. If we assume that the tension stresses at minimum temperature and the compression stresses at maximum temperature are equal, the average friction stress at the extreme cyclic temperature can be estimated, provided stress-deformation relations in the concrete for the short times of stress duration are known.
The modulus of elasticity of the concrete was determined in the laboratory by shorttime creep tests on 90-day old field-cured cylinders. The gauged cylinders were sealed and subjected to constant stresses that ranged from 90 to more than 200 psi for up to 60 hours, and the companion unstressed cylinder was used as control. The data are shown in Figure 7, along with creep data for longer periods from the literature and middepth deformation data from a 50-in. gauge line at one end of the pavement slab where the prestress could be assumed to be constant at 200 psi. The modulus of elasticity for the cylinders was approximately 5 x 10⁶ psi immediately on load applications and decreased to 4.3 x 10⁶ for 1 hour of load, 3.5 >t: 106 psi for 6 hours, and 3.0 x 10⁶ for 15 hours of constant stress. The pavement observations indicate slightly higher modulus values, probably because of the higher moisture content in the pavement. No tests were conducted under tensile loadings.
The frictional restraint for the temperature cycle from 34 to 58 F in the 600-ft long slab can be computed as follows:
1. Theoretical unrestrained end movement for 24 F of the 3,600-in. half-length-24 X 5.5 X 10- 6
X 3,600 = 0.48 in.; 2. Observed end movement from Figure 6-0.36 in.; 3. Movement restraint, difference between 0.48 and 0.36 in.-0.12 in.; 4. Average change in friction strain-0.12/3,600 = 33 x 10- 6
; and 5. Average change in friction stress (using E = 3.5 x 10⁶ for 6-hour duration)-
115 psi.
The computed change in friction stress is from maximum average tension to maximum average compression.
The maximum friction stress at midlength can be computed if the friction coefficient is assumed to be constant, with friction stress increasing linearly from zero at the ends to midlength.
The maximum restraint force is equal to the weight of the slab half (at 144 lb/ft3) times the constant friction factor. The maximum restraint stress change is then twice the average, or 230 psi at midlength, or from 115-psi tension to 115-psi compression. The analysis yields a friction factor of 115/300 = 0.38. Similar analyses of the other slabs produced friction factors of 0.44 and 0.46 for the 400- and 500-ft long slabs respectively. These coefficients are in good agreement with laboratory tests ( 3).
The actual friction coefficient would be higher near the slab ends and lower near midlength; however, for conservative use in design, the assumption of a constant friction coefficient produces the highest estimate of friction stress at midlength.

10
The most unfavorable average stress condition in the prestressed slabs exists at minimum temperature near midlength. Computed for the minimum prestress corresponding to the strand forces at midlength, and for 0.5 friction coefficient, a minimum compression stress of 10 to 54 psi exists in the 400- to 600-ft prestressed slabs; however, at midlength in the 760-ft slab, there would be present an average tension stress of about 100 psi for a normal temperature drop.
Transverse Cracking
From January 14 to 16, after rains on January 13, and with strong northerly winds on January 15, the air temperature at the project dropped from 68 to 3 F and the average concrete temperature from 58 to 16 F. The negative temperature gradient was 2 Fper in. or more during the nights of January 15 and 16. Subfreezing temperatures at the subgrade lasted from late evening January 15 to 2 p.m. on January 17 and again from that evening to noon January 18. A transverse crack was discovered on January 17 at 8 a.m. 368 ft from the west end of the 760-ft slab. It probably had occurred a few hours previously. At its discovery, the crack measured about 0.17 in. in width with an average concrete temperature of 18 F. At 5 p.m. that day, the crack was closed at a concrete temperature of 42 F.
The stress conditions at the time of cracking can be estimated by using three major components. Restrained frictional movements for the sustained concrete temperature drop of 42 F produced maximum tensile stresses of about 230 psi, but the stress may have been more than 400 psi if the slab adhered to the frozen subbase. The fully restrained curling for the exceptionally high 2 F per in. negative thermal gradient could have produc ed a surface tensile str ess of a bout 130 [(3 in. x 2 F /in.) x (5.5 x 10- 6/F) x (4 x 10⁶ psi)], added to the naturally existing warping restraint stress of 100-psi tension at the surface ( 6).
The tensile stresses are countered by the prestress. As previously determined, the effective minimum prestress near midlength of the 760-ft slab was about 13.3 kip per strand, which produces an average of 95-psi compressive stress on the cross section.
Summarizing the preceding estimates gives top tension stress from (230 + 130 + 100 -95) 365 to (400 + 130 + 100 - 95) 535 psi, however, the top tension stress may have been even higher because of rapid drying of the wet concrete in the high wind after the rains on January 13, resulting in increased warping restraint stress at the surface.
The crack was carefully observed from March 7 to 10 when the slab end movements were measured for analysis on slab friction. On March 8, the maximum average concrete temperature was 58 F. The crack remained closed on decreasing temperature to 52 F and then widened at an even rate to 0.14 in. at 8 a.m. the next morning at 34 F minimum temperature. On increasing temperature the crack closed to 0.01 in. at 40 F. Figure 8 shows the measured average joint widths at each slab end, 3.01 in. at 58 F when expanding and 3.38 in. at 34 F when contracting, and the total length change, including the change in crack width, for the half-slab.
The friction restraint stresses can be computed, keeping in mind that the frictional tension stress at the crack must equal the strand tension across an open crack and that a contraction of 0.07 in. took place at the crack in each half-slab with a slight increase in tens ion from the crack to the equivalent 700-in. distance [(0.07) / (52 - 34)] 5,5 x 10-a and with an equal, slight decrease to 1,400 in . from the crack and to zero at the slab end. As sw11ing a 4 x 10⁶ psi s ustained m odulus in the cracked slab, the following calculations can be made:
1. Unrestrained length change for 24 Fat 380 ft (4,560 in.)-0.60 in.; 2. Observed length change, 0.37 + 0.07 in.-0.44 in.; 3. Total restraint fr om maximum expansion to contraction-0 .16 in.; 4. Restraint in tens ion for 13 'l'2-kip s trand force, maximum of 95 psi,
(95/4,000,000) X 1,400 + [(95/2) X 4,000,000] X (4,560 - 1,400)-0,071 in.; 5. Restraint in compression during expansion (0.16 - 0.071)-0.089 in.; and 6. Maximum frictional stress change in compression, assuming linear change from
zero at the ends to twice the average at midlength, 2(0.089/4, 560) x 4,000,000-156 psi.

Figure 6. Slab end movements versus the concrete temperature for the 600-ft slab.
u.: w a: ::, I-< a: w .. ::; w I-w Cl < a: w > <
60 r-----.-----,------,-----T"""-----,
600-FT. SLAB
50
40
30 '----~-----'-----~----"'-------' 3.1 3.0 2.8
AVERAGE JOINT WIDTH, IN.
2.6
Figure 7. Effect of sustained loading on the modulus of elasticity.
6.0 ,-- - --....,...-----,.--,.---.----- ~-----
;;; .. -- 0 O - - - • UNLOADING
---o "'~
ui 3.0 ... 0
ci 0 ::; SLAB
----1 DAY
0 ._ ____ ....1... _ ___ ....... _ _. ___ ._ ____ _,__ ____ ..J
0.1 10 102 103 104
DURATION OF LOADING, HOURS
Figure 8. Slab end movements versus the concrete temperature for the cracked 760-ft slab.
60
... 0 c w· 50 a: 0 ::, 0 I- I-<
~ a: w .. 0 ::; w I-
ci > 40 <
3.4 3.2
AVERAGE JOINT WIDTH, IN.
;' ;'
/ I
T
;'
3.0
11

12
The corresponding average friction coefficient would be 156/380, or 0.41. This value compares with 0.38, 0.44, and 0.46 computed for the other slabs in the project. The observations and computations support use of 0.5 friction coefficient for frictional maximum stresses at normal temperature cycles in the long, uncracked, prestressed slabs.
P rogr essive Slab Length Changes
Monuments placed along both edges of the embankment were used in conjunction with measurements across the joints to determine long-time longitudinal movements of the pavement slabs beginning shortly after concrete placement (Fig. 9). The shortening of the sla bs is the result of elastic and inelastic shortening during stressing, shrinkage, and creep. At 100 days, the progressive length changes varied from less than% in. in the 400-ft slab to 1 in. in the 760-ft slab .
The information shown in Figure 9 is replotted in Figure 10 as the unit length change versus time for the slabs. It also shows the unit length changes at middepth, as projected from measurements with the 50-in. long gauge near the ends. The longitudinal measurements include deformations for the longitudinal prestress, and the transverse measurements are for zero prestress. The transverse m easurements indicate a maximum shrinkage of about 70 x 10- 6 at 40 days with some s ubsequent unit expansion of about 10 x 10-6
• These transverse shrinkage values may be slightly low because they include a transverse expansion of about 10 x 106, which is caused by Poisson's ratio effect of the 200-psi prestress at the ends in the longitudinal direction. These values are in agreement with previous studies (6). The longitudinal deformations probably also were affected by the expansion that oc curred after 40 days.
Elevations
Profile measurements over 140-in. lengths showed that the slab ends curled up and down in response to the negative and positive temperature gradients. Full restraint, however, was reached at 50 to 100 in. from the slab ends.
The changes in curvature for overnight curling at the joints and at midlength of the 500-ft slab with plastic-coated tendons are shown in Figure 11. The profile line at the west joint was 2 ft from the edge, whereas that at the east joint was 6 ft from the edge. Although the profiler was supported on two points 100 in. apart, which fluctuated in elevations, the approximate deflections can be determined by projecting the slope changes at the support 120 in. from the joint. This assumes that no change in elevation occurred at that distance from the joint. The figure shows only differences and not the actual profile, but it does indicate that the ends are moving up and down daily, whereas the midlength of the slab remains flat and completely restrained.
The slab el evations near the joints at 3 months of age were derived from 20-in. clinometer slope m eas urements made about 24, 74, and 124 in. -from the end (Fig . 12). Initial measurements were made while the slab was being cured. The data indicate that the slab ends have moved downward 0.02 to 0.03 in. at the joints.
Because the prestress was applied 1/2 in. below middepth at the ends, it produced section compressive stresses of 100 psi at the top and 300 psi at the bottom.
Plain slabs or slabs with prestress at middepth would be expected to warp upward about 0.1 in. over this same period (6). Application of the prestress below middepth appears to have preserved subgrade support near the slab ends and prevented uplift and voids under the joints.
PRETRAFFIC LOAD TESTS
Static Loads
Controlled axle-load tests were made on the two 500-ft slabs on January 25 and 26 after the roadway was essentially completed but before it was subjected to any vehicle loadings. Testing was conducted with both 19%- and 33-kip single-axle loads on the rear of the trailer with tire pressures of approximately 92 psi. The axle could come to about 3 in. of the slab end before the tires received support from the contiguous

Figure 9. Total early age shortening of the slabs, independent of temperature.
~ d z z w .... a: 0.6 0 :,: ., ..J
~ ~
0
o~-----------~----------------' 0 50
AGE. DAYS
100
Figure 10. Unit shortening of main slabs compared to end and transverse length changes, independent of temperature.
·160
~o LONGITUDINAL END --0 400' --.,.,. 6.
d0: 500' AND 600"
760'
~ ·100
~ '9
/~ ~ z· 0 .: D ---- --<(
' ...- - Q - - - - TRANSVERSE :; a: 0 --o ~ (f w
·50 a i
0
0
O'----------------'-------------------' 0 50 100
AGE . DAYS
13

14
Figure 11. Relative movements for the ends and midlength of the 500-ft slab containing plastic-coated tendons.
100" 20"
+0.010 WEST END-EDGE
+0.005
MAR. 7 (+2°/IN.I 0
MAR. B (-0.2°/IN.) ·0.005
+0.006 MID LENGTH
0
·0.005
+0.010
EAST END
-0.006
~ z· 0 ;:: ..: > w ..J w <]
Figure 12. Permanent downward deformation of slab ends caused by prestress below middepth.
+0.05 WEST END +0.06
t+----+--------120"-----------
-0.06

slab, and the center of the wheel could come to within 10 in. of the edge before the outside tire would receive support from the shoulder.
The east end of the 500-ft long slab prestressed with strand in steel tubing was tested by backing the loaded axle toward the transverse joint with the truck centered
15
in the north lane (Fig. 13). The axle was positioned and left for 10 min at distances of 100, 40, 20, and 6 in. from the end while measurements were made. Strain gauges were mounted along the center of the I-beam flange as shown in the figure. The five Benkelman beams were supported on the shoulders and the adjacent slab, essentially outside the basin of influence.
The maximum measured strains and deflections obtained under first the 19.5-kip axle and later the 33-kip axle loadings when they were placed 6 in. from the slab end are shown in Figure 13. Maximum compressive strain occurred directly under the wheel and was about 50 x 10- 6 for the 19.5-kip axle and about 70 x 10- 6 for the 33-kip axle.
Deflections were a maximum between the wheels. For the axles at 6 in. from the joint, the deflections were about 0.04 in. under both axle loadings. The rebound deflection from axle loading at the joint was 0.02 in. for the 19.5-kip axle and 0.035 in. for the 33-kip axle.
A second series of 19.5-kip axle load tests was conducted with the center of the nearest wheel 16 in. from the shoulder edge of the pavement. The various positions are shown in Figure 14 along with the measured strains and deflections. With the axle stationary 6 in. from the joint, the maximwn flexural strain along the joint was about 30 x 10- 0
• Tension occurred at the surface between the wheels. Surface compressive strains of almost equal magnitude occurred under each wheel. Maximum deflection at the corner for this loading was about 0.045 in., and the rebound deflection was 0.038 in.
Five-in. long electric resistance strain gauges were mounted on the concrete along the outside edge of the pavement 20, 40, and 100 in. from the joint. They were used to measure surface edge strains for the 19.5-kip axle. Figure 15 shows the locations of the tires with the outside wheel 16 in. from the edge and the measured strains. When the axle was 6 in. from the joint, the surface tension strain was greatest at about 30 in. from the joint and was about 50 x 10-~ which decreased to less than 30 x 10- 6 at 40 in. from the joil1t.
With the axle in positions 100, 40, and 20 in. from the joint, surface tension was not critical, but bottom tensile edge strains at the wheel were 65 x 10- 6 for the axle when it was 100 and 40 in. from the joint and 50 x 10- 6 when it was 20 in. from the joint.
By extrapolating the preceding information, it is apparent that substantial top tension strains along the transverse joint occur only for the wheel loads near the corner, about 50 x 10-6 maximum for a 20-kip axle within 6 in. of the joint and the outside wheel 10 in. from the edge. Somewhat higher flexural strains along the joint can apparently occur under the wheels of a 20-kip axle tracking normally when crossing the joint, maximum 60 x 10- 6 tension at the bottom. Along the pav ment edg , for a 10-kip corner wheel, the top tension strain can possibly approach a value of 70 x 10- 0 but is less than 30 x 10- 6 for an axle 15 in. or more from the joint. The flexural strain along the edge reaches its maximum value of about 70 x 10- 6 bottom tension at edge wheels more than 20 in. from the joint.
Applying the modulus of elasticity of 5 x 10 6 psi for concrete (from laboratory tests) and 30 x 106 psi for steel to these load tests, the maximum flexural stresses along the joint, under wheels 3 in. from the joint, are ±300 psi in the 6-in. concrete and ±1,800 psi in the 6-in. steel I-beam. Along the edge, the maximum computed flexural stress is -±:350 psi. The longitudinal flexural stresses combine with the prestress of -100 psi at the top and -300 psi at the bottom in the 6-in. pavement near the joints; the resulting maximum combined tension stresses at the edge are +250 psi top tension for a wheel at the corner and +50 psi bottom tension for axles more than 20 in. from the joint.
Moving Loads
Deflections were measured at the west end outside corner of the 500-ft slab (grouted tendons) under the 33-kip axle load moving at creep speed. These were the first heavy

16
Figure 13. Joint edge strains and deflections under 19.5- and 33-kip axle loads.
~ z' 0 ;::: ~ ., ... w 0
SURFACE STRAIN AT JT.
DEFLECTION OF JOINT
Figure 14. Strains and deflections at the joint under a 19.5-kip axle edge load placed at the joint and at 20 and 40 in. from the joint.
56'" 12·· rn··-- ___ ,-:- .... , , .. t:; l -'-1 , _ I \ _ , a: 20" PLAN w + -;-, ... ___ ,-:, ,-l. z -w u 14" ... .,,
,_, ,_ J
6:::i;:- - ----o- ---o-- o-
SURFACE STRAIN AT JT
+50 ..----------------------------,
AXLE .,.,,--....._
~- -==-=----"ii'-i...lll<~~~!>o.,.J./~2:'.'.0'..._'"_.'.:F_'.'.A'.:'O~M'._:J'._'.T:;. '7~:::=::~~-====~ ; 0 ~,------/ ~ r "' 6"FROMJT. '-,._/ ,._ _ /
BEST ESTIMATES 50
DEFLECTIONS OF JOINT +0.02
~ z' 0 0 ;::: u ~ ... w 0
•005
~-- ------------ 40·· ~~~--:--------~~~- ....... ~ ----5".-- ................ 20" ........... .....
-- ...................
a: w 0 ., ::, 0 J:
"'

Figure 15. Strain distribution along the shoulder edge of the slab for axles placed from 6 to 100 in. from the joint.
Figure 16. Corner deflections and rebounds of the end of the 500-ft slab (grouted tendons) during the first six vehicle crossings.
z·
~ 0 I-
"' w C,
~ ..
6" PLAN
~ -50 t--t-- -'c-'%""',,....__,,,----t--t----- -----..---,- -,....,
~ z 0 ;:: u w i w 0 w > ;::
" ..J :, ::!: :, u
0 6
48
o.os ~ - - -
20 40 100
DISTANCE FRDM JOINT, IN.
DISTANCE OF WHEEL TO EDGE , IN .
36 42 24 1B
___.. SUCCESSIVE PASSES OF VEHICLE-
• 10K AXLE O DRIVE AXLE O 33K AXLE
16
Figure 17. Corner deflections for 0.----- --.--------,--- - - - --,-------, different axle weights as the axles crossed the joints at various distances from the shoulder edge.
~ z· 0 ;:: u w ..J ... w 0 IC w z IC 0 u
0.01
0.02
0.03
50 40 30 20 10
DISTANCE OF WHEEL CENTER TO EDGE , IN.

18
loads to cross that joint. Six consecutive crossings were made with the wheel center from 48 to 16 in. from the edge. The trucking sequence and the deflections measured with Benkelman beams are shown in Figure 16. Consolidation under the slab end is shown for these initial applications of a heavy axle load. For normal lane tracking, as represented by the first three runs, the consolidation amounted to 0.007 in. under the corner. The following three loads, tracking 24, 18, and 16 in. from the edge, increased the corner consolidation to 0.015 in. The corner deflections increased from about 0.010 in. for normal wheel tracking to 0.030 in. for the wheel 16 in. from the edge. These creep speed deflections are about one-half of the static deflections for the same axle load, as measured under the 19. 5-kip stationary axle (Fig. 13).
The same data from the creep tests are replotted in Figure 17 to show the relation between corner deflections and the distance to the wheel track for the three axles of the truck. The three curves are consistent and indicate that the deflections under traffic will generally be less than 0.03 in. These deflections will probably decrease after the slab ends are fully seated by traffic.
CONCLUSIONS
The study supports the following conclusions:
1. The prestressed pavement was constructed in essential conformance to the design. The construction problems were remedied without major modifications although they suggest features that could be improved on future projects.
2. Average strand effectiveness, based on elongation, was approximately 90 percent for strand in steel tubing and 80 percent for plastic-enclosed strand. Wobble friction coefficients of 0.0006 and 0.0019 per ft of strand were indicated for the two types of tendons respectively.
3. Independent of temperature, the total length changes because of elastic shortening, shrinkage, and creep were less than 1 in. through 100 days of age. Shortening in the unstressed transverse direction was 70 x 10- 6 in.fin., whereas the longitudinal unit shortening approached values about twice that amount.
4. The double layer of polyethylene under the slab reduced the coefficient of subgrade friction to less than O. 5 for diurnal movements.
5. The slab ends move at a rate consistent with a slightly reduced apparent coefficient of thermal expansion. The expansion movement is offset from the contraction movement by an amount equal to the sum of the average tensile and compressive length changes produced by the frictional restraint stresses.
6. The effective prestress at midlength is from 135 to 180 psi in the 400- to 600-ft slabs and about 95 psi in the 760-ft slab. Subgrade friction for normal temperature drops does not overcome the prestress in the 400- to 600-ft slabs; however, at midlength in the 760-ft slab, a tension stress of about 100 psi could exist for normal temperature drops.
7. The longest slab (760 ft) suffered a transverse crack at about midlength during a sustained concrete temperature drop of 42 F to 16 F at 1 % months of age. The effective prestress at midlength of less than 100 psi was apparently inadequate for this slab length under the extreme environmental conditions.
8. The interiors of the slabs are essentially flat lying because of restrained warping strains. The slab ends curl upward and downward in response to thermal gradient~. The prestress, applied below middepth, has apparently eliminated warping slab end uplift due to moisture gradients.
9. Corner deflections under a static axle load of 20 kip approached 0.04 in. at the transverse ioints on the 6-in. cement-treated base.
10. Tensile stresses up to 300 psi in the concrete occur along the transverse joint and along the longitudinal edge within 40 in. from the corner for a static 20-kip axle at the joint, with one wheel at the corner. Along the edge and away from the joint, maximum longitudinal tensile load stresses are less than 50 psi under the 20-kip axles when the 200-psi prestress is present, exclusive of frictional stress.
11. The first dynamic loads caused consolidation under the joint as the slab end was seated.

19
12. Deflections under a 33-kip axle crossing a joint at creep speed were less than one-half of the deflections under the same stationary load.
ACKNOWLEDGMENT
This report is an abridgment of a Federal Highway Administration report (7). The construction of this project was conducted and supervised by the FHWARegion
15 Demonstration Projects Division. The Pavement Systems Group, Office of Research, developed the design for prestressing and conducted the research study of the pavement.
Testing of the slabs with simulated aircraft loadings is being conducted by the U.S. Corps of Engineers, Waterways Experiment Station, Vicksburg, Mississippi, for the Federal Aviation Administration and will be reported separately.
REFERENCES
1. The AASHO Road Test: Report 5-Pavement Research. HRB Spec. Rept. 61E, 1962. 2. ACI Manual of Concrete Practice. American Concrete Institute, ACI 318-63, Ch.
26, 1968. 3. Methods for Reducing Friction Between Concrete Slabs and Cement-Treated Sub
bases. Cement and Concrete Research Institute, Portland Cement Assn., Sept. 1971. 4. Prestressed Concrete Pavement Demonstration at Dulles International Airport.
Public Roads, Vol. 37, No. 1, June 1972. 5. Prestressed Road Slab Gets Tested. Engineering News-Record, Aug. 5, 1971. 6. Friberg, B. F. Investigations of Prestressed Concrete for Pavements. HRB Bull.
332, 1962. 7. Friberg, B. F. Pres tressed Concrete Highway Pavement at Dulles International
Airport, Research Progress Report to One Hundred Days. Federal Highway Administration, FHWA-RD-72-29.
8. Friberg, B. F. Sector Analysis for Concrete Pavement Load Stresses. Jour. Highway Div., Proc. ASCE, Paper 1153, Jan. 1957.
9. Thwing, J. W. Pres tressed Concrete Pavement Construction. Federal Highway Administration, FHWA-RDDP-17-1, Feb. 1973.