Pressurized Population Growth with Progressive Health ... · population was higher in urban areas...
10
International Research Journal of Social Sciences______________________________________ ISSN 2319–3565 Vol. 4(10), 1-10, October (2015) Int. Res. J. Social Sci. International Science Congress Association 1 Pressurized Population Growth with Progressive Health facility, Life Expectancy and Declining Death in Bangladesh Md. Ashraful Islam Chowdhury * , Mohammad Mahbub Kabir, Abul FazalSayed and Nargis Sultana Department of Environmental Sciences, Jahangirnagar University, Savar, Dhaka-1342, Bangladesh Available online at: www.isca.in Received 6 th September 2015, revised 18 th September 2015, accepted 10 th October 2015 Abstract Population of a country is undoubtedly an important asset. On the other hand, overpopulation is considered as aging for any country. The present study was conducted to show the changing demographic scenario of Bangladesh by reviewing recent literature, especially population censuses of Bangladesh and other sources of demographic data. The division wise spatial distributions of demographic data were carried out by using Geographical Information System (GIS) techniques. The population growth occurred rapidly with a steady state since 1974 to 2011. In 1974, highest and lowest number of population was found in Dhaka (21316067) and Khulna (14195274) division respectively. In 2011, highest and lowest number of population was found in Dhaka (47424418) and Barisal (8325666) division respectively. The growth of population was almost double in the large cities like Chittagong and Dhaka, after 37 years (1974-2011). The density of population was higher in urban areas where industrialization occurred rapidly. The highest and lowest population density was found in Dhaka (685 per square miles) and Khulna (401per square miles) respectively in 1974. In 2011, highest population density was also found in Dhaka division (1502per square miles). Compared to 1974, the literacy percentages of all the divisions were more than double in 2011. The highest and lowest literacy rate was found in Dhaka (56.75) and Syllhet division (45.01) respectively in 2011. Due to the advancement and improvement of heath care and medical facilities and prevention of some specific fatal diseases the death rate and life expectancy of Bangladeshi population was decreased and increased respectively. In 1981, the life expectancy at birth was only 54.8 years, but in 2011, it increased to 69 years at birth. Increased life expectancy results demographic variability because the highest percentage of the population is considered as aging. This study will strengthen the knowledge of current and past demographic conditions of Bangladeshi population so that the policy planner and policy maker can make proper political, social and economic commitment to manage the varying demographic conditions. Keywords: Population, literacy, health facilities, life expectancy, GIS, Bangladesh. Introduction Bangladesh is a country comprising gigantic number of population which is the seventh most populous countries in the world and population is the major problem in Bangladesh, creating many socio-economic problems 1 . Bangladesh is also considered as the most densely populated countries in the world except some small island nations and city states like Singapore and Hong Kong. UNFPA estimation revealed that the population of Bangladesh is approximately 164.4 million with a density of about 1100 people per square kilometer with a growth rate of 1.4 2 . Rapid population growth occurred during the second half of the last century which result the number of population tripled during that period. A projection conducted by UN, 2010 showed that the total number of population in Bangladesh will be 222 million by 2050 3 . According to Bangladesh literacy survey (2010), “57.53% population (aged 7 years and over) of Bangladesh are literate and that they can read and write. The total removal of illiteracy from the country is still far ahead and we have to go a long way to reach the goal of 100% literacy. The highest literacy rate for the age group 15-19 suggests that attainment of literacy is a recent phenomenon, and if the present trend continues, the substantial improvement in literacy will happen in course of time” 4 . Remarkable advances has made by Bangladesh regarding raising life expectancy over the past few decades, especially among the females and the poor people 5 . The average life expectancy of a Bangladeshi child is 64 years 6 which is approximately double compared to the age of those born 55-66 years ago 7 . Ginneken, 1998, said that “ Apart from advancement in medicine, the gain in life expectancy, which has been increasing steadily since the mid-1980s, is an outcome of successful, large-scale public health and development programs such as immunization and the management of diarrheal diseases, a major cause of childhood mortality with a simple oral rehydration therapy” 8 . Microfinance and female education have also helped to raise life expectancy in Bangladeshi population 9 . Increased population density destroys the social structure and socio-environmental balance of a country. Growing population also causes severe competition among people for their basic necessities like food, water, education, cloths, and residents and so on which also results environmental degradation. The present study was conducted to show the division wise increasing trend of population pattern in Bangladesh with the improvement of literacy and health care
Transcript of Pressurized Population Growth with Progressive Health ... · population was higher in urban areas...

International Research Journal of Social Sciences______________________________________ ISSN 2319–3565
Vol. 4(10), 1-10, October (2015) Int. Res. J. Social Sci.
International Science Congress Association 1
Pressurized Population Growth with Progressive Health facility, Life
Expectancy and Declining Death in Bangladesh Md. Ashraful Islam Chowdhury
*, Mohammad Mahbub Kabir, Abul FazalSayed and Nargis Sultana
Department of Environmental Sciences, Jahangirnagar University, Savar, Dhaka-1342, Bangladesh
Available online at: www.isca.in Received 6th September 2015, revised 18th September 2015, accepted 10th October 2015
Abstract
Population of a country is undoubtedly an important asset. On the other hand, overpopulation is considered as aging for
any country. The present study was conducted to show the changing demographic scenario of Bangladesh by reviewing
recent literature, especially population censuses of Bangladesh and other sources of demographic data. The division wise
spatial distributions of demographic data were carried out by using Geographical Information System (GIS) techniques.
The population growth occurred rapidly with a steady state since 1974 to 2011. In 1974, highest and lowest number of
population was found in Dhaka (21316067) and Khulna (14195274) division respectively. In 2011, highest and lowest
number of population was found in Dhaka (47424418) and Barisal (8325666) division respectively. The growth of
population was almost double in the large cities like Chittagong and Dhaka, after 37 years (1974-2011). The density of
population was higher in urban areas where industrialization occurred rapidly. The highest and lowest population density
was found in Dhaka (685 per square miles) and Khulna (401per square miles) respectively in 1974. In 2011, highest
population density was also found in Dhaka division (1502per square miles). Compared to 1974, the literacy percentages
of all the divisions were more than double in 2011. The highest and lowest literacy rate was found in Dhaka (56.75) and
Syllhet division (45.01) respectively in 2011. Due to the advancement and improvement of heath care and medical facilities
and prevention of some specific fatal diseases the death rate and life expectancy of Bangladeshi population was decreased
and increased respectively. In 1981, the life expectancy at birth was only 54.8 years, but in 2011, it increased to 69 years
at birth. Increased life expectancy results demographic variability because the highest percentage of the population is
considered as aging. This study will strengthen the knowledge of current and past demographic conditions of Bangladeshi
population so that the policy planner and policy maker can make proper political, social and economic commitment to
manage the varying demographic conditions.
Keywords: Population, literacy, health facilities, life expectancy, GIS, Bangladesh.
Introduction
Bangladesh is a country comprising gigantic number of
population which is the seventh most populous countries in the
world and population is the major problem in Bangladesh,
creating many socio-economic problems1. Bangladesh is also
considered as the most densely populated countries in the world
except some small island nations and city states like Singapore
and Hong Kong. UNFPA estimation revealed that the
population of Bangladesh is approximately 164.4 million with a
density of about 1100 people per square kilometer with a growth
rate of 1.42. Rapid population growth occurred during the
second half of the last century which result the number of
population tripled during that period. A projection conducted by
UN, 2010 showed that the total number of population in
Bangladesh will be 222 million by 20503. According to
Bangladesh literacy survey (2010), “57.53% population (aged 7
years and over) of Bangladesh are literate and that they can read
and write. The total removal of illiteracy from the country is still
far ahead and we have to go a long way to reach the goal of
100% literacy. The highest literacy rate for the age group 15-19
suggests that attainment of literacy is a recent phenomenon, and
if the present trend continues, the substantial improvement in
literacy will happen in course of time”4. Remarkable advances
has made by Bangladesh regarding raising life expectancy over
the past few decades, especially among the females and the poor
people5. The average life expectancy of a Bangladeshi child is
64 years6 which is approximately double compared to the age of
those born 55-66 years ago7. Ginneken, 1998, said that
“Apart
from advancement in medicine, the gain in life expectancy,
which has been increasing steadily since the mid-1980s, is an
outcome of successful, large-scale public health and
development programs such as immunization and the
management of diarrheal diseases, a major cause of childhood
mortality with a simple oral rehydration therapy”8. Microfinance
and female education have also helped to raise life expectancy
in Bangladeshi population9. Increased population density
destroys the social structure and socio-environmental balance of
a country. Growing population also causes severe competition
among people for their basic necessities like food, water,
education, cloths, and residents and so on which also results
environmental degradation. The present study was conducted to
show the division wise increasing trend of population pattern in
Bangladesh with the improvement of literacy and health care

International Research Journal of Social Sciences____________________________________________________ISSN 2319–3565
Vol. 4(10), 1-10, October (2015) Int. Res. J. Social Sci.
International Science Congress Association 2
facilities so that the policy planner of the Government of
People’s Republic of Bangladesh can make appropriate
initiative to cope with the changing demographic scenarios of
Bangladesh.
Methodology
Data collection: The population, literacy, mortality, life
expectancy data were collected from different sources.
Population data were collected from the population census
1974, 1981, 1991, 2001 and 2011. Literacy data were collected
from Statistical Year book; 2001, 2011 and from population
census. Census is the “total process of collecting, compiling and
publishing demographic, economic and social data pertaining at
a specified time or times to all persons in a country or delimited
territory”10
.Census data are one of the significant sources of
demographic data in Bangladesh produced by Bangladesh
Bureau of Statistics. Mortality and life expectancy data were
collected from Statistical Yearbook 2001 and 2011.
Data preparation and Output results: After collection, the
data were prepared for GIS (Geographical Information System)
output. The data were add to GIS, projected to the shape file and
then prepared for spatial analysis. Figure 1 shows the overall
procedure of spatial distribution of demographic data.
Results and Discussion
Divisional spatial distribution of population growth and
density: After the liberation war of 1971, every single year
Bangladesh faces the ever growing population and now reaches
to the world most densely populated country in the world. By
the spatial distribution from figure-2 it is clearly evident that
population growth occurred rapidly science 1974 to 2011 and
till now. In that figure red color indicated the highest population
and decline blue as lowest population, red color was always at
the middle of the figure, indicating the capital of Bangladesh,
the world most densely populated mega city. According to the
population census 1971, the population of Dhaka city was
21,316,067 within 12005 square miles, but in population census
2001, it is found that the number of population was double
(47,424,418) within the same square miles. According to the
population census 1974, Khulna division comprised the lowest
number of population among other division, although it was
combined with Barisal division and estimated number of
population was 14197274 within 11692 square miles, but from
the population census 2011, it found that the number of
population was 15687759 within 7981 square miles. The blue
color of figure-2 (upper right side) of the image of 1974, 1981,
and 1991 indicated that the number of population in Sylhet
division was lowest. Sylhet division combined with the
Chittagong division in 1974, so the average number of
population was high (table-1). The same case also happened to
Rangpur division (upper side of image-2), before it separated
from Rajshahi division in 1974, 1981, 1991, 2001. Table-1 and
figure 3 show the division wise population variation from
different census report. The total number of population was 71,
479, 071, 82, 544, 081, 106, 314, 992, 123, 851,120 and 144,
043, 697 in 1974, 1981, 1991, 2001 and 2011 respectively. The
number of population was increasing continuously in a steady
state till now (figure-3, A).
Figure-1
Steps of spatial distribution’s image preparation of the demographic data
Final Map
Data Collection
Data preparation
Add Data to GIS
Projection and Transformation
Spatial Analysis
Inverse Distance Weighting
International Research Journal of Social Sciences__
Vol. 4(10), 1-10, October (2015)
International Science Congress Association
Population distribution pattern from 1974 to 2011 (Data sources
Division Name Year 2011 Year 2001
Barisal 8325666
Chittagong 28423019
Dhaka 47424418
Khulna 15687759
Sylhet 9910219
Rajshahi 18484858
Rangpur 15787758
Total 144043697 123851120
* The value ‘0’ indicates that in that period those divisions were combined to with other division.
Division wise spatial
Sciences____________________________________________________
Association
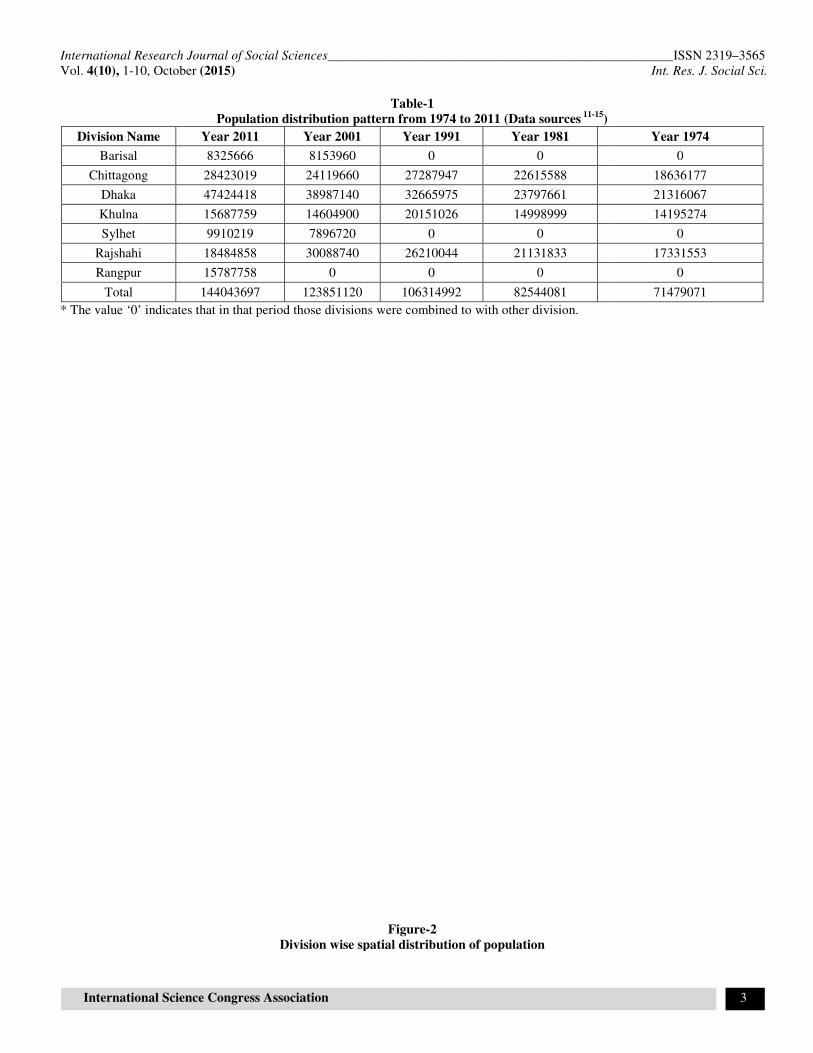
Table-1
Population distribution pattern from 1974 to 2011 (Data sources 11-15
)
Year 2001 Year 1991 Year 1981
8153960 0 0
24119660 27287947 22615588
38987140 32665975 23797661
14604900 20151026 14998999
7896720 0 0
30088740 26210044 21131833
0 0 0
123851120 106314992 82544081
* The value ‘0’ indicates that in that period those divisions were combined to with other division.
Figure-2
Division wise spatial distribution of population
____________ISSN 2319–3565
Int. Res. J. Social Sci.
3
Year 1974
0
18636177
21316067
14195274
0
17331553
0
71479071

International Research Journal of Social Sciences____________________________________________________ISSN 2319–3565
Vol. 4(10), 1-10, October (2015) Int. Res. J. Social Sci.
International Science Congress Association 4
Figure-3(B) depicts that the population density was higher in
urban area, and highest population density was found in the
capital of Bangladesh. In 1974, the highest population density
was 685 (per square km) in Dhaka division.
The population density of Dhaka division was increased day by
day with time. The population census report 2001 revealed that,
the density of Dhaka division reached to 1, 502 (per square km),
which is nearly double compared to the density of population
census report 1974. According to population census 2011, the
lowest population density was observed in Barisal division 613
(per square km).
(A)
(B)
Figure-3
Division wise population growth pattern (A) and population density (B) from 1974 to 201111-15
0
5000000
10000000
15000000
20000000
25000000
30000000
35000000
40000000
45000000
50000000
Barisal Chittagong Dhaka Khulna Sylhet Rajshahi Rangpur
Year 2011
Year 2001
Year 1991
Year 1981
Year 1974
613
831
1,502
699 779
1007960
613
714
1253
656627
872
0
561
608
1050
570 537
759
00
476
843
484
0
612
00
411
685
401
0
502
00
200
400
600
800
1000
1200
1400
1600
Barisal Chittagong Dhaka Khulna Sylhet Rajshahi Rangpur
year 2011
year 2001
year 1991
year 1981
year 1974

International Research Journal of Social Sciences____________________________________________________ISSN 2319–3565
Vol. 4(10), 1-10, October (2015) Int. Res. J. Social Sci.
International Science Congress Association 5
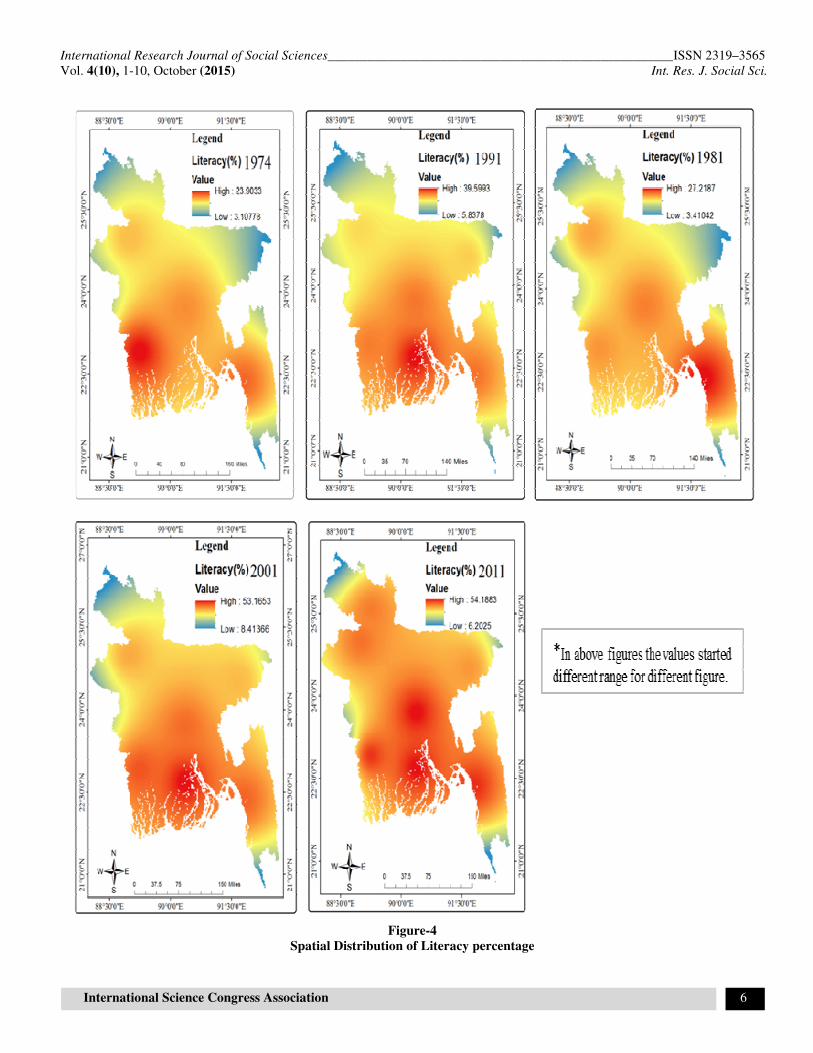
Divisional spatial distribution of literacy: Over population is
a burden for any country, mainly developing country like
Bangladesh. It is good news for Bangladesh that not only the
population is increasing but also the literacy rate increasing
rapidly. Literacy is the ability to read and write. By the spatial
distribution, it is clearly seen that, in the figure-4, (1974, upper
left corner) red color is contributing to a small portion but
yellow and blue color occupied the large portion. So, in 1974
the literacy percentages were low, because red color indicates
high value and blue color indicates low value. But after then in
1981, 1991, 2001 and 2011 literacy rate increased significantly
and it distributed into the whole Bangladesh, where in 1974 it
was found in Khulna division and some part of Dhaka and
Chittagong. In 1974, literacy percentage was 20.37 % for whole
country among which highest literacy percentage was in Khulna
division, 23.9% and lowest literacy percentage was in Rajshahi
division, 17.39%. But in 2001 it was 45.81% for whole country
and 50.8% in 2011. The highest percentage of literacy was
found in Dhaka division (54.19%) and the lowest percentage of
literacy was found in Syllhet division (45.01%) in the year of
2011.From the figure-4 and table-2, it was clear that the literacy
rate was increased with increasing population. According to
Bangladesh literacy survey, 2010, “Illiteracy is a curse and
illumination of illiteracy is not distance enough from
Bangladesh, and far future we have to reach the goal of 100%
literacy. The attainment of literacy is a recent phenomenon, and
if the present trend continues, the considerable improvement in
literacy will happen in course of time”4.
Declining death: For the ever growing population Bangladesh
improves health facility with time and therefore, the life
expectancy, child mortality and maternal mortality rate declined
significantly. In the past sever epidemic diseases caused death
of huge number of life (Figure 5) besides, some environmental
phenomena was also related such as drought, flood that causes
famine and caused a huge life loss. From figure-5, it is clearly
seen that causes of specific death per 100,000 populations
decreased to a greatest extent. In 2002, death due to cholera and
diarrhea was 29 (per 100,000 peoples), but in 2010 it changed
completely to 7.91 (per 100,000 peoples). Not only the causes
of death due to these disease was reduced but also fiver
(Malaria, Typhoid, Influenza, Dengue), Jaundice, Tuberculosis,
Pneumonia were also decreased from 58, 15, 9 and 54 to 27.58,
10.27, 7.06 and 26.43 (per 100,000 peoples) respectively from
the year 2002 to 2010. Figure 5 shows that in 1974 the mortality
rate under five years was 220.8 (per 1,000 live births) and
mortality rate infant was 147.5 (per 1,000 live birth), but in
2011 it declined to 46 (per 1,000 live births) and 36.7(per 1,000
live births) respectively.
Remarkable reduction of infant mortality occurred in
Bangladesh during the period of 1975[150 (per 1000 live birth)]
to 2011[43 (per 1000 live birth)]18
. Mortality rate of adult male
and female was also changed and declined to 177.28 and 166.86
to 160.59and 134.1 (per 1,000 live births) respectively.
Increasing Health facility: Improvement of health and medical
facilities reduced death rate to a substantial amount. The
regionwise dstribution of health and family planning and district
hospital, private hospital, and other NGOs played imporant role
to reduce the death of maternal, child, infant, neonatal and adult
mortality. From figure-6, it wlear that in 1983 Dhaka,
Chittagong, Rajshahi division have only 3 district hospital,but in
2001 it increased to 15, 15, and 14 district hospital respectively
in those division. In that time numerous private hospital also
established by several authorities.In 1983, Dhaka,Chittagong,
Khulna, Rajshahi division had 63, 72, 30, 30 private + health
divisional hospital but in 2001 it incrased to 324, 126 and 138,
138 respectively.
Table-2
Literacy percentage from 1974-2011 (Division wise)
Division Name Year 2011 Year 2001 Year 1991 Year 1981 Year 1974
Barisal 56.75 53.17 0 0 0
Chittagong 52.69 46.88 30.83 22.3 20.92
Dhaka 54.19 46.22 33.5 21.22 19.29
Khulna 52.23 48.14 36.35 27.22 23.9
Sylhet 45.01 39.57 0 0 0
Rajshahi 48.05 40.9 27.1 20.5 17.39
Rangpur 47.19 0 0 0 0
International Research Journal of Social Sciences__
Vol. 4(10), 1-10, October (2015)
International Science Congress Association
Spatial Distribution of Literacy percentage
Sciences____________________________________________________
Association
Figure-4
Spatial Distribution of Literacy percentage
____________ISSN 2319–3565
Int. Res. J. Social Sci.
6

International Research Journal of Social Sciences____________________________________________________ISSN 2319–3565
Vol. 4(10), 1-10, October (2015) Int. Res. J. Social Sci.
International Science Congress Association 7
(A)
(B)
Figure-5
Mortality Rate (A)16
and Cause-Specific Death Rates per 100,000 Population (B)17
220.8
147.5
186.2
125.8134
51
93.580
38
59.2
166.86177.28
46
26.436.7
134.1
160.59
0
50
100
150
200
250
Mortality
rate, under-5 (per
1,000 live births)
Mortality
rate, neonatal (per
1,000 live births)
Mortality
rate, infant (per
1,000 live births)
Mortality
rate, adult, female
(per 1,000 female
adults)
Mortality
rate, adult, male
(per 1,000 male
adults)
1974
1981
1991
2001
2011
3.45
27.58
10.27 7.913.63
7.06
56.49
26.43
14.61
89.35
7
58
15
29
7 9
71
54
8 7
0
10
20
30
40
50
60
70
80
90
100
Year
2010
Year
2002

International Research Journal of Social Sciences____________________________________________________ISSN 2319–3565
Vol. 4(10), 1-10, October (2015) Int. Res. J. Social Sci.
International Science Congress Association 8
(A)
(B)
Figure-6
Regionwise dstribution of health and family planning , district hospital (A); private +health Division (B), DataSource. 19.20,21
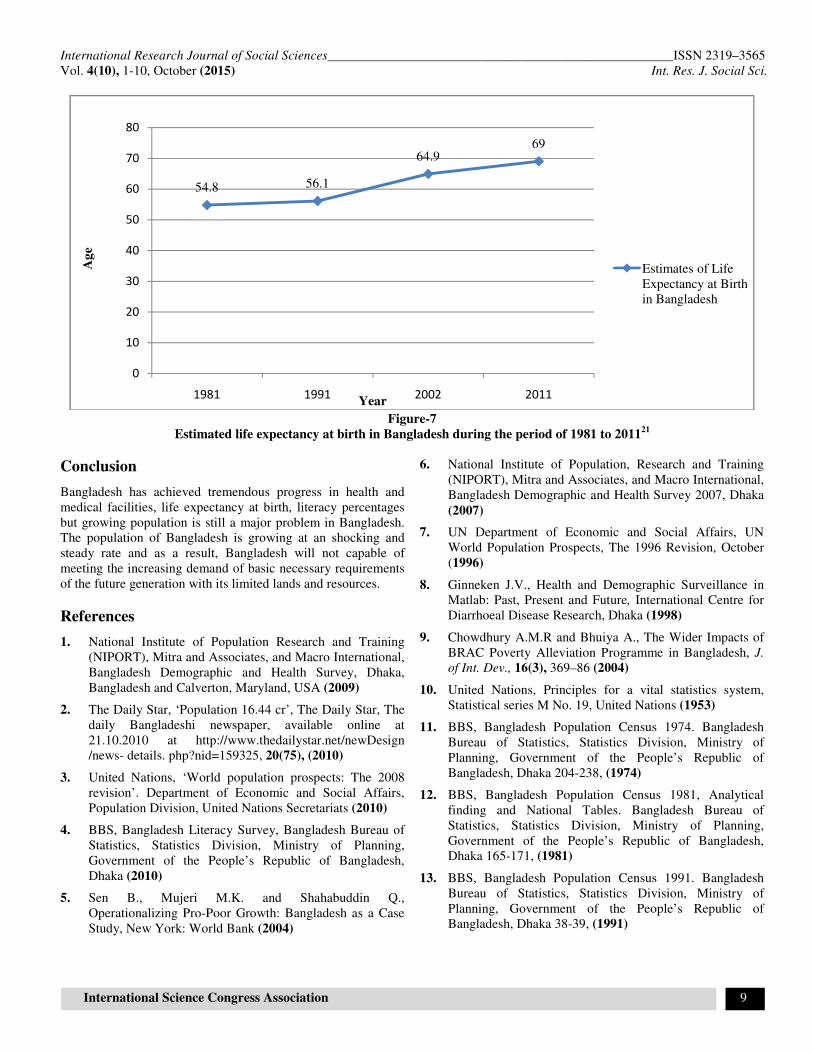
Increasing life expectancy: With increasing population and
increasing health facilities, the life expectancy of Bangladeshi
people increased remarkably. In 1981, the life expectancy at
birth was 54.8 years and in 1991 it increased to 56.1 years
(figure-7). After 11 years life expectancy reached to 64.9 years
(at birth) and in 2011, it reached to 69 years (at birth).
0
1415
16
0
14
0
6
15 15
10
0
14
00
3 3
5
0
3
00
2
4
6
8
10
12
14
16
18
Barisal Chittagong Dhaka Khulna Sylhet Rajshahi Rangpur
District
Hospital
(1990)
District
Hospital
(2001)
District
Hospital
(1983)
0
82
115100
0
47
014
126
342
138
0
138
00
72 63
30
0
30
00
50
100
150
200
250
300
350
400
Barisal Chittagong Dhaka Khulna Sylhet Rajshahi Rangpur
Private+Health
Division
(1990)
Private+Health
Division
(2001)
Private+Health
Division
(1983)
International Research Journal of Social Sciences____________________________________________________ISSN 2319–3565
Vol. 4(10), 1-10, October (2015) Int. Res. J. Social Sci.
International Science Congress Association 9
Figure-7
Estimated life expectancy at birth in Bangladesh during the period of 1981 to 201121
Conclusion
Bangladesh has achieved tremendous progress in health and
medical facilities, life expectancy at birth, literacy percentages
but growing population is still a major problem in Bangladesh.
The population of Bangladesh is growing at an shocking and
steady rate and as a result, Bangladesh will not capable of
meeting the increasing demand of basic necessary requirements
of the future generation with its limited lands and resources.
References
1. National Institute of Population Research and Training
(NIPORT), Mitra and Associates, and Macro International,
Bangladesh Demographic and Health Survey, Dhaka,
Bangladesh and Calverton, Maryland, USA (2009)
2. The Daily Star, ‘Population 16.44 cr’, The Daily Star, The
daily Bangladeshi newspaper, available online at
21.10.2010 at http://www.thedailystar.net/newDesign
/news- details. php?nid=159325, 20(75), (2010)
3. United Nations, ‘World population prospects: The 2008
revision’. Department of Economic and Social Affairs,
Population Division, United Nations Secretariats (2010)
4. BBS, Bangladesh Literacy Survey, Bangladesh Bureau of
Statistics, Statistics Division, Ministry of Planning,
Government of the People’s Republic of Bangladesh,
Dhaka (2010)
5. Sen B., Mujeri M.K. and Shahabuddin Q.,
Operationalizing Pro-Poor Growth: Bangladesh as a Case
Study, New York: World Bank (2004)
6. National Institute of Population, Research and Training
(NIPORT), Mitra and Associates, and Macro International,
Bangladesh Demographic and Health Survey 2007, Dhaka
(2007)
7. UN Department of Economic and Social Affairs, UN
World Population Prospects, The 1996 Revision, October
(1996)
8. Ginneken J.V., Health and Demographic Surveillance in
Matlab: Past, Present and Future, International Centre for
Diarrhoeal Disease Research, Dhaka (1998)
9. Chowdhury A.M.R and Bhuiya A., The Wider Impacts of
BRAC Poverty Alleviation Programme in Bangladesh, J.
of Int. Dev., 16(3), 369–86 (2004)
10. United Nations, Principles for a vital statistics system,
Statistical series M No. 19, United Nations (1953)
11. BBS, Bangladesh Population Census 1974. Bangladesh
Bureau of Statistics, Statistics Division, Ministry of
Planning, Government of the People’s Republic of
Bangladesh, Dhaka 204-238, (1974)
12. BBS, Bangladesh Population Census 1981, Analytical
finding and National Tables. Bangladesh Bureau of
Statistics, Statistics Division, Ministry of Planning,
Government of the People’s Republic of Bangladesh,
Dhaka 165-171, (1981)
13. BBS, Bangladesh Population Census 1991. Bangladesh
Bureau of Statistics, Statistics Division, Ministry of
Planning, Government of the People’s Republic of
Bangladesh, Dhaka 38-39, (1991)
54.8 56.1
64.969
0
10
20
30
40
50
60
70
80
1981 1991 2002 2011
Ag
e
Year
Estimates of Life
Expectancy at Birth
in Bangladesh

International Research Journal of Social Sciences____________________________________________________ISSN 2319–3565
Vol. 4(10), 1-10, October (2015) Int. Res. J. Social Sci.
International Science Congress Association 10
14. BBS, Bangladesh Population Census 2001, Provisional
Report. Bangladesh Bureau of Statistics, Statistics
Division, Ministry of Planning, Government of the
People’s Republic of Bangladesh, Dhaka (2001)
15. BBS, Bangladesh Population Census 2011. Bangladesh
Bureau of Statistics, Statistics Division, Ministry of
Planning, Government of the People’s Republic of
Bangladesh, Dhaka (2011)
16. Bangladesh - Mortality rate [Online] Available at:
http://www.indexmundi.com/facts/bangladesh/mortality-
rate (Accessed on 11 July 2015)
17. BBS, Statistical Yearbook of Bangladesh 2011.
Bangladesh Bureau of Statistics, Statistics Division,
Ministry of Planning, Government of the People’s
Republic of Bangladesh, Dhaka 462-463, (2011)
18. BDHS, Demographic and Health Survey. National
Institute for Population Research and Training (NIPORT),
Ministry of Health and Family Welfare, Bangladesh,
Government of the People’s Republic of Bangladesh,
Dhaka (2012)
19. BBS, Statistical Yearbook of Bangladesh 1983.
Bangladesh Bureau of Statistics, Statistics Division,
Ministry of Planning, Government of the People’s
Republic of Bangladesh, Dhaka (1984)
20. BBS, Statistical Yearbook of Bangladesh 1990.
Bangladesh Bureau of Statistics, Statistics Division,
Ministry of Planning, Government of the People’s
Republic of Bangladesh, Dhaka (1991)
21. BBS, Statistical Yearbook of Bangladesh. Bangladesh
Bureau of Statistics, Statistics Division, Ministry of
Planning, Government of the People’s Republic of
Bangladesh, Dhaka, 56-57, (2012)