PRESSURE MEASURED AT THE RIG FLOOR General Considerations
6
33. DIRECT MEASUREMENT OF PORE FLUID PRESSURE, LEG 84, GUATEMALA AND COSTA RICA 1 Roland von Huene, U.S. Geological Survey, Menlo Park, California 2 ABSTRACT Evidence of considerable overpressuring of pore fluids in the sediment drilled during Leg 84 was obtained from di- rect measurement of pressure by two methods. The first involved measurement of back pressure when the annulus of the drill hole became constricted with unremoved drill cuttings or constriction was caused by plastic inflow of the drill hole walls. The second involved measurement of pressure ahead of the bit in conjunction with in situ water samples and heat flow. All measurements indicated abnormally high pore pressure even in slope deposits of the Middle America Trench off Guatemala. INTRODUCTION The possible role of pore fluid pressure in reducing friction along thrust fault zones was clearly described in the classic paper of Hubbert and Rubey (1959). Hubbert and Rubey considered inactive thrusts where the fluid pressure had probably returned to normal hydrostatic values, so a direct test of the proposed anomalous pres- sure was not possible. However, an opportunity to mea- sure pressure in an active zone of thrust faulting arises when drilling is done in the vicinity of modern subduc- tion zones. High pore fluid pressures in subduction-zone environments were encountered during industry drilling off British Columbia and in the Gulf of Alaska. These holes were drilled on the continental shelf and well above the area of thrust faulting, yet pressures above hy- drostatic levels were measured indirectly by the greater- than-normal weight of drilling mud needed to counter- act formation pressures (Shouldice, 1971; Hottman et al., 1979). Areas of elevated pore pressure near subduc- tion zones off Indonesia, the Philippine Islands, Taiwan, and South America were listed by Fertl (1976). Glomar Challenger drilling, without a closed circulation system, does not provide this type of indirect indication of pore pressure through mud weight, and many DSDP holes on the convergent margins were not logged. However, in a logged hole located near the Japan Trench, a curious de- crease in the density log with depth combined with frac- tured mudstones was thought to have resulted from over- pressured fluids in a fracture porosity (Carson et al., 1982). On Leg 78A, near the front of the Lesser Antilles subduction zone, pore fluid pressure at lithostatic levels was measured when the casing and drill collars inadver- tently became stuck because the space between the col- lars and the hole was packed tightly by drill chips (Biju- Duval, Moore, et al., in press). This packing effectively 1 von Huene, R., Aubouin, J., et al., Init. Repts. DSDP, 84: Washington (U.S. Govt. Printing Office). 2 Address: U.S. Geological Survey, Menlo Park, CA 94025. sealed the bottom of the hole so that all pressure was vented through the jets in the bit and up the drill stem to the rig floor. The pore fluid measurement indicated that drill sticking, which frequently happens during Glomar Challenger drilling on modern convergent margins, could result in some scientific benefit. During Leg 84 the drill became sufficiently stuck while drilling at four sites to measure elevated pore pressure. Additionally, I had proposed to DSDP that a relatively inexpensive pressure-measuring device be installed on the in situ water sampling-heat flow probe. The pres- sure-sensing unit had been designed and some materials purchased by the time Leg 84 began, but the unit had not yet been built; the fact that there were sufficient parts on board at the time of the cruise, combined with the cleverness of the shipboard technical staff who were able to use the parts available, resulted in assembly of the instrument and a series of successful measurements. In this chapter I summarize the information related to indications and direct measurements of elevated pore fluid pressure. PRESSURE MEASURED AT THE RIG FLOOR General Considerations On Glomar Challenger, seawater is pumped down the drill stem to the bit where it circulates back up the drill hole to flush drill chips through the annulus of the hole (space between drill stem and side of hole). The lower 90 m of the drill string is composed of drill collars that have an 8-1/4-in. (20.95-cm) diameter; the drill bit has a 9-7/8-in. (25.08 cm) diameter. Thus the 13/16-in.- wide (2.06-cm) annulus around the collars can become packed with drill chips should circulation stop or be- come insufficient to carry them up the hole (Fig. 1). A driller tries to prevent packing of the annulus so that the drill collars do not become so firmly lodged in the hole as to exceed the pulling capacity of the drill rig and force abandonment of the bottom-hole assembly. Loss of drill fluid circulation is commonly caused by leakage of drilling fluids into porous zones being drilled. 767
Transcript of PRESSURE MEASURED AT THE RIG FLOOR General Considerations

33. DIRECT MEASUREMENT OF PORE FLUID PRESSURE, LEG 84, GUATEMALA ANDCOSTA RICA1
Roland von Huene, U.S. Geological Survey, Menlo Park, California2
ABSTRACT
Evidence of considerable overpressuring of pore fluids in the sediment drilled during Leg 84 was obtained from di-rect measurement of pressure by two methods. The first involved measurement of back pressure when the annulus ofthe drill hole became constricted with unremoved drill cuttings or constriction was caused by plastic inflow of the drillhole walls. The second involved measurement of pressure ahead of the bit in conjunction with in situ water samples andheat flow. All measurements indicated abnormally high pore pressure even in slope deposits of the Middle AmericaTrench off Guatemala.
INTRODUCTION
The possible role of pore fluid pressure in reducingfriction along thrust fault zones was clearly described inthe classic paper of Hubbert and Rubey (1959). Hubbertand Rubey considered inactive thrusts where the fluidpressure had probably returned to normal hydrostaticvalues, so a direct test of the proposed anomalous pres-sure was not possible. However, an opportunity to mea-sure pressure in an active zone of thrust faulting ariseswhen drilling is done in the vicinity of modern subduc-tion zones. High pore fluid pressures in subduction-zoneenvironments were encountered during industry drillingoff British Columbia and in the Gulf of Alaska. Theseholes were drilled on the continental shelf and wellabove the area of thrust faulting, yet pressures above hy-drostatic levels were measured indirectly by the greater-than-normal weight of drilling mud needed to counter-act formation pressures (Shouldice, 1971; Hottman etal., 1979). Areas of elevated pore pressure near subduc-tion zones off Indonesia, the Philippine Islands, Taiwan,and South America were listed by Fertl (1976). GlomarChallenger drilling, without a closed circulation system,does not provide this type of indirect indication of porepressure through mud weight, and many DSDP holes onthe convergent margins were not logged. However, in alogged hole located near the Japan Trench, a curious de-crease in the density log with depth combined with frac-tured mudstones was thought to have resulted from over-pressured fluids in a fracture porosity (Carson et al.,1982).
On Leg 78A, near the front of the Lesser Antillessubduction zone, pore fluid pressure at lithostatic levelswas measured when the casing and drill collars inadver-tently became stuck because the space between the col-lars and the hole was packed tightly by drill chips (Biju-Duval, Moore, et al., in press). This packing effectively
1 von Huene, R., Aubouin, J., et al., Init. Repts. DSDP, 84: Washington (U.S. Govt.Printing Office).
2 Address: U.S. Geological Survey, Menlo Park, CA 94025.
sealed the bottom of the hole so that all pressure wasvented through the jets in the bit and up the drill stem tothe rig floor. The pore fluid measurement indicated thatdrill sticking, which frequently happens during GlomarChallenger drilling on modern convergent margins, couldresult in some scientific benefit.
During Leg 84 the drill became sufficiently stuck whiledrilling at four sites to measure elevated pore pressure.Additionally, I had proposed to DSDP that a relativelyinexpensive pressure-measuring device be installed onthe in situ water sampling-heat flow probe. The pres-sure-sensing unit had been designed and some materialspurchased by the time Leg 84 began, but the unit hadnot yet been built; the fact that there were sufficientparts on board at the time of the cruise, combined withthe cleverness of the shipboard technical staff who wereable to use the parts available, resulted in assembly ofthe instrument and a series of successful measurements.In this chapter I summarize the information related toindications and direct measurements of elevated porefluid pressure.
PRESSURE MEASURED AT THE RIG FLOOR
General Considerations
On Glomar Challenger, seawater is pumped downthe drill stem to the bit where it circulates back up thedrill hole to flush drill chips through the annulus of thehole (space between drill stem and side of hole). Thelower 90 m of the drill string is composed of drill collarsthat have an 8-1/4-in. (20.95-cm) diameter; the drill bithas a 9-7/8-in. (25.08 cm) diameter. Thus the 13/16-in.-wide (2.06-cm) annulus around the collars can becomepacked with drill chips should circulation stop or be-come insufficient to carry them up the hole (Fig. 1). Adriller tries to prevent packing of the annulus so that thedrill collars do not become so firmly lodged in the holeas to exceed the pulling capacity of the drill rig andforce abandonment of the bottom-hole assembly.
Loss of drill fluid circulation is commonly caused byleakage of drilling fluids into porous zones being drilled.
767

R. VON HUENE
Drill chipspacking -annulus
s.# 0.81 -in. (2.06 cm)annulus
„ * " Side of hole—ff < •^v" 9.88-in. (25.08 cm)
* " . diameter
1.5-in. (3.81 cm)diameter probe
Position when inserted formeasurement of temperatureand water sampling
Figure 1. Diagram of bottom-hole assembly with in situ water sam-pling/temperature/pressure probe. One side shows condition dur-ing packing of the annulus with drill chips, the other during nor-mal circulation.
Overpressured zones are commonly porous and will ab-sorb drill fluids introduced at greater than formationpressure, thereby causing a loss of flushing in the hole.Thus chips will collect and pack into the annulus aroundthe drill collars. Back pressure in the circulation systemcan be read on the circulation system pressure gauge to± 10 to 15 psi (7030-10,545 kg/m2) at the rig floor about10 m above the water line. Pressure is also recorded onthe drill logging system. One sign of back pressure iswater flowing out of the drill stem at the rig floor whenthe drill pipe has been unscrewed and stands open. Thisreverse flowage above a 10-m head can be caused notonly by a zone of pressured pore fluid but also by a backflow from settling of the drill-chip-laden fluid withinthe drill hole; however, the column of drill fluid gener-ally settles out in a few minutes, and this effect can beso identified. It must be remembered that contrary tomost drilling for petroleum, Glomar Challenger drillholes are without a closed circulation system, and any
signs of back pressure are in excess of those being vent-ed directly up the hole to the ocean floor.
Site 565
The last 30 m at Site 565 off Costa Rica were difficultto drill because the bottom-hole assembly began to stickat about a depth of 300 m (Site 565 report, this volume).This was accompanied by back pressures measured atthe drill rig of 250 to 350 psi (175 to 246 × I03 kg/m2)and during 5- to 10-min. periods when water flowed outof the drill stem at the rig floor, 10 m above sea level.This reverse flowage could have been caused by a nor-mal back flow from settling of the weighted column offluids carrying chips up the annulus of the drill. Afterabout 10 min. of flow, more than 20 gallons (75.7 L) perminute of returning fluid were measured coming out ofthe drill stem, and the rate of back flow had slowed onlya little. The total volume of fluid in the drill hole wasabout 100 gallons (378.5 L), and I estimate that at leastthis volume had been vented. Thus any back flow fromsettling drill chips had ended, and after 10 min. the backflow was probably from the drainage of pore fluid. Thezone of drilling difficulty corresponds to the change inlithology at the bottom of the hole and the zone of re-covered gas hydrate.
Nonetheless, elevated pore fluid pressure is likelyalong the Costa Rican subduction zone because the 300m of rapidly deposited massive mudstone with very lowpermeability (see Taylor and Bryant, this volume) willimpede the flow of any fluids migrating from below.The zone of difficult drilling was the first zone with sig-nificant fracture porosity where gas hydrate could accu-mulate. Thus water forced from subducted sediment on-ly 600 m below the bottom of the hole could probablymigrate upward through fractures and be trapped by themore plastic upper 300 m of impermeable mud.
Site 567
Evidence of greater than hydrostatic formation pres-sure was observed at the bottom of Hole 567A (501 mbelow the seafloor) when the drill string became stuck.Just prior to sticking, the pressure at the surface whencirculating 244 gal/min. (924 L/min.) read 300 to 350psi (211-246 × I03 kg/m2). When first stuck, the pres-sure when circulating at 230 gal/min. (871 L/min.) was1000 psi (703 × I03 kg/m2) read at the rig floor. Withthe pump turned off, the pressure decreased to 550 psi(387 × I03 kg/m2) but did not go to zero pressure, andwhen the system was bled to zero, closed, but with nopump, the pressure built up again to 500 psi (351 × I03
kg/m2). Because pumping had no effect on the stuckpipe, it was discontinued for nearly 2 hr. while the stuckpipe was worked to freedom. The pressure remained at500 psi (351 × I03 kg/m2). But once the pipe moved ashort distance the pressure dropped to 250 psi (175 ×I03 kg/m2), and when the pipe came free it dropped toessentially zero.
These observations are explained as follows. The pipestuck because cuttings collected around the bottom-holeassembly and sealed off the bottom of the hole. The
768

DIRECT MEASUREMENT OF PORE FLUID PRESSURE
hole may also have constricted because of mobile ser-pentinite. This caused the pressure to rise to 1000 psi(703 × I03 kg/m2) over hydrostatic pressure as mea-sured at the rig floor, and the pressurized water beingpumped down the drill stem escaped into the fracturedrock. The steady 500 psi (351 × I03 kg/m2) for 2 hr.could not have been caused by normal back flow of wa-ter and cuttings from up the annulus because the pres-sure should diminish as the drill cuttings settle out. Thedrop in pressure to zero after the pipe was freed sup-ports this conclusion. The conditions monitored at therig floor are similar to those at Site 565.
Site 569
At Hole 569, sudden failure of the hole at 250.7 mdepth was attributed to elevated pore pressure from theresponse of pump volume and circulation pressures atthe rig floor. When the drill stem became stuck the pres-sure was vented twice to zero and it built up again to 250lb. (176 × I03 kg/m2) without pumping. After about 2hr., when the drill stem broke free, pressures returned tonormal, indicating no back-flow condition from settlingdrill chips. The similarity of this experience with that inprevious holes is considered to indicate overpressuredpore fluid.
IN SITU MEASUREMENTS OF PRESSUREPrior to Leg 84, the possibility of measuring pure
fluid pressure with the in situ water sampling-heat flowprobe was discussed with DSDP, and the necessary trans-ducers were purchased prior to the cruise. Final designand assembly of the pressure-measuring instrumenta-tion was done on board by the electronics and lab tech-nicians. The instrument was ready for testing when wereached Site 568. The output of the pressure transducerwas fed to a second heat flow unit recorder with timerand set for direct reading of pressure in pounds persquare inch (psi). The successful operation of the instru-ment on its first lowering is a tribute to the skill and per-sistence of the technicians.
The combined measurements required changes in pro-cedure. First, a reading of hydrostatic pressure at a setdistance above the bottom of the hole was made withthe instrument locked into the drill bit, and with nopumping of drilling fluids. Then the probe was insertedinto the bottom ahead of the hole and left for 10 min.prior to water sampling. During extraction of pore waterthe pressure dropped from 2500 psi (1758 × I03 kg/m2)or more to 200 to 300 psi (141-211 × I03 kg/m2), andwhen the extraction was completed the pressure rosequickly. The probe was left in place for about 10 min.after sampling and then raised to the mudline, where itwas again left for 10 min. to record bottom water tem-perature. The length of time for a run was limited by the1.5-hr, capacity of the recording units.
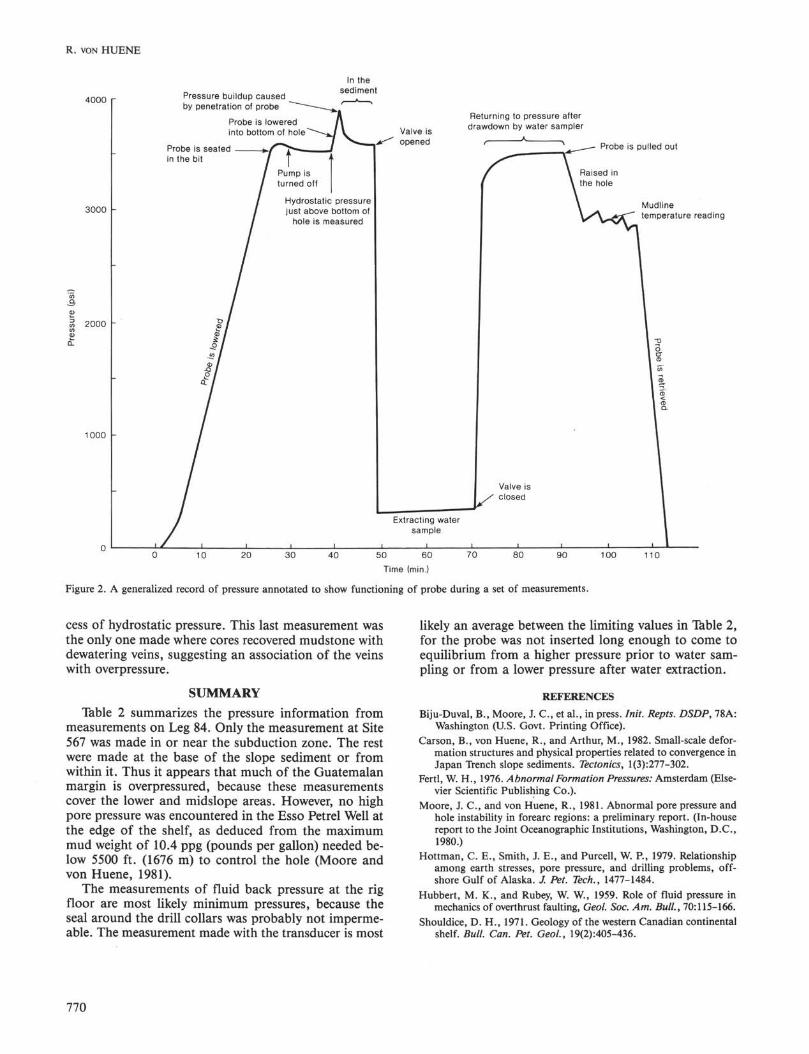
The plots of pressure versus time (Fig. 2) show (1) therapid increase of pressure during lowering of the probe,(2) probable shutdown of the pump (time not recorded)and return to hydrostatic pressure as the probe sat in thebit, (3) a sharp pressure increase during lowering and in-sertion of the probe into the bottom sediment, (4) slow-
ly decreasing pressure as insertion pressure bled off, (5)a sharp drop of pressure during extraction of the watersample, and a sharp increase of pressure to in situ valuesafter closure of the valve, (6) a slow partial recovery oforiginal pressure, (7) decreasing pressure as the probewas raised to the mudline, and (8) rapidly decreasingpressure during return of the probe to the rig floor.These recordings are diagrammed for all runs in Figure 3.
The pressure measured by the probe was compared tothe depth measured from the length of drill pipe to thebit. This gave a hydrostatic pressure gradient of 1.50psi/m (1.06 × I03 kg/m2), which is a bit less than the1.53 psi/m (1.08 × I03 kg/m2) for salt water in wells ofthe Gulf of Mexico (Fertl, 1976). Generally the probemeasurement showed minor pressure fluctuation; on runs3 to 5 it showed a constant value (Fig. 3).
Lowering and insertion of the probe commonly showeda small sharp pressure increase followed by a sharp de-crease and then a slowly decreasing pressure until thewater sampling valve opened. These measurements nev-er seemed to return completely to the pre-water-samplevalue, and some runs showed a slow constant decreasingpressure.
The sharp decrease in pressure to 200 to 300 psi (141-211 × I03 kg/m2) during water extraction indicates astrong seal between the intake part of the probe and theoverlying water. This seal was able to withstand up to3600 psi (2531 × I03 kg/m2) pressure differential. Thislarge drawdown in pressure to fill the evacuated watersampler appears to have affected the system's stability,perhaps by clogging the intake system with mud. Thesubsequent sequence of measurements often fluctuates,particularly the measurements at the mudline.
Several causes other than transducer stability, such asbanging of the tool within the pipe, ship motion, or wirestretch, could have been responsible for the fluctuation.
The results of five measurements with the pressureprobe are listed in Table 1. The measurements show thata good seal was established in the type of sedimentdrilled on Leg 84, providing an effective isolation of theprobe from bottom-hole waters. It also showed that themethod can provide in situ pressure measurements. Thisfirst attempt resulted in less than desired precision be-cause of three main factors: (1) instability of the pres-sure transducer, (2) insufficient time in the disturbedsediment to return to normal pressure, (3) interferencefrom the water sampling. The first two are easily solvedelectronic problems, whereas the third is solved by a sep-arate small-diameter pressure port projecting about 8cm in front of the probe, which creates less disturbanceof sediment and some isolation from extraction of thewater sample.
Another uncertainty may be introduced by the weightof the bit in the bottom of the hole. However, the effectof bit weight probably did not exceed the pressure ob-served during withdrawal of the pore fluid sample, or200 to 300 psi (141-211 × I03 kg/m2). The uncertaintiesintroduced by instrument drift and inadequate time insitu exceeded any departure from hydrostatic pressureon the first three runs, but on the fifth run the depthwas sufficient to provide a departure of pressure in ex-
769
R. VON HUENE
4000 r
3000
2000
1000
Pressure buildup causedby penetration of probe
Probe is loweredinto bottom of hole
Probe is seatedin the bit
Returning to pressure afterdrawdown by water sampler
Probe is pulled out
Hydrostatic pressurejust above bottom of
hole is measured
Mudlinetemperature reading
10 20 30 40 50 60
Time (min.)
70 80 90 100 110
Figure 2. A generalized record of pressure annotated to show functioning of probe during a set of measurements.
cess of hydrostatic pressure. This last measurement wasthe only one made where cores recovered mudstone withdewatering veins, suggesting an association of the veinswith overpressure.
SUMMARYTable 2 summarizes the pressure information from
measurements on Leg 84. Only the measurement at Site567 was made in or near the subduction zone. The restwere made at the base of the slope sediment or fromwithin it. Thus it appears that much of the Guatemalanmargin is overpressured, because these measurementscover the lower and midslope areas. However, no highpore pressure was encountered in the Esso Petrel Well atthe edge of the shelf, as deduced from the maximummud weight of 10.4 ppg (pounds per gallon) needed be-low 5500 ft. (1676 m) to control the hole (Moore andvon Huene, 1981).
The measurements of fluid back pressure at the rigfloor are most likely minimum pressures, because theseal around the drill collars was probably not imperme-able. The measurement made with the transducer is most
likely an average between the limiting values in Table 2,for the probe was not inserted long enough to come toequilibrium from a higher pressure prior to water sam-pling or from a lower pressure after water extraction.
REFERENCES
Biju-Duval, B., Moore, J. C , et al., in press. Init. Repts. DSDP, 78A:Washington (U.S. Govt. Printing Office).
Carson, B., von Huene, R., and Arthur, M., 1982. Small-scale defor-mation structures and physical properties related to convergence inJapan Trench slope sediments. Tectonics, l(3):277-302.
Fertl, W. H., 1976. Abnormal Formation Pressures: Amsterdam (Else-vier Scientific Publishing Co.).
Moore, J. C , and von Huene, R., 1981. Abnormal pore pressure andhole instability in forearc regions: a preliminary report. (In-housereport to the Joint Oceanographic Institutions, Washington, D.C.,1980.)
Hottman, C. E., Smith, J. E., and Purcell, W. P., 1979. Relationshipamong earth stresses, pore pressure, and drilling problems, off-shore Gulf of Alaska. J. Pet. Tech., 1477-1484.
Hubbert, M. K., and Rubey, W. W, 1959. Role of fluid pressure inmechanics of overthrust faulting, Geol. Soc. Am. Bull., 70:115-166.
Shouldice, D. H., 1971. Geology of the western Canadian continentalshelf. Bull. Can. Pet. Geol., 19(2):405-436.
770

DIRECT MEASUREMENT OF PORE FLUID PRESSURE
Pressure measurement 1Water depth = 2120.4 m; Sub-bottom depth 89.4 m
Pressure measurement 2Water depth = 2020 m; Sub-bottom depth = 137.2 m
3500
3000
2500
Pre
ssur
e (p
si
o
oo
o
1000
500
n
sProbe into mud
/
: /
j|_
{Sam
plin
g
f\ MudlineKunt
I
I
In bitProbe in mud
Mudline
Pressure measurement 3Water depth = 2020 m; Sub-bottom depth = 186.2 m
3500
3000
2500cö
f 20003CO
α> 1500
1000
500
n
In bit y*"""*
//
/
/
• /
• /
In mud
Sampling
i i i j .
\
\ Mudline
I1
Pressure measurement 4Water depth = 2020 m; Sub-bottom depth = 282.3 m
In bit In mudIn mud
Mudline
Sampling time
0 10 20 30 40 50 60 70 80 90 100 110 120Time (min.)
Pressure measurement 5Water depth = 2020 m; Sub-bottom depth = 359.9 m
4000
3500
3000
^ 2500a.
I 2000CO
Φ
°- 1500
1000
500
00 10 20 30 40 50 60 70 80 90 100 110 120
Time (min.)
Figure 3. Graphs of pressure versus time during runs of the pressure/temperature/water sample probe.
0 10 20 30 40 50 60 70 80 90 100 110 120Time (min.)
In bit p VIn mud
Sampling
In mud
\Λ Mudline
feu
1
771

R. VON HUENE
Table 1. Pressure measurements at Site 568 with a transducer.
Run
1234
Totaldepth(m)
2109.42157.22206.22302.3
Sub-bottomdepth
(m)
89.4137.2186.2282.3
Calibrationdifference
(psi)
3407
28
Hydrostaticpressure
(psi)
3171323733093488
Minimum Maximumpressure pressure
before sample after sample(psi) (psi) Remarks
3258 31353394 32383555 3394
Less than hydrostatic pressure
At hydrostatic pressureSlightly overpressuredWater sample contaminated—probe
did not seat2379 359.9 19 3537 3795 3701
Note: Total depth = sub-bottom + water depth; calibration difference = difference, beginning and end of run at 5000 psi propor-tionate to hydrostatic pressure (1 psi = kPa); hydrostatic pressure = pressure at bottom of hole from reading in bit + 1.5 psi ×height (in meters) above bottom of hole; minimum pressure before sample = last or lowest measurement prior to opening ofwater sampler valve; maximum pressure after sample = highest value before pullout and return of probe to ship.
Table 2. Summary of pore fluid pressure data, Leg 84.
Site
565
567
568569
Waterdepth(m)
3101
5519
20202804
Sub-bottomdepth (m)/
pressuredifferential
(psi)
328/250-350
501/500
360/164-258250.7/250
Averagedensity
to pressuremeasurement
(g/cm3)
1.55
1.87
1.441.55
Hydrostaticpressure
(psi)
5144
9030
35374582
Lithostaticload(psi)
727
1340
737556
Percentageabove
hydrostaticpresure
34-48
37
25-3045
Remarks
Associated with fractured rockand hydrate
125 m serpentinite of question-able density
From pressure transducer
Note: pressure differential = pressure read at rig floor; average density = weighted density average to depth of pressure mea-surement from measured core densities; hydrostatic pressure = pressure gradient of 1.5 psi/m × depth to pressure mea-surement; lithostatic load = average density × depth conversion from kg/m^ to psi (1.43); percentage above hydrostaticpressure = lithostatic load divided by measured pressure minus hydrostatic pressure.
772