![Product Release Note Oracle FLEXCUBE Universal Banking Release · PDF fileProduct Release Note Oracle FLEXCUBE Universal Banking Release 12.0.2.0.0 [October] [2013] Product Release](https://static.fdocuments.net/doc/165x107/5ab76af57f8b9ad5338b88e3/product-release-note-oracle-flexcube-universal-banking-release-release-note.jpg)
Press Release...Press Release 1 RETAIL BANKING - SPECIALISED FINANCIAL SERVICES & INSURANCE –...
27
Press Release 1 RETAIL BANKING - SPECIALISED FINANCIAL SERVICES & INSURANCE – PRIVATE BANKING, GLOBAL INVESTMENT MANAGEMENT& SERVICES – CORPORATE & INVESTMENT BANKING QUARTERLY FINANCIAL INFORMATION Paris, August 3rd, 2011 Q2 2011: RESILIENT RESULTS AND INCREASED CAPITAL Increased revenues** vs. Q2 10: EUR 6.5bn** (+2.1%*) Decline in the cost of risk confirmed for all businesses: 58 bp*** (-28 bp vs. Q2 10) Write-down of Greek government bonds: EUR -395m before tax, EUR -268m after tax Group net income: EUR 747m Enhanced financial strength of the Group: Core Tier 1 ratio of 9.3% and Tier 1 ratio (Basel 2) of 11.3% (1) Î generation of +0.5 pts of capital in Q2 11 H1 2011: SOLID PERFORMANCES Group revenues**: EUR 13.5bn**, +4.4%* vs. H1 10 Group net income: - EUR 1,663m - EUR 1,891m excluding the revaluation of own financial liabilities (stable vs. H1 10) EPS (2) : EUR 2.05 * When adjusted for changes in Group structure and at constant exchange rates. ** Excluding revaluation of own financial liabilities *** Cost of risk excluding litigation issues, legacy assets and Greek government bond write-down (1) Excluding floor effects (additional capital requirements with respect to floor levels) (2) After deducting interest to be paid to holders of deeply subordinated notes and undated subordinated notes (respectively EUR 150 million and EUR 12 million) PRESS RELATIONS SOCIETE GENERALE LAETITIA MAUREL +33(0)1 42 13 88 68 [email protected] ASTRID BRUNINI +33(0)1 42 13 68 71 [email protected] HELENE MAZIER +33(0)1 58 98 72 74 [email protected] SOCIETE GENERALE COMM/PRS 758886 PARIS CEDEX 18 SOCIETEGENERALE.COM A FRENCH CORPORATION WITH SHARE CAPITAL OF EUR 970,099,988.75 552 120 222 RCS PARIS
Transcript of Press Release...Press Release 1 RETAIL BANKING - SPECIALISED FINANCIAL SERVICES & INSURANCE –...

Press Release
1RETAIL BANKING - SPECIALISED FINANCIAL SERVICES & INSURANCE – PRIVATE BANKING, GLOBAL INVESTMENT MANAGEMENT& SERVICES – CORPORATE & INVESTMENT BANKING
QUARTERLY FINANCIAL INFORMATION
Paris, August 3rd, 2011
Q2 2011: RESILIENT RESULTS AND INCREASED CAPITAL
Increased revenues** vs. Q2 10: EUR 6.5bn** (+2.1%*) Decline in the cost of risk confirmed for all businesses:
58 bp*** (-28 bp vs. Q2 10) Write-down of Greek government bonds: EUR -395m before tax, EUR -268m after
tax Group net income: EUR 747m Enhanced financial strength of the Group: Core Tier 1 ratio of 9.3% and Tier 1 ratio
(Basel 2) of 11.3%(1) generation of +0.5 pts of capital in Q2 11 H1 2011: SOLID PERFORMANCES
Group revenues**: EUR 13.5bn**, +4.4%* vs. H1 10 Group net income:
- EUR 1,663m - EUR 1,891m excluding the revaluation of own financial liabilities (stable vs.
H1 10) EPS(2): EUR 2.05
* When adjusted for changes in Group structure and at constant exchange rates.
** Excluding revaluation of own financial liabilities
*** Cost of risk excluding litigation issues, legacy assets and Greek government bond write-down
(1) Excluding floor effects (additional capital requirements with respect to floor levels)
(2) After deducting interest to be paid to holders of deeply subordinated notes and undated subordinated notes (respectively EUR 150 million and EUR 12 million)
PRESS RELATIONS SOCIETE GENERALE
LAETITIA MAUREL +33(0)1 42 13 88 68 [email protected] ASTRID BRUNINI +33(0)1 42 13 68 71 [email protected]
HELENE MAZIER +33(0)1 58 98 72 74 [email protected]
SOCIETE GENERALE COMM/PRS 758886 PARIS CEDEX 18 SOCIETEGENERALE.COM A FRENCH CORPORATION WITH SHARE CAPITAL OF EUR 970,099,988.75 552 120 222 RCS PARIS

2/27
The Board of Directors of Societe Generale examined the Group’s financial statements for Q2 and H1 2011 on August 2nd, 2011. Group net income totalled EUR 747 million in Q2. It includes a EUR 268 million Greek government bond write-down (EUR 395 million before tax and minorities), calculated based on the conditions of the European agreements concluded on July 21st. While there was further confirmation of the moderate recovery in the developed economies in Q2 2011, growing concerns over European sovereign debt resulted in risk aversion and erratic market movements, in line with political developments. Against this backdrop, Societe Generale continued to implement its strategy aimed at adapting the Group to a tighter regulatory environment, by enhancing its capital management, reducing its market risk exposure, securing its liquidity needs and diversifying its financing sources. Q2 business results reflect the global economic and financial situation which remained mixed. The French Networks’ performance was satisfactory, while International Retail Banking’s earnings, which were impacted by the consequences of the political unrest in Africa and the Mediterranean Basin in Q1, enjoyed a recovery. Meanwhile, Specialised Financing and Insurance’s contribution to the Group’s results continued to grow. Corporate and Investment Banking revenues proved highly resilient given the deteriorated market environment, whereas Private Banking, Global Investment Management and Services was impacted by an unfavourable market environment and non-recurring provisions in Q2. Frédéric Oudéa, the Group’s Chairman and CEO, stated: “The Q2 results testify to the Group’s resilience in an uncertain economic and financial environment. In addition to reflecting our businesses’ solid performances, these results incorporate the write-downs booked on Greek government bonds, whose impact is nevertheless limited, as expected. Once again, the Group has demonstrated its ability to significantly boost its capital in H1. By the end of 2013, the Societe Generale Group will achieve a Basel 3 Core Tier 1 ratio of at least 9% thanks to its solid results, and with the same priority given to the very disciplined management of its capital and risk-weighted assets and the rigorous control of costs and risks, even if the Group net income target of EUR 6 billion in 2012 now appears difficult to achieve within the scheduled timeframe. In light of our achievements in H1, I remain confident regarding the continuing growth of our results and the achievement of our transformation objectives set out in the Ambition SG 2015 plan.”

3/27
1. GROUP CONSOLIDATED RESULTS
Net banking income The Group’s net banking income totalled EUR 6.5 billion in Q2 2011 (EUR 6.7 billion in Q2 10) and EUR 13.1 billion in H1 2011, slightly lower than in H1 2010 (EUR 13.3 billion). If the effect of the revaluation of own financial liabilities (which flattered Q2 10 revenues and reduced Q1 11 revenues) is stripped out, revenues rose +2.1%* vs. Q2 10 and +4.4%* in H1 (to EUR 13.5 billion). This trend reflects the satisfactory performances of the retail banking businesses and the resilience of Societe Generale’s corporate and investment banking activities:
- The French Networks reported revenues of EUR 2,038 million in Q2 11, up +5.5% vs. Q2 10 (+1.0% excluding the PEL/CEL effect and SMC). The French Networks’ H1 net banking income rose +6.6% in absolute terms between 2010 and 2011 (+2.8% excluding the PEL/CEL effect and SMC);
- International Retail Banking’s net banking income totalled EUR 1,260 million (+1.4%* compared with Q2 10). The recovery can be attributed to the gradual return to normal operating conditions in Africa and the Mediterranean Basin, as well as the beginning of improved economic conditions in Central and Eastern European countries. International Retail Banking’s H1 net banking income amounted to EUR 2,449 million, up +1.1% vs. H1 10;
- Corporate and Investment Banking revenues proved highly resilient (+7.4%* vs. Q2 10 at EUR 1,835 million) in a sluggish environment, particularly for flow activities. The Q2 results were underpinned by financing and advisory activities, as well as sales of structured products.
Corporate and Investment Banking’s legacy assets made a slightly positive contribution to Q2 net banking income (EUR 43 million).
Overall, division revenues rose +6.5%* between H1 10 and H1 11 to EUR 4,115 million.
In EUR m Q2 10 Q2 11 ChangeQ2 vs Q2 H1 10 H1 11 Change
H1 vs H1Net banking income 6,679 6,503 -2.6% 13,260 13,122 -1.0%
On a like-for-like basis* -1.6% -1.1%Produit net bancaire** 6,425 6,487 +1.0% 12,905 13,467 +4.4%
On a like-for-like basis* +2.1% +4.4%Operating expenses (4,065) (4,241) +4.3% (8,066) (8,617) +6.8%
On a like-for-like basis* +6.0% +7.6%Gross operating income 2,614 2,262 -13.5% 5,194 4,505 -13.3%
On a like-for-like basis* -13.4% -14.4%Net allocation to provisions (1,010) (1,185) +17.3% (2,142) (2,063) -3.7%Operating income 1,604 1,077 -32.9% 3,052 2,442 -20.0%
On a like-for-like basis* -33.5% -22.0%Group net income 1,084 747 -31.1% 2,147 1,663 -22.5%
Résultat net part du Groupe** 916 737 -19.6% 1,913 1,891 -1.1%
Q2 10 Q2 11 H1 10 H1 11Group ROE after tax 10.9% 6.9% 11.0% 7.8%Group ROE after tax** 9.1% 6.8% 9.7% 9.0%

4/27
- Specialised Financial Services and Insurance saw its revenues progress slightly in Q2 (+0.3%* vs. Q2 10) and in H1 (+4.2%* vs. H1 10). In the case of Specialised Financing, this reflected primarily the good performance of operational vehicle leasing and fleet management activities, as well as the refocusing of consumer finance activities. At the same time, the division’s insurance activities have made a growing contribution to net banking income, with an increase of +17.7%* between Q2 10 and Q2 11 (+16.4%* in H1).
- The Q2 net banking income of Private Banking, Global Investment Management and Services was impacted by an unfavourable market environment, which affected the Asset Management and Broker activities in particular. Revenues were lower (EUR 547 million vs. EUR 592 million in Q2 10), despite the dynamic growth of Private Banking and Securities Services activities. The division’s H1 revenues were up +3.0%* at EUR 1,127 million.
The revaluation of own financial liabilities had a negligible impact in Q2 (EUR +16 million vs. EUR +254 million in Q2 10). Therefore, the overall impact amounted to EUR -345 million in H1 11, vs. EUR +355 million in H1 10.
Operating expenses Operating expenses amounted to EUR 4.2 billion in Q2 11 (+4.3% vs. Q2 10) and EUR 8.6 billion in H1 (+6.8% vs. H1 10). They were slightly lower than in Q1 11 in absolute terms (-3.1%).
The cost to income ratio was 65.4%** in Q2 11 and 64.0%** in H1 11, reflecting investment efforts to transform the Group and the less buoyant environment in Q2 11 for financial activities. Operating income
The Group’s gross operating income, excluding the revaluation of own financial liabilities, totalled EUR 2.2 billion in Q2 (EUR 2.4 billion in Q2 10). It amounted to EUR 4.9 billion in H1 11 (stable vs. H1 10).
The Q2 cost of risk was EUR 1,185 million, up +17.3% vs. Q2 10 and +35.0% vs. Q1 11, due to a EUR -395 million Greek government bond write-down. When restated for this write-down and the cost of risk for Corporate and Investment Banking’s legacy assets, the Group’s cost of risk amounts to EUR 660 million, down -15.5% vs. Q1 11.
Despite the Greek government bond write-down, the total cost of risk was down -3.7% at EUR 2,063 million in H1, vs. EUR 2,142 million in H1 10.
The Group’s cost of risk amounted to 58(a) basis points in Q2 11, providing further evidence of the downtrend that began in Q1 10 (-12 bp vs. Q1 11).
At 36 basis points (vs. 52 bp in Q2 10 and 40 bp in Q1 11), the French Networks’ cost of risk continued to decline, in line with expectations.
** Excluding the revaluation of own financial liabilities (a) Annualised, excluding litigation issues, legacy assets in respect of assets at the beginning of the period and the Greek government bond write-down

5/27
At 149 basis points (vs. 192 bp in Q2 10 and 174 bp in Q1 11), International Retail Banking’s cost of risk continued to decline. Given the economic situation in these countries, the cost of risk remained low in the Czech Republic and Russia whereas it was stable in Romania. The Q2 cost of risk remained limited in Sub-Saharan Africa and the Mediterranean Basin. However, in line with the prudent policy adopted by the Group, the EUR 51 million of portfolio-based provisions constituted in Q1 11 were maintained in this region. The net cost of risk remained high in Greece, in a still deteriorated economic environment.
The Q2 cost of risk for Corporate and Investment Banking’s core activities was negligible (at 0 bp vs. 10 bp in Q2 10 and 12 bp in Q1 11). Legacy assets’ cost of risk remained under control at EUR -130 million over the period.
Specialised Financial Services’ cost of risk improved by approximately 80 bp year-on-year to 156 basis points in Q2 11 vs. 234 bp in Q2 10. The Q2 cost of risk for consumer finance and equipment finance remained stable on the whole compared with the previous quarter.
At the same time, at Group level, the doubtful loan coverage ratio was 71% in Q2 11, virtually stable vs. the end of Q1 11 (72%). The Group booked a EUR -395 million Greek government bond write-down in Q2 11 following the European agreements concluded on July 21st, 2011. The write-down has been booked to the Corporate Centre pending the actual exchange operations.
The Group’s operating income totalled EUR 1,077 million in Q2 11, down -33.5%* vs. Q2 10, but up 7.9% excluding the impact related to the revaluation of own financial liabilities and the Greek government bond write-down.
Operating income amounted to EUR 2,442 million in H1 11, up +18.02% excluding the revaluation of own financial liabilities and the Greek government bond write-down, vs. H1 10 (-22.0%*).
Net income
After taking into account tax (the Group’s effective tax rate was 27.8%) and non-controlling interests, Group net income totalled EUR 747 million in Q2 (vs. EUR 1,084 million in Q2 10), and EUR 1,663 million in H1 (vs. EUR 2,147 million in H1 10).
Group net income was stable** vs. H1 10. It fell -19.6%** in Q2 11 vs. Q2 10, given the impact of the Greek government bond write-down.
Group ROE after tax was 6.9% in Q2 11 and 7.8% in H1.
Earnings per share amounts to EUR 2.05 over this period, after deducting interest to be paid to holders of deeply subordinated notes and undated subordinated notes1.
1 The interest net of tax effect to be paid at end-June 2011 amounts to EUR 150 million for holders of deeply subordinated notes and EUR 12 million for holders of undated subordinated notes ** Excluding the revaluation of own financial liabilities

6/27
2. THE GROUP’S FINANCIAL STRUCTURE The success of the scrip dividend subscription has boosted the Group’s shareholders’ equity by EUR 0.9 billion and resulted in the issue of 23.9 million new shares at a price of EUR 37.18, taking the total number of Group shares to 770.3 million. Group shareholders’ equity totalled EUR 47.6 billion1 at June 30th, 2011 and net asset value per share was EUR 54.15 (including EUR +0.46 of unrealised capital gains). Societe Generale did not buy back any of its own shares in Q2. As a result, at June 30th, 2011, Societe Generale possessed, directly and indirectly, 20.0 million shares (including 8.9 million treasury shares), representing 2.6% of the capital (excluding shares held for trading purposes). At this date, the Group also held 7.5 million purchase options on its own shares to cover stock option plans allocated to its employees. Basel 2 risk-weighted assets totalled EUR 333.0 billion at June 30th, 2011 vs. EUR 333.3 billion at March 31st, 2011, reflecting the Group’s prudent management policy in an unstable economic environment in Q2, with in particular reduced exposure to market risks. Societe Generale’s Tier 1 ratio was 11.3%2 at June 30th, 2011 vs. 10.8% at March 31st, an improvement of 44 basis points in Q2. There was a significant increase in the Group’s capital base during H1. The Basel 2 Core Tier 1 ratio stood at 9.3% at June 30th, 2011 vs. 8.5% at December 31st, 2010 (8.8% at end-March 2011), or +74 bp, derived primarily from the Group’s profit-generating capacity and the incorporation of the good 2010 results, resulting from 68% of shareholders subscribing to the scrip dividend option (combined Core Tier 1 effect of +60 bp). Dynamic management of the legacy asset portfolio, mainly through disposals and the dismantling of assets, helped boost the Tier 1 ratio by 15 bp in H1. This growth will continue during H2, due primarily to the +6 bp increase in Core Tier 1 resulting from the extensive participation of employees in the share schemes available to them under the Global Employee Share Ownership Plan. In terms of liquidity, at July 20th, 2011, the Group had issued EUR 24.1 billion of senior debt with a maturity of more than one year, equating to 94% of its total programme for 2011. The “vanilla” issue programme, encompassing Societe Generale’s unsecured issues and secured financing, is 92% complete. The Group is rated Aa2 by Moody’s and A+ by S&P and Fitch.
1 This figure includes notably (i) EUR 6.2 billion of deeply subordinated notes, EUR 0.8 billion of undated subordinated notes and (ii) EUR 0.35 billion of net unrealised capital gains 2 Excluding the floor effect (additional capital requirements with respect to floor levels): -18 basis points on the Tier 1 ratio

7/27
3. FRENCH NETWORKS
The French Networks (Societe Generale, Crédit du Nord, Boursorama) published Q2 commercial results in line with the Group’s targets. In an environment marked by a mistrust of the financial markets and rising short-term interest rates, outstanding deposits were up +10.0(a) vs. Q2 10 at EUR 136.2 billion. This was particularly true of sight deposits (+8.9(a) vs. Q2 10) and Regulated Savings Schemes (Épargne à Régime Spécial) (+11.9(a) excluding PEL vs. Q2 10), as well as business customers’ term deposits (+23.4%(a) vs. Q2 10). Activity with business customers benefited from measures aimed at increasing customer satisfaction, notably the improvement of loan approval timescales. As a result, the French Networks saw a sharp increase in new medium-term loan business, benefiting fully from the slight upturn in corporate investment. Dynamic new housing loan business (+4.8%(a) vs. Q2 10) helped outstanding loans reach EUR 169.3 billion (+2.9%(a) vs. Q2 10). The loan/deposit ratio stood at 124%, down 9.7 points year-on-year. Savers’ search for liquid and non-risky investments did not undermine the attractiveness of the French Networks’ life insurance products. In a French market experiencing a slowdown, the Group posted gross new business of EUR +2,374 million (excluding SMC), stable vs. Q2 10, while the Group’s outstandings amounted to EUR 80.4 billion. The division’s Q2 financial results were in line with the target set at the beginning of the year. Despite the increases in Regulated Savings Schemes’ remuneration rates and the squeezing of housing loan and corporate loan margins in a very competitive environment, net banking income rose +3.7%(b) vs. Q2 10, to EUR 2,038 million (+1.0%(b) excluding the SMC acquisition). Revenues were underpinned by the positive trend in the interest margin (+4.4%(b) vs. Q2 10), driven by the growth in deposits, and to a lesser extent the increase in commissions (+2.9%(b) vs. Q2 10). Operating expenses remained under control at EUR 1,293 million in Q2 11 (+4.3% vs. Q2 10) even with the inclusion of investments related to the sharing of information systems, and the integration of SMC. All in all, the cost to income ratio stood at 64.4%(b) in Q2. At EUR 4,076 million, H1 revenues were up +5.5%(b) (+2.8%(b) excluding the SMC acquisition) vs. H1 10. Operating expenses rose +5.5% vs. H1 10 to EUR 2,617 million. The cost to income ratio remained stable at 64.6%(b).
Gross operating income rose +2.6%(b) vs. Q2 10 to EUR 745 million and +5.4%(b) vs. H1 10 to EUR 1,459 million. The French Networks’ cost of risk amounted to 36 basis points (vs. 52 bp in Q2 10). The downtrend reflects the improvement for business customers. The loss rate remained moderate for individual customers.
(a) Excluding SMC acquisition (b) Excluding PEL/CEL
In EUR m Q2 10 Q2 11 ChangeQ2 vs Q2 H1 10 H1 11 Change
H1 vs H1Net banking income 1,931 2,038 +5.5% 3,823 4,076 +6.6% NBI excl. PEL/CEL & excl. SMC +1.0% +2.8%Operating expenses (1,240) (1,293) +4.3% (2,481) (2,617) +5.5%Gross operating income 691 745 +7.8% 1,342 1,459 +8.7% GOI excl. PEL/CEL & excl. SMC +0.3% +3.2%
Net allocation to provisions (216) (160) -25.9% (448) (339) -24.3%Operating income 475 585 +23.2% 894 1,120 +25.3%Group net income 312 384 +23.1% 591 736 +24.5% Net income excl. PEL/CEL +15.3% +19.1%
8/27
The French Networks’ contribution to Group net income totalled EUR 384 million in Q2 11 (+23.1% vs. Q2 10) and EUR 736 million for H1 (+24.5% vs. H1 10).

9/27
4. INTERNATIONAL RETAIL BANKING
In EUR m Q2 10 Q2 11 ChangeQ2 vs Q2 H1 10 H1 11 Change
H1 vs H1Net banking income 1,240 1,260 +1.6% 2,423 2,449 +1.1%
On a like-for-like basis* +1.4% -0.5%Operating expenses (699) (754) +7.9% (1,357) (1,492) +9.9%
On a like-for-like basis* +8.0% +8.7%Gross operating income 541 506 -6.5% 1,066 957 -10.2%
On a like-for-like basis* -7.1% -12.2%Net allocation to provisions (334) (268) -19.8% (700) (591) -15.6%Operating income 207 238 +15.0% 366 366 0.0%
On a like-for-like basis* +12.8% -4.4%
Group net income 125 116 -7.2% 239 160 -33.1% After a Q1 impacted by the political upheaval and challenging economic situation in some countries, Q2 marked the return to a more positive trend and slightly higher revenues throughout the International Retail Banking network, thus demonstrating the resilience of the model. Driven by an appropriate commercial strategy, outstanding loans and deposits rose respectively to EUR 65.9 and EUR 65.1 billion (+5.1%* and +2.1%* vs. Q2 10). The loan/deposit ratio stood at 101%, slightly higher than in Q1 11. In Central and Eastern European countries excluding Russia, Q2 saw a recovery in commercial activity and improved financial performance compared with Q1 2011. Outstanding loans grew +2.6%* while outstanding deposits rose +1.7%* vs. Q1 11. In the Czech Republic, the economic recovery and commercial efforts in Q2 11 resulted in a positive trend in outstanding loans (+4.3%*) and deposits (+2.6%*) vs. Q1 11. Against the backdrop of a slower than expected return to growth in Romania, BRD launched a series of targeted campaigns to sustain commercial growth. The entity generated revenues up +11.3%* in Q2. Other countries in the region also demonstrated healthy commercial activity, with outstanding loans up +0.9%* vs. the previous quarter. With the situation remaining challenging in Greece, the Group continued with the measures implemented for several quarters aimed at reorganising activities. Substantial investments are being made in Russia, as part of the reorganisation of the Group’s activities, in order to realign the infrastructure and harmonise the operating model. Revenues increased vs. Q2 10, driven by individual customers whose outstanding loans and deposits grew by respectively +10.4%* and +5.7%* vs. Q2 10. Q2 saw an upturn in business in Mediterranean Basin subsidiaries, marked by an increase in the number of customers (+8.7%* year-on-year with +9.1%* for individual customers). In Egypt and Tunisia, the situation is returning to normal with outstanding loans up by respectively +18.3%* and +22.5%*, especially for individual customers (+18.0%* and +16.6%* vs. Q2 10). Deposits progressed throughout the region over the same period (+8.8%* including +14.3%* for business customers in Egypt). In Sub-Saharan Africa and French Overseas Territories, Q2 was marked by the re-opening of the subsidiary in Cote d’Ivoire which generated revenues of EUR 23.5 million in the quarter. Outstanding loans and deposits were higher throughout the region (+6.9%* and +8.3%* vs. Q2 10). At EUR 1,260 million, International Retail Banking revenues were slightly higher (+1.4%*) vs. Q2 10 (+1.6% in absolute terms) and up +6.0% vs. Q1 11.

10/27
Operating expenses amounted to EUR 754 million in Q2 11, up +8.0%* vs. Q2 10, due primarily to increased expenses in Russia (+16.5%* vs. Q2 10) on the back of persistently high inflation, merger costs and the increase in social security contributions. Overall, gross operating income was down -7.1%* vs. Q2 10, at EUR 506 million. The cost to income ratio was 3.4 points higher at 59.8%. H1 revenues amounted to EUR 2,449 million, stable vs. H1 10 (-0.5%* and +1.1% in absolute terms). Operating expenses came to EUR 1,492 million, up +8.7%* vs. H1 10 (+9.9% in absolute terms), due in particular to the above-mentioned increase in Russian expenses. Gross operating income totalled EUR 957 million, down -12.2%* (-10.2% in absolute terms). The cost to income ratio was 60.9% vs. 56.0% in H1 10. International Retail Banking’s net cost of risk was sharply lower in Q2 11 at EUR -268 million (vs. EUR -334 million in Q2 10), or 149 basis points (vs. 192 bp in Q2 10 and 174 bp in Q1 11). The decline was particularly marked in the Mediterranean Basin in Q2. The cost of risk was slightly lower in the Czech Republic and Russia, but remained stable in Romania. Portfolio-based provisions were maintained in Cote d’Ivoire, Tunisia and Egypt, in line with the Group’s prudent and strict risk management policy and given the still challenging environment. International Retail Banking’s contribution to Group net income totalled EUR 116 million in Q2 11 and EUR 160 million in H1 11.
11/27
5. CORPORATE AND INVESTMENT BANKING
In EUR m Q2 10 Q2 11 ChangeQ2 vs Q2 H1 10 H1 11 Change
H1 vs H1Net banking income 1,751 1,835 +4.8% 3,895 4,115 +5.6%
On a like-for-like basis* +7.4% +6.5%Financing and Advisory 656 655 -0.2% 1,258 1,296 +3.0%Global Markets (1) 1,024 1,137 +11.0% 2,589 2,734 +5.6%Legacy assets 71 43 -39.4% 48 85 +77.1%
Operating expenses (1,074) (1,163) +8.3% (2,226) (2,478) +11.3%On a like-for-like basis* +12.7% +12.3%
Gross operating income 677 672 -0.7% 1,669 1,637 -1.9%On a like-for-like basis* -0.6% -1.3%
Net allocation to provisions (142) (147) +3.5% (375) (281) -25.1%O.w. Legacy assets (97) (130) +34.0% (311) (226) -27.3%
Operating income 535 525 -1.9% 1,294 1,356 +4.8%On a like-for-like basis* -3.1% +5.4%
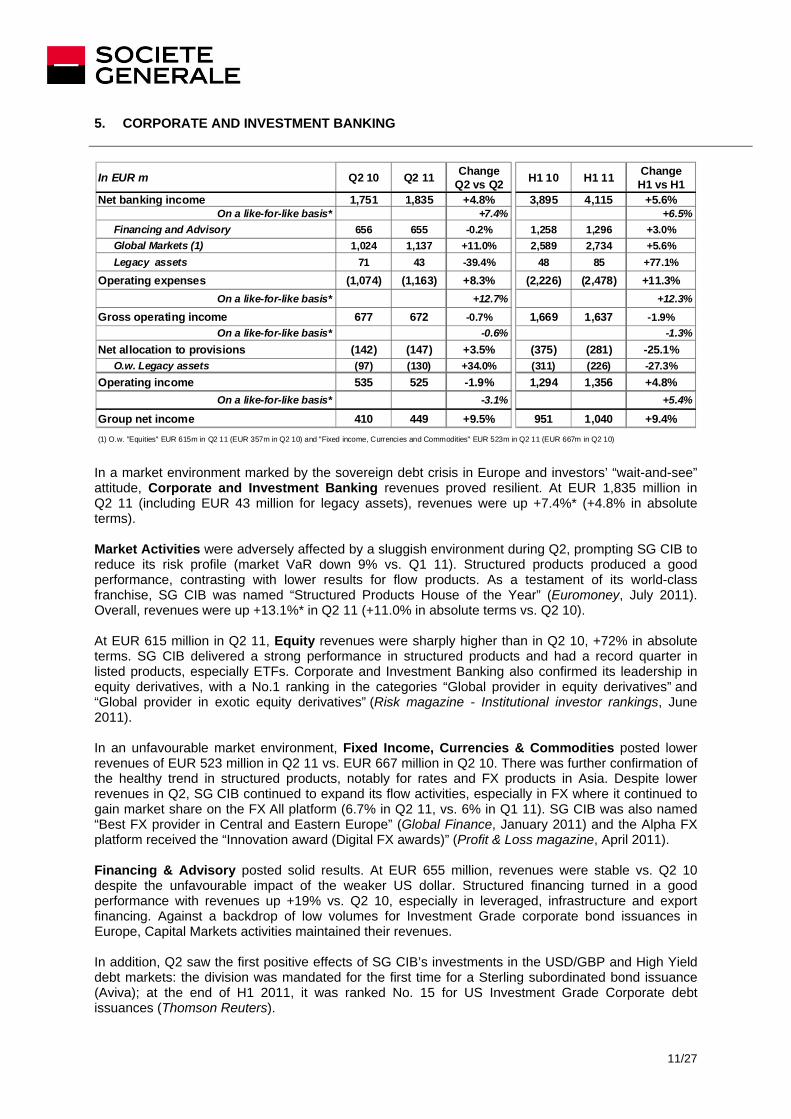
Group net income 410 449 +9.5% 951 1,040 +9.4%(1) O.w. "Equities" EUR 615m in Q2 11 (EUR 357m in Q2 10) and "Fixed income, Currencies and Commodities" EUR 523m in Q2 11 (EUR 667m in Q2 10) In a market environment marked by the sovereign debt crisis in Europe and investors’ “wait-and-see” attitude, Corporate and Investment Banking revenues proved resilient. At EUR 1,835 million in Q2 11 (including EUR 43 million for legacy assets), revenues were up +7.4%* (+4.8% in absolute terms). Market Activities were adversely affected by a sluggish environment during Q2, prompting SG CIB to reduce its risk profile (market VaR down 9% vs. Q1 11). Structured products produced a good performance, contrasting with lower results for flow products. As a testament of its world-class franchise, SG CIB was named “Structured Products House of the Year” (Euromoney, July 2011). Overall, revenues were up +13.1%* in Q2 11 (+11.0% in absolute terms vs. Q2 10). At EUR 615 million in Q2 11, Equity revenues were sharply higher than in Q2 10, +72% in absolute terms. SG CIB delivered a strong performance in structured products and had a record quarter in listed products, especially ETFs. Corporate and Investment Banking also confirmed its leadership in equity derivatives, with a No.1 ranking in the categories “Global provider in equity derivatives” and “Global provider in exotic equity derivatives” (Risk magazine - Institutional investor rankings, June 2011). In an unfavourable market environment, Fixed Income, Currencies & Commodities posted lower revenues of EUR 523 million in Q2 11 vs. EUR 667 million in Q2 10. There was further confirmation of the healthy trend in structured products, notably for rates and FX products in Asia. Despite lower revenues in Q2, SG CIB continued to expand its flow activities, especially in FX where it continued to gain market share on the FX All platform (6.7% in Q2 11, vs. 6% in Q1 11). SG CIB was also named “Best FX provider in Central and Eastern Europe” (Global Finance, January 2011) and the Alpha FX platform received the “Innovation award (Digital FX awards)” (Profit & Loss magazine, April 2011). Financing & Advisory posted solid results. At EUR 655 million, revenues were stable vs. Q2 10 despite the unfavourable impact of the weaker US dollar. Structured financing turned in a good performance with revenues up +19% vs. Q2 10, especially in leveraged, infrastructure and export financing. Against a backdrop of low volumes for Investment Grade corporate bond issuances in Europe, Capital Markets activities maintained their revenues. In addition, Q2 saw the first positive effects of SG CIB’s investments in the USD/GBP and High Yield debt markets: the division was mandated for the first time for a Sterling subordinated bond issuance (Aviva); at the end of H1 2011, it was ranked No. 15 for US Investment Grade Corporate debt issuances (Thomson Reuters).

12/27
The business line played a leading role in several landmark transactions: SG CIB acted as the sole financial advisor, lead arranger and bookrunner in Lactalis’ acquisition of Parmalat. It was also the joint-bookrunner in the US dollar issuance by Mubadala. Moreover, SG CIB confirmed its leadership in structured financing with the award of “Best Export Finance Arranger“ (Trade Finance Magazine, June 2011) for the tenth time running. Legacy assets contributed EUR 43 million to revenues in Q2 11. The deleveraging amounted to EUR 1.9 billion in nominal terms in Q2 11 (EUR 1.1 billion of disposals and EUR 0.8 billion of amortisations). H1 revenues came to EUR 85 million vs. EUR 48 million in H1 10 and exposure was reduced by EUR 3.7 billion over this period. Corporate and Investment Banking’s Q2 operating expenses amounted to EUR 1,163 million, down -10.1%* (-11.6% in absolute terms) vs. Q1 11, reflecting the initial effects of cost reduction measures. SG CIB’s Q2 cost to income ratio stood at 63.4% and gross operating income amounted to EUR 672 million. H1 operating expenses totalled EUR 2,478 million vs. EUR 2,226 million in H1 10 and gross operating income came to EUR 1,637 million vs. EUR 1,669 million in H1 10. The cost to income ratio remained contained at 60.2% in H1 11.
The Q2 net cost of risk of core activities was negligible (0 bp), reflecting the division’s sound risk management. Legacy assets’ cost of risk remained under control at EUR -130 million over the period. Corporate and Investment Banking’s operating income totalled EUR 525 million in Q2 11 (vs. EUR 535 million in Q2 10). The contribution to Group net income was EUR 449 million (vs. EUR 410 million in Q2 10). The H1 contribution to Group net income was EUR 1,040 million vs. EUR 951 million in H1 10.
13/27
6. SPECIALISED FINANCIAL SERVICES AND INSURANCE
In EUR m Q2 10 Q2 11 ChangeQ2 vs Q2 H1 10 H1 11 Change
H1 vs H1Net banking income 926 871 -5.9% 1,775 1,744 -1.7%
On a like-for-like basis* +0.3% +4.2%Operating expenses (466) (458) -1.7% (912) (928) +1.8%
On a like-for-like basis* +8.9% +12.3%Gross operating income 460 413 -10.2% 863 816 -5.4%
On a like-for-like basis* -7.7% -3.7%Net allocation to provisions (311) (214) -31.2% (610) (427) -30.0%Operating income 149 199 +33.6% 253 389 +53.8%
On a like-for-like basis* +41.0% +57.3%
Group net income 92 146 +58.7% 162 277 +71.0% The Specialised Financial Services and Insurance division comprises:
(i) Insurance (Life, Personal Protection, Property and Casualty). (ii) Specialised Financial Services (operational vehicle leasing and fleet management,
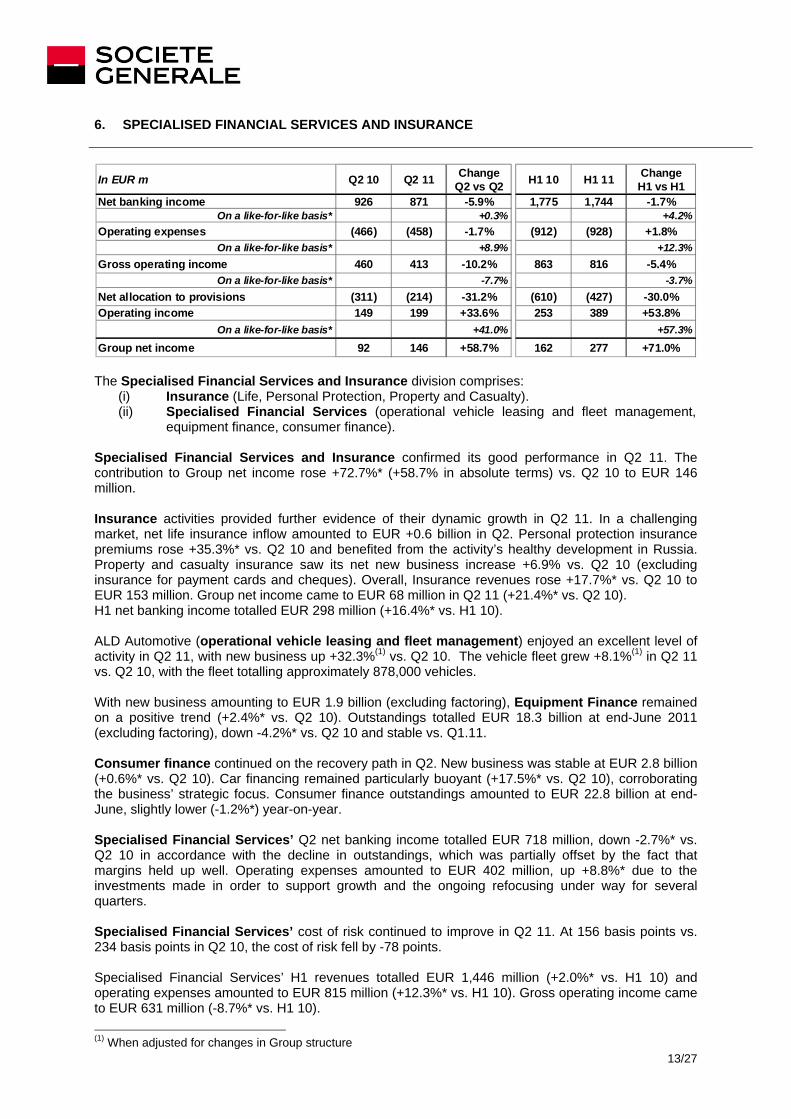
equipment finance, consumer finance). Specialised Financial Services and Insurance confirmed its good performance in Q2 11. The contribution to Group net income rose +72.7%* (+58.7% in absolute terms) vs. Q2 10 to EUR 146 million. Insurance activities provided further evidence of their dynamic growth in Q2 11. In a challenging market, net life insurance inflow amounted to EUR +0.6 billion in Q2. Personal protection insurance premiums rose +35.3%* vs. Q2 10 and benefited from the activity’s healthy development in Russia. Property and casualty insurance saw its net new business increase +6.9% vs. Q2 10 (excluding insurance for payment cards and cheques). Overall, Insurance revenues rose +17.7%* vs. Q2 10 to EUR 153 million. Group net income came to EUR 68 million in Q2 11 (+21.4%* vs. Q2 10). H1 net banking income totalled EUR 298 million (+16.4%* vs. H1 10). ALD Automotive (operational vehicle leasing and fleet management) enjoyed an excellent level of activity in Q2 11, with new business up +32.3%(1) vs. Q2 10. The vehicle fleet grew +8.1%(1) in Q2 11 vs. Q2 10, with the fleet totalling approximately 878,000 vehicles. With new business amounting to EUR 1.9 billion (excluding factoring), Equipment Finance remained on a positive trend (+2.4%* vs. Q2 10). Outstandings totalled EUR 18.3 billion at end-June 2011 (excluding factoring), down -4.2%* vs. Q2 10 and stable vs. Q1.11. Consumer finance continued on the recovery path in Q2. New business was stable at EUR 2.8 billion (+0.6%* vs. Q2 10). Car financing remained particularly buoyant (+17.5%* vs. Q2 10), corroborating the business’ strategic focus. Consumer finance outstandings amounted to EUR 22.8 billion at end-June, slightly lower (-1.2%*) year-on-year. Specialised Financial Services’ Q2 net banking income totalled EUR 718 million, down -2.7%* vs. Q2 10 in accordance with the decline in outstandings, which was partially offset by the fact that margins held up well. Operating expenses amounted to EUR 402 million, up +8.8%* due to the investments made in order to support growth and the ongoing refocusing under way for several quarters. Specialised Financial Services’ cost of risk continued to improve in Q2 11. At 156 basis points vs. 234 basis points in Q2 10, the cost of risk fell by -78 points. Specialised Financial Services’ H1 revenues totalled EUR 1,446 million (+2.0%* vs. H1 10) and operating expenses amounted to EUR 815 million (+12.3%* vs. H1 10). Gross operating income came to EUR 631 million (-8.7%* vs. H1 10). (1) When adjusted for changes in Group structure

14/27
Specialised Financial Services and Insurance’s contribution to Group net income totalled EUR 146 million in Q2 11 (vs. EUR 92 million in Q2 10) and EUR 277 million in H1 11 (vs. EUR 162 million in H1 10).
15/27
7. PRIVATE BANKING, GLOBAL INVESTMENT MANAGEMENT AND SERVICES
In EUR m Q2 10 Q2 11 ChangeQ2 vs Q2 H1 10 H1 11 Change
H1 vs H1Net banking income 592 547 -7.6% 1,096 1,127 +2.8%
On a like-for-like basis* -5.9% +3.0%Operating expenses (511) (499) -2.3% (977) (983) +0.6%
On a like-for-like basis* -0.4% +1.0%Operating income 76 36 -52.6% 114 120 +5.3%
On a like-for-like basis* -52.0% +3.4%Group net income 74 59 -20.3% 129 156 +20.9%
o.w. Private Banking 23 31 +34.8% 47 74 +57.4%o.w. Asset Management 20 25 +25.0% 39 65 +66.7%o.w. SG SS & Brokers 31 3 -90.3% 43 17 -60.5%
In EUR bn Q2 10 Q2 11 H1 10 H1 11Net inflow for period (a) -1.8 2.2 -13.0 5.2AuM at end of period (a) 171 169 171 169(a) Excluding assets managed by Lyxor and excluding Amundi The division consists of three activities:
(i) Private Banking (Societe Generale Private Banking) (ii) Asset Management (Amundi, TCW) (iii) Societe Generale Securities Services (SGSS) and Brokers (Newedge).
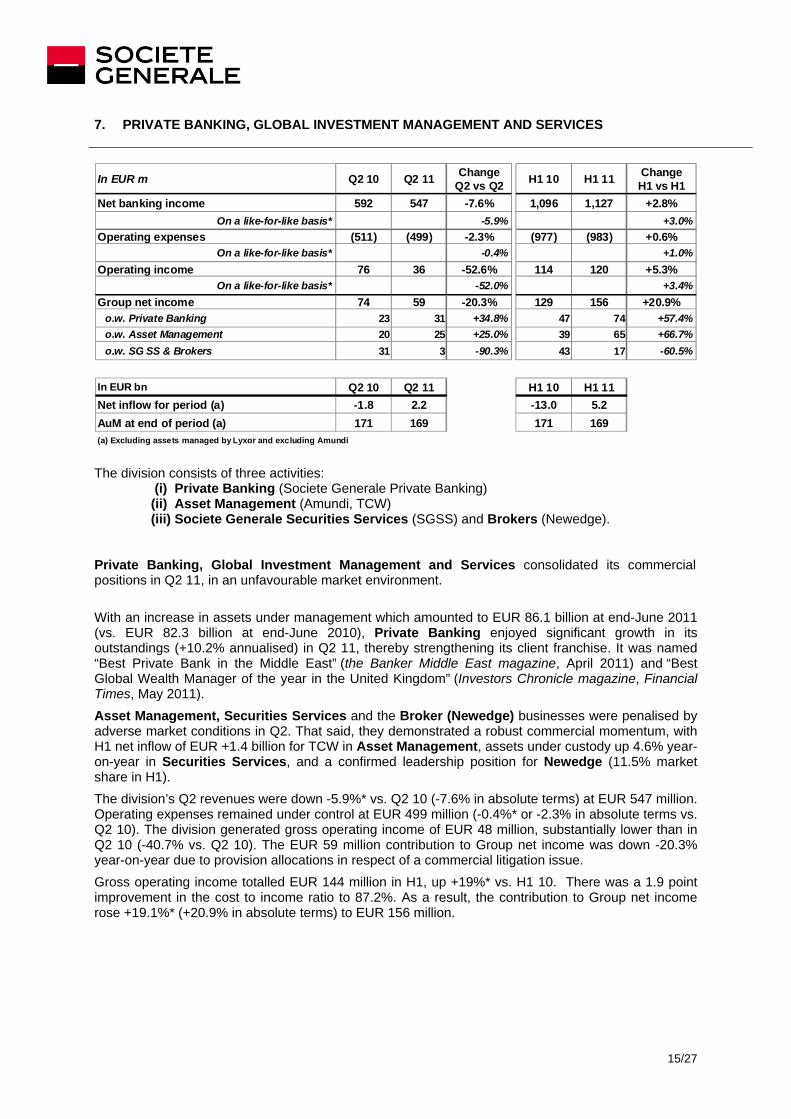
Private Banking, Global Investment Management and Services consolidated its commercial positions in Q2 11, in an unfavourable market environment. With an increase in assets under management which amounted to EUR 86.1 billion at end-June 2011 (vs. EUR 82.3 billion at end-June 2010), Private Banking enjoyed significant growth in its outstandings (+10.2% annualised) in Q2 11, thereby strengthening its client franchise. It was named “Best Private Bank in the Middle East” (the Banker Middle East magazine, April 2011) and “Best Global Wealth Manager of the year in the United Kingdom” (Investors Chronicle magazine, Financial Times, May 2011). Asset Management, Securities Services and the Broker (Newedge) businesses were penalised by adverse market conditions in Q2. That said, they demonstrated a robust commercial momentum, with H1 net inflow of EUR +1.4 billion for TCW in Asset Management, assets under custody up 4.6% year-on-year in Securities Services, and a confirmed leadership position for Newedge (11.5% market share in H1). The division’s Q2 revenues were down -5.9%* vs. Q2 10 (-7.6% in absolute terms) at EUR 547 million. Operating expenses remained under control at EUR 499 million (-0.4%* or -2.3% in absolute terms vs. Q2 10). The division generated gross operating income of EUR 48 million, substantially lower than in Q2 10 (-40.7% vs. Q2 10). The EUR 59 million contribution to Group net income was down -20.3% year-on-year due to provision allocations in respect of a commercial litigation issue. Gross operating income totalled EUR 144 million in H1, up +19%* vs. H1 10. There was a 1.9 point improvement in the cost to income ratio to 87.2%. As a result, the contribution to Group net income rose +19.1%* (+20.9% in absolute terms) to EUR 156 million.

16/27
Private Banking Private Banking enjoyed very healthy net inflow in Q2 11: EUR +2.1 billion, corresponding to an annualised rate of 10.2% (above its peers in Q1 11). Compared with end-December 2010 and given a net inflow of EUR 3.8 billion, a “market” effect of EUR -1.0 billion, a “currency” impact of EUR -1.7 billion and “structure” effect of EUR +0.5 billion, Private Banking’s assets under management amounted to EUR 86.1 billion at end-June 2011. At EUR 194 million, the business line’s net banking income was significantly higher (+16.2%* and +19.0% in absolute terms) than in Q2 10 which was impacted by a securities write-down representing roughly EUR 30 million. If this non-recurring item is stripped out, revenues were stable and the gross margin declined by -8 bp vs. Q2 10 to 91 bp. At EUR -155 million, operating expenses were higher due to the business line’s commercial development. However, Q2 gross operating income rose to EUR 39 million (+25.8%* vs. Q2 10), and the business line’s contribution to Group net income was EUR 31 million (vs. EUR 23 million in Q2 10) as a result of the increase in net banking income. The business line’s H1 revenues totalled EUR 414 million, substantially higher year-on-year (+23.2%* and +27.4% in absolute terms). Operating expenses amounted to EUR -310 million. Gross operating income came to EUR 104 million, a significant increase: +62.5%* (+70.5% in absolute terms) and the contribution to Group net income was EUR 74 million (+51.0%* and +57.4% in absolute terms).
Asset Management In a market environment impacted by low volumes and sharply declining indexes in Q2 11, TCW’s Q2 net inflow was slightly positive. Accordingly, the business line provided further confirmation in H1 of the trend initiated at end-2010, with net inflow of EUR +1.4 billion. At EUR 80 million, the business line’s net banking income shrank -34.4%* vs. Q2 10. This was due, in part, to sluggish performance commissions in Q2 11, but principally to the change in the method of remunerating certain activities. Affecting at the same time operating expenses, the change had no impact on gross operating income.
Operating expenses were down -28.7%* vs. Q2 10 (-34.6% in absolute terms), at EUR -87 million. Gross operating income came out at EUR -7 million in Q2 11 vs. EUR 2 million in Q2 10. Amundi’s Q2 contribution was EUR 30 million.
The contribution to Group net income totalled EUR 25 million vs. EUR 20 million in Q2 10.
The business line’s H1 net banking income amounted to EUR 169 million, which was lower year-on-year (-18.4%*). Operating expenses fell more rapidly, amounting to EUR -165 million (-24.3%* and -27.3% in absolute terms). Gross operating income came out at EUR 4 million vs. EUR -9 million in H1 10. Amundi’s EUR 62 million contribution took the contribution to Group net income to EUR 65 million vs. EUR 39 million in H1 10.
Societe Generale Securities Services (SGSS) and Brokers (Newedge) Securities Services enjoyed a healthy revenue momentum in Q2 11 (+9.4% vs. Q2 10), driven both by commissions up +3% on the 50 largest clients (year-on-year at end-May 2011), assets under custody up +4.6% year-on-year, assets under administration up +2.7% year-on-year and an increase in treasury revenues. Newedge posted a lower performance in a challenging market environment in Q2 11. Business volumes were down -7.4%. Moreover, the result for Newedge was reduced by provision allocations in respect of commercial litigation issues. SGSS and Newedge posted net banking income down -6.5%* (-7.1% in absolute terms) vs. Q2 10, at EUR 273 million. Operating expenses increased +5.8%* vs. Q2 10 (+5.3% in absolute terms) to EUR -257 million and reflect investments in respect of Securities Services. Gross operating income amounted to EUR 16 million in Q2 11 (vs. EUR 50 million in Q2 10).
17/27
The contribution to Group net income of the Securities Services and Broker division was lower at EUR 3 million vs. EUR 31 million a year earlier. The business line’s H1 net banking income totalled EUR 544 million, which was generally stable year-on-year (-1.3%*). Operating expenses were higher at EUR -508 million (+5.2%* and +4.5% in absolute terms). Gross operating income came out at EUR 36 million vs. EUR 67 million in H1 10. The contribution to Group net income totalled EUR 17 million vs. EUR 43 million in H1 10.
18/27
8. CORPORATE CENTRE The Corporate Centre’s gross operating income was EUR -122 million in Q2 11 vs. EUR +164 million in Q2 10. It includes, in particular:
• the revaluation of the Group’s own financial liabilities, amounting to EUR +16 million (EUR +254 million in Q2 10);
• the revaluation of credit derivative instruments used to hedge corporate loan portfolios, amounting to EUR +1 million (EUR +18 million in Q2 10);
• the new so-called “systemic risk” banking taxes implemented in France and the UK, amounting to EUR -25 million.
The provision for the write-down of Greek government bonds held by the Group reduces gross operating income by EUR -395 million.
At June 30th, 2011, the IFRS net book value of the industrial equity portfolio amounted to EUR 542 million, representing market value of EUR 721 million.
19/27
9. CONCLUSION
With Q2 Group net income of EUR 747 million, Societe Generale has demonstrated the resilience of its universal banking model against the backdrop of a tumultuous economic and financial environment due to the European sovereign debt crisis. All the businesses made an increased contribution to H1 Group net income, which amounted to EUR 1,663 million at June 30th, 2011.
At the same time, the Group continued to significantly increase its capital and improve its Core Tier 1 ratio.
In June 2010, the Group presented its strategic plan “Ambition SG 2015” and its financial targets for 2012. These targets were established on the basis of a return to normal of the economic and financial environment which has not occurred. On the contrary, there have been renewed market tensions due to the global economy and the eurozone and US debt situation and, for some of the Group’s subsidiaries in Africa and Central Europe, major political or economic changes. There has also been a considerable tightening of the regulatory environment in terms of capital and liquidity requirements and various European countries have introduced additional taxes aimed at the banking sector (in France and the United Kingdom in particular).
By the end of 2013, the Societe Generale Group will achieve a Basel 3 Core Tier 1 ratio of at least 9% thanks to its solid results, and with the same priority given to the very disciplined management of its capital and risk-weighted assets and the rigorous control of costs and risks. This target is underpinned by the strong capital generation in H1, which will continue, and in particular the additional potential that will be derived from the optimisation of risk-weighted assets and the proactive management of the legacy asset portfolio.
2011 and 2012 financial communication calendar November 8th 2011 Publication of third quarter 2011 results February 16th 2012 Publication of fourth quarter and FY 2011 results May 3rd 2012 Publication of first quarter 2012 results August 1st 2012 Publication of second quarter 2012 results November 8th 2012 Publication of third quarter 2012 results This document may contain a number of forecasts and comments relating to the targets and strategies of the Societe Generale Group. These forecasts are based on a series of assumptions, both general and specific (notably – unless specified otherwise – the application of accounting principles and methods in accordance with IFRS as adopted in the European Union as well as the application of existing prudential regulations). This information was developed from scenarios based on a number of economic assumptions for a given competitive and regulatory environment. The Group may be unable to: - anticipate all the risks, uncertainties or other factors likely to affect its business and to appraise their potential impact on its operations; - precisely evaluate the extent to which the occurrence of a risk or combination of risks could cause actual results to differ materially from those contemplated in this press release. There is a risk that these projections will not be met. Investors are advised to take into account factors of uncertainty and risk likely to impact the operations of the Group when basing their investment decisions on information provided in this document. Unless otherwise specified, the sources for the rankings are internal.

20/27
APPENDIX 1: FIGURES AND QUARTERLY RESULTS BY CORE BUSINESS
2nd quarter
Q2 10 Q2 11 H1 10 H1 11
Net banking income 6,679 6,503 -2.6% -1.6%* 13,260 13,122 -1.0% -1.1%*Net banking income (1) 6,425 6,487 +1.0% +2.1%* 12,905 13,467 +4.4% +4.4%*
Operating expenses (4,065) (4,241) +4.3% +6.0%* (8,066) (8,617) +6.8% +7.6%*Gross operating income 2,614 2,262 -13.5% -13.4%* 5,194 4,505 -13.3% -14.4%*Net allocation to provisions (1,010) (1,185) +17.3% +18.6%* (2,142) (2,063) -3.7% -3.7%*Operating income 1,604 1,077 -32.9% -33.5%* 3,052 2,442 -20.0% -22.0%*Net profits or losses from other assets (12) 63 NM 0 64 NMNet income from companies accounted for by the equity method
18 40 x2.2 58 78 +34.5%
Impairment losses on goodwill 0 0 NM 0 0 NM
Income tax (431) (317) -26.5% (806) (687) -14.8%Net income before minority interests 1,179 863 -26.8% 2,304 1,897 -17.7%
O.w. non controlling Interests 95 116 +22.1% 157 234 +49.0%
Group net income 1,084 747 -31.1% -36.1%* 2,147 1,663 -22.5% -26.4%*
Group net income (1) 916 737 -19.6% -25.4%* 1,913 1,891 -1.1% -5.1%*
Group ROE (after tax) 10.9% 6.9% 11.0% 7.8%
Group ROE (after tax) (1) 9.1% 6.8% 9.7% 9.0%
Tier 1 ratio at end of period 10.7% 11.3% 10.7% 11.3%
* When adjusted for changes in Group structure and at constant exchange rates(1) Excluding revaluation of own financial liabilities
ChangeQ2 vs Q2
CONSOLIDATED INCOME STATEMENT(in EUR millions)
1st halfChangeH1 vs H1
Q2 10 Q2 11 ChangeQ2 vs Q2 H1 10 H1 11 Change
H1 vs H1
French Networks 312 384 +23.1% 591 736 +24.5%
International Retail Banking 125 116 -7.2% 239 160 -33.1%
Corporate & Investment Banking 410 449 +9.5% 951 1,040 +9.4%
Specialised Financial Services & Insurance 92 146 +58.7% 162 277 +71.0%
Private Banking, Global Investment Management and Services 74 59 -20.3% 129 156 +20.9%
o.w. Private Banking 23 31 +34.8% 47 74 +57.4%o.w. Asset Management 20 25 +25.0% 39 65 +66.7%o.w. SG SS & Brokers 31 3 -90.3% 43 17 -60.5%
CORE BUSINESSES 1,013 1,154 +13.9% 2,072 2,369 +14.3%Corporate Centre 71 (407) NM 75 (706) NMGROUP 1,084 747 -31.1% 2,147 1,663 -22.5%
NET INCOME AFTER TAX BY CORE BUSINESS(in EUR millions)
2nd quarter 1st half

21/27
CONSOLIDATED BALANCE SHEET
Assets (in billions of euros)June 30, 2011 December 31, 2010 % change
Cash, due from central banks 36.6 14.1 x2.6
Financial assets measured at fair value through profit and loss 431.0 455.1 -5%Hedging derivatives 7.4 8.2 -9%
Available-for-sale financial assets 119.8 103.8 +15%
Due from banks 76.7 70.3 +9%
Customer loans 376.0 371.8 +1%
Lease financing and similar agreements 28.8 29.1 -1%
Revaluation differences on portfolios hedged against interest rate risk 1.4 2.4 -40%
Held-to-maturity financial assets 1.8 1.9 -5%
Tax assets and other assets 51.4 49.0 +5%
Non-current assets held for sale 0.3 0.1 x5.2
Deferred profit-sharing 1.2 1.1 +11%Tangible, intangible fixed assets and other 25.6 25.2 +1%
Total 1,158.0 1,132.1 +2%
Liabilities (in billions of euros)June 30, 2011 December 31, 2010 % change
Due to central banks 4.0 2.8 +44%
Financial liabilities measured at fair value through profit and loss 351.2 359.0 -2%
Hedging derivatives 9.1 9.3 -2%
Due to banks 85.2 77.3 +10%
Customer deposits 341.4 337.4 +1%
Securitised debt payables 158.4 141.4 +12%
Revaluation differences on portfolios hedged against interest rate risk 0.4 0.9 -57%
Tax liabilities and other liabilities 58.3 56.3 +4%
Non-current liabilities held for sale 0.0 0.0 x3.5
Underwriting reserves of insurance companies 84.9 82.7 +3%
Provisions 2.1 2.0 +3%
Subordinated debt 10.9 12.0 -10%
Shareholders' equity 47.6 46.4 +2%
Non controlling Interests 4.5 4.6 -0%
Total 1,158.0 1,132.1 +2%

22/27
QUARTERLY RESULTS BY CORE BUSINESSES
(in EUR millions) Q1 Q2 Q3 Q4 Q1 Q2 Q3 Q4 Q1 Q2 Q3 Q4
Net banking income 1,781 1,875 1,867 1,943 1,892 1,931 1,913 2,055 2,038 2,038Operating expenses -1,198 -1,206 -1,181 -1,326 -1,241 -1,240 -1,199 -1,378 -1,324 -1,293Gross operating income 583 669 686 617 651 691 714 677 714 745Net allocation to provisions -230 -214 -220 -306 -232 -216 -197 -219 -179 -160Operating income 353 455 466 311 419 475 517 458 535 585Net income from other assets 0 1 0 1 4 1 0 1 1 0Net income from companies accounted for by the equity method
2 2 3 6 3 1 2 2 2 2
Income tax -120 -155 -158 -107 -144 -162 -176 -155 -182 -199Net income before minority interests 235 303 311 211 282 315 343 306 356 388
O.w. non controlling Interests 11 13 15 14 3 3 3 4 4 4
Group net income 224 290 296 197 279 312 340 302 352 384Average allocated capital 6,078 6,160 6,224 6,291 6,569 6,494 6,189 6,487 6,607 6,551
Net banking income 1,167 1,189 1,174 1,219 1,183 1,240 1,250 1,257 1,189 1,260Operating expenses -663 -681 -657 -680 -658 -699 -695 -717 -738 -754Gross operating income 504 508 517 539 525 541 555 540 451 506Net allocation to provisions -299 -310 -336 -353 -366 -334 -305 -335 -323 -268Operating income 205 198 181 186 159 207 250 205 128 238Net income from other assets 1 10 0 -4 4 0 -2 -1 4 0Net income from companies accounted for by the equity method
1 2 2 1 3 3 3 2 2 3
Impairment losses on goodwill 0 0 0 0 0 0 0 1 0 0Income tax -41 -42 -36 -36 -31 -40 -46 -39 -29 -53Net income before minority interests 166 168 147 147 135 170 205 168 105 188
O.w. non controlling Interests 45 42 35 47 21 45 56 64 61 72
Group net income 121 126 112 100 114 125 149 104 44 116Average allocated capital 3,559 3,611 3,562 3,574 3,603 3,653 3,770 3,865 3,980 3,916
2011 Basel II - IFRS(inc. IAS 32 & 39 and IFRS 4)
2010 Basel II - IFRS(inc. IAS 32 & 39 and IFRS 4)
2009 Basel II - IFRS(inc. IAS 32 & 39 and IFRS 4)
French Networks
International Retail Banking

23/27
Q1 Q2 Q3 Q4 Q1 Q2 Q3 Q4 Q1 Q2 Q3 Q4Corporate and Investment Banking
Net banking income 1,232 2,645 2,348 803 2,144 1,751 1,934 2,007 2,280 1,835Operating expenses -937 -1,162 -1,037 -845 -1,152 -1,074 -1,159 -1,321 -1,315 -1,163Gross operating income 295 1,483 1,311 -42 992 677 775 686 965 672Net allocation to provisions -569 -257 -605 -889 -233 -142 -123 -270 -134 -147Operating income -274 1,226 706 -931 759 535 652 416 831 525Net income from other assets 0 -2 1 -6 1 -3 0 -5 2 63Net income from companies accounted for by the equity method
0 21 13 18 9 0 0 0 0 0
Impairment losses on goodwill 0 0 0 0 0 0 0 0 0 0Income tax 108 -361 -200 360 -225 -121 -181 -97 -239 -137Net income before minority interests -166 884 520 -559 544 411 471 314 594 451
O.w. non controlling Interests 5 6 2 3 3 1 3 3 3 2
Group net income -171 878 518 -562 541 410 468 311 591 449Average allocated capital 9,336 9,229 8,877 8,401 8,196 8,717 9,626 9,981 9,848 9,616n/s 38.1% 23.3% n/s 26.4% 18.8% 19.4%
Core activities
Net banking income 2,824 2,810 2,635 1,579 2,167 1,680 2,024 1,894 2,238 1,792Financing and Advisory 578 661 642 629 602 656 729 757 641 655Global Markets 2,246 2,149 1,993 950 1,565 1,024 1,295 1,137 1,597 1,137
o.w. Equities 647 1,034 1,057 693 786 357 639 684 884 615o.w. Fixed income, Currencies and Commodities 1,599 1,115 936 257 779 667 656 453 713 523
Operating expenses -928 -1,153 -1,026 -834 -1,140 -1,060 -1,139 -1,295 -1,299 -1,148Gross operating income 1,896 1,657 1,609 745 1,027 620 885 599 939 644Net allocation to provisions -348 -239 -249 -86 -19 -45 -15 7 -38 -17Operating income 1,548 1,418 1,360 659 1,008 575 870 606 901 627Net income from other assets 0 -1 0 -6 1 -4 1 -5 2 63Net income from companies accounted for by the equity method
0 21 14 18 9 0 0 0 0 0
Impairment losses on goodwill 0 0 0 0 0 0 0 0 0 0
Income tax -494 -424 -416 -165 -305 -133 -251 -158 -260 -169Net income before minority interests 1,054 1,014 958 506 713 438 620 443 643 521
O.w. non controlling Interests 5 6 3 2 3 1 4 2 3 2
Group net income 1,049 1,008 955 504 710 437 616 441 640 519Average allocated capital 7,936 7,427 6,882 6,557 6,486 6,771 7,026 7,075 6,782 6,806
Legacy assets
Net banking income -1,592 -165 -287 -776 -23 71 -90 113 42 43Operating expenses -9 -9 -11 -11 -12 -14 -20 -26 -16 -15Gross operating income -1,601 -174 -298 -787 -35 57 -110 87 26 28Net allocation to provisions -221 -18 -356 -803 -214 -97 -108 -277 -96 -130Operating income -1,822 -192 -654 -1,590 -249 -40 -218 -190 -70 -102Net income from other assets 0 -1 1 0 0 1 -1 0 0 0Net income from companies accounted for by the equity method 0 0 -1 0 0 0 0 0 0 0
Impairment losses on goodwill 0 0 0 0 0 0 0 0 0 0
Income tax 602 63 216 525 80 12 70 61 21 32Net income before minority interests -1,220 -130 -438 -1,065 -169 -27 -149 -129 -49 -70
O.w. non controlling Interests 0 0 -1 1 0 0 -1 1 0 0
Group net income -1,220 -130 -437 -1,066 -169 -27 -148 -130 -49 -70Average allocated capital 1,400 1,802 1,995 1,844 1,710 1,946 2,600 2,906 3,066 2,810
2011 Basel II - IFRS(inc. IAS 32 & 39 and IFRS 4)
2009 Basel II - IFRS(inc. IAS 32 & 39 and IFRS 4)
2010 Basel II - IFRS(inc. IAS 32 & 39 and IFRS 4)

24/27
Q1 Q2 Q3 Q4 Q1 Q2 Q3 Q4 Q1 Q2 Q3 Q4Specialised Financial Services & Insurance
Net banking income 740 805 810 884 849 926 888 876 873 871Operating expenses -430 -441 -446 -501 -446 -466 -464 -465 -470 -458Gross operating income 310 364 364 383 403 460 424 411 403 413Net allocation to provisions -234 -293 -338 -359 -299 -311 -299 -265 -213 -214Operating income 76 71 26 24 104 149 125 146 190 199Net income from other assets 0 1 1 -18 0 -4 0 -1 -1 -1Net income from companies accounted for by the equity method -18 -13 -7 -16 -1 -7 1 -5 1 8
Impairment losses on goodwill 0 -19 1 -26 0 0 0 0 0 0
Income tax -22 -18 -8 0 -30 -41 -35 -42 -55 -56Net income before minority interests 36 22 13 -36 73 97 91 98 135 150
O.w. non controlling Interests 3 2 3 1 3 5 4 4 4 4
Group net income 33 20 10 -37 70 92 87 94 131 146Average allocated capital 4,423 4,511 4,611 4,712 4,739 4,825 4,954 4,806 4,968 5,009
Private Banking, Global Investment Management and ServicesNet banking income 588 670 636 640 504 592 568 606 580 547Operating expenses -554 -562 -557 -555 -466 -511 -504 -521 -484 -499Gross operating income 34 108 79 85 38 81 64 85 96 48Net allocation to provisions -18 -9 -12 -1 0 -5 5 -7 -12 -12Operating income 16 99 67 84 38 76 69 78 84 36Net income from other assets -1 2 -1 -1 0 0 0 -1 2 0Net income from companies accounted for by the equity method
0 0 0 0 26 21 28 25 32 30
Income tax 1 -26 -15 -20 -9 -22 -17 -23 -21 -6Net income before minority interests 16 75 51 63 55 75 80 79 97 60
O.w. non controlling Interests 1 1 1 1 0 1 0 -1 0 1
Group net income 15 74 50 62 55 74 80 80 97 59Average allocated capital 1,368 1,327 1,323 1,352 1,391 1,466 1,422 1,391 1,376 1,409
o.w. Private BankingNet banking income 197 222 206 204 162 163 203 171 220 194Operating expenses -131 -132 -131 -132 -130 -134 -147 -140 -155 -155Gross operating income 66 90 75 72 32 29 56 31 65 39Net allocation to provisions -17 -9 -11 -1 0 -1 0 -3 -11 0Operating income 49 81 64 71 32 28 56 28 54 39Net income from other assets 0 0 0 0 0 0 -1 1 0 0Net income from companies accounted for by the equity method 0 0 0 0 0 0 0 0 0 0
Income tax -11 -18 -15 -16 -8 -5 -13 -7 -10 -8Net income before minority interests 38 63 49 55 24 23 42 22 44 31
O.w. non controll ing Interests 0 0 0 0 0 0 0 0 1 0
Group net income 38 63 49 55 24 23 42 22 43 31Average allocated capital 452 436 443 427 405 461 473 476 502 487
o.w. Asset ManagementNet banking income 113 169 171 193 83 135 109 150 89 80Operating expenses -152 -151 -174 -179 -94 -133 -116 -114 -78 -87Gross operating income -39 18 -3 14 -11 2 -7 36 11 -7Net allocation to provisions 0 0 0 0 0 -3 4 -4 1 -1Operating income -39 18 -3 14 -11 -1 -3 32 12 -8Net income from other assets 0 -1 1 -1 0 0 0 -1 0 0Net income from companies accounted for by the equity method 0 0 0 0 26 21 28 25 32 30
Income tax 13 -5 0 -4 4 0 1 -10 -4 3Net income before minority interests -26 12 -2 9 19 20 26 46 40 25
O.w. non controll ing Interests 0 2 0 1 0 0 0 0 0 0
Group net income -26 10 -2 8 19 20 26 46 40 25Average allocated capital 402 375 355 418 491 435 418 419 435 446
2011 Basel II - IFRS(inc. IAS 32 & 39 and IFRS 4)
2009 Basel II - IFRS(inc. IAS 32 & 39 and IFRS 4)
2010 Basel II - IFRS(inc. IAS 32 & 39 and IFRS 4)
o.w. SG SS & BrokersNet banking income 278 279 259 243 259 294 256 285 271 273Operating expenses -271 -279 -252 -244 -242 -244 -241 -267 -251 -257Gross operating income 7 0 7 -1 17 50 15 18 20 16Net allocation to provisions -1 0 -1 0 0 -1 1 0 -2 -11Operating income 6 0 6 -1 17 49 16 18 18 5Net income from other assets -1 3 -2 0 0 0 1 -1 2 0Net income from companies accounted for by the equity method 0 0 0 0 0 0 0 0 0 0
Income tax -1 -3 0 0 -5 -17 -5 -6 -7 -1Net income before minority interests 4 0 4 -1 12 32 12 11 13 4
O.w. non controll ing Interests 1 -1 1 0 0 1 0 -1 -1 1
Group net income 3 1 3 -1 12 31 12 12 14 3Average allocated capital 514 516 525 507 495 570 532 496 439 476

25/27
Q1 Q2 Q3 Q4 Q1 Q2 Q3 Q4 Q1 Q2 Q3 Q4
Corporate Centre
Net banking income -595 -1,468 -865 -358 9 239 -252 56 -341 -48Operating expenses 5 -55 -20 -77 -38 -75 -18 -38 -45 -74Gross operating income -590 -1,523 -885 -435 -29 164 -270 18 -386 -122Net allocation to provisions -4 8 -2 2 -2 -2 1 -4 -17 -384Operating income -594 -1,515 -887 -433 -31 162 -269 14 -403 -506Net income from other assets 3 -1 -1 725 3 -6 0 20 -7 1Net income from companies accounted for by the equity method -1 -2 1 0 0 0 -1 4 1 -3
Impairment losses on goodwill 0 1 -1 2 0 0 0 0 0 0Income tax 134 480 377 213 64 -45 83 -8 156 134Net income before minority interests -458 -1,037 -511 507 36 111 -187 30 -253 -374
O.w. non controlling Interests 42 42 49 46 32 40 41 47 46 33
Group net income -500 -1,079 -560 461 4 71 -228 -17 -299 -407
GroupNet banking income 4,913 5,716 5,970 5,131 6,581 6,679 6,301 6,857 6,619 6,503Operating expenses -3,777 -4,107 -3,898 -3,984 -4,001 -4,065 -4,039 -4,440 -4,376 -4,241Gross operating income 1,136 1,609 2,072 1,147 2,580 2,614 2,262 2,417 2,243 2,262Net allocation to provisions -1,354 -1,075 -1,513 -1,906 -1,132 -1,010 -918 -1,100 -878 -1,185Operating income -218 534 559 -759 1,448 1,604 1,344 1,317 1,365 1,077Net income from other assets 3 11 0 697 12 -12 -2 13 1 63Net income from companies accounted for by the equity method
-16 10 12 9 40 18 33 28 38 40
Impairment losses on goodwill 0 -18 0 -24 0 0 0 1 0 0Income tax 60 -122 -40 410 -375 -431 -372 -364 -370 -317Net income before minority interests -171 415 531 333 1,125 1,179 1,003 995 1,034 863
O.w. non controlling Interests 107 106 105 112 62 95 107 121 118 116
Group net income -278 309 426 221 1,063 1,084 896 874 916 747Average allocated capital 29,274 29,373 29,889 32,442 35,339 36,503 37,187 37,538 37,972 38,754Group ROE (after tax) NM 2.9% 4.1% 1.5% 11.1% 10.9% 8.7% 8.4% 8.8% 6.9%
2011 Basel II - IFRS(inc. IAS 32 & 39 and IFRS 4)
2010 Basel II - IFRS(inc. IAS 32 & 39 and IFRS 4)
2009 Basel II - IFRS(inc. IAS 32 & 39 and IFRS 4)

26/27
1- The Group’s H1 consolidated results as at June 30th, 2011 were examined by the Board of Directors on August 2nd, 2011. The financial information presented for the six-month period ended June 30th, 2011 has been prepared in accordance with IFRS as adopted in the European Union and applicable at that date. This financial information does not constitute a set of financial statements for an interim period as defined by IAS 34 "Interim Financial Reporting". The financial information has been submitted to the Statutory Auditors who will review and issue a report on the H1 financial information as at June 30th, 2011. 2- Group ROE is calculated on the basis of average Group shareholders’ equity under IFRS excluding (i) unrealised or deferred capital gains or losses booked directly under shareholders' equity excluding conversion reserves, (ii) deeply subordinated notes, (iii) undated subordinated notes recognised as shareholders’ equity, and deducting (iv) interest to be paid to holders of deeply subordinated notes and of the restated, undated subordinated notes. The net income used to calculate ROE excludes interest, net of tax impact, to be paid to holders of deeply subordinated notes for the period and, since 2006, holders of deeply subordinated notes and restated, undated subordinated notes (EUR 81 million in Q2 11 and EUR 162 million in H1 11). 3- For the calculation of earnings per share, “Group net income for the period” is corrected (reduced in the case of a profit and increased in the case of a loss) for interest, net of tax impact, to be paid to holders of:
(i) deeply subordinated notes (EUR 75 million in Q2 11 and EUR 150 million in H1 11), (ii) undated subordinated notes recognised as shareholders’ equity (EUR 6 million in Q2 11
and EUR 12 million in H1 11). Earnings per share is therefore calculated as the ratio of corrected Group net income for the period to the average number of ordinary shares outstanding, excluding own shares and treasury shares but including (a) trading shares held by the Group and (b) shares held under the liquidity contract. 4- Net assets are comprised of Group shareholders’ equity, excluding (i) deeply subordinated notes (EUR 6.2 billion), undated subordinated notes previously recognised as debt (EUR 0.8 billion) and (ii) interest to be paid to holders of deeply subordinated notes and undated subordinated notes, but reinstating the book value of trading shares held by the Group and shares held under the liquidity contract. The number of shares used to calculate book value per share is the number of shares issued at June 30th, 2011 (including preference shares), excluding own shares and treasury shares but including (a) trading shares held by the Group and (b) shares held under the liquidity contract. 5 – The Societe Generale Group’s Core Tier One capital is defined as Tier 1 capital minus the outstandings of hybrid instruments eligible for Tier 1 and a share of Basel 2 deductions. This share corresponds to the ratio between core Tier 1 capital excluding hybrid instruments eligible for Tier 1 capital and Core Tier 1 capital. Information on the 2011 financial year results is also available on Societe Generale’s website www.societegenerale.com in the “Investor” section.
APPENDIX 2: MÉTHODOLOGY

27/27
Societe Generale
Societe Generale is one of the largest European financial services groups. Based on a diversified universal banking model, the Group combines financial solidity with a strategy of sustainable growth, and aims to be the reference for relationship banking, recognised on its markets, close to clients, chosen for the quality and commitment of its teams.
Its 157,000 employees* based in 85 countries accompany more than 33 million clients throughout the world on a daily basis. Societe Generale’ teams offer advice and services to individual, corporate and institutional customers in three core businesses: Retail banking in France with the Societe Generale branch network, Credit du Nord and Boursorama International retail banking, with a presence in Central and Eastern Europe and Russia, the Mediterranean Basin, Sub-
Saharan Africa, Asia and French Overseas Territories Corporate and investment banking with a global expertise in investment banking, financing and market activities.
Societe Generale is also a significant player in specialised financial services, insurance, private banking, asset management and securities services.
Societe Generale is included in the international socially-responsible investment indices: FTSE4good and ASPI. www.societegenerale.com * including employees of Société Marseillaise de Crédit acquired in September 2010 by Credit du Nord