Press & Analyst Presentation - Amazon Web...
24
February 14, 2017 Press & Analyst Presentation
Transcript of Press & Analyst Presentation - Amazon Web...
February 14, 2017
Press & Analyst Presentation
Tata Motors
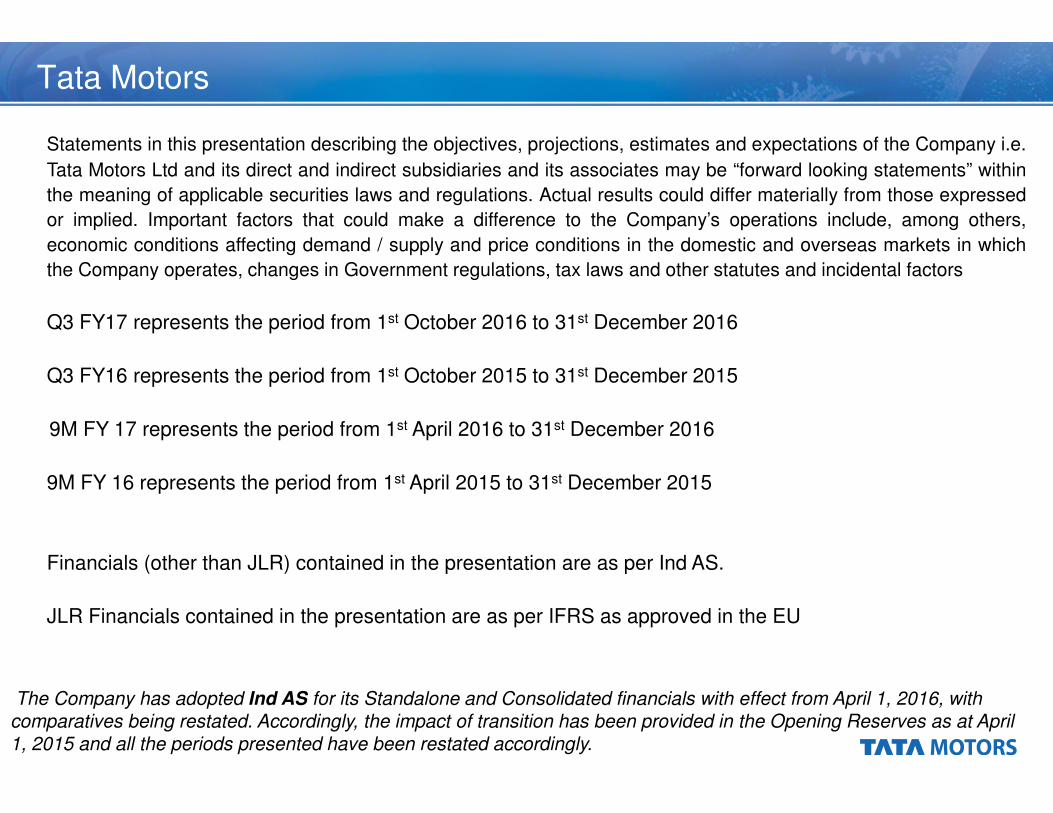
Statements in this presentation describing the objectives, projections, estimates and expectations of the Company i.e.
Tata Motors Ltd and its direct and indirect subsidiaries and its associates may be “forward looking statements” within
the meaning of applicable securities laws and regulations. Actual results could differ materially from those expressed
or implied. Important factors that could make a difference to the Company’s operations include, among others,
economic conditions affecting demand / supply and price conditions in the domestic and overseas markets in which
the Company operates, changes in Government regulations, tax laws and other statutes and incidental factors
Q3 FY17 represents the period from 1st October 2016 to 31st December 2016
Q3 FY16 represents the period from 1st October 2015 to 31st December 2015
9M FY 17 represents the period from 1st April 2016 to 31st December 2016
9M FY 16 represents the period from 1st April 2015 to 31st December 2015
Financials (other than JLR) contained in the presentation are as per Ind AS.
JLR Financials contained in the presentation are as per IFRS as approved in the EU
The Company has adopted Ind AS for its Standalone and Consolidated financials with effect from April 1, 2016, with
comparatives being restated. Accordingly, the impact of transition has been provided in the Opening Reserves as at April
1, 2015 and all the periods presented have been restated accordingly.
Table of Contents
Tata Motors Group-Standalone Business
Tata Motors Group-Jaguar Land Rover
Tata Motors Group-Way Forward
Financial Highlights
IND AS Adjustments-Annexure 1 & Back up Slide

Financial Highlights
Q3 FY17 Q3 FY16
Net Revenue 67,484 70,567
EBITDA 5,975 9,708
EBITDA % 8.9 13.8
PBT 599 3,414
PAT 112 2,953
Tata Motors Group- Consolidated (Rs Crores)
Tata Motors Group-Standalone
(incl Joint Operations)(Rs Crores)
Tata Motors Group-Jaguar Land
Rover (IFRS) (GBP Million)
Q3 FY17 Q3 FY16
Net Revenue 6,537 5,781
EBITDA 611 834
EBITDA % 9.3 14.4
PBT 255 499
PAT 167 440
9M FY17 9M FY16
Net Revenue 199,429 192,543
EBITDA 21,493 28,781
EBITDA % 10.8 14.9
PBT 4,149 8,237
PAT 3,220 6,467
9M FY17 9M FY16
Net Revenue 30,940 30,068
EBITDA 1,229 2044
EBITDA % 4.0 6.8
PBT (1,603) (404)
PAT (1,651) (460)
9M FY17 9M FY16
Net Revenue 17,951 15,614
EBITDA 1,898 2,244
EBITDA % 10.6 14.4
PBT 934 980
PAT 715 840
For the presentation purpose, revenue has been taken as net of excise duty. EBITDA % is calculated on Revenue net of excise duty
Consolidated PAT is after share of profit/(loss) in respect of associate companies.
Joint Operations included in Standalone financials are Tata Cummins Private Ltd and Fiat India Automobile Private Limited
Q3 FY17 Q3 FY16
Net Revenue 10,167 10,019
EBITDA 153 605
EBITDA % 1.5 6.0
PBT (1,032) (139)
PAT (1,046) (137)
• JLR had Net Cash position as
of 31st December 2016 • Net Debt to Equity of TML
Standalone as of December 31,
2016 was 0.93
• Net Auto Debt to Equity as of
December 31,2016 was 0.36

Tata Motors Group-Operating profit performance-Q3 FY17 Snapshot
Standalone Business Performance :-
Standalone business(including Joint Operations) reported a EBITDA Margin
of 1.5%.This broadly reflects :-
� De-growth in M&HCV of 9.0% (Y-o-Y), partially offset by
� Flat LCV growth of 0.2% (Y-o-Y)
� Car segment growth of 31.1% (Y-o-Y)
� Strong Exports growth of 34.6% (Y-o-Y)
Jaguar Land Rover Business Performance :-
Jaguar land Rover EBITDA for Q3 FY17 was £611 mn ( compared to £834
mn in Q3 FY 16), EBITDA margin at 9.3% (14.4% in Q3 FY16) ; difference in
margin primarily reflecting :
� Lower wholesale volumes, and less favourable product mix partially offset
by favourable market mix (2.0%, including the runout of Discovery)
� Unfavourable variable marketing expense (1.7%, including the impact of
16MY runout in the US)
� Higher new model launch costs (0.3%) and Biennial pay negotiation
settlement (0.4%)
� Favourable operating exchange offset by realised hedges.
EBITDA margin adjusting the revenue for realised FX hedging was around 10.1%.
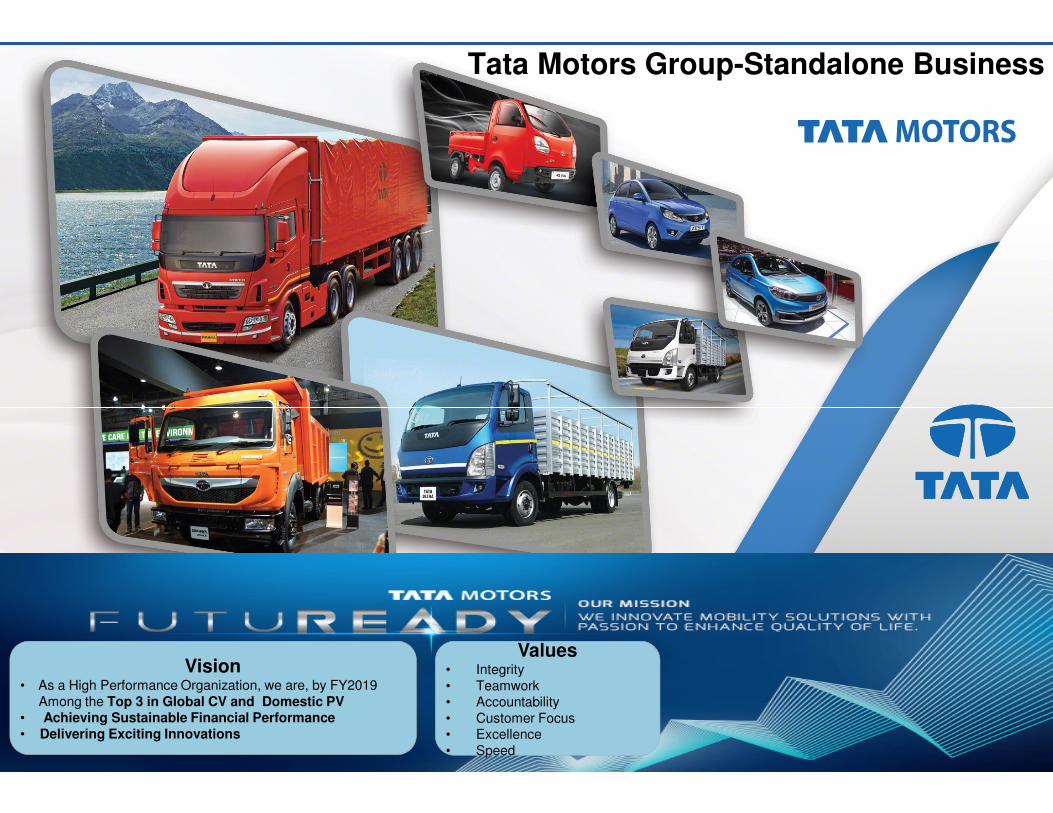
Tata Motors Group-Standalone Business
Values• Integrity
• Teamwork• Accountability
• Customer Focus• Excellence
• Speed
Vision• As a High Performance Organization, we are, by FY2019
Among the Top 3 in Global CV and Domestic PV • Achieving Sustainable Financial Performance • Delivering Exciting Innovations

Tata Motors Group-Standalone Business :-Commercial Vehicles
• CV Industry witnessed demand shrinkage in the months of November and December 2016 on account of the impact of demonetisation which led to demand postponement in Q3 FY 17,
� Domestic CV volumes of the Company declined by 4.1 % Y-o-Y in Q3 FY 17. M&HCV segment declined by 9.0 % Y-o-Y. LCV segment saw growth of 0.2 % Y-o-Y
• Despite demonetization, MHCV Construct and Busessegment , witnessed strong growth of 37.2% Y-o-Y and 38.1 % Y-o-Y respectively
• Variable marketing expenses remain high in the Industry.
• Material costs are also showing upward increase.
Company has taken price increases to mitigate this.
� Exports continued its growth trajectory, up 33.3 % Y-o-Y in Q3 FY17.
Total CV Volumes (including Exports), up 0.8 % YoY in Q3 FY17. Exports witnessed strong
growth of 33.3 % YoY in Q3 FY17
CV Q3 FY17
MHCV(Dom.) 33,607
LCV(Dom.) 41,771
Exports 16,007
Total 91,385
Q3FY16 Q3FY17 9MFY16 9MFY17
M&HCV LCV Exports
90,631 91,385
274,982266,285
0.8%
3.3%
9M FY17
102,319
127,388
45,275
274,982

Tata Motors Group-Standalone Business :-Passenger Vehicles
• Passenger vehicle industry witnessed a growth of 1.9
% y-o-y in Q3 FY 17. Domestic volume of TML in
passenger vehicles segment grew by 25.4% in the same
period.
• Passenger car industry de-grew by 2.4% y-o-y. The car
segment of TML outperformed industry with a growth of 31.1% y-o-y, supported by continued strong demand of
Tata Tiago
• Tiago bags several awards including,
Compact car of the Year-CNBC-TV18 Overdrive Awards
Entry hatchback of the Year -NDTV Car and Bike Award
Car of the Year 2016-Team BHP
• Tata Hexa was unveiled with strong responses and high acclaim from all sections of media and auto critics based on its first-in-segment features, design and technology.
Total PV volumes (including exports) up 26.1% Y-o-Y in Q3 FY 17
PV Q3 FY17
Cars(dom.) 35,907
UVs & Vans(dom.) 4,190
Exports 1090
Total 41,187
Q3FY16 Q3FY17 9MFY16 9MFY17
Cars UVs&Vans Exports
32,66441,187
101,139
118,828
26.1%
17.5%
9M FY17
103,185
12,350
3,293
118,828
Tata Motors Group-Jaguar Land Rover
TO BE THE WORLD’S PERFORMANCE BRAND OF CHOICE
TO BE THE WORLD’S PREMIUM SUV BRAND OF CHOICE
MORE GREAT PRODUCTS
CUSTOMER FIRST
ENVIRONMENTAL
INNOVATION
Tata Motors Group-Jaguar Land Rover
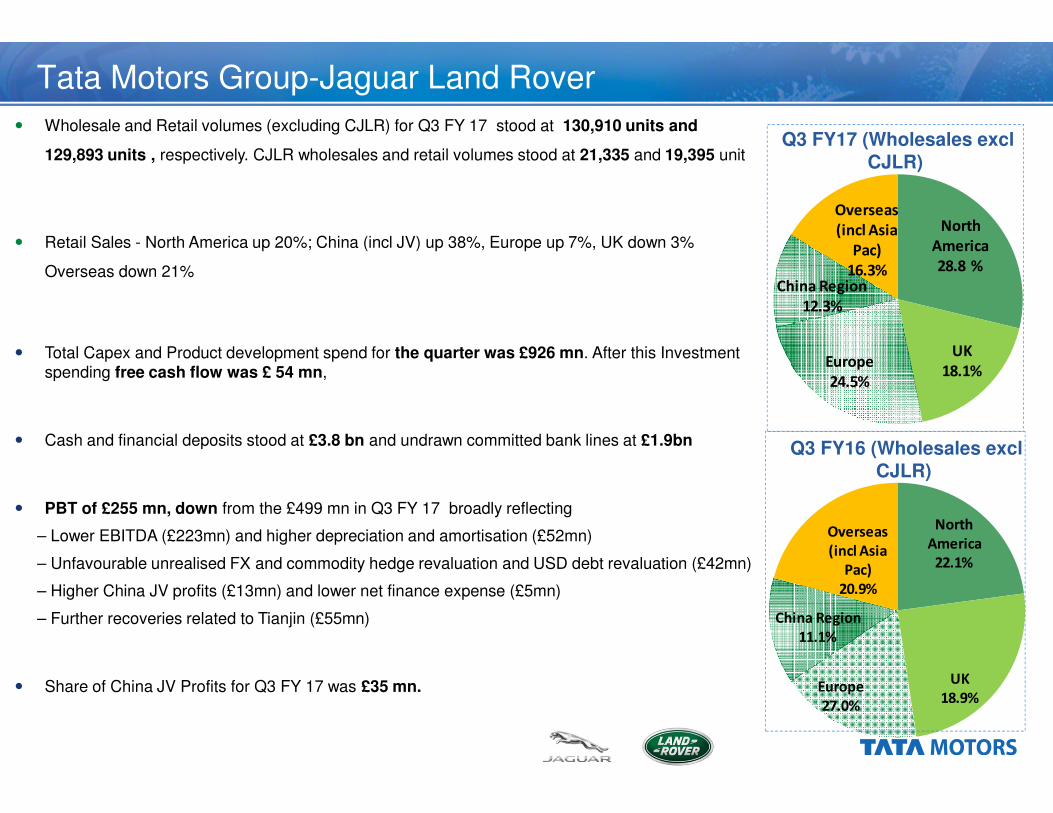
North
America
28.8 %
UK
18.1%Europe
24.5%
China Region
12.3%
Overseas
(incl Asia
Pac)
16.3%
North
America
22.1%
UK
18.9%Europe
27.0%
China Region
11.1%
Overseas
(incl Asia
Pac)
20.9%
Q3 FY17 (Wholesales excl
CJLR)
Q3 FY16 (Wholesales excl
CJLR)
� Wholesale and Retail volumes (excluding CJLR) for Q3 FY 17 stood at 130,910 units and
129,893 units , respectively. CJLR wholesales and retail volumes stood at 21,335 and 19,395 unit
� Retail Sales - North America up 20%; China (incl JV) up 38%, Europe up 7%, UK down 3%
Overseas down 21%
� Total Capex and Product development spend for the quarter was £926 mn. After this Investment spending free cash flow was £ 54 mn,
� Cash and financial deposits stood at £3.8 bn and undrawn committed bank lines at £1.9bn
� PBT of £255 mn, down from the £499 mn in Q3 FY 17 broadly reflecting
– Lower EBITDA (£223mn) and higher depreciation and amortisation (£52mn)
– Unfavourable unrealised FX and commodity hedge revaluation and USD debt revaluation (£42mn)
– Higher China JV profits (£13mn) and lower net finance expense (£5mn)
– Further recoveries related to Tianjin (£55mn)
� Share of China JV Profits for Q3 FY 17 was £35 mn.

Tata Motors Group-Jaguar Land Rover- Other Developments
Watch this space!Watch this space!Watch this space!Watch this space!
F-PACE (May 2016) XFL (Sep 2016)
All new Discovery (Q4 FY17)I-PACE concept (2018)
Evoque convertible (Jun 2016)
RE CE NT & UP COMI NG NE W MODE LS TO DRI VE GROWT HRE CE NT & UP COMI NG NE W MODE LS TO DRI VE GROWT HRE CE NT & UP COMI NG NE W MODE LS TO DRI VE GROWT HRE CE NT & UP COMI NG NE W MODE LS TO DRI VE GROWT H

Tata Motors Group-Jaguar Land Rover- Other Developments
IIII----PACE conceptPACE conceptPACE conceptPACE concept
•All-wheel-drive from twin
electric motors
•500km range (NEDC cycle)
•0-60mph in 4 seconds
•90kWh lithium-ion battery
•Rapid charging takes 2 hours
•On the road in 2018
J LR’ S FI RST BAT T E RY E LE CT RIC VE H I CLEJ LR’ S FI RST BAT T E RY E LE CT RIC VE H I CLEJ LR’ S FI RST BAT T E RY E LE CT RIC VE H I CLEJ LR’ S FI RST BAT T E RY E LE CT RIC VE H I CLE
Tata Motors Group-Way Forward

Tata Motors Group – Standalone Business - Way
Forward
� 6 Strategic Themes –Shaping up the Future
15
Tata Motors Group – India Business - Way Forward
Intense topline focus
Agile cost management
Structural improvements
Customer centricity
New business models & technologies
Lean and accountable organization

Tata Motors Group – Standalone Business - Way
Forward
Commercial Vehicles
• Infrastructure spending and pre-buying before adoption of BS IV from 1st April 2017 , will result in improved MHCV segment demand in Q4 , and enable MHCV industry to at least show a flat performance vs previous year . Buses & Construck segment will continue to maintain their positive growth momentum during the year. Company expects overall growth momentum to continue in FY 18.
• Wide and compelling product range with several new launches in coming months and FY18 provides strong foundation for growth :-
M&HCV- Expansion of new Signa Range across tonnages and applications ( sizable segments of 49T and 40T already covered).Well prepared for BS4 launces in Q4 and April 2017 .Aim to get back to position of more than 60% market share over the next 2 years in 16 tonne and above segment (from the current level of ~55-56%)
LCV & ILCV- Expansion of the new Ultra Range across tonnages and applications. Roll out of more products with the superior Next Gen 3 litres and 5 litres common rail engines.
SCV & Pick up :- Ramp up of Xenon Yodha , refreshes/variants along with extra deck length to further complement and strengthen the ACE and Super ACE family. Ace Mega XL and Ace ZIP XL launches in Feb/,March 2017
• Export growth in FY 17 is expected to be in the range of 20%. Exports will continue to grow at this rate, and steadily increase its share of CV business. Launches of Prima and Ultra underway in many markets.
• Company has a good pipeline of Defense orders- received and expected.
• Prima T1 Truck Racing event planned on March 19th , with the much larger contingent of Indian CV drivers.
� Company will continue to explore capital optimization through better operating efficiencies in working capital etc and
monetization of non-core assets and some of its investments
15
Tata Motors Group – Standalone Business - Way Forward
Tata Motors signs on Akshay Kumar as brand ambassador for
its Commercial Vehicles Business

Tata Motors Group – Standalone Business - Way Forward
Passenger vehicles
• Company has launched new Tata Hexa in January 2017. Hexa has received very positive reviews and accolades from the auto media, journalist and enthusiasts. The strong response is also reflected in the strong order book of more than 8 weeks even before the launch of Hexa on January 2017.
• Launch of Tata Tigor and Nexon to follow.
• Dealer network expansion will also be a focus area
• Customer centricity will be continuously strived for, as reflected in the improved ranking of 3rd place in the recent JDP CSI
• Introduced new sub-brand – TAMO- incubating vertical to drive innovation and future mobility solutions
New “Styleback”

Tata Motors Group – Jaguar Land Rover- Way ForwardCONTINUING TO INVEST TO DRIVE PROFITABLE GROWTH
• JLR’s strategy continues to be to invest in new products, technology and manufacturing capacity to grow profitably.
• Jaguar Land Rover plans to continue to build on recent successful product launches with the continued sales ramp up of
the Jaguar F-PACE, XF long wheel base in China, the all new Land Rover Discovery and others to be announced this
year.
• The start of new Discovery wholesales, peak March UK sales and other seasonal factors should support a solid final
quarter.
• JLR continues to have a balanced sales profile and will continue to closely monitor and assess market conditions in key
regions.
29
Tata Motors - Contact Information :
Thank You

Ind AS Adjustments- Consolidated Financials Annexure 1
Key impact areas
As at 31 March 2016
Change Key ReasonsIGAAP IND AS
Equity 80,783 79,002 (1,781)
1) Fair valuation of property, plant and equipment of Tata Motors Limited and certain
subsidiaries
2) Provision of Finance Receivables as per Expected Loss model
3) Fair valuation of Government loans granted at subsidized rate
4) Recognition of Government grants for duty saved under EPCG scheme on capital goods
5) Discounting of warranty provisions
6) Fair valuation of Investments in quoted equity instruments and mutual funds
7) Application of Business combination retrospectively
Goodwill 4,837 760 (4,077) 1) Application of Business combination retrospectively
Gross Debt 70,468 69,647 (821)
1) Reclass of preference shares issued outside TML group by subsidiary companies from
Minority Interest to Borrowings
2) Fair valuation of Government loans granted at subsidized rate
3) Adjustment of loan processing fees/transaction costs
4) Proceeds from certain receivables discounting scheme treated as short term bank
finance
5) Equity method accounting for certain investments in Joint Ventures
Property, Plant and Equipment and Intangibles 128,851 132,264 3,413
1) Fair valuation of property, plant and equipment of Tata Motors Limited and certain
subsidiaries
2) Application of Business combination retrospectively
3) Capitalization of duty saved under EPCG scheme on capital goods
4) Equity method accounting for certain investments in Joint Ventures
Investments 20,466 23,768 3,302
1) Equity method accounting for investments in Joint Ventures
2) Fair valuation of investments in quoted equity instruments and mutual funds

Ind AS Adjustments- Consolidated Financials Annexure 1
Key impact areas
As at 31 March 2016
Change Key ReasonsIGAAP IND AS
Other current & non-current assets 112,418 106,535 (5,883)
1) Equity method accounting for investments in Joint Ventures
2) Provision as per Expected Loss model and other adjustment for finance receivables
Deferred tax liabilities (net) 440 515 75
1) Deferred tax on undistributed earnings of subsidiaries, joint arrangements and associates
2) Deferred tax on acquisition related adjustments on business combination
3) Deferred tax on intercompany adjustments
4) Equity method accounting for investments in Joint Ventures
Other liabilities & provisions 114,880 114,162 718
1) Equity method accounting for investments in Joint Ventures
2) Discounting of Warranty provisions

Ind AS Adjustments- Standalone Financials Annexure 1
Key impact areas
As at 31 March 2016
Change Key ReasonsIGAAP IND AS*
Equity 22,368 23,358 990
1) Fair valuation of property, plant and equipment of Tata Motors Limited
2) Provision of Financial Guarantees as per Expected Loss model3) Fair valuation of Government loans granted at subsidized rate4) Recognition of Government grants for duty saved under EPCG scheme on capital goods5) Discounting of warranty provisions6) Fair valuation of Investments in quoted equity instruments and mutual funds7) Proportionate consolidation of joint operation
Gross Debt 15,887 16,715 828
1) Fair valuation of Government loans granted at subsidized rate2) Adjustment of loan processing fees/transaction costs3) Proceeds from certain receivables discounting scheme treated as short term
bank finance4) Proportionate consolidation of joint operation
Other Liabilities & Provisions 14,171 16,779 2,608
1) Proportionate consolidation of joint operation2) Provision of financial guarantees as per Expected Loss model
Property, Plant and Equipment and Intangibles 22,245 26,724 4,479
1) Fair valuation of property, plant and equipment of Tata Motors Limited2) Capitalization of duty saved under EPCG scheme on capital goods3) Proportionate consolidation of joint operation
Investments 18,711 16,963 (1,748)1) Elimination of Investments due to Proportionate consolidation of joint operation2) Fair valuation of investments in quoted equity instruments and mutual funds
* Including Joint Operation
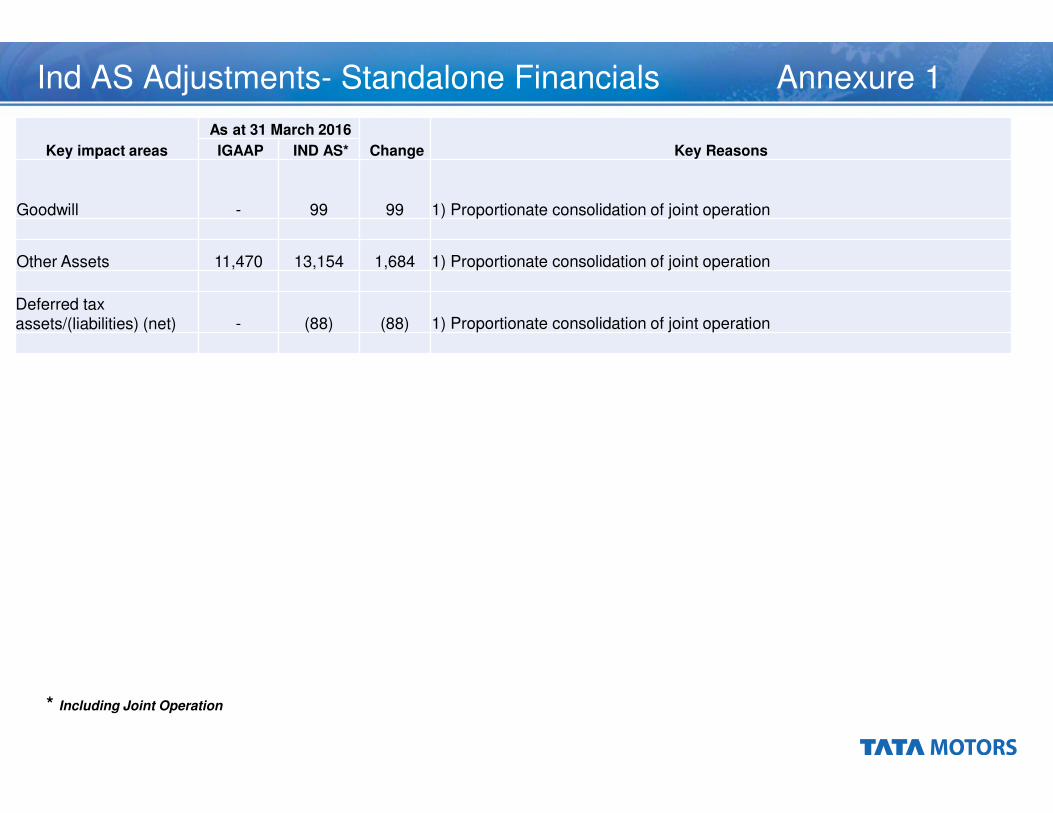
Ind AS Adjustments- Standalone Financials Annexure 1
Key impact areas
As at 31 March 2016
Change Key ReasonsIGAAP IND AS*
Goodwill - 99 99 1) Proportionate consolidation of joint operation
Other Assets 11,470 13,154 1,684 1) Proportionate consolidation of joint operation
Deferred tax assets/(liabilities) (net) - (88) (88) 1) Proportionate consolidation of joint operation
* Including Joint Operation

Ind AS Adjustments- Annexure 1
Other changes:
Joint Ventures now accounted as per ‘equity method’ of accounting, instead of line by line accounting, which has resulted in changes in almost all items of the Balance Sheet and the P&L.
Assets and liabilities have been classified between financial and non-financial as required by IND-AS.
The Statement of Changes in Equity is a new statement introduced under IND-AS. The statement presents reconciliation of components of equity e.g. share capital, other comprehensive reserves, other reserves etc.
Other Comprehensive Income (‘OCI’) which comprises items of income and expense that are not recognised in profit or loss as required or permitted by IND-AS, is presented in the ‘Other Components of Equity’ section of Statement of Changes in Equity.
Tata Motors standalone financials include proportionate share of income and expenditure and assets and liabilities in its two joint operations, namely Tata Cummins Pvt Ltd and Fiat India Automobile Pvt Ltd.
Further transition adjustments may be required to the Financial Statements including those arising from further analysis or
interpretations or more optional exemptions from full retrospective application of Ind-AS standards

Tata Motors Group-Jaguar Land Rover- Back up slide
FOREIGN EXCHANGE IMPACT
(£ millions, unless stated) 2016 2015 Change32 24
Operational exchange1 n/a n/a 438
Realized FX Hedges and other2 (455) (71) (384)
Revaluation of Current Assets/Liabilities3 (2) 2 (4)
Total FX impacting EBITDA n/a n/a 50
Revaluation of Undesignated Debt3 (55) (36) (19)
Unrealised FX Hedges3 (13) 43 (56)
Total FX below EBITDA (68) 7 (75)
Total FX impact on PBT n/a n/a (25)
Total FX Revaluation (included above) (70) 9 (79)
End of Period Exchange Rates Q-o-Q Q-o-Q
GBP:USD 1.229 5.1% 1.483 2.1%
GBP:EUR 1.168 0.9% 1.357 0.6%
GBP:CNY 8.565 1.0% 9.740 1.3%
Memo: 1 The year-on-year operational exchange is an analytical estimate, which may differ from the actual impact
2 Realised hedge gains/(losses) are driven by the difference between executed hedging exchange rates compared to accounting exchange rates
3 Exchange revaluation gains/(losses) reflects the estimated impact of the change in end of period exchange rates as applied to relevant balances
Quarter ended 31 December