Presented to: Severn River Association 2008 State of the Severn
10
Presented to: Severn River Association 2008 State of the Severn Anne Arundel County Government Department of Public Works Ron Bowen, P.E. October 21, 2008
-
Upload
kahlilia-kurush -
Category
Documents
-
view
37 -
download
1
description
Anne Arundel County Government Department of Public Works Ron Bowen, P.E. Presented to: Severn River Association 2008 State of the Severn. October 21, 2008. Anne Arundel County Impervious Areas. Historical Urbanization. vs. New Development. - PowerPoint PPT Presentation
Transcript of Presented to: Severn River Association 2008 State of the Severn
Presented to:Severn River Association2008 State of the Severn
Anne Arundel County GovernmentDepartment of Public Works
Ron Bowen, P.E.
October 21, 2008
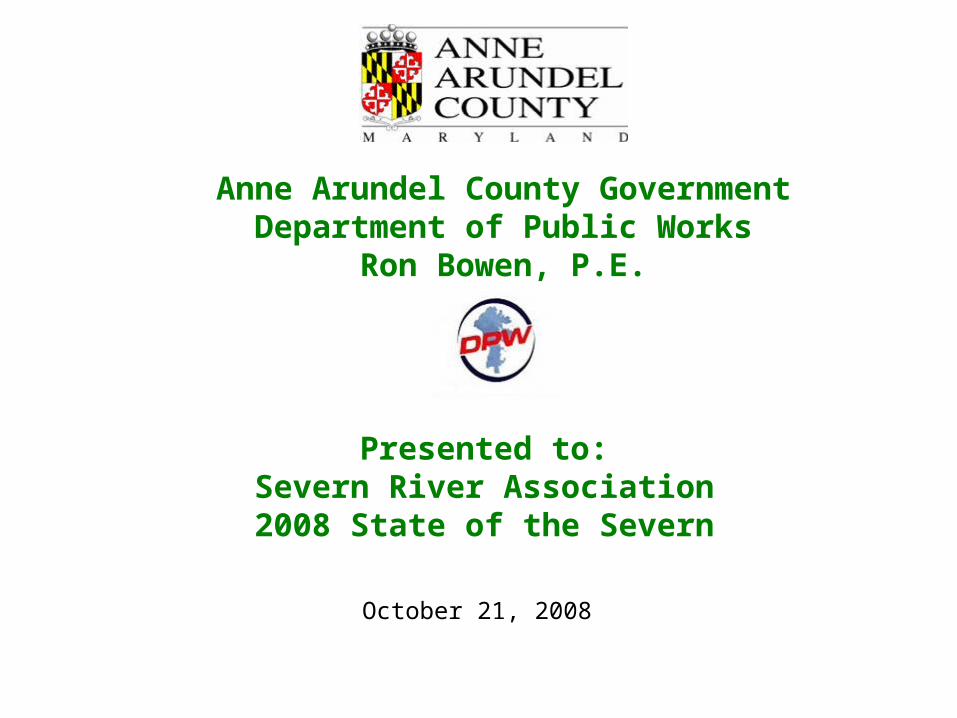
Anne Arundel County Impervious Areas
Our “greatest challenge” Our “greatest challenge” is restoration of those is restoration of those areas developed in an era areas developed in an era when storm water when storm water management was non-management was non-existent or much less than existent or much less than it is today. . .it is today. . .
Historical UrbanizationHistorical Urbanizationvs.vs.
New DevelopmentNew Development
Severn River 44,213 9290 21%South River 35,663 5247 15%Magothy River 22,574 4583 20%Rhode River 8,780 615 7%West River 7,812 567 7%Herring Bay 14,251 1073 8%
Total Lower Western Shore 133,293 21,375 16%Upper Patuxent River 22,359 1767 8%Middle Patuxent 29,487 1735 6%Little Patuxent 27,972 5674 20%
Total Patuxent 79,818 9,176 11%Patapsco Tidal 30,071 9616 32%Patapsco Non-Tidal 15,177 4173 27%Bodkin Creek 6,028 833 14%
Total Patapsco/Back 51,276 14,622 29%
WatershedArea
(Acres)Impervious
Acres%
Impervious
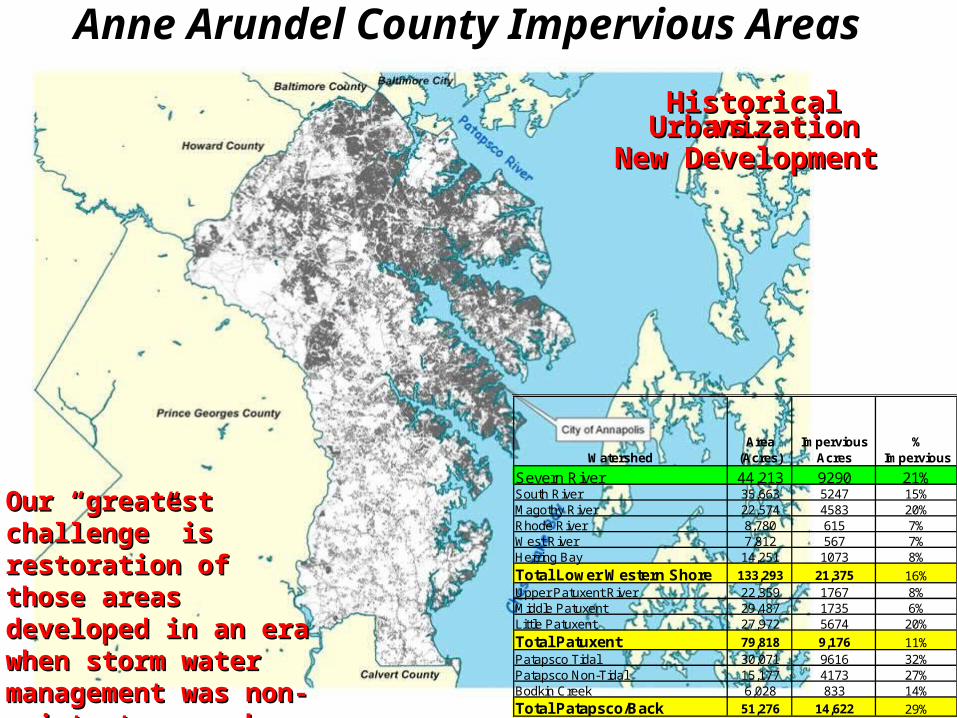
Severn River Watershed Impervious Cover
Landcover LandcoverAcres
ImperviousAcres
Impervious% of Landcover
% of TotalImpervious
Commercial(Private Lands) 1,971 1,505 76 % 16 %
Industrial(Private Lands)
506 381 75 % 4 %
Residential(Private Lands)
16,332 4,001 24 % 43 %
Gov’t Owned(Public Lands)
10,219 2,956 29 % 32 %
Other(Private Lands)
15,325 447 3 % 5 %
Total 44,353 9,290 21 % 100 %
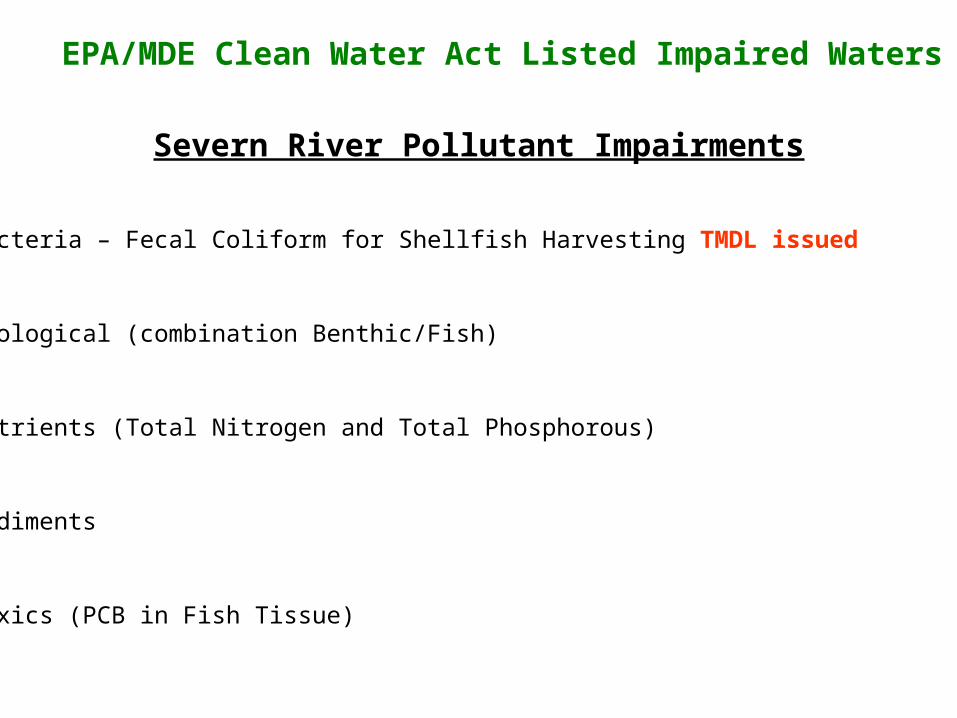
EPA/MDE Clean Water Act Listed Impaired Waters
Severn River Pollutant Impairments
• Bacteria – Fecal Coliform for Shellfish Harvesting TMDL issued
• Biological (combination Benthic/Fish)
• Nutrients (Total Nitrogen and Total Phosphorous)
• Sediments
• Toxics (PCB in Fish Tissue)
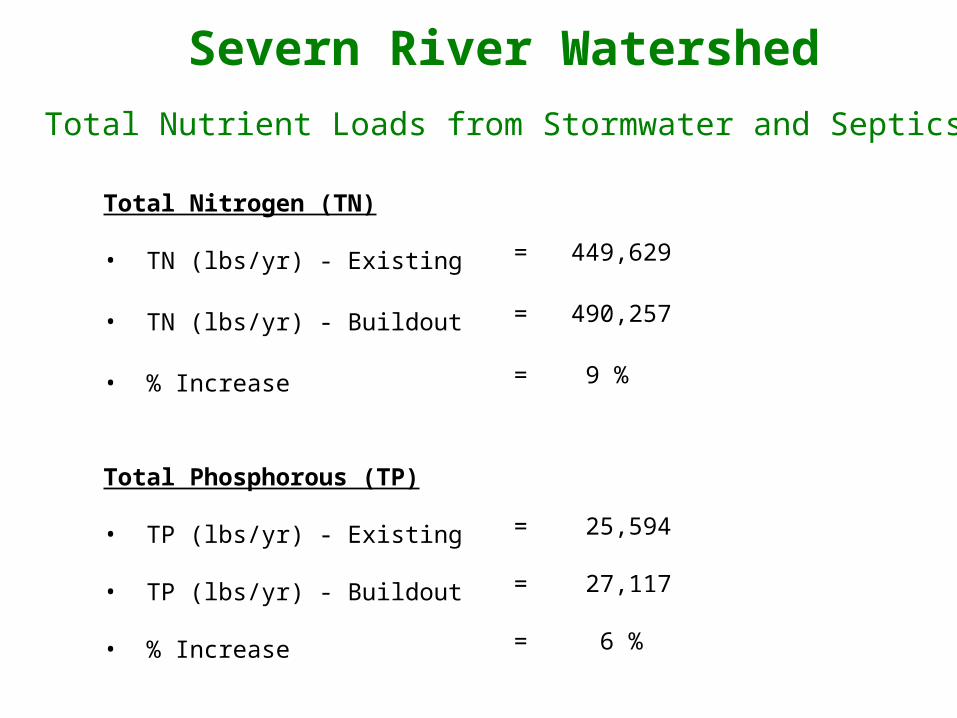
Severn River Watershed
Total Nutrient Loads from Stormwater and Septics
Total Nitrogen (TN)
• TN (lbs/yr) - Existing
• TN (lbs/yr) - Buildout
• % Increase
Total Phosphorous (TP) • TP (lbs/yr) - Existing
• TP (lbs/yr) - Buildout
• % Increase
= 449,629
= 490,257
= 9 %
= 25,594
= 27,117
= 6 %
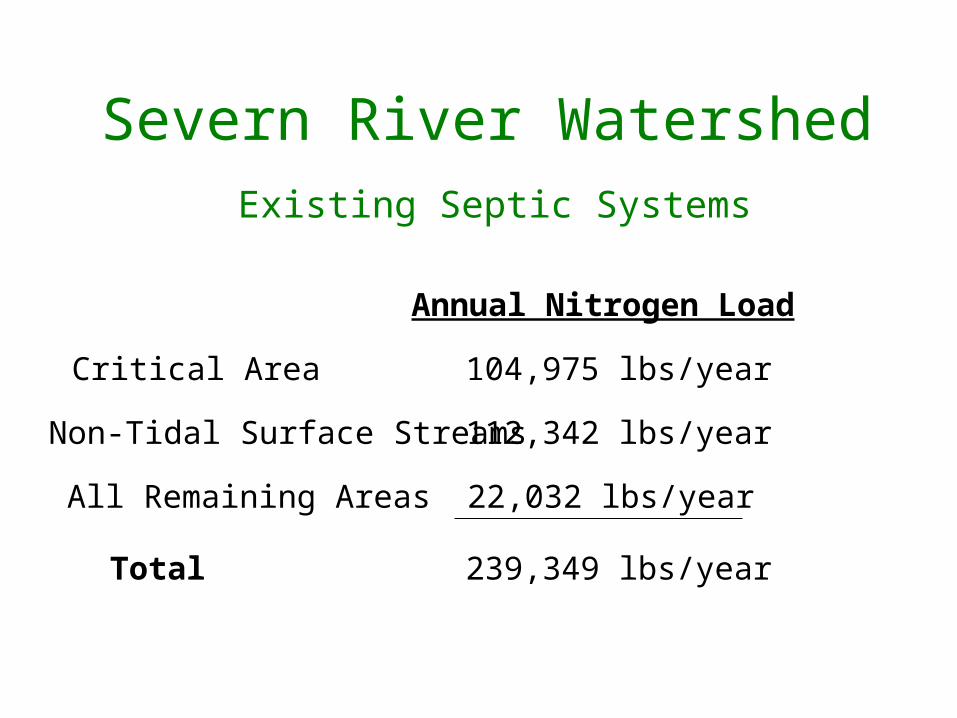
Severn River WatershedExisting Septic Systems
Annual Nitrogen Load
Critical Area 104,975 lbs/year
Non-Tidal Surface Streams 112,342 lbs/year
All Remaining Areas 22,032 lbs/year
Total 239,349 lbs/year
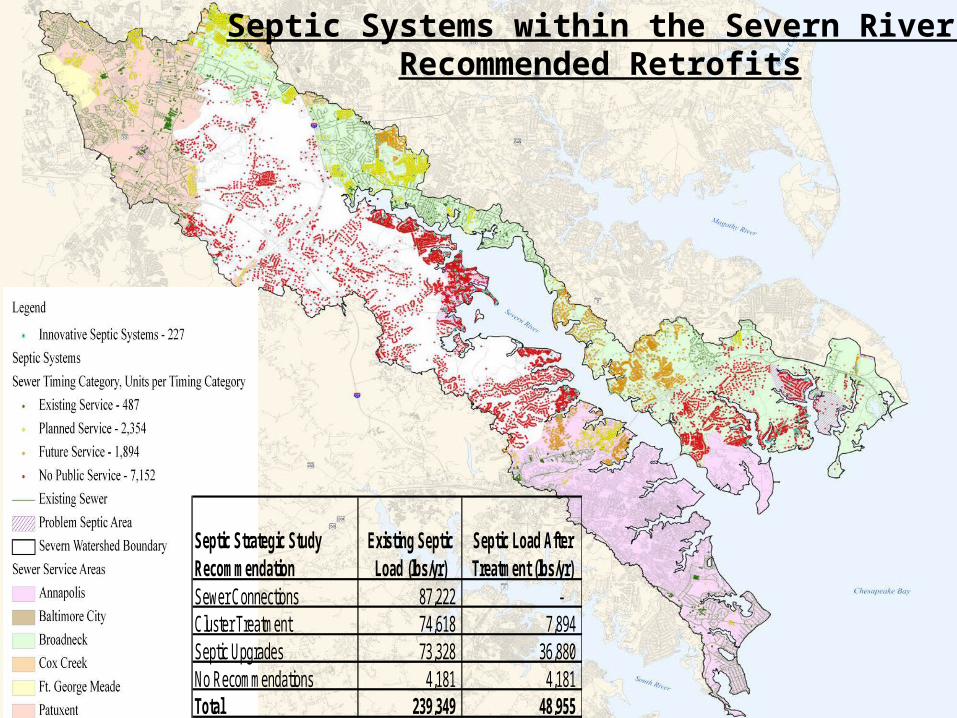
Septic Systems within the Severn River Recommended Retrofits
Sewer Connections 87,222 - Cluster Treatment 74,618 7,894 Septic Upgrades 73,328 36,880 No Recommendations 4,181 4,181 Total 239,349 48,955
Existing Septic Load (lbs/yr)
Septic Load After Treatment (lbs/yr)
Septic Strategic Study Recommendation
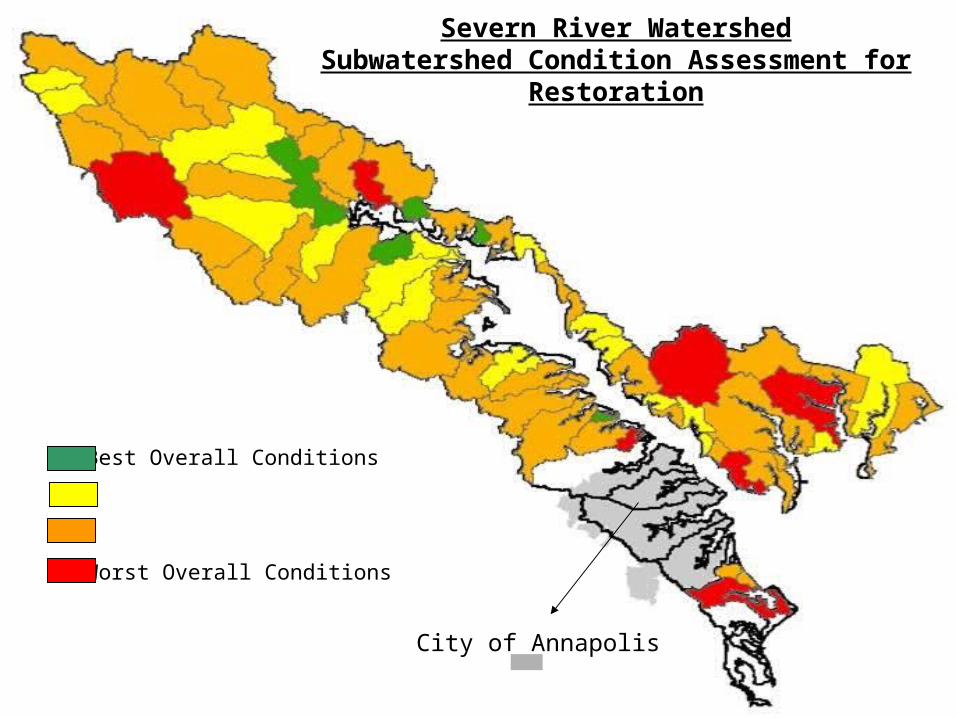
Best Overall Conditions
Worst Overall Conditions
City of Annapolis
Severn River WatershedSubwatershed Condition Assessment for Restoration
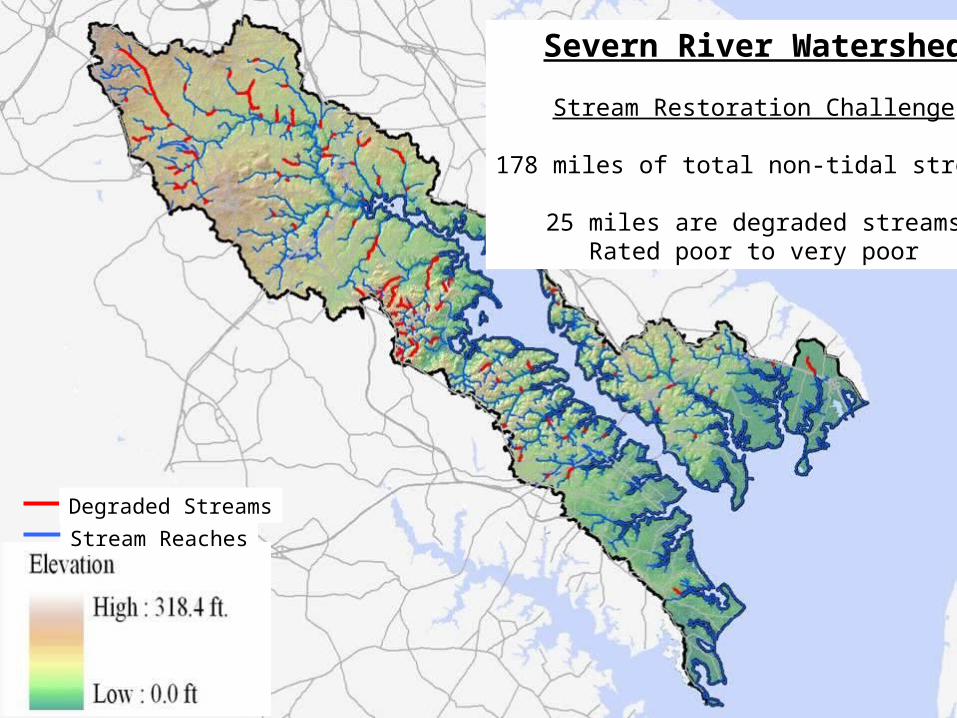
Severn River Watershed
Stream Restoration Challenge
178 miles of total non-tidal streams
25 miles are degraded streamsRated poor to very poor
Degraded Streams
Stream Reaches
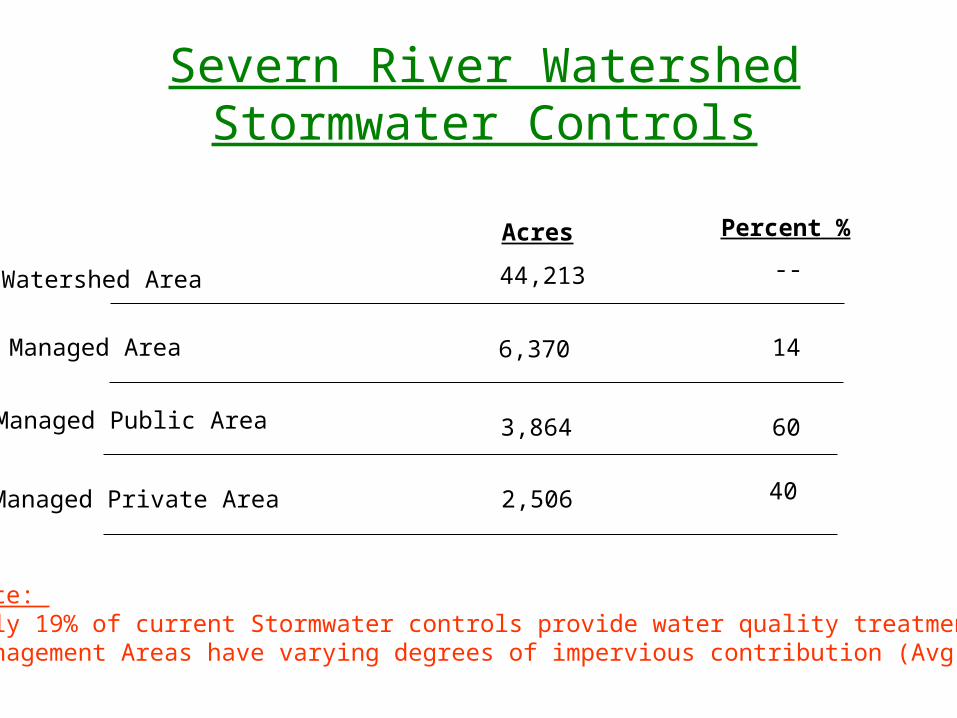
Severn River WatershedStormwater Controls
Watershed Area
Acres Percent %
44,213 --
Managed Area 6,370 14
Managed Public Area
Managed Private Area
3,864 60
2,506 40
Note: Only 19% of current Stormwater controls provide water quality treatmentManagement Areas have varying degrees of impervious contribution (Avg 21%)