Presentazione standard di PowerPoint · ( REPRESENTING FUNCTIONS: THE STEAMGRAPH. ... Presentazione...
35
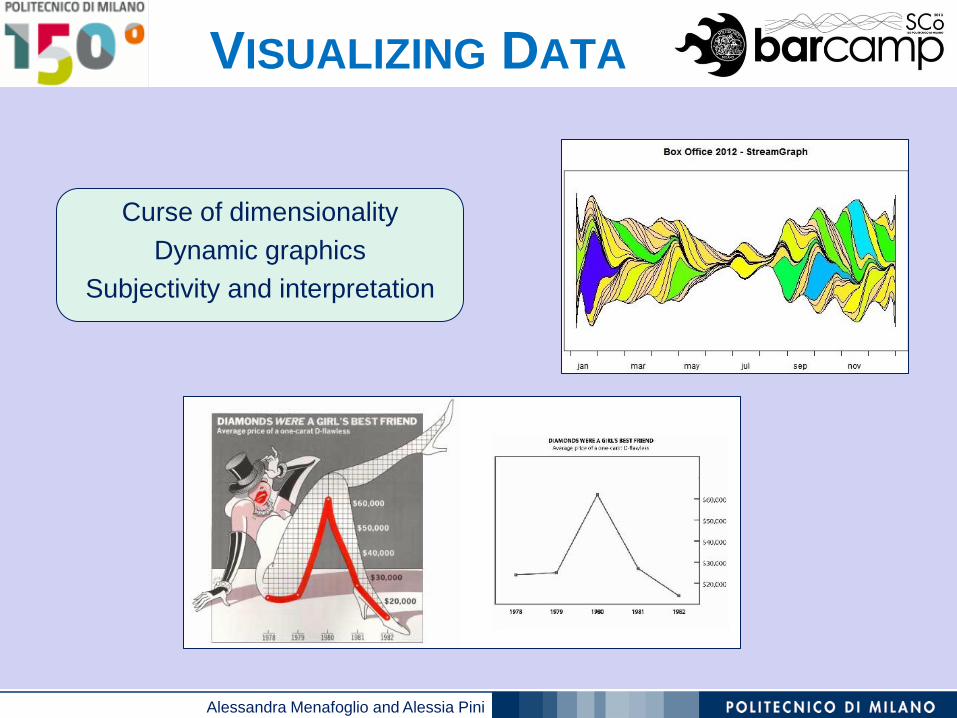
Alessandra Menafoglio and Alessia Pini Curse of dimensionality Dynamic graphics Subjectivity and interpretation VISUALIZING DATA
Transcript of Presentazione standard di PowerPoint · ( REPRESENTING FUNCTIONS: THE STEAMGRAPH. ... Presentazione...
Alessandra Menafoglio and Alessia Pini
Curse of dimensionality
Dynamic graphics
Subjectivity and interpretation
VISUALIZING DATA
Alessandra Menafoglio and Alessia Pini
PROBLEM 1: REPRESENTING HIGH-
DIMENSIONAL DATA IN TWO DIMENSIONS. THE
PROBLEM OF BIASED REPRESENTATIONS OF
HIGH-DIMENSIONAL DATA
“Do not disturb my circles.” — Archimedes of Syracuse (287–212 BC), last words
Alessandra Menafoglio and Alessia Pini
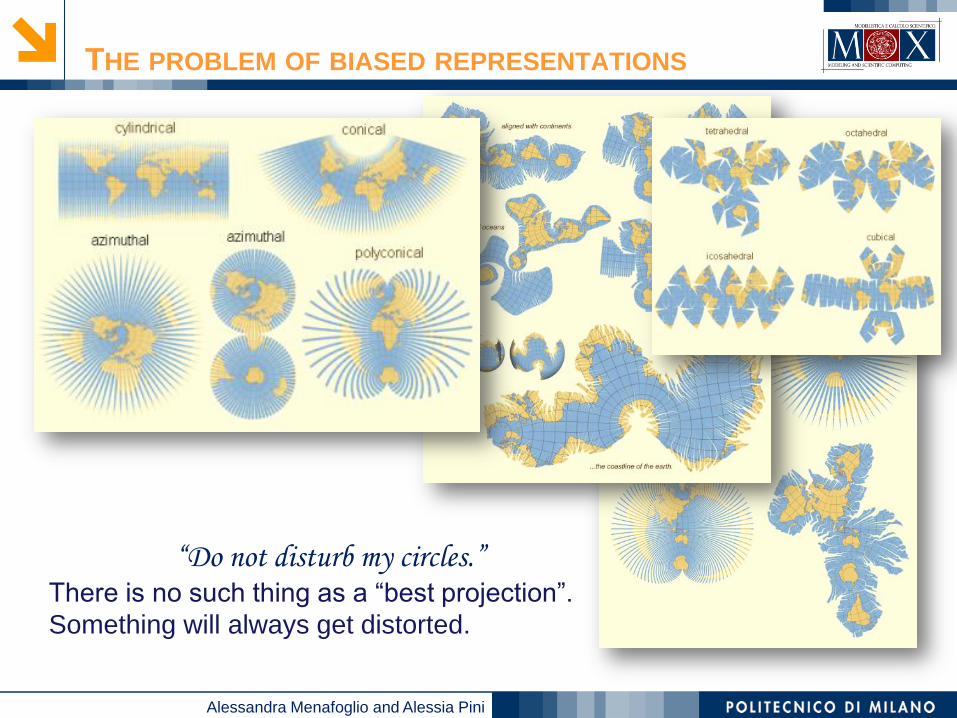
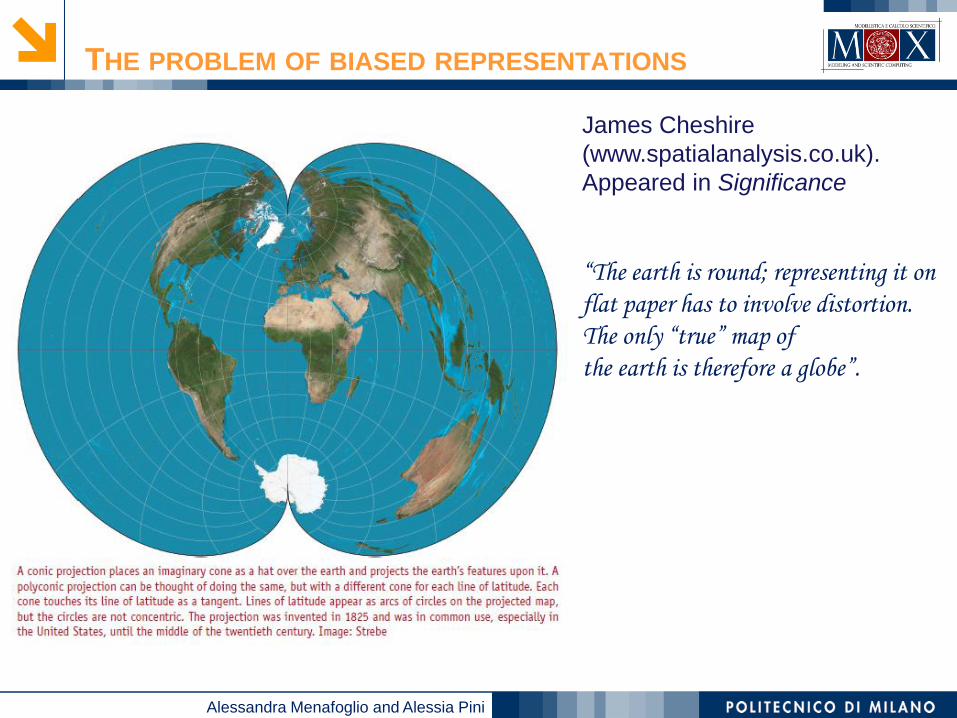
THE PROBLEM OF BIASED REPRESENTATIONS
“Do not disturb my circles.” There is no such thing as a “best projection”.
Something will always get distorted.
Alessandra Menafoglio and Alessia Pini
THE PROBLEM OF BIASED REPRESENTATIONS
James Cheshire
(www.spatialanalysis.co.uk).
Appeared in Significance
“The earth is round; representing it on
flat paper has to involve distortion.
The only “true” map of
the earth is therefore a globe”.
Alessandra Menafoglio and Alessia Pini
THE PROBLEM OF BIASED REPRESENTATIONS
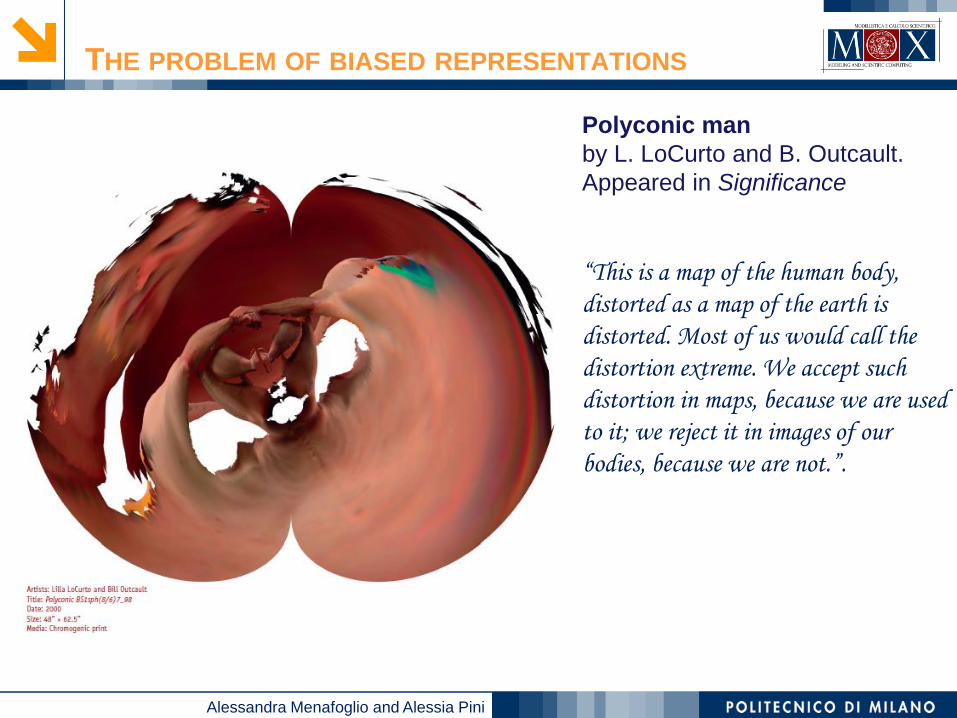
Polyconic man
by L. LoCurto and B. Outcault.
Appeared in Significance
“This is a map of the human body,
distorted as a map of the earth is
distorted. Most of us would call the
distortion extreme. We accept such
distortion in maps, because we are used
to it; we reject it in images of our
bodies, because we are not.”.
Alessandra Menafoglio and Alessia Pini
REPRESENTING FUNCTIONS: THE STEAMGRAPH
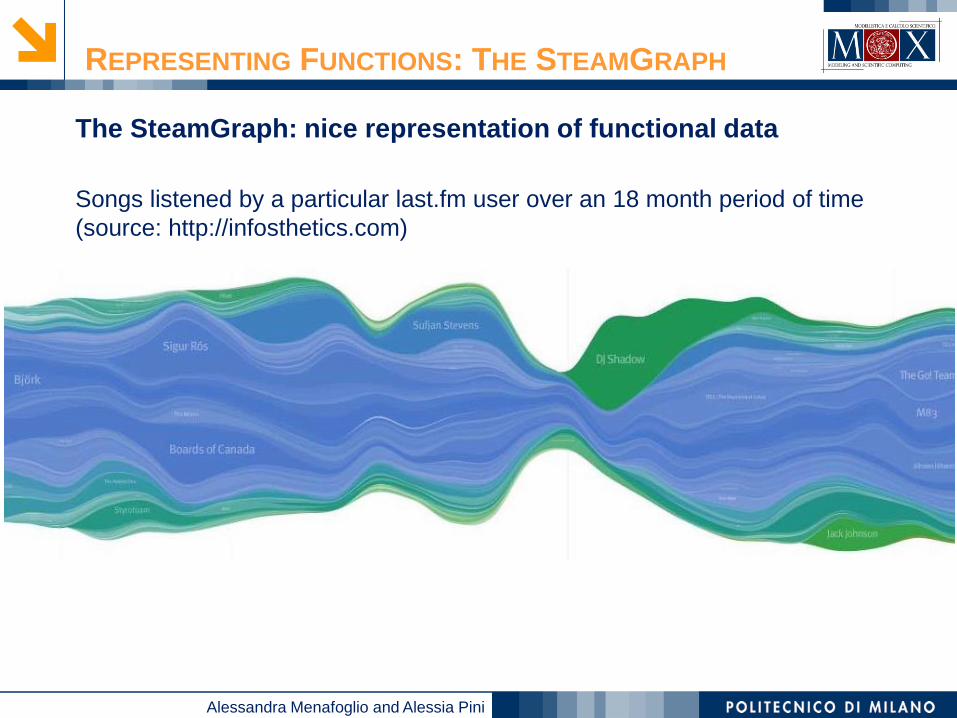
The SteamGraph: nice representation of functional data
Songs listened by a particular last.fm user over an 18 month period of time
(source: http://infosthetics.com)
Alessandra Menafoglio and Alessia Pini
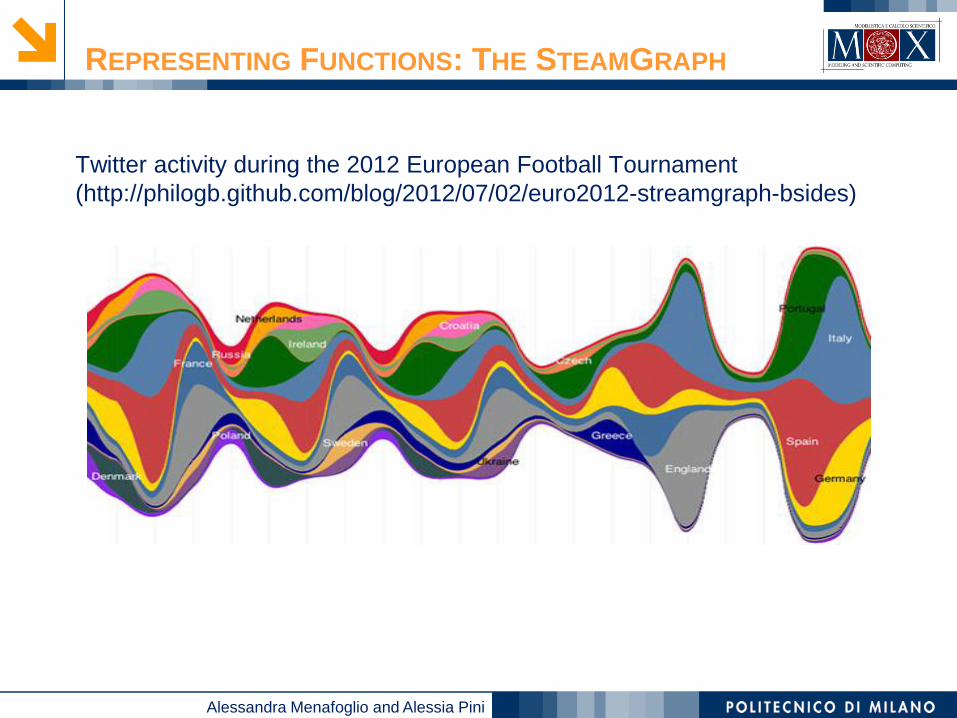
Twitter activity during the 2012 European Football Tournament
(http://philogb.github.com/blog/2012/07/02/euro2012-streamgraph-bsides)
REPRESENTING FUNCTIONS: THE STEAMGRAPH
Alessandra Menafoglio and Alessia Pini
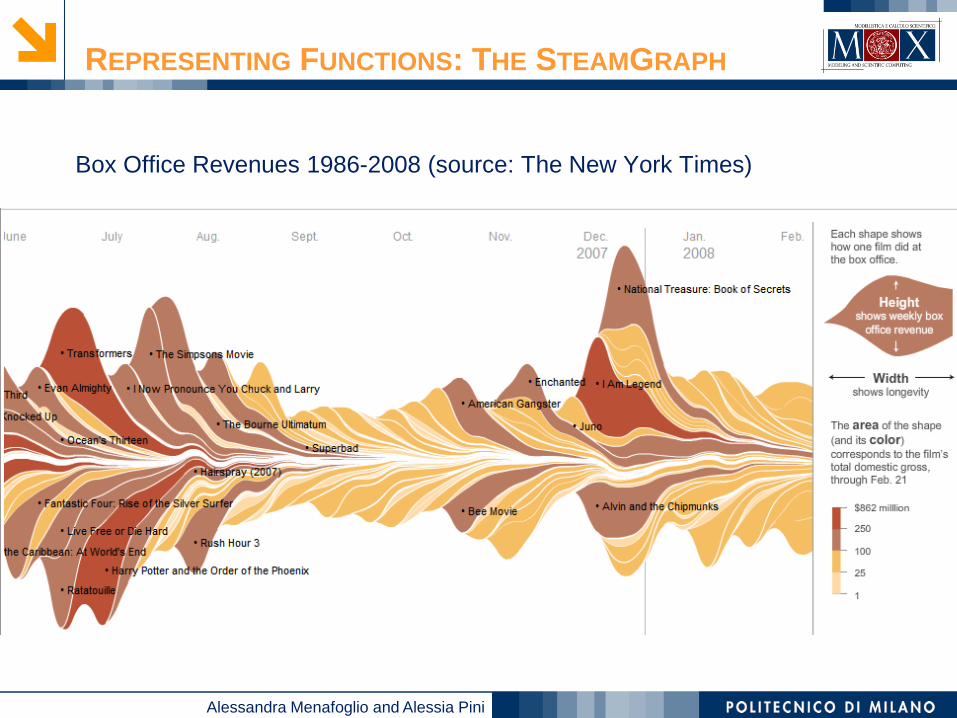
Box Office Revenues 1986-2008 (source: The New York Times)
REPRESENTING FUNCTIONS: THE STEAMGRAPH
Alessandra Menafoglio and Alessia Pini
REPRESENTING FUNCTIONS: THE STEAMGRAPH
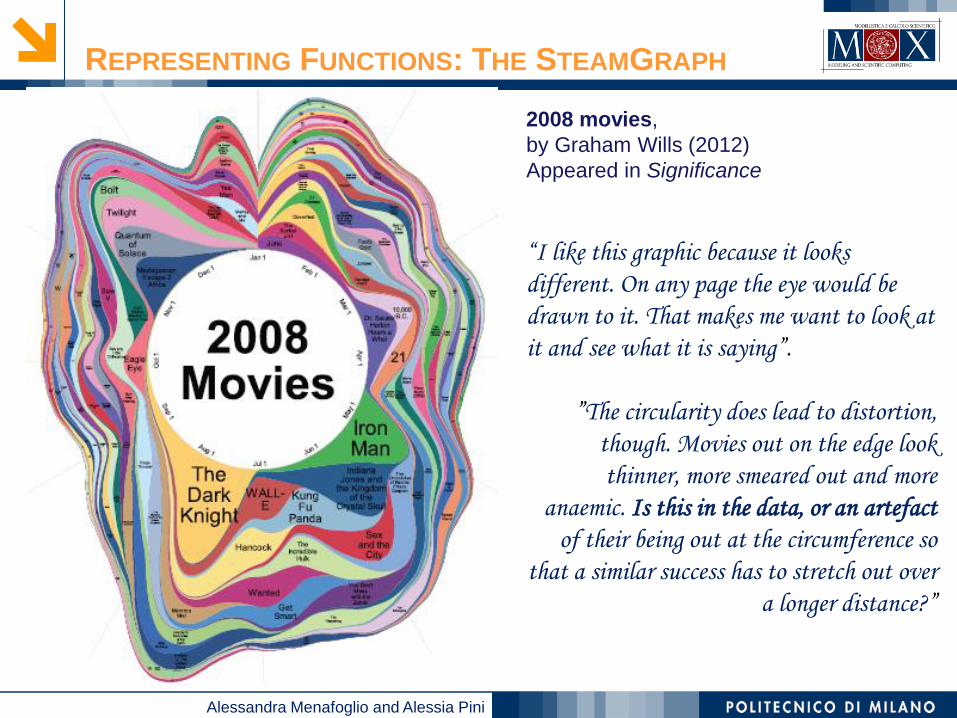
2008 movies,
by Graham Wills (2012)
Appeared in Significance
“I like this graphic because it looks
different. On any page the eye would be
drawn to it. That makes me want to look at
it and see what it is saying”.
”The circularity does lead to distortion,
though. Movies out on the edge look
thinner, more smeared out and more
anaemic. Is this in the data, or an artefact
of their being out at the circumference so
that a similar success has to stretch out over
a longer distance?”
Alessandra Menafoglio and Alessia Pini
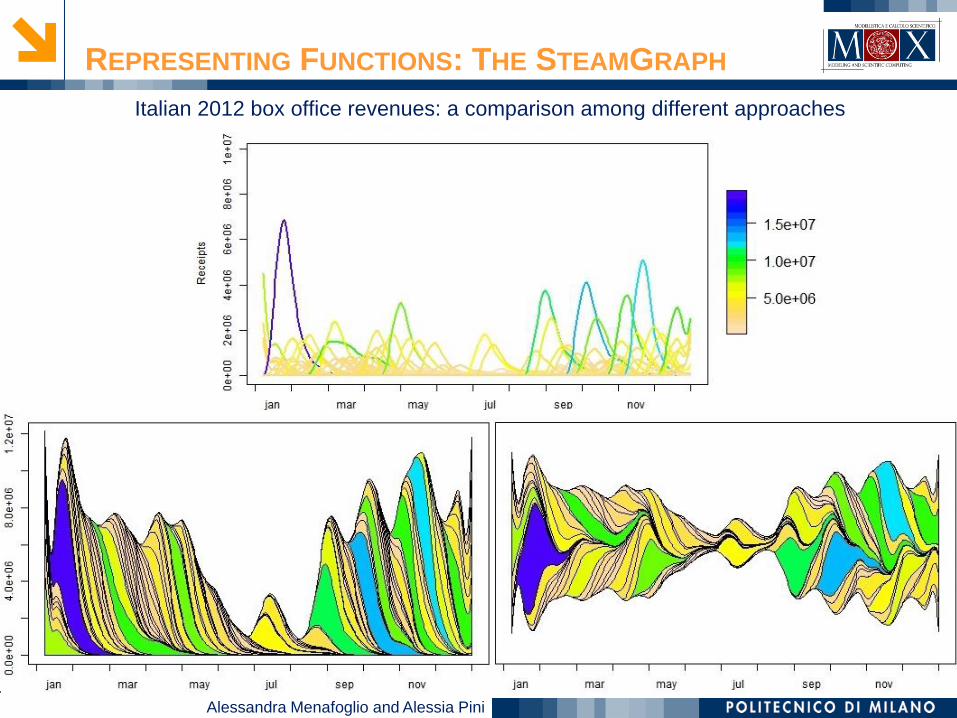
Italian 2012 box office revenues: a comparison among different approaches
REPRESENTING FUNCTIONS: THE STEAMGRAPH
Alessandra Menafoglio and Alessia Pini
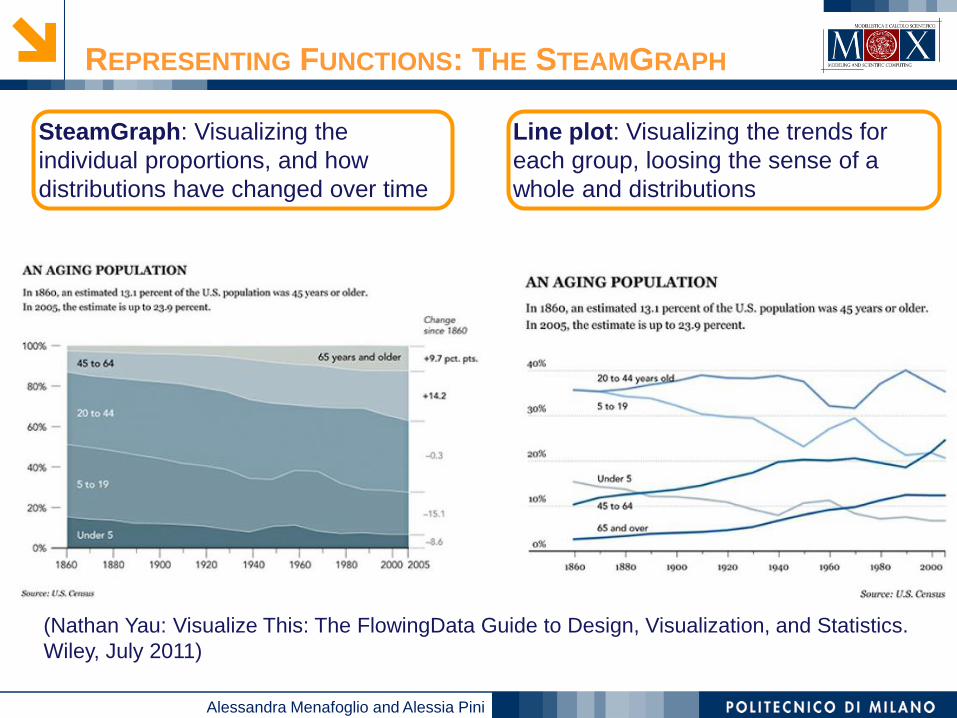
Line plot: Visualizing the trends for
each group, loosing the sense of a
whole and distributions
SteamGraph: Visualizing the
individual proportions, and how
distributions have changed over time
(Nathan Yau: Visualize This: The FlowingData Guide to Design, Visualization, and Statistics.
Wiley, July 2011)
REPRESENTING FUNCTIONS: THE STEAMGRAPH
Alessandra Menafoglio and Alessia Pini
PROBLEM 2: HOW TO EFFECTIVELY
REPRESENT COMPLEX AND BIG DATA?
“By revealing patterns in data, we create meaning, we welcome connections, we evoke
the encoding channels of symmetry and color, and we tap the visceral mechanics of
memory.”
Alessandra Menafoglio and Alessia Pini
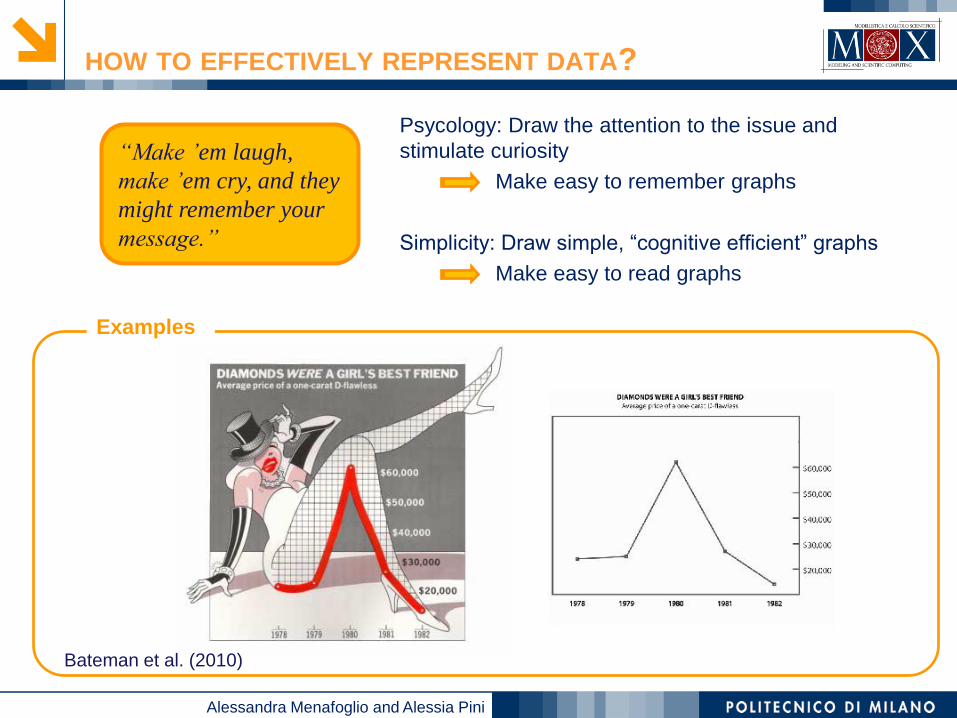
HOW TO EFFECTIVELY REPRESENT DATA?
Psycology: Draw the attention to the issue and
stimulate curiosity
Make easy to remember graphs
Simplicity: Draw simple, “cognitive efficient” graphs
Make easy to read graphs
“Make ’em laugh,
make ’em cry, and they
might remember your
message.”
Examples
Bateman et al. (2010)
Alessandra Menafoglio and Alessia Pini
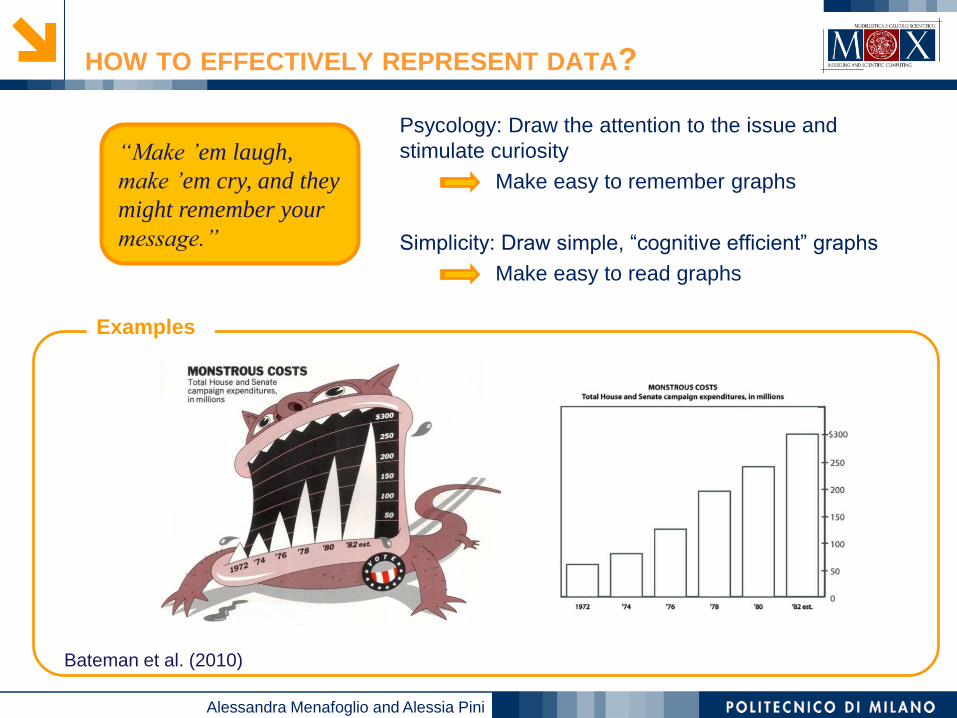
HOW TO EFFECTIVELY REPRESENT DATA?
Psycology: Draw the attention to the issue and
stimulate curiosity
Make easy to remember graphs
Simplicity: Draw simple, “cognitive efficient” graphs
Make easy to read graphs
“Make ’em laugh,
make ’em cry, and they
might remember your
message.”
Examples
Bateman et al. (2010)
Alessandra Menafoglio and Alessia Pini
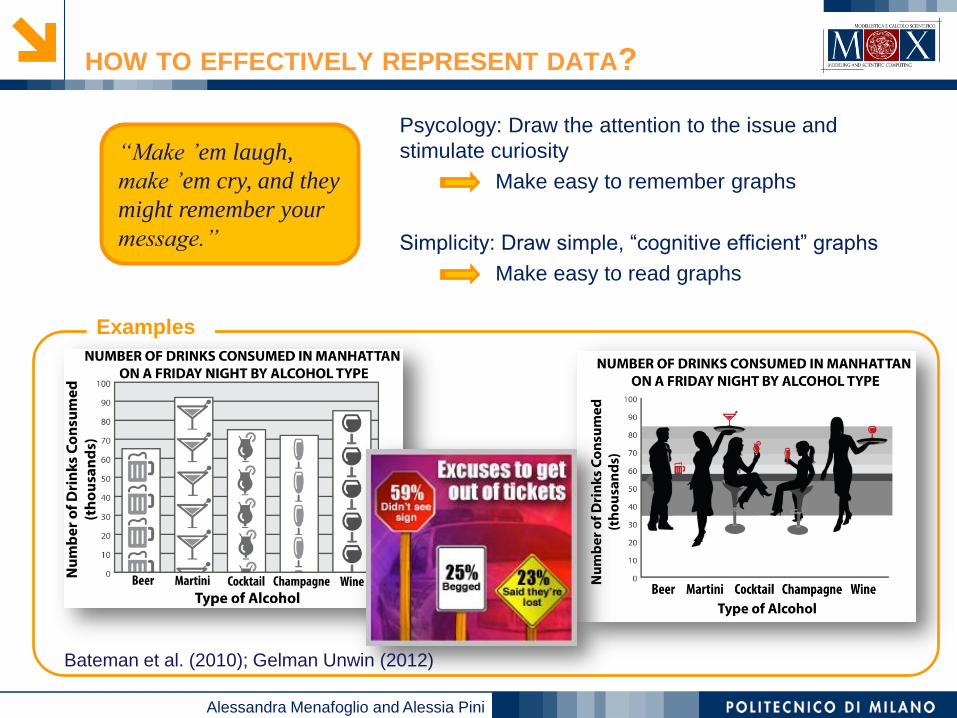
HOW TO EFFECTIVELY REPRESENT DATA?
Psycology: Draw the attention to the issue and
stimulate curiosity
Make easy to remember graphs
Simplicity: Draw simple, “cognitive efficient” graphs
Make easy to read graphs
Examples
“Make ’em laugh,
make ’em cry, and they
might remember your
message.”
Bateman et al. (2010); Gelman Unwin (2012)
Alessandra Menafoglio and Alessia Pini
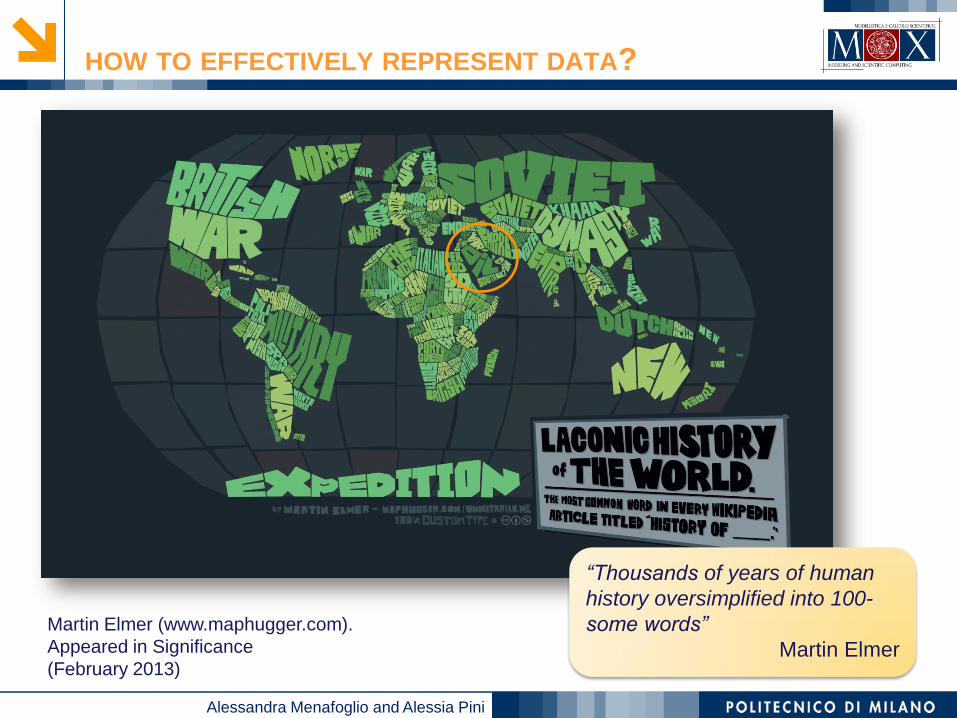
HOW TO EFFECTIVELY REPRESENT DATA?
“Thousands of years of human
history oversimplified into 100-
some words”
Martin Elmer
Martin Elmer (www.maphugger.com).
Appeared in Significance
(February 2013)
Alessandra Menafoglio and Alessia Pini
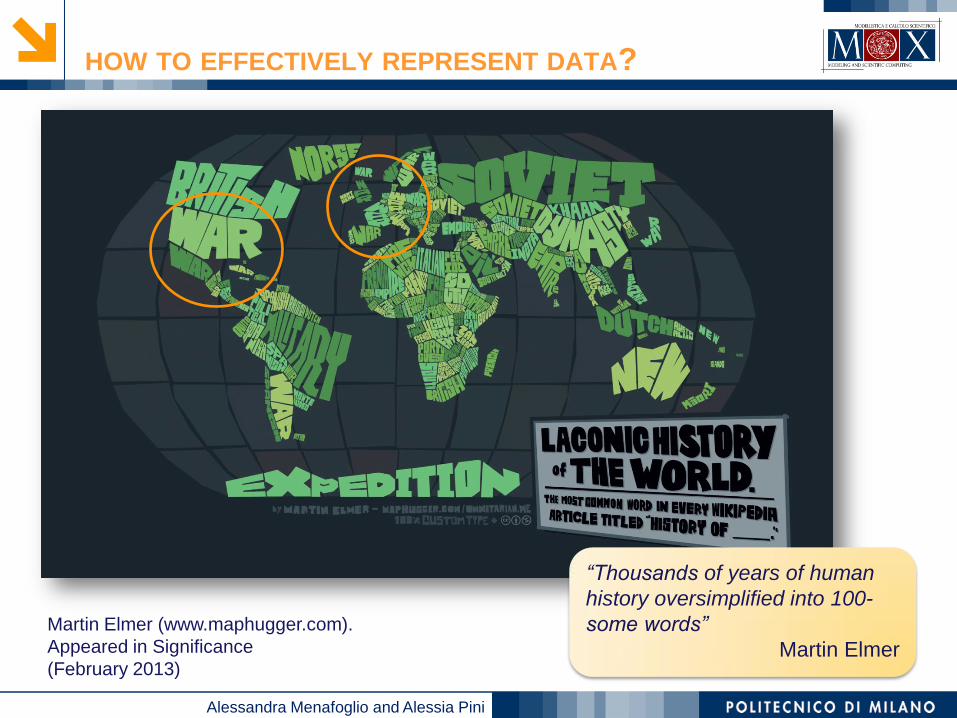
HOW TO EFFECTIVELY REPRESENT DATA?
“Thousands of years of human
history oversimplified into 100-
some words”
Martin Elmer
Martin Elmer (www.maphugger.com).
Appeared in Significance
(February 2013)
Alessandra Menafoglio and Alessia Pini
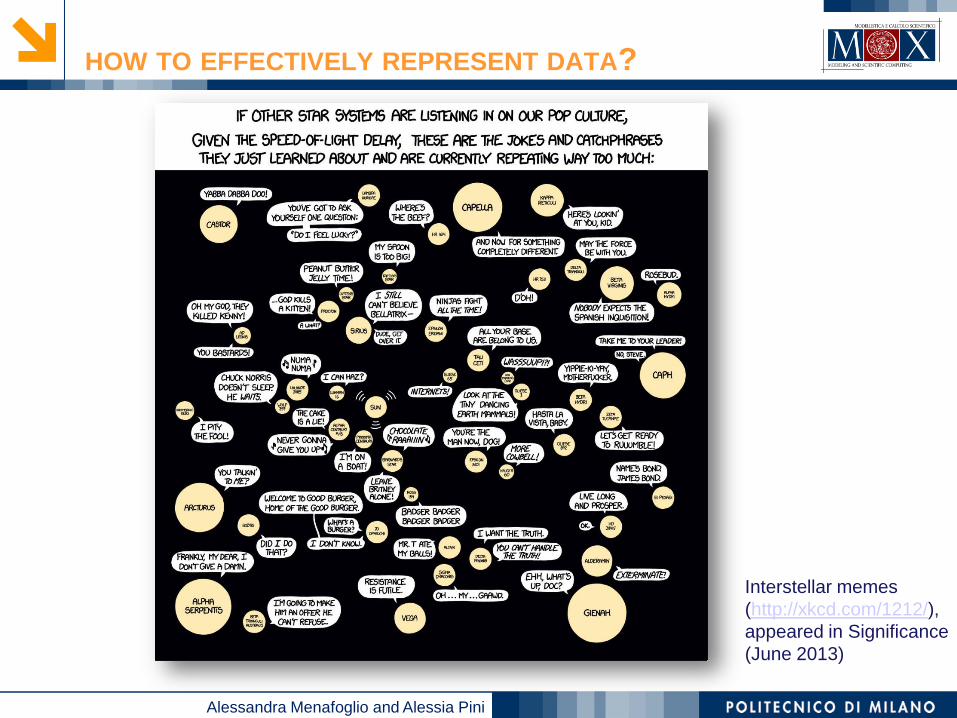
HOW TO EFFECTIVELY REPRESENT DATA?
Interstellar memes
(http://xkcd.com/1212/),
appeared in Significance
(June 2013)
Alessandra Menafoglio and Alessia Pini
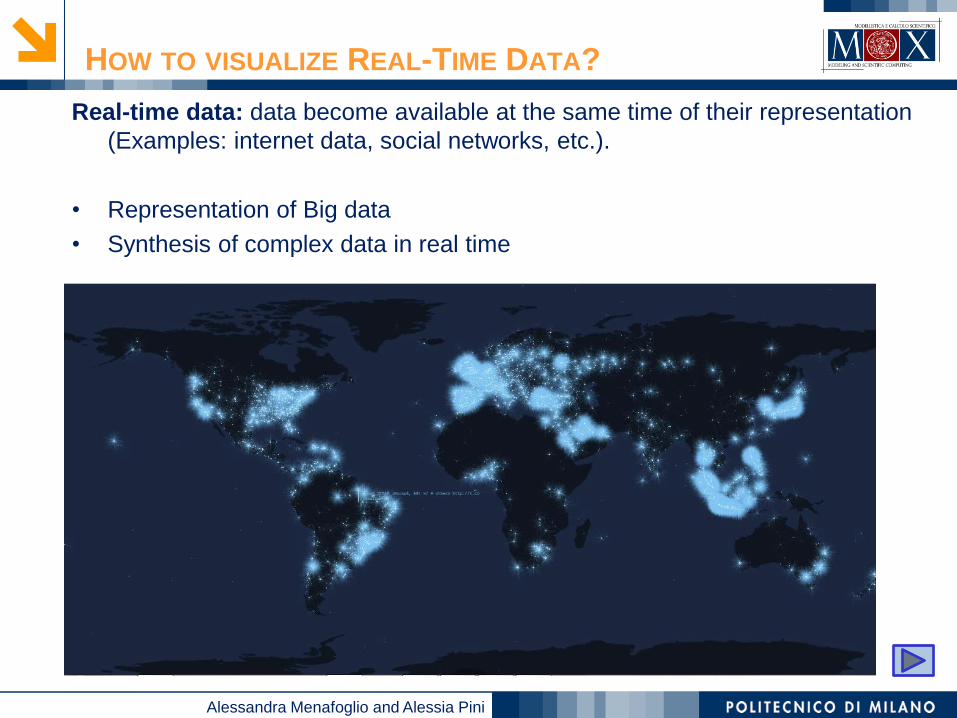
HOW TO VISUALIZE REAL-TIME DATA?
Real-time data: data become available at the same time of their representation
(Examples: internet data, social networks, etc.).
• Representation of Big data
• Synthesis of complex data in real time
Alessandra Menafoglio and Alessia Pini
HOW TO VISUALIZE REAL-TIME DATA?
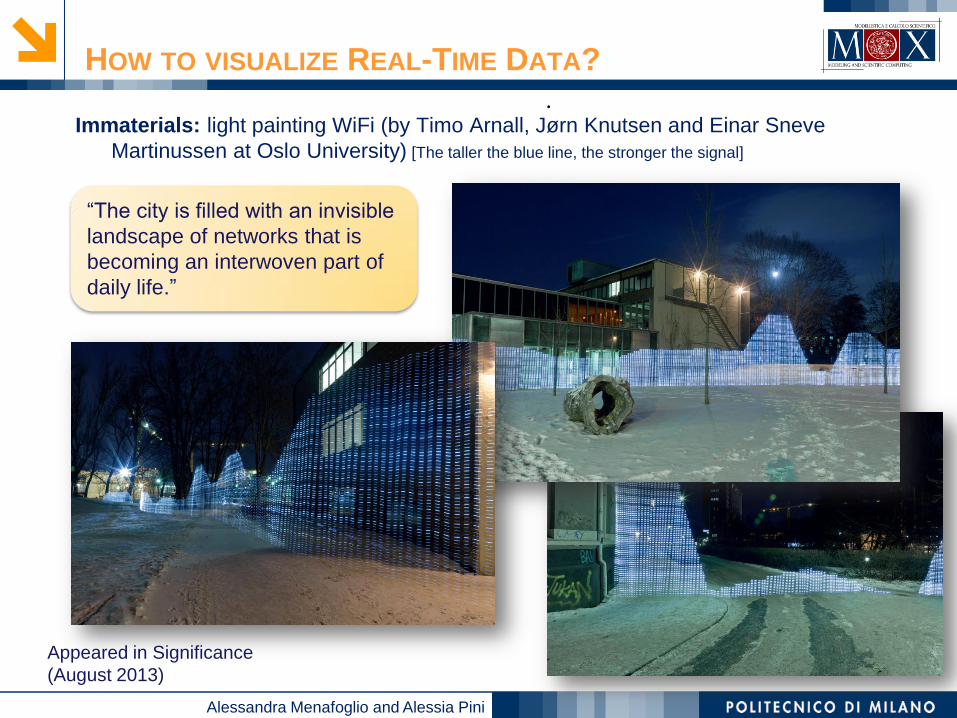
Immaterials: light painting WiFi (by Timo Arnall, Jørn Knutsen and Einar Sneve
Martinussen at Oslo University) [The taller the blue line, the stronger the signal]
Appeared in Significance
(August 2013)
“The city is filled with an invisible
landscape of networks that is
becoming an interwoven part of
daily life.”
.
Alessandra Menafoglio and Alessia Pini
HOW TO VISUALIZE REAL-TIME DATA?
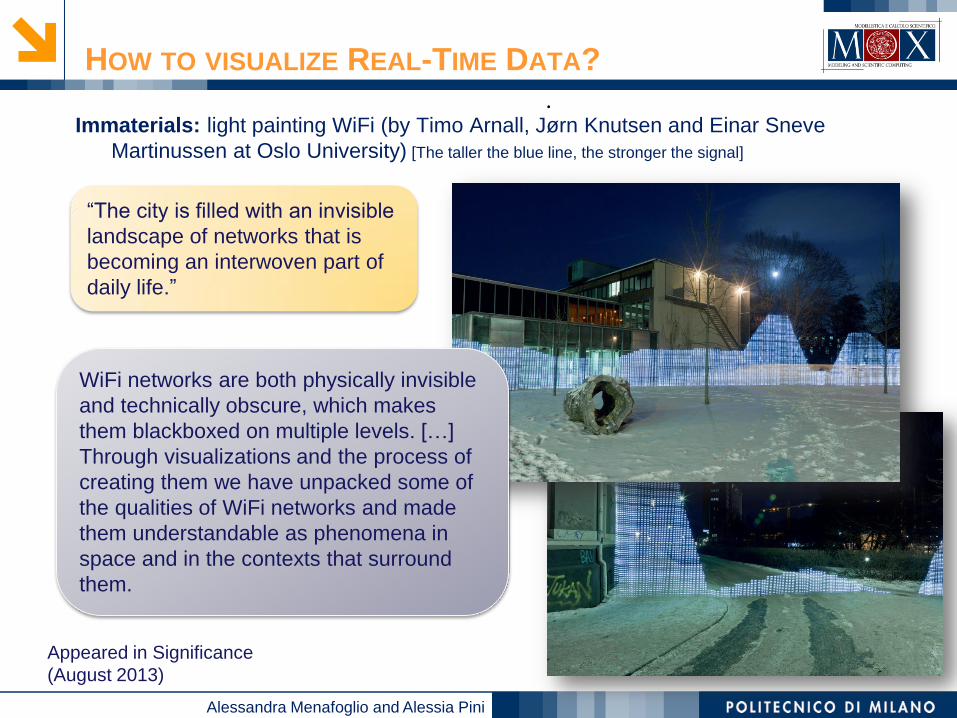
Immaterials: light painting WiFi (by Timo Arnall, Jørn Knutsen and Einar Sneve
Martinussen at Oslo University) [The taller the blue line, the stronger the signal]
Appeared in Significance
(August 2013)
“The city is filled with an invisible
landscape of networks that is
becoming an interwoven part of
daily life.”
.
WiFi networks are both physically invisible
and technically obscure, which makes
them blackboxed on multiple levels. […]
Through visualizations and the process of
creating them we have unpacked some of
the qualities of WiFi networks and made
them understandable as phenomena in
space and in the contexts that surround
them.
Alessandra Menafoglio and Alessia Pini
PROBLEM 3: HOW TO REPRESENT DYNAMICS
THROUGH STATIC GRAPHICS?
eARTICLE: A SOLUTION TO REPRESENT
COMPLEX DATA?
Alessandra Menafoglio and Alessia Pini
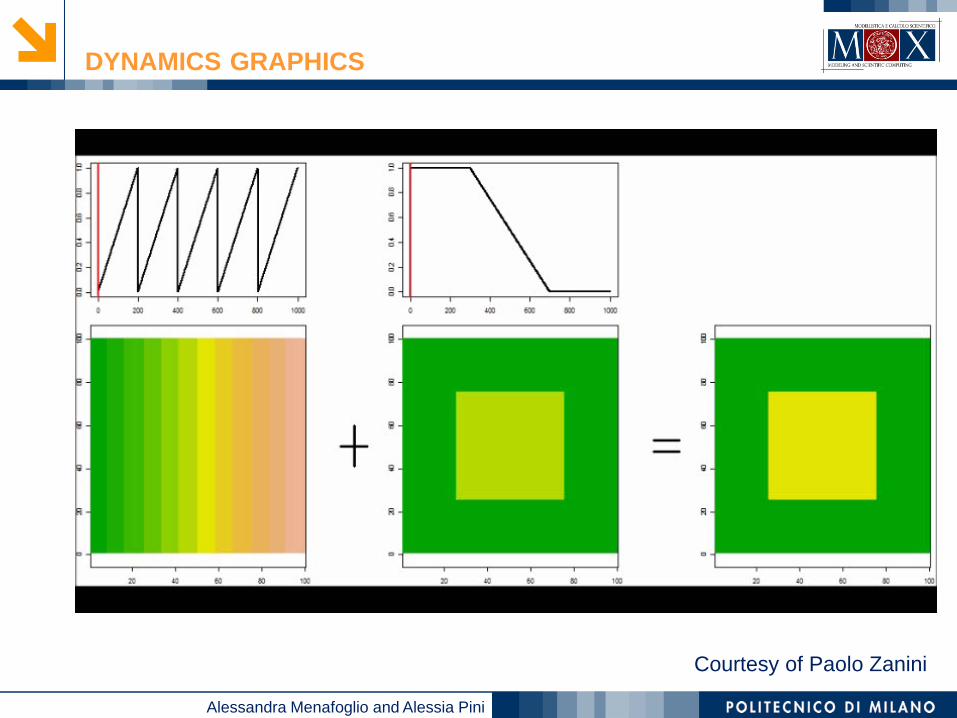
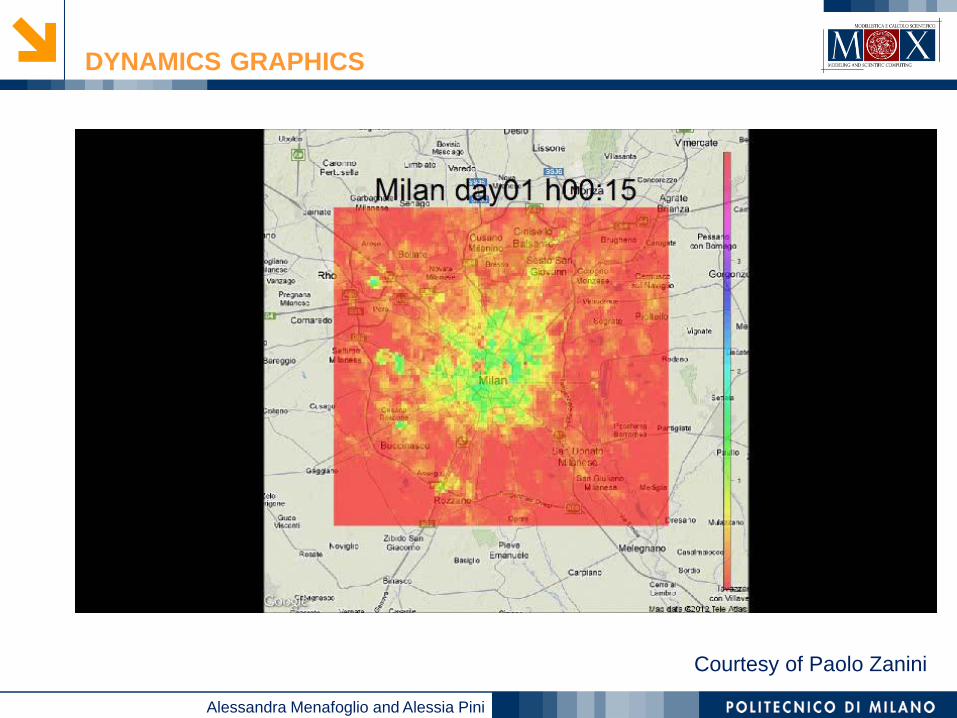
DYNAMICS GRAPHICS
Courtesy of Paolo Zanini
Alessandra Menafoglio and Alessia Pini
DYNAMICS GRAPHICS
Courtesy of Paolo Zanini
Alessandra Menafoglio and Alessia Pini
PROBLEM 4: VISUALIZING DATA: AN
OBJECTIVE OR SUBJECTIVE ISSUE? WHICH ETHIC
RULES VISUALIZERS SHOULD FOLLOW?
“Sometimes I think that the only way objective data can be displayed effectively is
with a subjective interpretation.”
“Visualization is merely another tool of communication, and it doesn’t mean
it’s going to be the only pathway to truth. We like to think that our data is empirical,
but much of it is open to interpretation.”
Alessandra Menafoglio and Alessia Pini
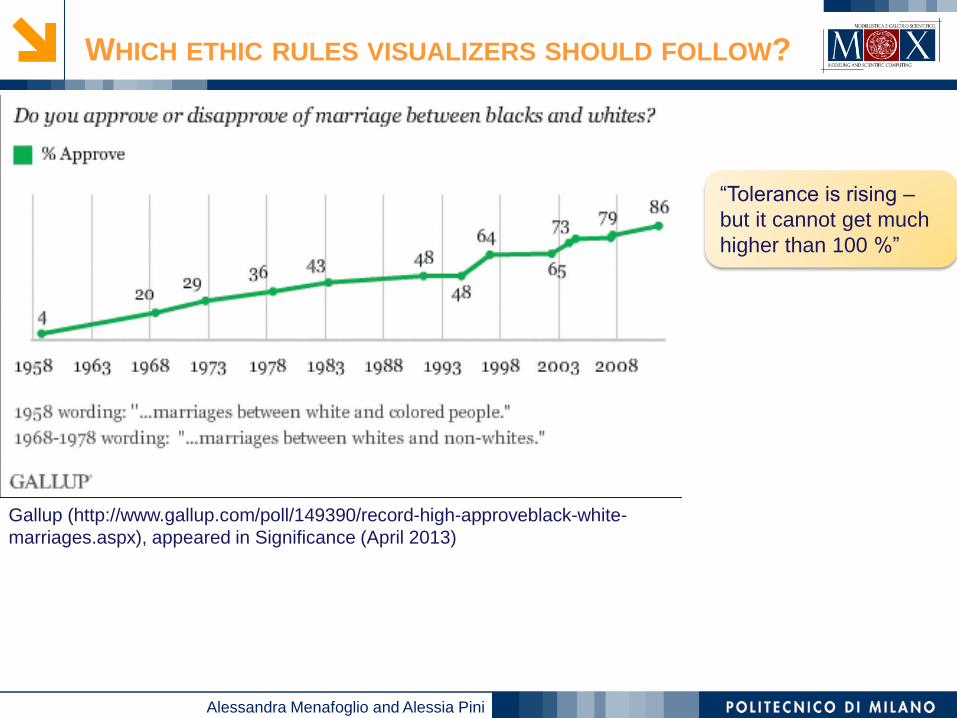
WHICH ETHIC RULES VISUALIZERS SHOULD FOLLOW?
“Tolerance is rising –
but it cannot get much
higher than 100 %”
Gallup (http://www.gallup.com/poll/149390/record-high-approveblack-white-
marriages.aspx), appeared in Significance (April 2013)
Alessandra Menafoglio and Alessia Pini
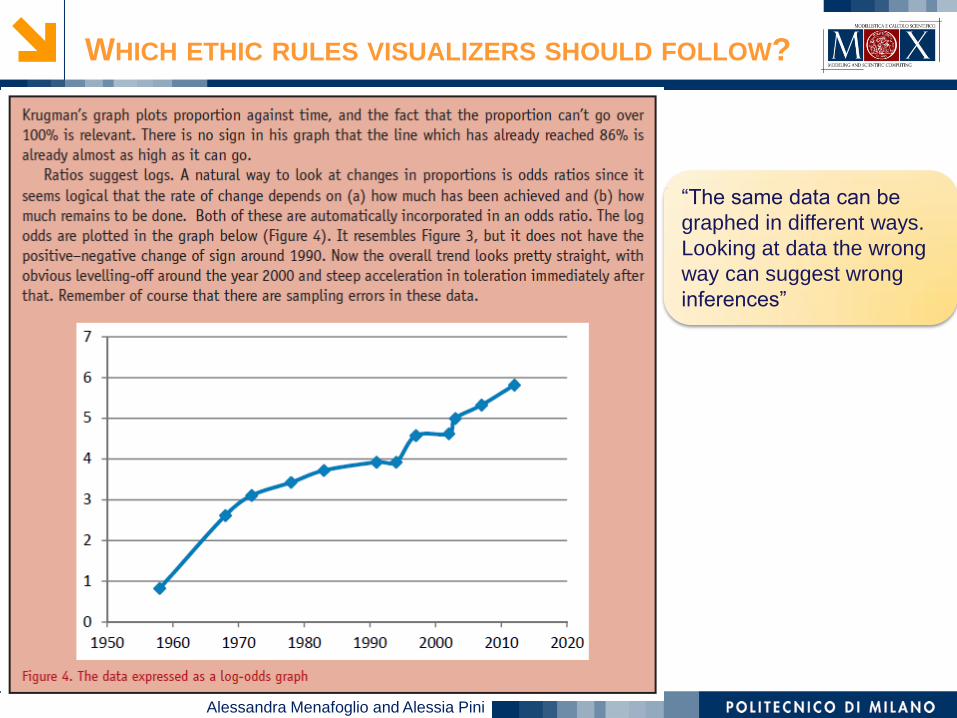
WHICH ETHIC RULES VISUALIZERS SHOULD FOLLOW?
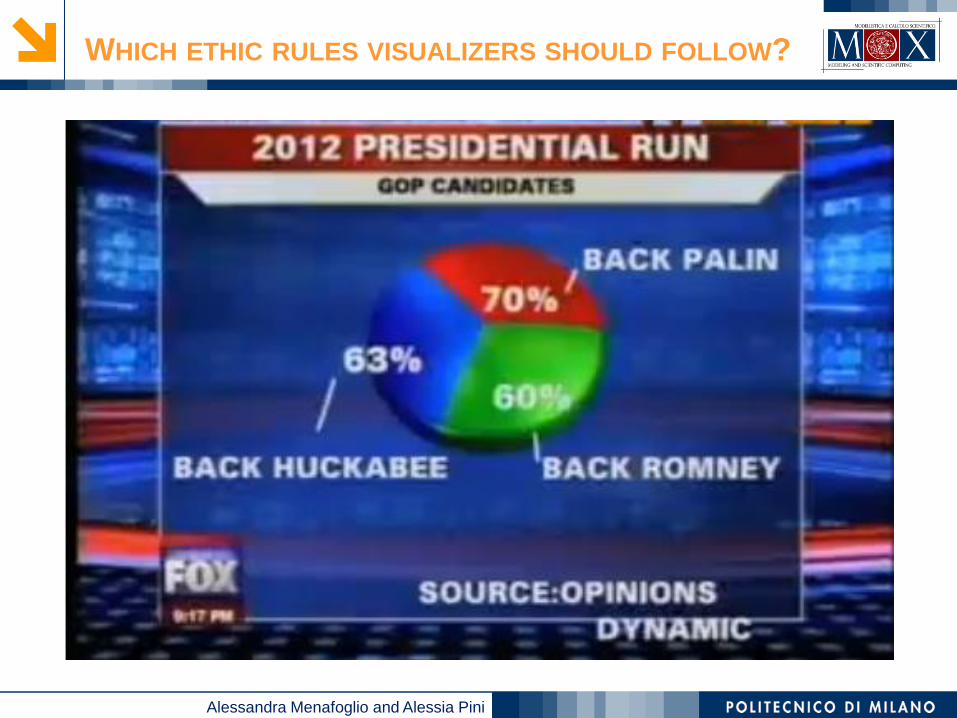
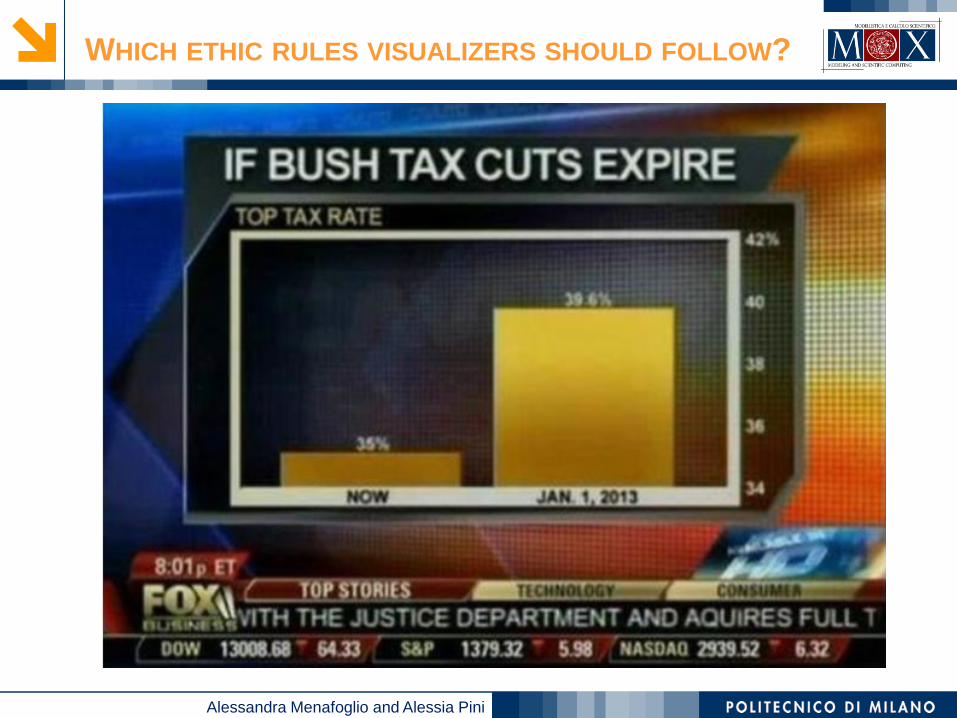
“The same data can be
graphed in different ways.
Looking at data the wrong
way can suggest wrong
inferences”
Alessandra Menafoglio and Alessia Pini
WHICH ETHIC RULES VISUALIZERS SHOULD FOLLOW?
Alessandra Menafoglio and Alessia Pini
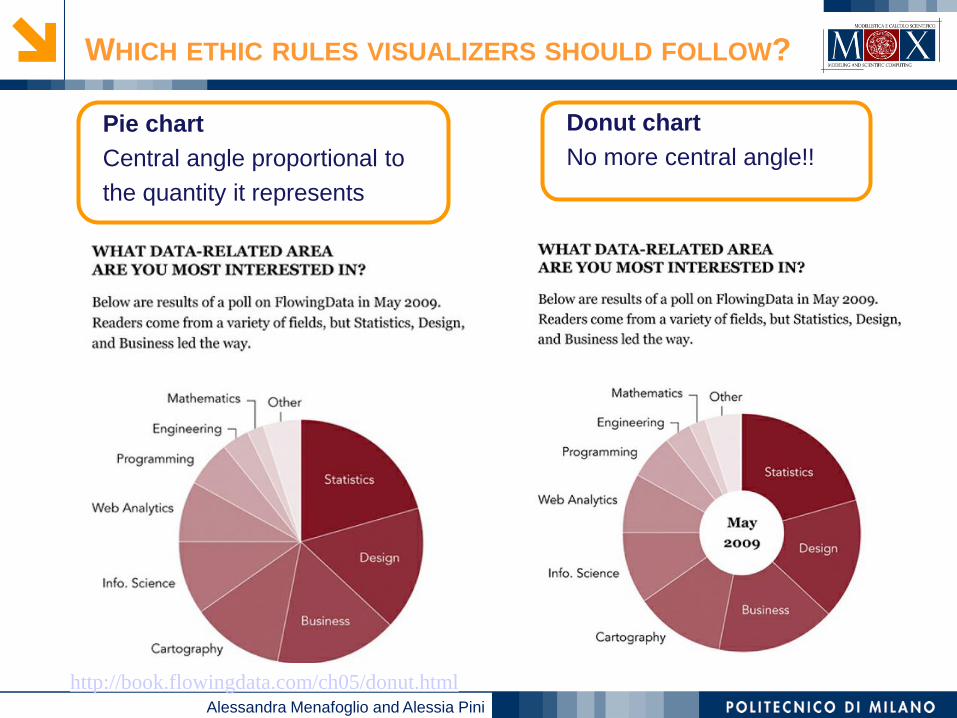
http://book.flowingdata.com/ch05/donut.html
WHICH ETHIC RULES VISUALIZERS SHOULD FOLLOW?
Pie chart
Central angle proportional to
the quantity it represents
Donut chart
No more central angle!!
Alessandra Menafoglio and Alessia Pini
WHICH ETHIC RULES VISUALIZERS SHOULD FOLLOW?
Alessandra Menafoglio and Alessia Pini
WHICH ETHIC RULES VISUALIZERS SHOULD FOLLOW?
Alessandra Menafoglio and Alessia Pini
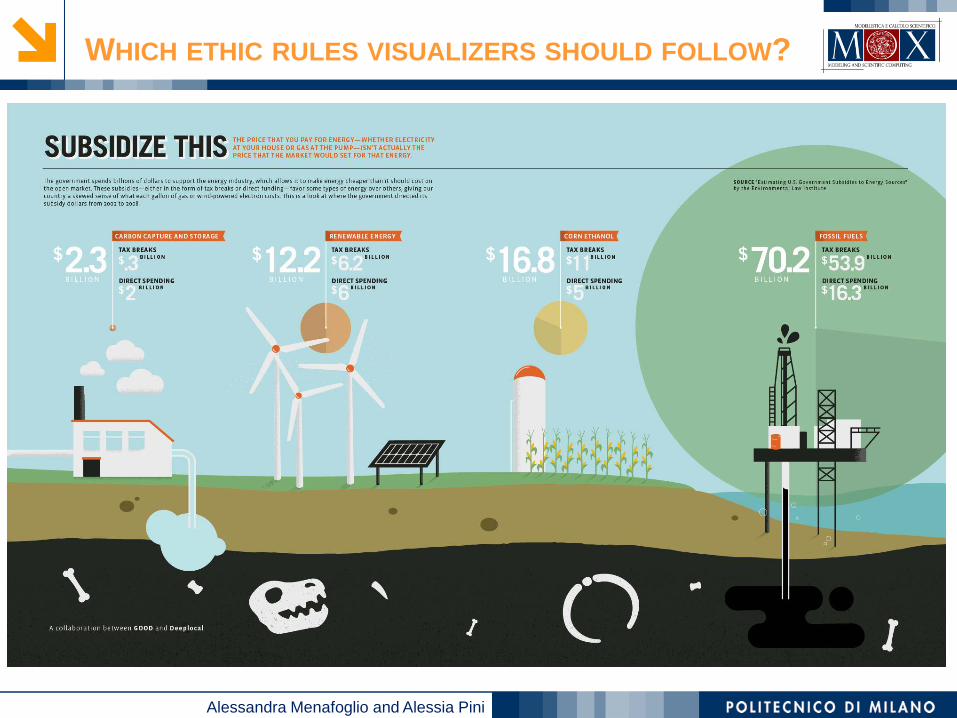
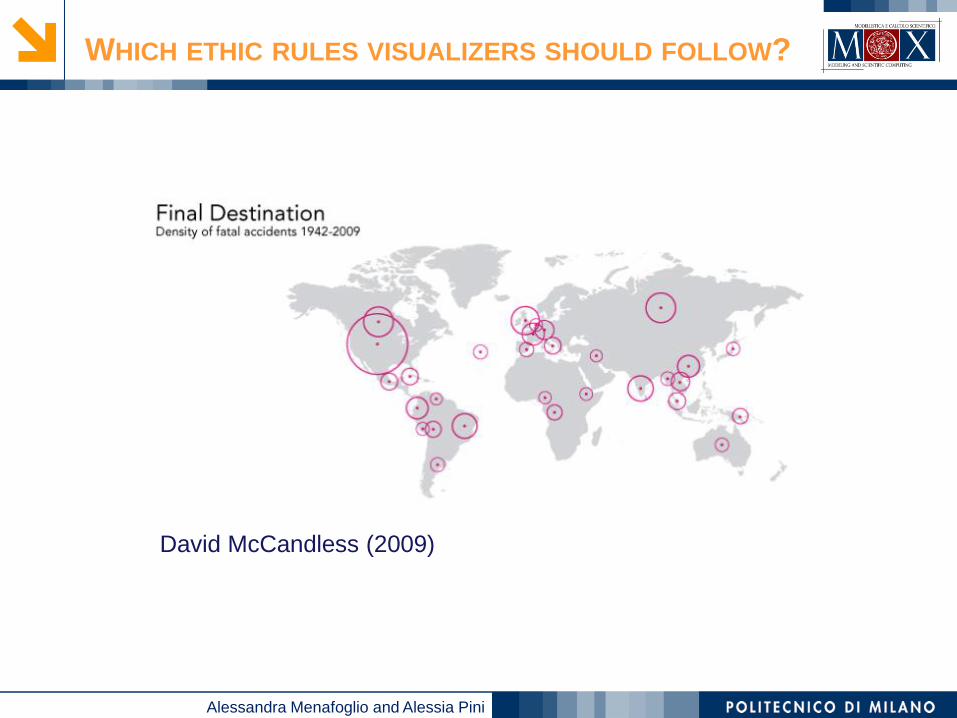
WHICH ETHIC RULES VISUALIZERS SHOULD FOLLOW?
David McCandless (2009)
Alessandra Menafoglio and Alessia Pini
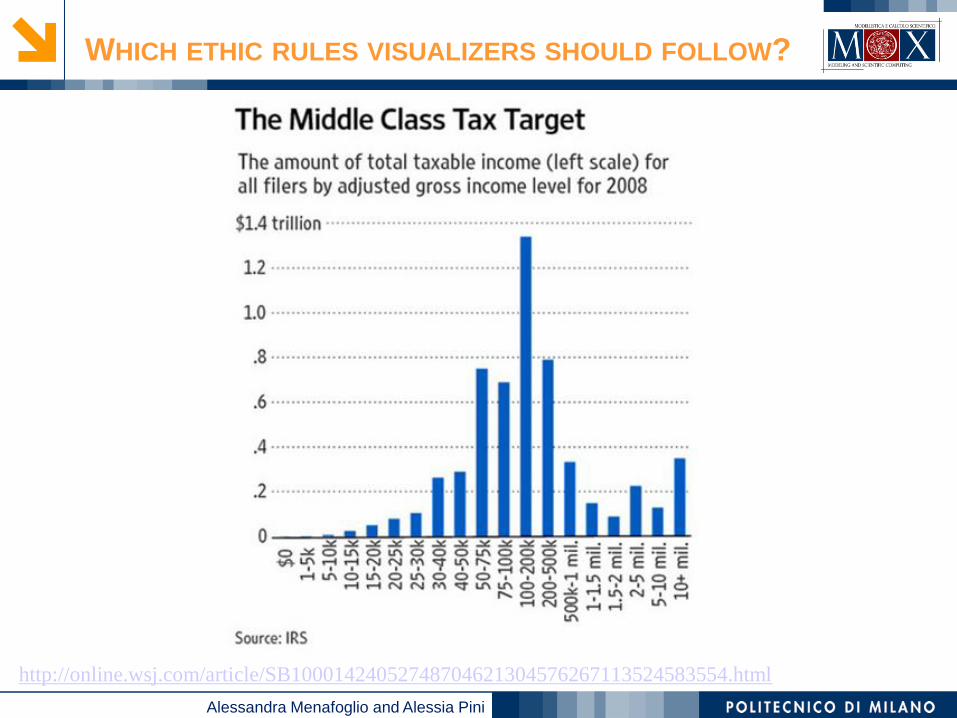
http://online.wsj.com/article/SB10001424052748704621304576267113524583554.html
WHICH ETHIC RULES VISUALIZERS SHOULD FOLLOW?
Alessandra Menafoglio and Alessia Pini
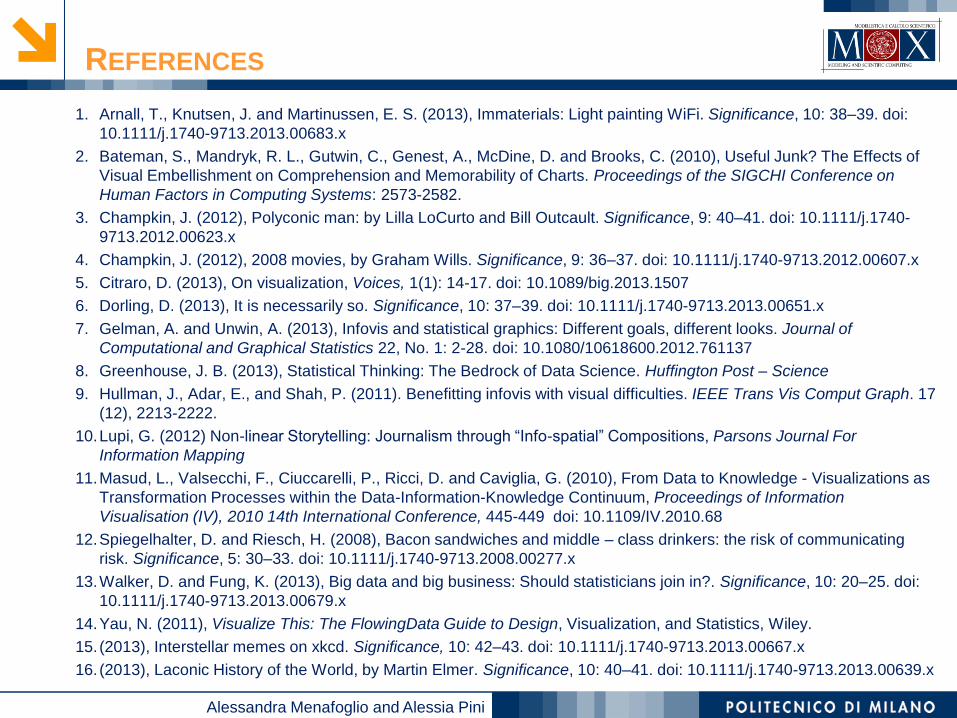
REFERENCES
1. Arnall, T., Knutsen, J. and Martinussen, E. S. (2013), Immaterials: Light painting WiFi. Significance, 10: 38–39. doi:
10.1111/j.1740-9713.2013.00683.x
2. Bateman, S., Mandryk, R. L., Gutwin, C., Genest, A., McDine, D. and Brooks, C. (2010), Useful Junk? The Effects of
Visual Embellishment on Comprehension and Memorability of Charts. Proceedings of the SIGCHI Conference on
Human Factors in Computing Systems: 2573-2582.
3. Champkin, J. (2012), Polyconic man: by Lilla LoCurto and Bill Outcault. Significance, 9: 40–41. doi: 10.1111/j.1740-
9713.2012.00623.x
4. Champkin, J. (2012), 2008 movies, by Graham Wills. Significance, 9: 36–37. doi: 10.1111/j.1740-9713.2012.00607.x
5. Citraro, D. (2013), On visualization, Voices, 1(1): 14-17. doi: 10.1089/big.2013.1507
6. Dorling, D. (2013), It is necessarily so. Significance, 10: 37–39. doi: 10.1111/j.1740-9713.2013.00651.x
7. Gelman, A. and Unwin, A. (2013), Infovis and statistical graphics: Different goals, different looks. Journal of
Computational and Graphical Statistics 22, No. 1: 2-28. doi: 10.1080/10618600.2012.761137
8. Greenhouse, J. B. (2013), Statistical Thinking: The Bedrock of Data Science. Huffington Post – Science
9. Hullman, J., Adar, E., and Shah, P. (2011). Benefitting infovis with visual difficulties. IEEE Trans Vis Comput Graph. 17
(12), 2213-2222.
10.Lupi, G. (2012) Non-linear Storytelling: Journalism through “Info-spatial” Compositions, Parsons Journal For
Information Mapping
11.Masud, L., Valsecchi, F., Ciuccarelli, P., Ricci, D. and Caviglia, G. (2010), From Data to Knowledge - Visualizations as
Transformation Processes within the Data-Information-Knowledge Continuum, Proceedings of Information
Visualisation (IV), 2010 14th International Conference, 445-449 doi: 10.1109/IV.2010.68
12.Spiegelhalter, D. and Riesch, H. (2008), Bacon sandwiches and middle – class drinkers: the risk of communicating
risk. Significance, 5: 30–33. doi: 10.1111/j.1740-9713.2008.00277.x
13.Walker, D. and Fung, K. (2013), Big data and big business: Should statisticians join in?. Significance, 10: 20–25. doi:
10.1111/j.1740-9713.2013.00679.x
14.Yau, N. (2011), Visualize This: The FlowingData Guide to Design, Visualization, and Statistics, Wiley.
15. (2013), Interstellar memes on xkcd. Significance, 10: 42–43. doi: 10.1111/j.1740-9713.2013.00667.x
16. (2013), Laconic History of the World, by Martin Elmer. Significance, 10: 40–41. doi: 10.1111/j.1740-9713.2013.00639.x
Alessandra Menafoglio and Alessia Pini
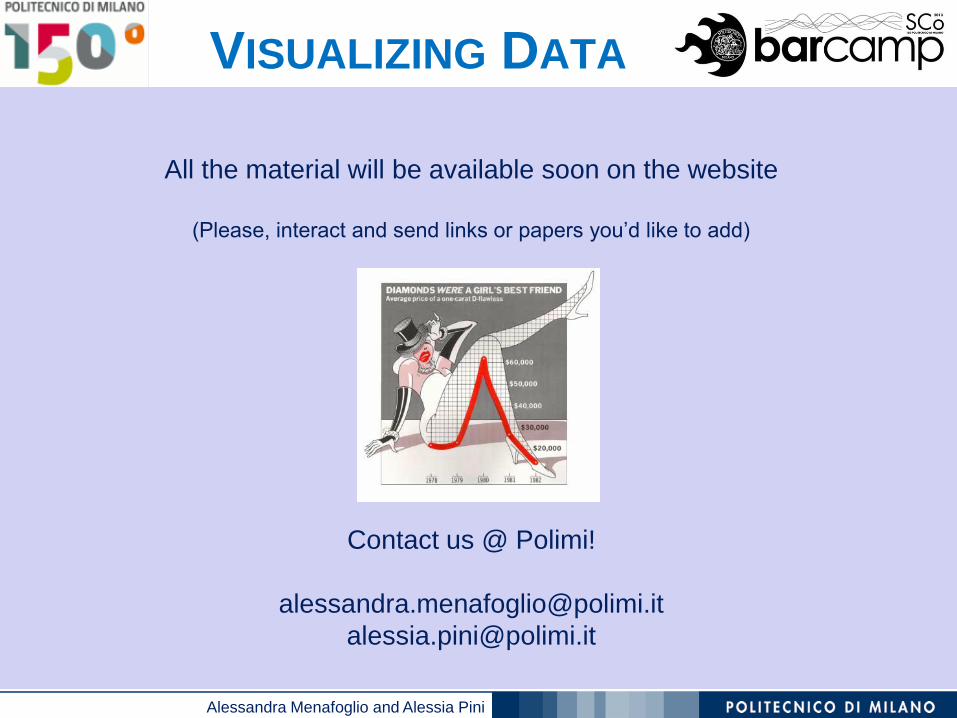
VISUALIZING DATA
All the material will be available soon on the website
(Please, interact and send links or papers you’d like to add)
Contact us @ Polimi!