PRESENTATION TO THE HIGHER EDUCATION TRUSTEES MEETING STATE OF ARKANSAS PULASKI TECHNICAL COLLEGE...
44
PRESENTATION TO THE HIGHER EDUCATION TRUSTEES MEETING STATE OF ARKANSAS PULASKI TECHNICAL COLLEGE DECEMBER 10, 2010 RICHARD L. PETRICK Aligning State Resources to Better Promote Student Success
-
Upload
martina-cox -
Category
Documents
-
view
214 -
download
1
Transcript of PRESENTATION TO THE HIGHER EDUCATION TRUSTEES MEETING STATE OF ARKANSAS PULASKI TECHNICAL COLLEGE...
PRESENTATION TOTHE HIGHER EDUCATION TRUSTEES
MEETINGSTATE OF ARKANSAS
PULASKI TECHNICAL COLLEGEDECEMBER 10 , 2010
RICHARD L . PETRICK
Aligning State Resources to Better Promote Student Success

Arkansas Trustees Meeting
2
“PERFORMANCE FUNDING IS A METHOD OF FUNDING PUBLIC INSTITUTIONS BASED NOT ON INPUTS, SUCH AS ENROLLMENTS, BUT ON OUTCOMES, SUCH AS RETENTION, DEGREE COMPLETION, AND JOB PLACEMENT….
THE PRINCIPAL RATIONALE FOR PERFORMANCE FUNDING HAS BEEN THAT PERFORMANCE FUNDING WILL PROD INSTITUTIONS TO BE MORE EFFECTIVE AND EFFICIENT, PARTICULARLY IN A TIME OF INCREASING DEMANDS ON HIGHER EDUCATION AND INCREASINGLY STRAITENED STATE FINANCES.”
C C R C W O R K I N G PA P E R # 2 212/10/2010
What Is Performance Funding?
Arkansas Trustees Meeting
3
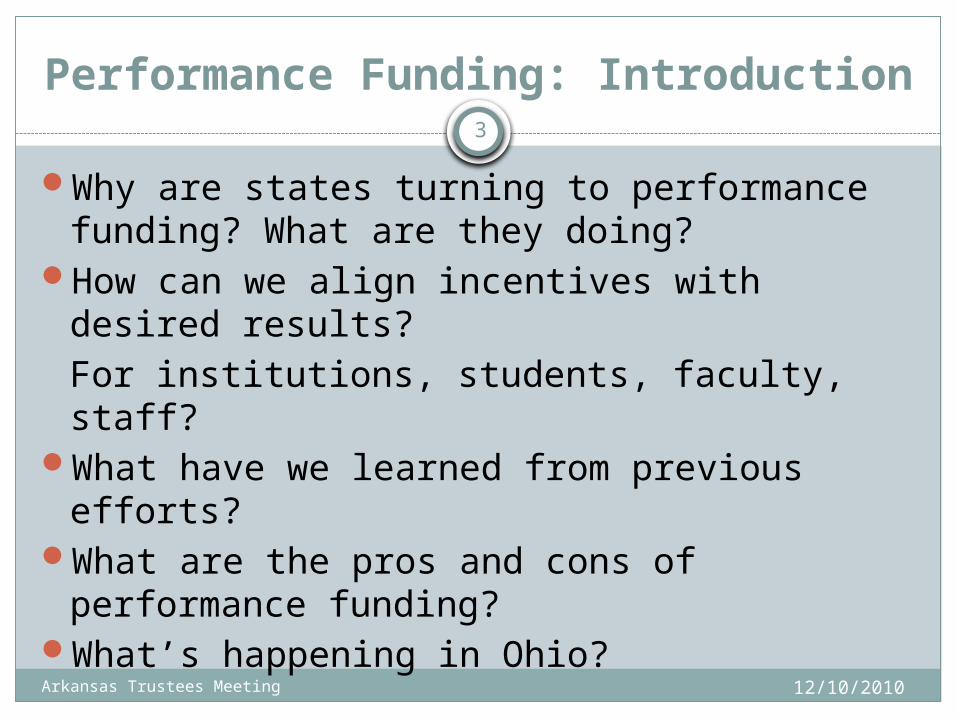
Performance Funding: Introduction
Why are states turning to performance funding? What are they doing?
How can we align incentives with desired results?For institutions, students, faculty, staff?
What have we learned from previous efforts?What are the pros and cons of performance
funding?What’s happening in Ohio?
12/10/2010
Arkansas Trustees Meeting 4
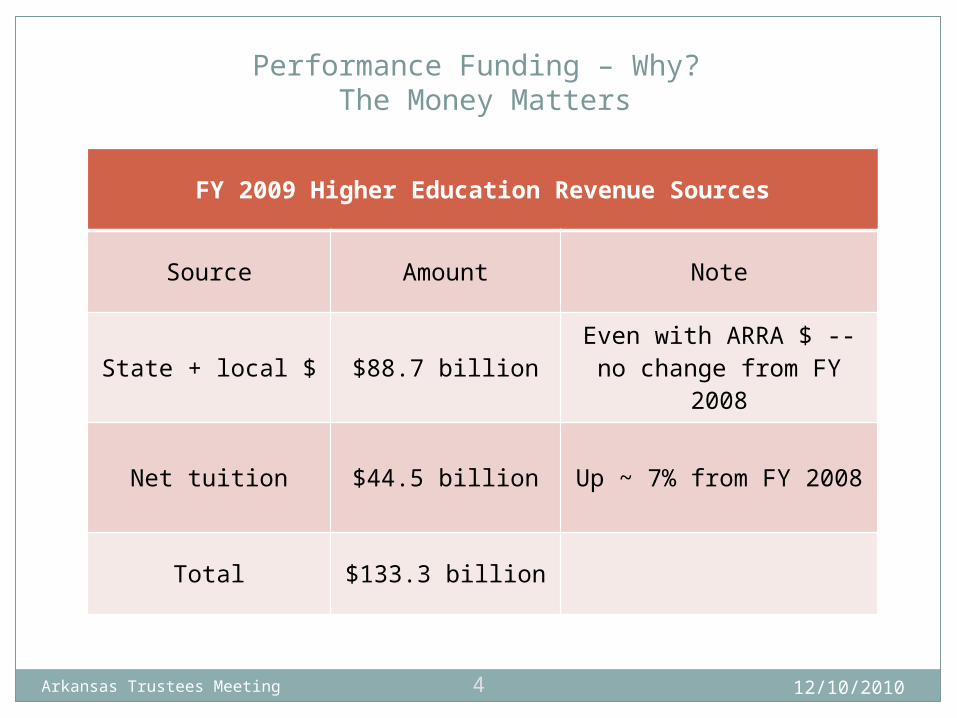
Performance Funding – Why? The Money Matters
12/10/2010
FY 2009 Higher Education Revenue Sources
Source Amount Note
State + local $ $88.7 billion Even with ARRA $ -- no change from FY 2008
Net tuition $44.5 billion Up ~ 7% from FY 2008
Total $133.3 billion

Arkansas Trustees Meeting 5
Performance Funding – Why? The Money Matters
12/10/2010
FY 2009 Higher Education Revenue Sources
Source Amount Note
State + local $ $88.7 billion Even with ARRA $ -- no change from FY 2008
Net tuition $44.5 billion Up ~ 7% from FY 2008
Total$133.3 billion
Arkansas Trustees Meeting 6
“Mounting State Debts Stoke Fears of a Looming Crisis”
New York Times December 5, 2010
Performance Funding – Why? The Money Matters
12/10/2010

Arkansas Trustees Meeting 7
• Projected state budget gaps: • FY 2011: $121 billion• FY 2012: $102 billion
• Post-budget state budget cuts• FY 2008 - $13 billion (13 states)• FY 2009 - $43 billion (43 states)• FY 2010 - $39 billion (39 states)• FY 2011 - $14 billion (14 states)
Performance Funding – Why? The Money Matters
12/10/2010

Arkansas Trustees Meeting 8
“Graduation Rates Fall at One-Third of 4-Year Colleges”
The Chronicle of Higher EducationDecember 6, 2010
Performance Funding – Why? The Degree Matters
12/10/2010

Arkansas Trustees Meeting 9
• The United States is falling behind other countries in educational attainment.
• America’s 18 - 24 year-olds are less well-educated than 25-64 year-olds.
• Graduation rates are low for 4-year institutions and have not improved over time (58 percent).
Performance Funding – Why? The Degree Matters
12/10/2010
Arkansas Trustees Meeting 10
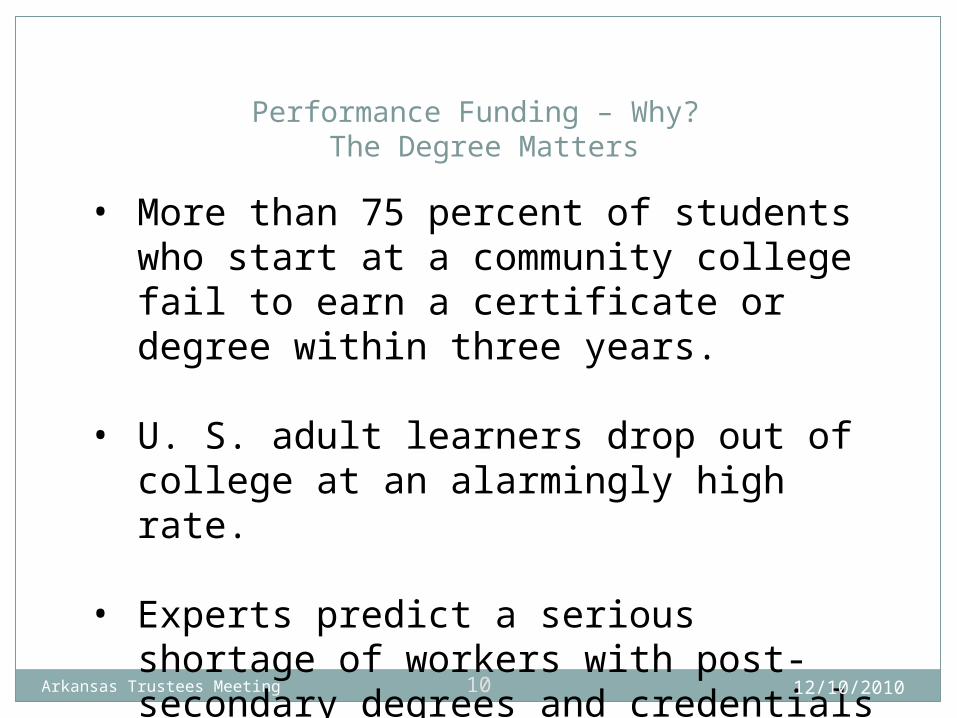
• More than 75 percent of students who start at a community college fail to earn a certificate or degree within three years.
• U. S. adult learners drop out of college at an alarmingly high rate.
• Experts predict a serious shortage of workers with post-secondary degrees and credentials in the near future
Performance Funding – Why? The Degree Matters
12/10/2010

Arkansas Trustees Meeting 11 12/10/2010
Performance Funding 1.0: 1980 – 2004Performance Funding 2.0: 2005 – 2010
Arkansas Trustees Meeting
12
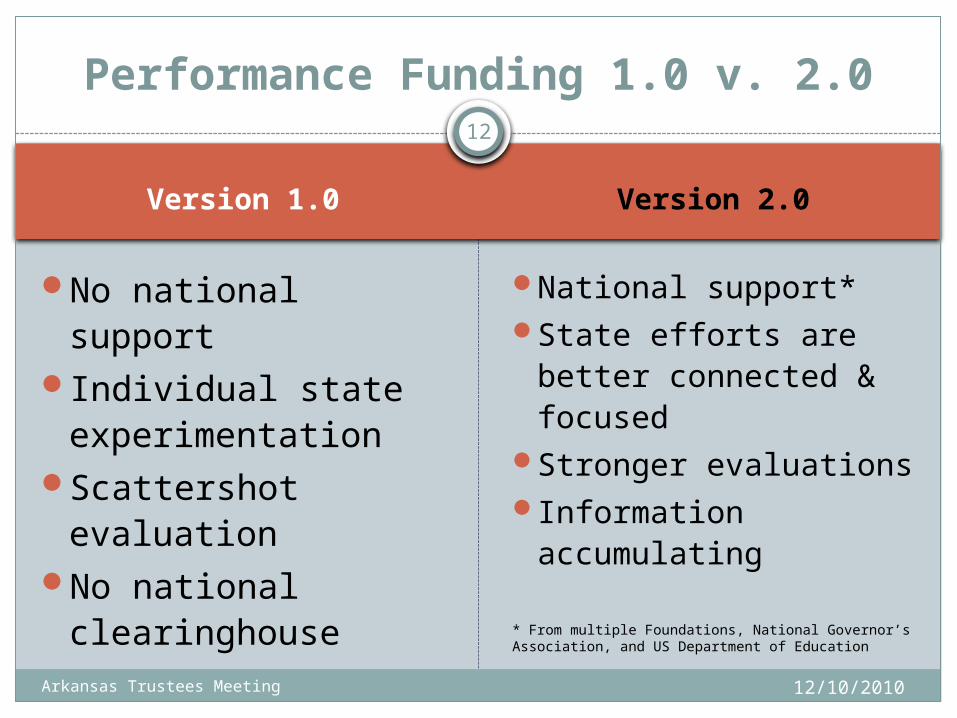
Version 1.0 Version 2.0
12/10/2010
No national supportIndividual state
experimentationScattershot
evaluationNo national
clearinghouse
National support*State efforts are
better connected & focused
Stronger evaluationsInformation
accumulating
* From multiple Foundations, National Governor’s Association, and US Department of Education
Performance Funding 1.0 v. 2.0
Arkansas Trustees Meeting
13
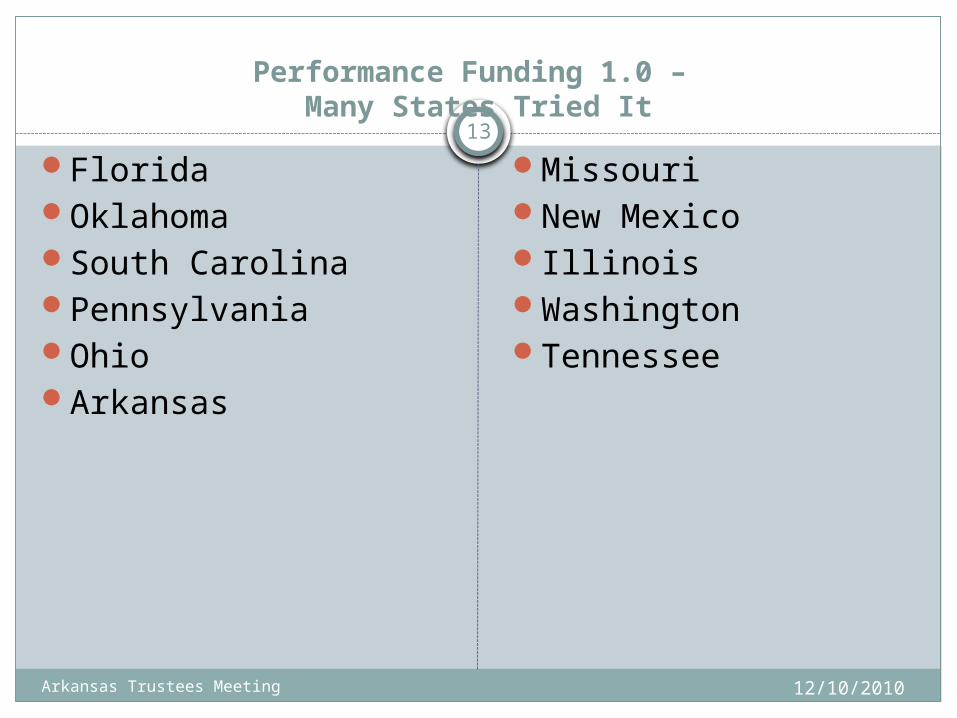
Performance Funding 1.0 – Many States Tried It
12/10/2010
FloridaOklahomaSouth CarolinaPennsylvaniaOhioArkansas
MissouriNew MexicoIllinoisWashingtonTennessee

Arkansas Trustees Meeting
14
Performance Funding, 1.0Two examples
12/10/2010
Tennessee was the first – 1980-81 Piloted in 1974 2 % of the state $ in ‘80,
then increased to 5.45% Transparent, focused on
few metrics Embedded in the
subsidy allocations – not a “bolt-on” that could be cut when times are bad
Relatively simple, flexible
Sustained
South Carolina’s experiment – 1990s Very ambitious --
sought to have 100% of funding based on performance
Very complex – large number of indicators and processes
Threatening – some saw it as a way of shrinking or closing inefficient or ineffective campuses
Terminated

Arkansas Trustees Meeting
15
Performance Funding 2.0
“We need to measure what matters. We need to know what the students learn, and what jobs they get. We need to know why students of some community colleges do better in the job market than others. Why minority students at some colleges take longer to earn a degree than similar students elsewhere. We don’t know the answers. We’re not even asking the questions.”
Bill Gates, 2009
12/10/2010

Arkansas Trustees Meeting
16
Performance Funding 2.0
“Over a third of America’s college students and over half of our minority students don’t earn a degree, even after six years. So we don’t just need to open the doors of college to more Americans; we need to make sure they stick with it through graduation. That is critical. ”
President Obama, 2010
12/10/2010

Arkansas Trustees Meeting
17
The ABCs of Performance Funding – What Do State Policymakers Want?
Accountability:- More graduates in high demand fields- More focus on success of underserved
populationsBetter Performance:- Efficient and cost effective instructional delivery focused on completionsCollaboration:- Particularly among two and four year institutions
12/10/2010

Arkansas Trustees Meeting
18
The ABCs of Performance Funding – What Do State Policymakers Want?
More Cost-efficient
Student Success,
More Quickly
12/10/2010

Arkansas Trustees Meeting
19
Performance Funding 2.0
Some examples:Louisiana (2010 Legislation)Tennessee (2010 Legislation)Indiana Washington Community Technical CollegesOhio
12/10/2010

Arkansas Trustees Meeting
20
Performance Funding 2.0
Louisiana: State funding reductions, more anticipated. For 2010-11,
Adopted the GRAD Act that establishes graduation rate goals for public institutions
When institutions meet these goals they are granted more fiscal autonomy
Tied 25% of state funds to completion/ transfer and articulation/workforce/research, including graduates ages 25 and older, racial/ ethnic minorities, low income, STEM fields
12/10/2010

Arkansas Trustees Meeting
21
Performance Funding 2.0
Tennessee: Complete College Tennessee Act of 2010 Comprehensive legislation
Outcomes-based funding model, including end of term enrollment, student retention, timely progress toward degree completion, etc.
Transfer/articulation – common course numbers
12/10/2010

Arkansas Trustees Meeting
22
Performance Funding 2.0
In 2009-10, Indiana modified its funding to include–
Degrees (and for low-income students)Course completionsOn-time graduation, andTransfer
12/10/2010

Arkansas Trustees Meeting
23
Performance Funding 2.0
Washington Community/Technical Colleges –The Board established a student success goalRecognized students in all mission areas (including
adult basic education and developmental education), reflect diverse communities served by colleges
Measures are simple, understandable, and relevant to institution, the student and policy makers
Informed by solid research at Columbia University’s Community College Research Center
12/10/2010

Arkansas Trustees Meeting
24
Performance Funding 2.0
Washington’s four categories of measures:
1. Momentum points that build towards college-level skills
2. Momentum points that build to “Tipping Point” and beyond
3. Earning college level credits in math
4. Completions
12/10/2010

Arkansas Trustees Meeting
25
Performance Funding – Advantages
Institutions do respond to financial incentives
Lessons from Performance Funding 1.0FloridaWashingtonOhioTennessee
12/10/2010

Arkansas Trustees Meeting
26
Performance Funding 2.0 – Advantages
Opportunity to better align incentives with desired results for:
Institutions (state subsidy)Students (financial aid, tuition, instructional
delivery)Faculty (tenure/promotion/financial awards)Staff (promotion/financial awards)
12/10/2010

Arkansas Trustees Meeting
27
Performance Funding 2.0 -- Pitfalls
Can be difficult to design – need to involve technical expertise early
Can be difficult to account for differences in mission
Some data are hard to come byNeed to recognize funds needed to support
institutions’ core functionsCould it lead to grade inflation?
12/10/2010

I. Performance Funding in Ohio, V 1.0

Arkansas Trustees Meeting
29
Ohio had a long history of performance-based funding
The first of the four “Challenges” began in the 1980s
Total funding for the Challenges equaled about 10% of total state operating subsidy for campuses by late 1990s
The past successful implementation of performance funding helped set the stage for significant changes in FY 2010 and FY 2011
12/10/2010

Arkansas Trustees Meeting
30
Performance funding foundations:Policy design
The Challenges Goal Recipient $ Distributed
Research Increase third-party sponsored research $
Public university main campuses; some private universities
~$10 - $12 million per year
Access Lower tuition to increase enrollments at access campuses
Public community colleges and selected 4-year access campuses
~ $65 million per year
Success
Decrease time to UG 4 –year degrees; improve degree achievement for at risk students
Public university main campuses
~$55 million per year
Jobs Increase job-related training
Mostly at public two-year campuses
~$10 million per year
12/10/2010
Arkansas Trustees Meeting
31
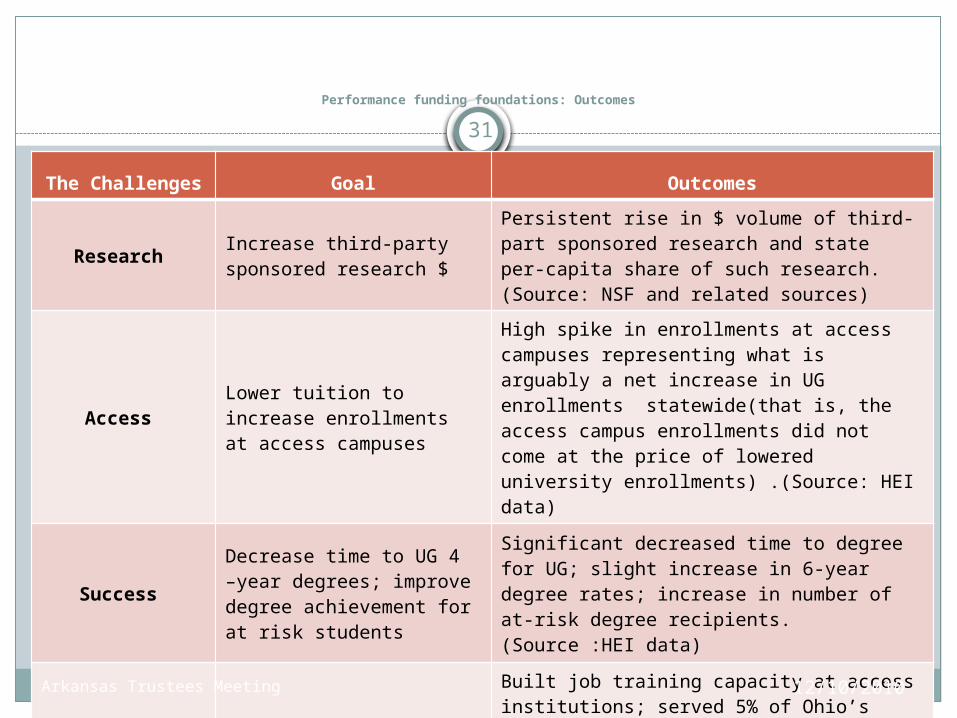
Performance funding foundations: Outcomes
The Challenges Goal Outcomes
Research Increase third-party sponsored research $
Persistent rise in $ volume of third-part sponsored research and state per-capita share of such research. (Source: NSF and related sources)
Access Lower tuition to increase enrollments at access campuses
High spike in enrollments at access campuses representing what is arguably a net increase in UG enrollments statewide(that is, the access campus enrollments did not come at the price of lowered university enrollments) .(Source: HEI data)
Success
Decrease time to UG 4 –year degrees; improve degree achievement for at risk students
Significant decreased time to degree for UG; slight increase in 6-year degree rates; increase in number of at-risk degree recipients. (Source :HEI data)
Jobs Increase job-related training
Built job training capacity at access institutions; served 5% of Ohio’s workforce annually; significant savings and cost reductions reported by participating businesses and industries. (Source: OBR staff surveys.)
12/10/2010

II. Funding Formula Changes in FY 2010 and FY 2011

Arkansas Trustees Meeting
33
II. The Chancellor’s ten-year strategic plan: Some key elements
Strategic plan was mandated by the legislatureExplicit goals for the new public agenda:
Enroll and graduate more Ohioans. Increase state aid, improve efficiency, and lower
out of pocket expenses for undergraduates. Increase participation and success by first-
generation students. Increase participation and success by adult
students.Each goal has a specific metric by which
progress toward the plan is assessed annually.
12/10/2010

Arkansas Trustees Meeting
34
II. Changes in place for FY 2010 and FY 2011
Major shift to success-based formulasCreation of three new formulas:
University main campusesUniversity regional campusesCommunity colleges
Endorsed by the Governor and approved by the General Assembly in H.B. 1
12/10/2010

Arkansas Trustees Meeting
35
II. University main campuses
Shift from enrollment-based to course- and degree-completion based formula Cost-based course and degree allocations Empirically-based adjustment (extra weighting) for at-
risk students Degree-completion component to be phased in slowly
Setasides for doctoral and medical funding Doctoral and medical funding to become more dynamic
and performance-basedEffects phased in over time
99% stop loss in FY 2010 98% stop loss in FY 2011
12/10/2010

Arkansas Trustees Meeting
36
II. University regional campuses
Shift from enrollment-based to course-completion based formula Cost-based course and degree allocations Empirically-based adjustment (extra weighting) for at-risk
studentsPlan to add degree-completion component in 2 to
4 years Time to permit regional campuses to adjust their missions
to focus more on upper-level undergraduate enrollmentsEffects phased in over time
99% stop loss in FY 2010 98% stop loss in FY 2011
12/10/2010
Arkansas Trustees Meeting
37
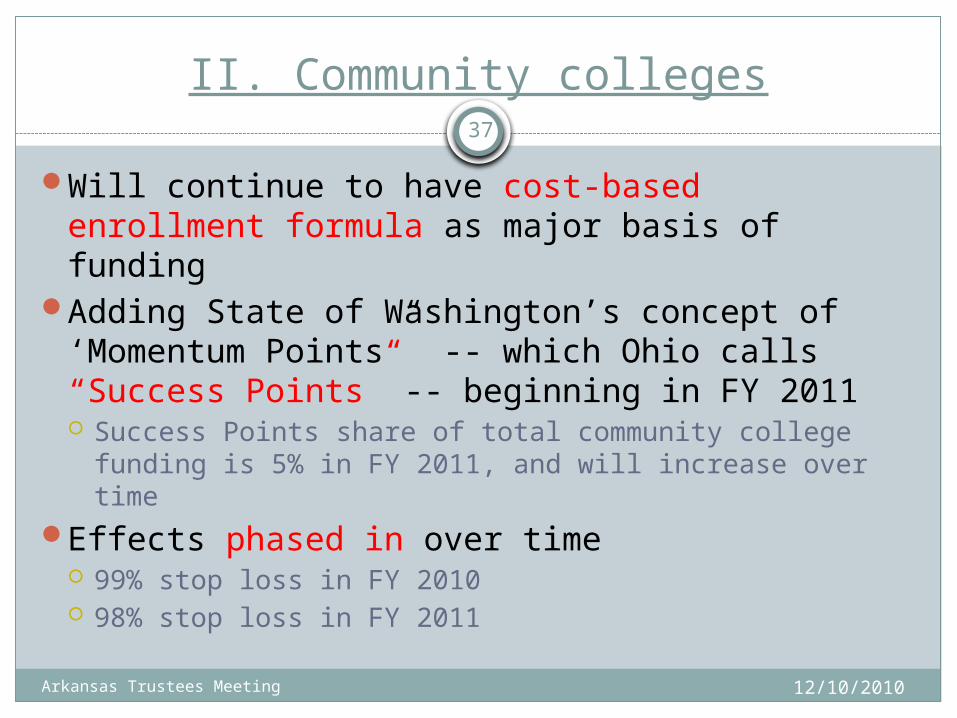
II. Community colleges
Will continue to have cost-based enrollment formula as major basis of funding
Adding State of Washington’s concept of ‘Momentum Points” -- which Ohio calls “Success Points” -- beginning in FY 2011 Success Points share of total community college
funding is 5% in FY 2011, and will increase over timeEffects phased in over time
99% stop loss in FY 2010 98% stop loss in FY 2011
12/10/2010

Arkansas Trustees Meeting
38
Toward an integrated state policy in support of student success
12/10/2010
Goal of public policy
Major financial policy levers
Status in Ohio
Institutions State subsidyBeing implemented, & refined
StudentsStudent financial aid, tuition policy
Pilot projects done & evaluations underway
FacultyCompensation; tenure and promotion policy
Not planned

Arkansas Trustees Meeting
39
What we know about successful programs
Common threads – staying power Commitment of political leaders, institutional leadership,
faculty, staff and students Mission sensitivity -- not every institution is expected to
have high performance in every area No funding cliffs -- effects phased in over time Transparency/accountability with periodic reports on results One size does not fit all: Each state approach has been
unique, with some sharing of components Improvement focus
Institutions should be able to influence the results over a reasonable timeframe
Institutions should be able to use the information to develop strategies for improving student achievement
12/10/2010

Arkansas Trustees Meeting
40
Performance and Completion:What can trustees do?
Know your campus numbersKnow your campus trend lineKnow how your campus compares to peers Know how your campus compares to top
performing peersKnow your campus & state contextSet specific goals for improvementUse the “C.A.S.E.” method to move the needle
12/10/2010

Arkansas Trustees Meeting
41
Performance and Completion:What can trustees do?
What is the “C.A.S.E.” method?CopyAndStealEverything
12/10/2010
Arkansas Trustees Meeting
42
Some sources
Books, articles, presentations by:
Access to Success (NASH)Brenda Albright (National consultant)
Joseph Burke (The Rockefeller Institute)Community College Research Center (Columbia University)
Complete College AmericaBill and Melinda Gates Foundation
The Lumina FoundationNational Center for Higher Education Management
[email protected](614) 598-9437
12/10/2010

Arkansas Trustees Meeting
43
Thank You/Questions?
12/10/2010

Arkansas Trustees Meeting
44
Appendix: What are “success points?”
Measures of student success that are sensitive to the community college’s mission and students Derived from Columbia University Teacher’s College study One point for each, unweighted by student or program or level
Success Points include number of students who either:- Complete their first remedial course; - Successfully complete a developmental Math course last year, and
subsequently enroll in a college level Math; and - Successfully complete a developmental English course last year, and
subsequently enroll in a college level English. …and who
- Earn their first 15 semester credit hours- Earn their first 30 semester credit hours- Earn at least one associate degree, from that institution, in a given year.- Complete at least 15 semester credit hours at that institution and
subsequently enroll for the first time at a four year college or university, in Ohio.
12/10/2010