
Presentation to supplyFORCE meeting
26
10 years 1 0 y e a r s Redefining the Supply Chain Jeff Tiefermann
Transcript of Presentation to supplyFORCE meeting

10
years
10
yearsRedefining the Supply Chain
Jeff Tiefermann

Agenda
My background/Why Consulting?
What Customers Want
Why supplyFORCE is the answer
Implementation success

My BackgroundEducation• BS, Montana State University 1983• MBA, Miami University 1987• Completed Six Sigma Training, Green Belt Certified, General Electric • CEO SIX SIGMA AWARD, General Electric.• Three time Nobel Prize Winner • SCORE Trained and Certified through Chrysler
1988-1996 CHRYSLER CORPORATION Auburn Hills, MI
1996-2001 GENERAL ELECTRIC CORP Various
2001-2004 HARRIS CORPORATION Cincinnati, OH
2004 – 2007 LOUISIANA PACIFIC Nashville, TN
2007- 2008 BIOMET Warsaw, IN
2008 – Present ABERCROMBIE & FITCH Columbus, OH

Why Consulting?

Why Consulting?

•Minimal product differentiation•Significant capital requirements•Economies of scale can create an impact•Alliances being formed to compete with mega-distributors
Entry Barriers Medium
•Large competitive supply market•Regional / Local fragmentation•Consolidation and merger activity•Low product differentiation•Value added services and product breadth are differentiating factors
Intensity Of Rivalry High
•Standard product requirements•Low switching costs•Potential high volume of supplier’s sales •High leverage potential•Good product information
Buyer Power High
•Low costs to switch to substitutes•Minimal product improvements•Some brand loyalty issues•Increasing usage of “generics”•Influx of “global” products
Substitutes Medium
•Commodity like products•Cost-sensitive industry•Low switching costs•Competitive supply base•Sunoco is an important customer
Supplier Power Low – Medium
From a customer perspective, the MRO supply market remains highly competitive where
companies can exercise considerable leverage…

Demand Management
Buying Power Leverage
Product/Service Specification Rationalization
Business Processes/Labor Efficiency
Total Cost Levers
Transactions/Systems
Compliance/Shrinkage
Material/Service
Cost
Inventory Carrying Cost
Labor Cost
Indirect/MRO Overhead –
10 to 15 Percent
Total Cost
Process and Systems Costs
Total Cost
Purchases of Material/ Service85 to 90 Percent
Total CostRedeployment of Inventory
Inventory Visibility Through IT
Increased Use of Manufacturing Warranties
• Identify means to reduce demand through rationalization and/or substitution
• Consolidate number of suppliers• Pool volume across units and combine volume from
different commodity categories• Redistribute volume among suppliers
• Conduct product value analysis and engineering• Substitute materials• Pursue system buying alternatives • Optimise life cycle costs
• Reengineer joint processes• Share productivity gains• Integrate logistics• Support supplier operations improvement
• Establish/develop key suppliers• Develop integrated supply chain• Supercharge process with consistent technology platform
• Monitor compliance through IT• Reduce costs further by controlling usage
• Dispose of long-turn inventory to suppliers• Reduce downtime
• Manage inventory across plants• Share inventory across sites• Reduce downtime caused by lack of parts
• Implement process to improve warranty use • Reduce downtime through improved service
… however to achieve optimal savings, companies need to consider the total
cost of the MRO spend
What customers want
Immediate results. Yesterday!
Do more with less / more resources!
Faster processes/Less work
What are we buying exactly? Clarity of buy.
No political impact

Consolidation Among Suppliers Through Acquisition And Alliances
Customer Focus On Total Cost Instead Of Price Customers Reducing Vendor Base
Number Of MRO Suppliers
Increasing Geographic Scope Number Of Products Offered
Expanding Product Lines
• Procurement• Inventory costs• Service/availability • Price
ProductAvailability
DifferentiationAmong
Suppliers BasedOn Service And
TechnicalCapabilities
EDI/ElectronicCatalogs
TechnicalSupport
InventoryManagement
In response to these market conditions, the MRO strategies of both suppliers and customers are
evolving & becoming more sophisticated
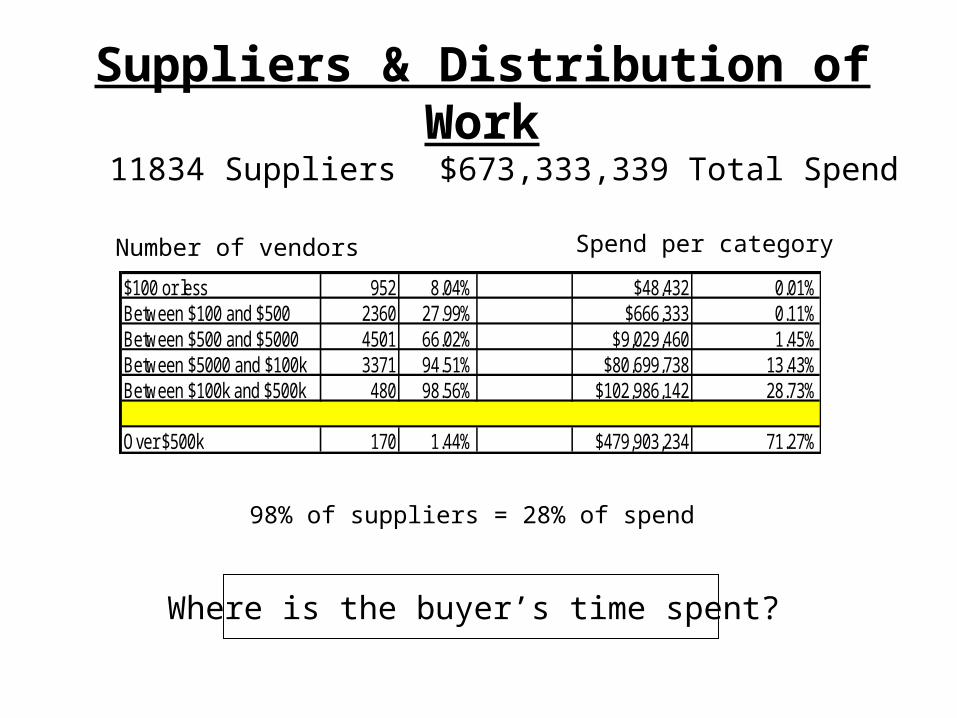
$100 or less 952 8.04% $48,432 0.01%Between $100 and $500 2360 27.99% $666,333 0.11%Between $500 and $5000 4501 66.02% $9,029,460 1.45%Between $5000 and $100k 3371 94.51% $80,699,738 13.43%Between $100k and $500k 480 98.56% $102,986,142 28.73%
Over $500k 170 1.44% $479,903,234 71.27%
11834 Suppliers $673,333,339 Total Spend
Number of vendors Spend per category
98% of suppliers = 28% of spend
Where is the buyer’s time spent?
Suppliers & Distribution of Work
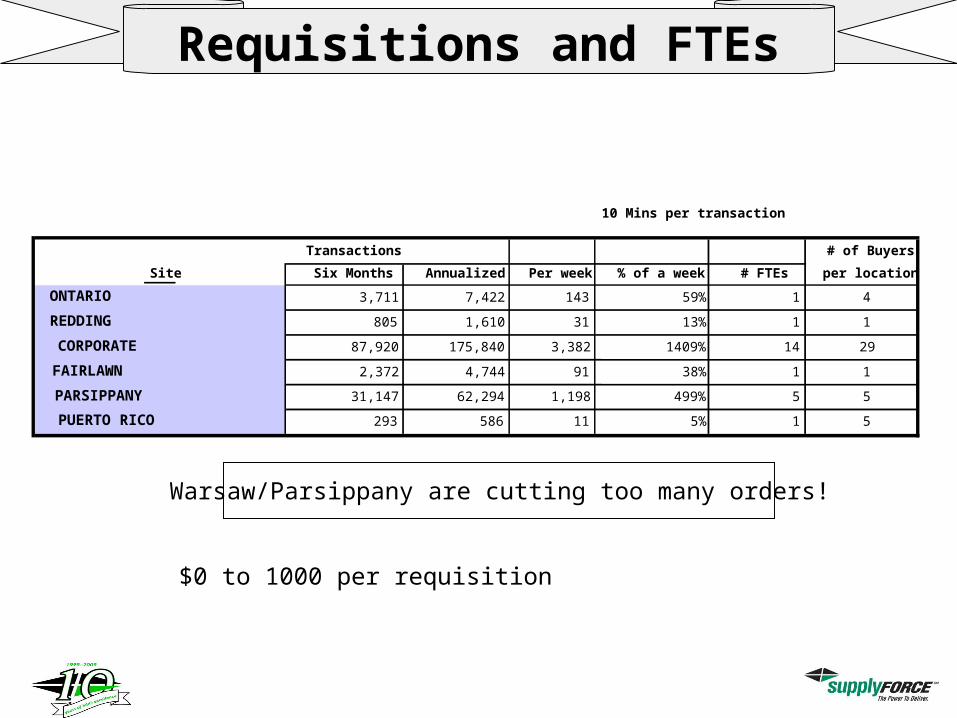
Requisitions and FTEs
$0 to 1000 per requisition
Warsaw/Parsippany are cutting too many orders!
Transactions
10 Mins per transaction
# of Buyers
Site Six Months Annualized Per week % of a week # FTEs per location
ONTARIO 3,711 7,422 143 59% 1 4
REDDING 805 1,610 31 13% 1 1
CORPORATE 87,920 175,840 3,382 1409% 14 29
FAIRLAWN 2,372 4,744 91 38% 1 1
PARSIPPANY 31,147 62,294 1,198 499% 5 5
PUERTO RICO 293 586 11 5% 1 5
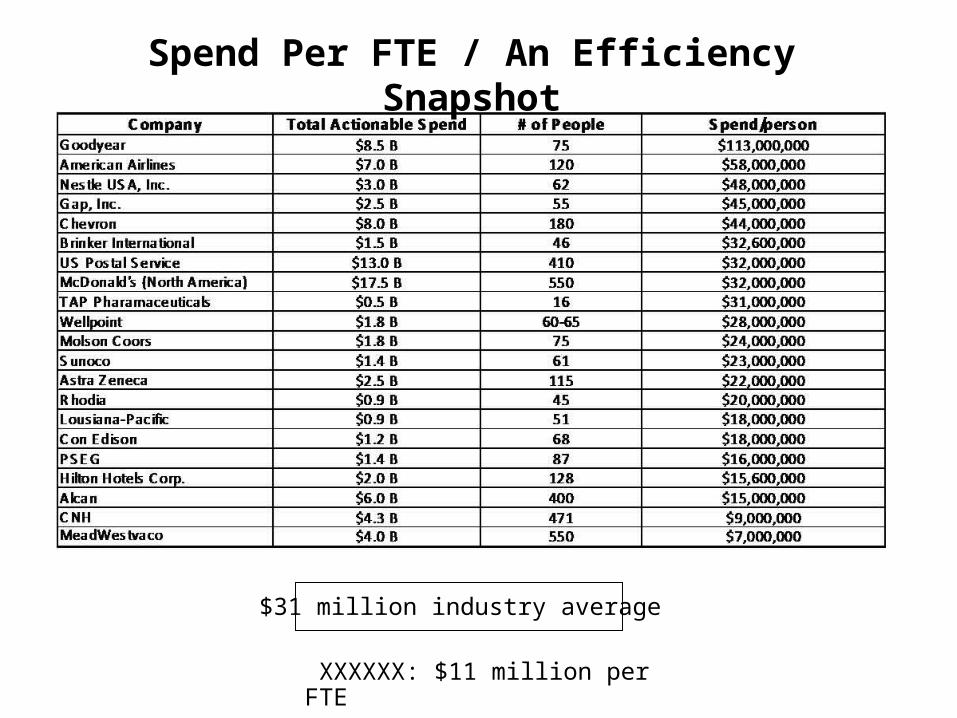
Spend Per FTE / An Efficiency Snapshot
$31 million industry average
XXXXXX: $11 million per FTE

40%
35%
30%
25%
20%
15%
10%
5%
0
Yr1 Yr2 Yr3 Yr4
MolsonCoors
SP Solutions
AMR ResearchA T Kearney
Sup/Dem Mgt
Cost Savings Return Over Time

• Welding / Supplies• Plastic &Rubber products• Cleaning utensils• Tape• Adhesives / Seals• Janitorial• Brushes• Packaging supplies• Spray equipment• Absorbents• Paint•Hand Tools•Pneumatic Tools•Power Tools
• Circuit Boards• Controllers• Transformers• Lamps• Adaptors• Wire / Conduit• Fuses• Circuit Breakers• Switches• Junction Boxes• Relays• Lighting Fixtures • Cables
• Batteries
• Tires
• Spark Plugs
• Motor Oil
• Fork Lift repair parts
• Hoses
IndustrialSupplies
Chemicals & Lubes
HVACFiltrationFluid Power
• Fans
• Valves
• Compressors
• Heat Exchangers
Mobile Equipment
BuildingSupplies
PowerTransmission
• Hydraulics
• Pneumatics
• Clamps
• Hoses
• Fittings
• Lube Equip
• Gages
• Valves
• Tubing
• Air Filters
• Water Filters
• Oil Filters
• Media Paper
• Telltales
• Process Filters
• Product filters
• Process filters
• Baghouse filters
Hardware
•Sand
•Gravel
•Lumber
•Paints
•Structural Mat.
•Structural Steel
•Landscaping
supplies
• Safety products
• Safety equipment
• Fire equipment
• Respirators
• Ear protection
• Gloves
• First-aid supplies
• Safety clothes
• Detection devices/alarms
• Hard hats
• Safety Glasses
MROSupplies
• Bearing - general
• Bearing - special
• Air bearings
• Belts (non-conveyor)
• Gearboxes
• Reducers
• Couplings/Pulleys
• Rings
• Gear Motors• Electric Motors• Belt Drive Motors• Brake Motors• Seals/Bushings
• Valves
• Fittings — pipe
• Pipe — steel
• Pipe — composite
• Pipe — plastic
• Pipe — nonferrous
• Plumbing
• Strainers
Conveyorbelting
• Oils
• Greases
• Lubricants
• Chemicals
• Coolants
• Glycol
•Electronics
•Instrumentation
•Process Controls
• Nuts
• Bolts
• Screws
• Pins
• Grommets
• Conveyor Parts
• Belts
Electrical OEMSpare Parts
SafetySupplies
Pipes,Valves& Fittings
Electronics &Instrumentation Pumps
• Electric Pumps• Centrifugal
Pumps• Pneumatic
Pumps• Pump Kits
Lab Supplies
A Cash “Black hole”

What supplyFORCE brings
$18 billion revenue
Fast savings
FTE flexibility
Information clarity
Breadth of Expertise and flexibility (The important extras)
Always nearby…. (potentially small political impact)
Your biggest strengths:

DescrSum
QuantityOriginal Price
(Program Price) Sum AmountProgram Unit
Price Sum Amount % savings30 watt R20 Incandescent Lamp, 90 $1.73 $155.70 $2.26 $203.40 -31%
PAR20 Metal Halide Lamp, H 62 $46.50 $2,883.00 $41.00 $2,542.00 12%32 watt T8 SP35 Fluorescent La 1448 $1.46 $2,114.08 $1.39 $2,012.72 5%
100W Incandescent A19 Light Bu 3 $0.35 $1.05 $0.23 $0.69 34%34 1/4" LONG surface fluoresce 112 $190.30 $21,313.60 $55.00 $6,160.00 71%
GEL40ACL24PK lamps 17 $0.51 $8.67 $0.23 $3.91 55%GEL50PAR30HIRSP9 lamps 86 $6.03 $518.58 $3.64 $313.04 40%
GEL40G25CRVL PQ1/6 reveal lamp 18 $2.40 $43.20 $2.05 $36.90 15%3foot T5 MIRROR FLUORESCENT 199 $52.50 $10,447.50 $50.00 $9,950.00 5%
GE 81282 35MR16/Q/6/TAL 4265 $4.70 $20,045.50 $3.84 $16,377.60 18%LAMPS FOR A&F D FIXTURE 741 $15.93 $11,804.13 $11.95 $8,854.95 25%
GFI RECEPTACLE 123 $17.85 $2,195.55 $14.50 $1,783.50 19%Type EM: Sure-Lites Recessed 235 $92.38 $21,709.30 $83.95 $19,728.25 9%
Type VM: GE F28WT5830ECO. 467 12 $4.59 $55.08 $4.00 $48.00 13%$437.23 $93,294.94 $274.04 $68,014.96
Proposal Comparison (s/F bulb comparison)
$25,279.98Total weighted 27%
$163.19Piece Price % 37%

• Enablers (Maximizing organizational responsibilities with fewer people)– P Card deployment– Full launch of supplyFORCE
• Infrastructure (“Let the system do the work instead of buyers”)– Item Master– Using MAPICS and Oracle to their fullest– Fully utilizing the requisition system– Smooth out the entire domestic P2P process– Establish blanket orders and catalogs– Using warehouse transfers instead of purchase orders to control intra-
company shipments• Readiness Preparation (Ensuring the right people are in the right places)
– Buyer models, Self assessments, Force Rankings– Common classifications & Pay grades
• Metrics– Ensure results are maintained– Control re-deployments– Measure against world class performance
• Control– Shut off purchasing access
Project Phoenix Components

Potential Resource Redeployment
How many people do you want? Where do you need them?
NOTE: Reductions are a result of P2P improvements and supplyFORCE improvements
Overstaffed by…
Number of MAPICS buyers 30
Number of annual Purchase orders 24176
Number of Pos a clerk can handle 2500
How many clerks should we have 10
Buyer Current s/F Impact
Barb Miller 2803 1400
Lorie Metheny 3169 3169
Marie Cuba 2507 1250
Mary Titus/Dorothy Casa 1459 700
Scott Follmer 2266 2266
12204 8785
Impact to overstaffed numbers
Original # of Pos 24176
s/F Impact 8785
New annual amount 15391
Number of Pos a clerk can handle 2500
How many clerks should we have 6
Number of freed-up resources: 24 FTEs

64 FTEs$664 million spend$10,400,000 per FTE
30 FTEs (Late 2009)$664 million spend$22,000,000 per FTE
Purchasing Organization Phase II
Purchasing Organization “As Is”
Twelve additional people “added”!

• Random selection of 50 “behind the wall” parts
• Suppliers targeted:• supplyFORCE, Grainger, Graybar
• Requested quotation turn-around time: 24 hours
The Quote Process - Example

• 19 out of 50 (38%) of the items had specification issues• Categories included:
• Packaging issues (pack vs. 1 bulb)• Unclear Spec Sheet• Unrecorded Substitutions • Manufacturer does not make this spec• “Had to price with can” (i.e. does not match
specification sheet)• “Unclear spec – quote with dimmer”
The Quote Process-Specification Findings

Piece price savings: 18%
Weighted volume savings: 12%
Estimated annual dollar volume: $10-11,000,000
The Quote Process - Financial Results

• Manufacturers• Pros
• Design knowledge/specialization• Commercial expertise
• Cons• Narrow product-line scope• Increased supply base
• Distributors• Pro’s
• Load Consolidation • Take offs
• Con’s• Regional coverage
• (ISS) Integrated Supplier Solution (supplyFORCE)• Pro’s
• Breadth of supply• Commercial expertise/Ability to engage manufacturers• Load consolidation/Take offs
• Con’s• International footprint
Sourcing Options Comparison

Keys to Success
Steering committee (high level)
High Level Commitment
Tracking metrics
Finance tie-in to verify results
Dedicated resources
Align internal departments
Laying down roots
Become the Customers IT department (forecasting, data reporting)
Become the keeper of the Customer’s data
Keep everything easy for the customer
Provide the sell (show the progress)
Constantly differentiate
Never underestimate politics

10
years
10
years


