
Presentation to North East Dairy Leadership Team · Presentation to North East Dairy Leadership...
32
1 Presentation to North East Dairy Leadership Team 2 nd June 2009 Andrei Mikhalevsky | Managing Director Fonterra Ingredients Agenda Global marketplace Worldwide demand Trends and their impact What does this mean for dairy? Dairy in New Zealand and Fonterra Dairy in New Zealand and Fonterra Worldwide supply
Transcript of Presentation to North East Dairy Leadership Team · Presentation to North East Dairy Leadership...

1
Presentation toNorth East Dairy Leadership Team2nd June 2009
Andrei Mikhalevsky | Managing Director Fonterra Ingredients
Agenda
Global marketplace
Worldwide demand
Trends and their impact
What does this mean for dairy?
Dairy in New Zealand and FonterraDairy in New Zealand and Fonterra
Worldwide supply

2
Global marketplace
Summary & outlook
Our assessment of the macro environment outlook suggests we’re in for a difficult 12 months
C b i tt h h d b t l t d h tConsumer buying patterns have changed but clear trends have yet to emerge, making forecasting difficult
Dairy commodity demand recently picked up as lower price levels improved margins and opportunities emerged
This provided welcome relief and renewed confidence after a challenging period of extreme price volatility and a lowerchallenging period of extreme price volatility and a lower consumption response
The rate of global milk growth is slowing with the current oversupply onto the market, particularly within protected markets likely to slow further
3
Summary & outlook
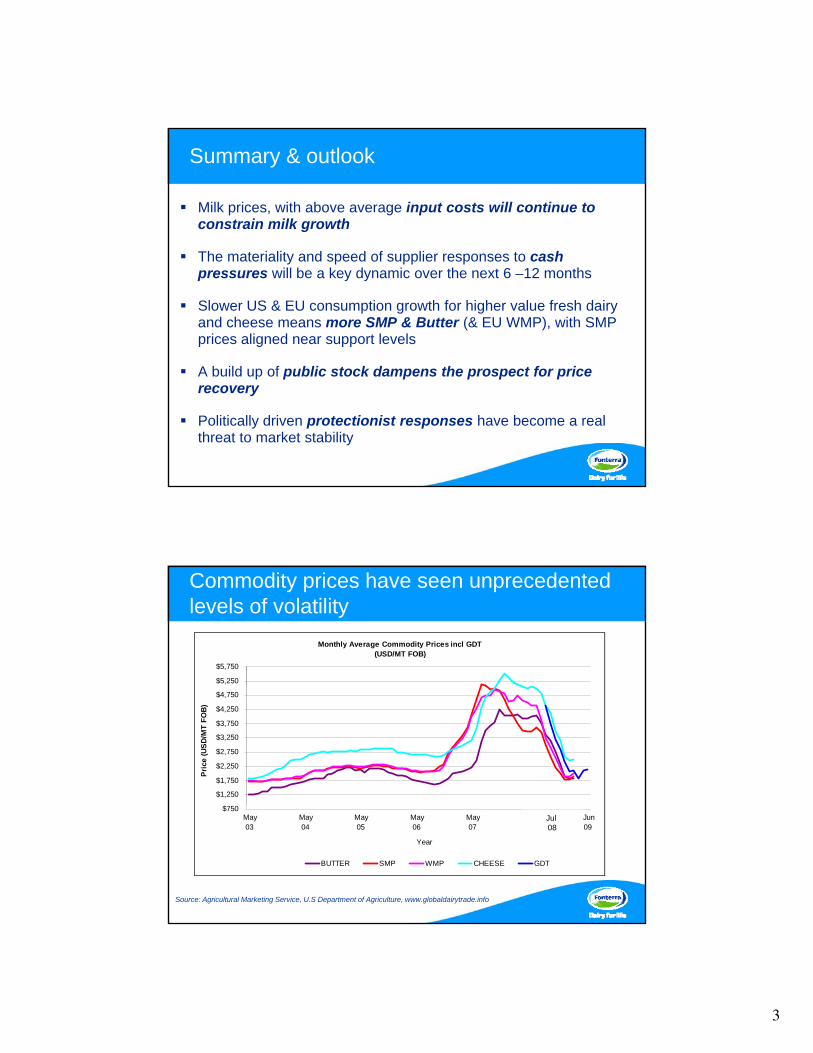
Milk prices, with above average input costs will continue to constrain milk growth
The materiality and speed of supplier responses to cash pressures will be a key dynamic over the next 6 –12 months
Slower US & EU consumption growth for higher value fresh dairy and cheese means more SMP & Butter (& EU WMP), with SMP prices aligned near support levels
A b ild f bli t k d th t f iA build up of public stock dampens the prospect for price recovery
Politically driven protectionist responses have become a real threat to market stability
Commodity prices have seen unprecedented levels of volatility
Monthly Average Commodity Prices incl GDT(USD/MT FOB)
$5,250
$5,750
$1,250
$1,750
$2,250
$2,750
$3,250
$3,750
$4,250
$4,750
Pric
e (U
SD/M
T FO
B)
Source: Agricultural Marketing Service, U.S Department of Agriculture, www.globaldairytrade.info
$750 May
03 Nov03
May04
Nov04
May05
Nov05
May06
Nov06
May07
Nov07
Jul08
Dec08
Jun09
Year
BUTTER SMP WMP CHEESE GDT
Jul 08

4
Government intervention could cause more volatility for commodity prices over longer period
SMP Government Stocks
US & EU have US & EU have now reinstated now reinstated
Export SubsidiesExport Subsidies
The world has entered its deepest financial and business crisis in more than 60 years
World industrial production
Source:Eichengreen and O'Rourke

5
…and the world trade collapse is steepWorld trade
Source:Eichengreen and O'Rourke
Recent economic headlines have been mostly dismal
Japan’s economy shrank a record 15.2% in the first quarter of 2009
Russia's economy contracted 9.5% in the first quarter of 2009
Europe’s economy contracted at the fastest pace in at least 13 years during Q1 2009 as companies cut output and jobs to survive
UK GDP fell by 1.9% Q1 2009 vs Q4 2008, the steepest quarterly decline in 30 yearsdecline in 30 years
6
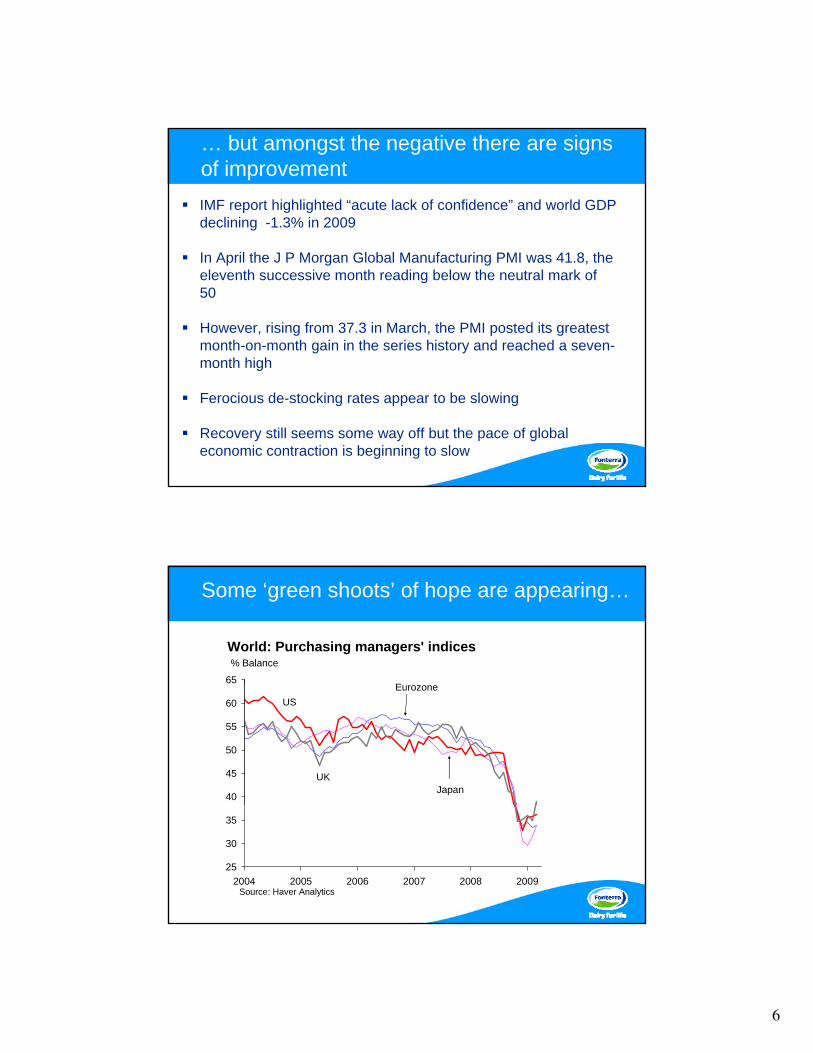
… but amongst the negative there are signs of improvementIMF report highlighted “acute lack of confidence” and world GDP declining -1.3% in 2009
In April the J P Morgan Global Manufacturing PMI was 41.8, the eleventh successive month reading below the neutral mark of 50
However, rising from 37.3 in March, the PMI posted its greatest month-on-month gain in the series history and reached a seven-month highmonth high
Ferocious de-stocking rates appear to be slowing
Recovery still seems some way off but the pace of global economic contraction is beginning to slow
Some ‘green shoots’ of hope are appearing…
65E
World: Purchasing managers' indices% Balance
40
45
50
55
60Eurozone
Japan
US
UK
25
30
35
2004 2005 2006 2007 2008 2009Source: Haver Analytics

7
…especially in China
65
US & China: Manufacturing surveysIndices
45
50
55
60China manufacturing PMIExpansion
Contraction
30
35
40
2005 2006 2007 2008 2009Source : Oxford Economics/Haver Analytics
US manufacturing ISM
These factors result in an uncertain and dynamic marketplace for our products
Today’s world is a very uncertain world
Key uncertainties continue around:
– milk production reduction in response to lower farm gate milk price
– the levels of demand recovery as retailer promotional activity and lower commodity prices begin to reach consumers
The global economic recession and increased government interventions still leaves uncertainty over the market and its implications on the dairy supply and demand balance

8
Global milk growth continues at a lower rate
Even with the combined impact of sluggish consumption, low milk prices and weather, 2008 global milk growth was still
2 0%+2.0%
We estimate 2009 global milk growth to be 0.8%
We estimate 2010 global milk growth to be 1.0%
Key drivers of milk growth remain:
– Domestic policy settings
– Trade access
– Currency relativities
The US accounted for >60% of dairy commodity export growth from 2005 to 2008
Variance (t)2005 vs. 2008
-200
,000
-100
,000
0 100,00
0
200,00
0
300,00
0
400,00
0
500,00
0
EU27N Z l dNew ZealandUnited States
AustraliaArgentina
Other EuropeBrazil
Other AsiaRussia
UruguayMalaysiaThailand
ChiChinaChile
CanadaIndia
MexicoSouth Africa
IndonesiaROW
Other Europe principally Ukraine and Belarus. Malaysia involves significant re-export.
9
Worldwide demand
Cheese consumption underpins the global dairy engine
Over the past decade, cheese has underpinned dairy consumption growth in Europe and USA
Declining cheese consumption has driven milk back intoDeclining cheese consumption has driven milk back into powder and butter pushing up stock holdings and putting pressure on prices
EU Cheese consumption growth has slowed and is flat at -0.05%, but signs of pick up are emerging on the back of retail promotions in some markets e.g. France and Germany
USA Ch ti th i 0 6% b t i fUSA Cheese consumption growth is -0.6% but signs of increased promotional activity are emerging which should help recover and stabilise consumption patterns
Consumer confidence is expected to remain weak through 2009, demand recovery is likely to be slow
Growth rates:12 months to end March 2009

10
In Europe, cheese consumption underpins EU market prices and production
European Milk Production & Cheese Consumption* Trends 2006-9
3 50%
4.00%Forecast
1.00%
1.50%
2.00%
2.50%
3.00%
3.50%
Ann
ual G
row
th %
* Cheese Consumption = Total Production + Imports – Exports
-1.00%
-0.50%
0.00%
0.50%
Jan-0
6
Apr-06
Jul-0
6
Oct-06
Jan-0
7
Apr-07
Jul-0
7
Oct-07
Jan-0
8
Apr-08
Jul-0
8
Oct-08
Jan-0
9
Apr-09
Jul-0
9
Oct-09
Milk Production growth % Cheese Consumption Growth %
French retail cheese sales have been recovering and are in positive growth territory
145,000 4%
125,000
130,000
135,000
140,000
Ret
ail S
ales
vol
ume
(1,0
00 k
g)
0%
1%
2%
3%
% G
row
th
115,000
120,000
Aug-06
Sep-06
Oct-06
Nov-06
Dec-06
Jan-0
7
Feb-07
Mar-07
Apr-07
May-07
Jun-07
Jul-0
7
Aug-07
Sep-07
Oct-07
Nov-07
Dec-07
Jan-0
8
Feb-08
Mar-08
Apr-08
May-08
Jun-0
8Ju
l-08
Aug-08
Sep-08
Oct-08
Nov-08
Dec-08
Jan-0
9
Feb-09
-2%
-1%
3m Rolling Volume (1,000 kgs) 12m Volume Growth % 3m Volume Growth vs Previous Year

11
US retail cheese consumption growth is negative, but price has assisted volume recovery
760
780
2%
3%
620
640
660
680
700
720
740
Ret
ail S
ales
Vol
ume
(mill
ion
lbs)
-4%
-3%
-2%
-1%
0%
1%
% G
row
th
* AC Nielsen Retail Scan Data
580
600
Aug-06
Sep-06
Oct-06
Nov-06
Dec-06
Jan-0
7
Feb-07
Mar-07
Apr-07
May-07
Jun-0
7Ju
l-07
Aug-07
Sep-07
Oct-07
Nov-07
Dec-07
Jan-0
8
Feb-08
Mar-08
Apr-08
May-08
Jun-0
8Ju
l-08
Aug-08
Sep-08
Oct-08
Nov-08
Dec-08
Jan-0
9
Feb-09
-6%
-5%
3m Rolling Volume (million lbs) 12m Volume Growth % 3m Volume Growth vs Previous Year
The demand sentiment is mixed
Dairy markets have been steady over recent weeks with no clear direction evident. After a flurry of sales activity the market has gone quiet - June US NFDM orders are not materialising for Dairy Am
International buyers really only have Northern hemisphere supply options through the short term and demand is not running hot
Sentiment is a mixed bag - some customers are reporting early signs of recovery while others have cash flow issues or remain over stocked
Sustained low pricing is supporting promotional activity and there’s evidence of increased A&P spend which should help
Seasonal and religious festival demand will hopefully assist in coming months

12
The pricing outlook is for gradual recovery in 2010
The outlook for the balance of 2009 has prices bouncing along in a trough
Evidence of a sustained supply side correction and demand recovery are required before prices re-bound
We expect a gradual recovery to emerge in 2010
Upsides: speedy supply side correction or shock; oil price recovery; corn price increase, emerging economic recovery; favourable weather patterns; water access issues
Downsides: lower prices fail to stimulate a demand rebound; tit for tat retaliatory action by the EU and the US; ‘toughing it out’ delays the supply side correction
Trends and their impact

13
Consumer trends
Unbalanced diet & obesity
Valuing food qualities
Time pressures
Older & younger age groups
Value for food dollar d groupsspend
The obesity burden is rising – the US is gaining weight fast but…
Source: Business Week - Inside Drugmakers' War on Fat, March 2008: Data on 30 pounds or more over weight

14
… this is not just a US problem
Source: OECD Factbook 2005 – Percentage of population older than 15 with a body-mass index greater than 30 (classified as obese)
Developing countries spend a greater portion of disposable income on food
Amount of disposable income spent on food at home
USDA Economic Research Service, 2005

15
More consumers are buying organic food
• Organic food sales are anticipated to increase an average of 18 percent each year from 2007 to 2010
Health and wellness trends are expected to grow
Euromonitor InternationalNote: Organic, Better for you and Naturally healthy products include food and beverages

16
…and the ‘premiumisation’ trend is still apparent
Premiumisation: consumers seeking better quality products, services and experiences across the board
Indulgence
Abundance of choiceEconomic growth
Key drivers:
Changing aspirationsRising affluence
Birth rates are higher in developing regions
World net birth rate percentages 2008
Source CIA World Factbook 2008

17
… and there is a growing older population
Proportion of the Population over 60 years of age
20
25
30
35
33
5
10
15
1950 19
55 1960 19
65 1970 19
75 1980 19
85 1990 19
95 2000 2005 2010 2015 2020 2025 2030 2035
2040
2045
2050
Customers are responding to these consumer trends
Unbalanced diet & obesity
Valuing food qualities
Time pressures
Older & younger age gro ps
Value for food dollar
Health & wellness offerings including functional foods
On-the-go & out-of-home eating offers
Differentiated flavours& textures
groupsspend
Reduced cost in useTargeted paediatric &
senior product offerings

18
Dairy offers innovative dairy solutions to consumer trends
Unbalanced diet & obesity
Valuing food qualities
N i di t & i
Time pressures
Older & younger age Value for food dollar
Protein ingredients with unique health & wellness benefits
New ingredients & processing systems that deliver
differentiated flavours & textures
Flexibility in product functionality
groupsspend
Unique health & wellness benefits
Specialised ingredients to address nutrition, digestion &
immunityCost effective ingredients,
processes & services
What does this mean for the dairy industry?

19
Current financial turmoil, medium term trend is expected to be positive
Demand for dairy will continue to grow, although rate of growth may be slower in short term
20
Recent re-introduction of subsidies in EU & US, longer term possibility of increased FTAs
Changing supply in dairy producing countries

21
Short term global stocks of dairy, possibility of longer term shortages
The impact of environmental issues will remain

22
Dairying in New Zealand & Fonterra
Today New Zealand is the most deregulated dairy industry in the world
• No subsidies • Dairy Industry Restructuring Act 2001 and Dairy Industry
Key Features Regulatory Framework
• Grass-based milk production• Scale• Temperate climate• Geographic isolation• Strict border controls and food
safety regulations
Act 2001 and Dairy Industry Restructuring Amendment Act 2007
• Removal of exclusive rights to export dairy products
• Supply milk to all who seek it • Open entry
• Herd quality • Open exit

23
Dairy farming in New Zealand has a long history
The Challenge….• Protein-based food and health building blocks become more important to an
ageing demographic and developing nations• Commodity profits attract increased world-wide investment• Vertical integration creates wealth• Global trade challenge moves from across borders to behind borders
Forecast CAGR 2004-2014
< 0%0% - 2.5%2.5% - 5.0%> 5.0%
LATAM +14
AME +14CN +52
EU +5
CIS/FSU +6
CA/US +7
PK/IN +22Forecast CAGR 2004-2014
< 0%0% - 2.5%2.5% - 5.0%> 5.0%
Forecast CAGR 2004-2014
< 0%0% - 2.5%2.5% - 5.0%> 5.0%
LATAM +14
AME +14CN +52
EU +5
CIS/FSU +6
CA/US +7
PK/IN +22
1960s – 1990s… “Diversify ahead of the pack”
• Land, labour and fuel prices increase on-farm costs over 60%• 24/7/365 days in the plants – shortage of on-farm labour
• Britain joins the EEU, introduction of UK butter quotas• Oil prices spike further; NZ subsidies disappear• Production capabilities develop globally, new markets develop
g
• July 2001, Fonterra is created• Moves from 19% of traded market in
1990, to 40% in 2007• Globally sourced product increases
from 30,000MT to 300,000MT with a projected supply gap of 1.5bn MT
• Partnering with the world’s leading dairy companies
1930s – 1960s… “Advances in Technology”
• The “Grasslands Revolution”• 18million acres cleared by hand - fired, and cleared from swamp, bush, and tussock land impacted by rabbit infestation
– average life expectancy 72yrs• Larger than the entire English pasture lands
• Waikato farmer Ron Sharp invents herringbone milking shed; artificial breeding introduced in 1951• Tankers collect wholemilk from 1951, and cooling of milk on-farm introduced in 1955• Consolidation - by the 1960s, the number of cooperatives had become 168
• 400+ cooperatives struggle to keep plants running
1800s – 1930s… “Pioneering grit”
• No cows, no land, no expertise
Dairy farming in New Zealand today
11,500 farms
4 million cows
Average farm size - 115 hectares
Average herd size - 337 cows
Average production per herd - 113,182 kgMS
Average production per cow - 330 kgMS
Average total capital value - NZ$3 3Average total capital value - NZ$3.3 million
Source: LIC New Zealand Dairy Statistics 2006-2007

24
Fonterra today
Co-operative owned by 10,900 supplier shareholders
Operating revenue of USD $14 billion
P d 2 9 illi t f d t llProduce 2.9 million tonnes of products annually
Export 96% of production to more than 140 markets around the world
Employ 16,400 people worldwide
Approximately 20% of New Zealand’s export earnings
Handles more than 40% of the world’s traded dairy commodities
Fonterra’s Trade Flow: 2000
Fonterra - evolving from New Zealand based exporter

25
… to a major global player
Fonterra’s Trade Flow: 2006
Global dairy consumption and trade
WorldTraded Internationally 7%
New ZealandConsumed
Domestically 4%
C d D ti ll 93%
Exported 96%
Consumed Domestically 93%

26
Worldwide supply
Fonterra’s Supply Outlook
Summer conditions proved challenging in key regions but great autumn weather helped most farmers’ cause
Follo ing recent cold eather the season has endedFollowing recent cold weather the season has ended earlier than forecast:– pasture growth has been restricted increasing herd dry
off rates– F09sn milk production is expected to reach ~ 1,280m
kgs milk solids or approx 15.1 billion litres, a record ilk th i ith th d ht ff t d– milk growth comparisons with the drought effected
F08sn are misleading
The outlook for F10 is for milk production to increase +2%

27
Fonterra milk collection is back on trackDaily Fonterra Milk Collection
80,000
30,000
40,000
50,000
60,000
70,000
Volu
me
(000
litr
es /
day)
2006-07 season actual 2007-08 season actual 2008-09 season actual
0
10,000
20,000
Jun Jul Aug Sep Oct Nov Dec Jan Feb Mar Apr May
LegendLegend
Australian supply outlook is for growth this season, but maybe not for the next season
F09 season has been characterised by:
– rain at the right times and in the right places
l ti l ild t t th h th d f 2008– relatively mild temperatures through the end of 2008
Australia's milk production is up 2.2% on last season (through March 09). Latest FYF is +2% to 9.4b litres.
Forecast lower average prices for F10 is influencing more farmers to keep milking later despite payout step downs
Availability has tightened after a strong sales campaign over recent months
Farmer confidence is mixed. Those with high debt levels particularly in the North Victoria are under pressure. Dairy Aust F10 forecast is 9.0b litres
28
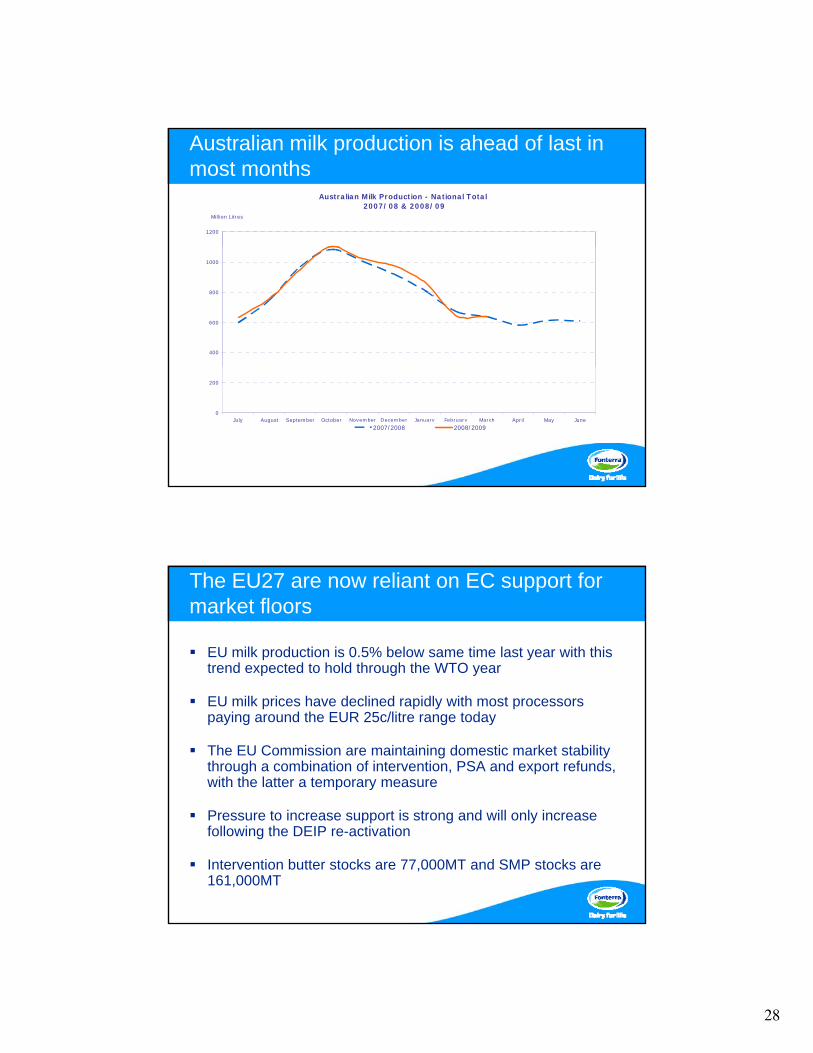
Australian milk production is ahead of last in most months
Australian Milk Production - National Total 2007/08 & 2008/09
1200
Million Litres
400
600
800
1000
0
200
July August September October November December January February March April May June
2007/2008 2008/2009
The EU27 are now reliant on EC support for market floors
EU milk production is 0.5% below same time last year with this trend expected to hold through the WTO year
EU milk prices have declined rapidly with most processors paying around the EUR 25c/litre range today
The EU Commission are maintaining domestic market stability through a combination of intervention, PSA and export refunds, with the latter a temporary measure
Pressure to increase support is strong and will only increase following the DEIP re-activation
Intervention butter stocks are 77,000MT and SMP stocks are 161,000MT

29
European milk prices have fallen away dramatically over recent months
45
50
25
30
35
40
Euro
Cen
ts p
er L
itre
EU Milk Management Committee Statistics May 20, 2009
20
25
Jan-06
Apr-06
Jul-0
6Oct-
06
Jan-0
7Apr-
07Ju
l-07
Oct-07
Jan-0
8Apr-0
8Ju
l-08
Oct-08
Jan-09
Germany France Ireland Netherlands EU25
The United States farmers are under significant pressure
US milk production is forecast to contract -0.3% in CY2009
CWT culling initiatives will assist but more is required - still too i th US h dmany cows in the US herd
CCC support for domestic school lunch and food bank programmes was a positive step, but the re-introduction of DEIP wasn’t
DEIP only encourages greater international market uncertainty, invites a response from the EU and doesn’t assist US dairymen
USDA’ tl k f CY2010 ilk d ti i f f th 0 5%USDA’s outlook for CY2010 milk production is for a further -0.5% reduction
How many dairymen are ‘toughing it out’ until September when prices are forecast to increase…….the slope of hope?

30
6 0%
7.0%
8.0%
The United States production surpluses have resulted in stock builds
Fluid : -0.5%
Fresh Dairy : -1.3%
Cheese : -0 6%
0 0%
1.0%
2.0%
3.0%
4.0%
5.0%
6.0%
Ann
ual G
row
th %
Cheese : -0.6%
Milk Production : +1.2%
-2.0%
-1.0%
0.0%
Jan-0
2Ju
l-02
Jan-0
3Ju
l-03
Jan-0
4Ju
l-04
Jan-0
5Ju
l-05
Jan-0
6Ju
l-06
Jan-0
7Ju
l-07
Jan-0
8Ju
l-08
Jan-0
9Ju
l-09
Milk Production Growth % Fluid Consumption Growth %Fresh Dairy Consumption Growth % Cheese Consumption Growth %
* Consumption = Total Production + Imports – Exports
For the Southern Cone, Argentina is unlikely to feature on export stage until later in 2009
Drought has impacted milk production in CY2009 with the latest forecast now 10.2b litres (+2% on 2008)
With a 20% structural surplus and milk prices aligned with international commodity levels, Argentina is well placed to compete on export markets
But a combination of factors has kept Argentine supply contained:– export activity into Brazil earlier in the year– good domestic consumption – and now drought impacted milk collection
Looking further ahead– the 5% export tax and government retentions are now removed– domestic demand may falter as economic conditions worsen– the Peso has devalued

31
With the Brazilian local market strong there is little incentive to overproduce
Drought in the south (Rio Grande del Sul) and lower milk prices paid to farmers is forecast to hold milk production flat at 29b litres (vs +4% in 2008)
Drought and strong domestic demand meant imports from Argentina and Uruguay were required to cover the deficit
Brazilian milk prices remain above world market levels which should limit exports until at least early 2010 p y
While marginal milk can be turned on or off very quickly the high milk price is a disincentive even with a weaker Brazilian Real.
In China, despite high Chinese stocks import demand remains robust
Local milk powder stocks are building – some reports suggest anywhere from 100k to 300k MT is in store without a home -though 100 to 150k MT is probably more realistic
Stocks of local WMP are unlikely to have a major impact on imported WMP demand or the global market– domestic stock will deteriorate as it ages and summer
arrives– what can be re-worked for fresh applications will be– likely to be used as domestic aid in poor areas– likely to be used as domestic aid in poor areas– Government may provide subsidies to manufacturers and
allow them to write off the value and use in feed applications

32
Thank you
Thank you


