
Presentation to Kansas 3R Legislative Committee - JFA … · 2011-08-18 · Presentation to Kansas...
24
April 1, 2005 1 Presentation to Kansas 3R Legislative Committee First Review of the Data: Emerging Opportunities Dr. Tony Fabelo Angie Gunter The JFA Institute Eric Cadora Charles Swartz Justice Mapping Center at JFA Institute and Columbia University
-
Upload
truongkhue -
Category
Documents
-
view
213 -
download
0
Transcript of Presentation to Kansas 3R Legislative Committee - JFA … · 2011-08-18 · Presentation to Kansas...

April 1, 20051
Presentation to Kansas 3R
Legislative Committee
First Review of the Data:
Emerging Opportunities
Dr. Tony Fabelo
Angie Gunter
The JFA Institute
Eric Cadora
Charles Swartz
Justice Mapping Center at JFA Institute and
Columbia University

April 1, 20052
Overview of December 8, 2004 Site Visit
• Framework of Tough and Smart
Policies in Place
• Framework Under Pressure
• Opportunities to Strengthen
Framework

April 1, 20053
Collection Now of More In-Depth Data
Sentencing Commission
Probation Placement and
Revocation
DOC
Inmate Admissions
and Releases
P1: July 1 to Dec. 31, 2003
P2: Jan. 1 to June 30, 2004
P3: July 1 to Dec. 30, 2004
18 Month Period
Mapping Data
Census, DOC, TFA,
Food Stamps, Medicaid
Trends, profile of revocations, and mapping analyses

April 1, 20054
Overview Today
• Prison Population Trends
• Use of Prison as Intermediate Sanction
• Window of Opportunity
�To Consider Model to Reduce Revocations to Prison
�To Consider Building Community Capacity to Increase Public Safety
�Eric Cadora – Mapping Analysis

April 1, 20055
Fluctuations in Prison Population
End-of-month Inmate Population
9,026
8,977
8,938
8,991
9,047
9,0809,158
9,143
9,119
9,181
8,800
8,850
8,900
8,950
9,000
9,050
9,100
9,150
9,200
June
04
July
04
Aug
. 04
Sept
. 04
Oct
. 04
Nov
. 04
Dec
. 04
Jan.
05
Feb.
05
Mar
05
Source: KDOC, Statistical Report, February 2005;
March population as of March 25

April 1, 20056
Decline in Prison Admissions
- 399-6.7%Change 03-05
5,631*469FY 2005*
5,934495FY 2004
6,030503FY 2003
Annual
Admissions
Average Monthly
AdmissionsPeriod
Source: KDOC, Statistical Report, February 2005
* July 2004 to February 2005, extrapolated for the year.
All types of admissions have declined

April 1, 20057
Probation Numbers Have Declined
3,1787,063Total
44%
44%
46%
% Revoked
to Prison
-22.3%-19.3%% Change
8942,0142nd 6 months 04
1,1342,5531st 6 months 04
1,1502,4962nd 6 months 03
Revoked to
Prison
Probation
Revocation
Hearings
Period
Source: Analysis of Sentencing Commission data by JFA
Decline in probation placements across offenses, counties and severity levels
10,071
-16.6%
2,940
3,607
3,524
Placements
to
Probation

April 1, 20058
Treatment Placements Increasing
Total
2nd 6 months 04
1st 6 months 04
2nd 6 months 03
Period
735
371
343
21
SB 123
Probation
Placements Issue to Monitor
Is program effective in
reducing recidivism?
More time needed to
track impact
Source: Analysis of Sentencing Commission data by JFA

April 1, 20059
Prison Population Projection
*Kansas Sentencing Commission, Fiscal Year 2005 Adult Inmate
Prison Population Projections, September 2004, page 21

April 1, 200510
Overview Today
• Prison Population Trends
• Use of Prison as Intermediate Sanction
• Window of Opportunity
�To Consider Model to Reduce Revocations to Prison
�To Consider Building Community Capacity to Increase Public Safety
�Eric Cadora – Mapping Analysis

April 1, 200511
Significant Number of Revocations
Admissions
8,598
New Commitments
2,144 (25%)
Probation Revocations
2,763 (32%)
Parole Revocations
3,603 (42%)
Other Admissions
88 (1%)
July 1, 2003 to Dec. 30,2004
Admissions for 18 Month Period
Source: Analysis of DOC data by JFA
Conditions Violations
2,538 (91.9%)
Conditions Violations
3,335 (92.6%)
Conditions Violations
5,87368% of all admissions

April 1, 200512
Using Prisons for Intermediate Sanctions
Parole Revocations
3,603 (42%)
July 1, 2003 to Dec. 30,2004
Most Serious Offense
Property, Drug, DUI
1,168 (35%)
Conditions
Violations
3,335 (92.6%)
Admitted More Than One Time
886
(26.5%)
Close to 88% of the parolees with conditions
violations will serve 6 months or less
DOC data analysis

April 1, 200513
Probation Revocations
Probation Revocations to
Prison
2,763
Revocations for Conditions
Violations Only
2,538 or 91.9% of probation
revocations to prison
42% one reason
21% two reasons
42% Failure to Report
30% Failed Drug Test
22% Failure to Pay Fines
Probation revocations to prison from AOC data and reasons for revocation
from Sentencing Commission data
April 1, 200514
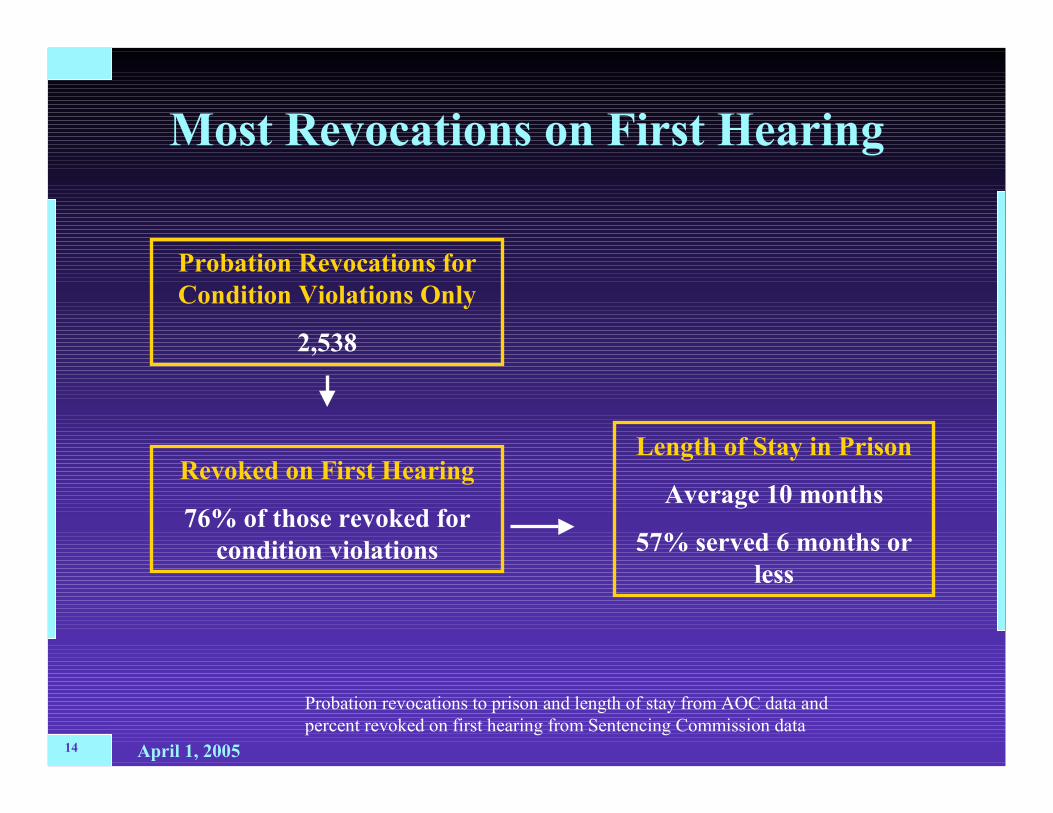
Most Revocations on First Hearing
Probation Revocations for
Condition Violations Only
2,538
Revoked on First Hearing
76% of those revoked for
condition violations
Probation revocations to prison and length of stay from AOC data and
percent revoked on first hearing from Sentencing Commission data
Length of Stay in Prison
Average 10 months
57% served 6 months or
less
April 1, 200515
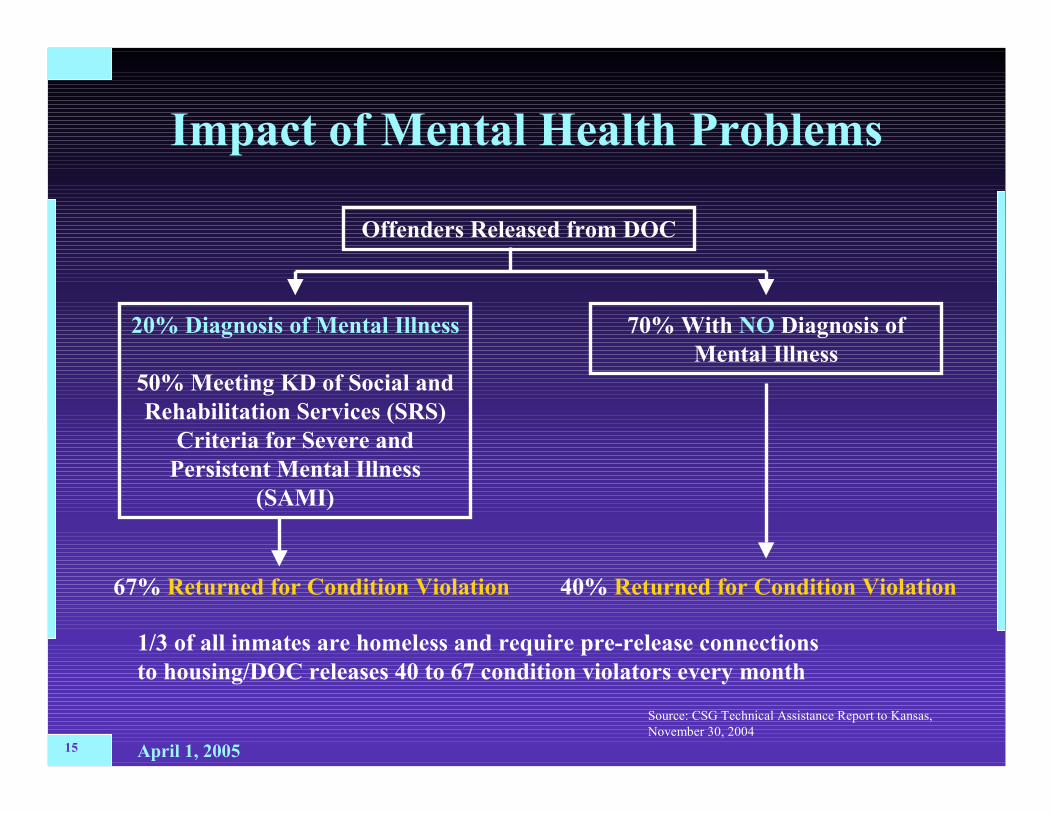
Impact of Mental Health Problems
Offenders Released from DOC
20% Diagnosis of Mental Illness
50% Meeting KD of Social and
Rehabilitation Services (SRS)
Criteria for Severe and
Persistent Mental Illness
(SAMI)
70% With NO Diagnosis of
Mental Illness
67% Returned for Condition Violation 40% Returned for Condition Violation
1/3 of all inmates are homeless and require pre-release connections
to housing/DOC releases 40 to 67 condition violators every month
Source: CSG Technical Assistance Report to Kansas,
November 30, 2004

April 1, 200516
Overview Today
• Prison Population Trends
• Use of Prison as Intermediate Sanction
• Window of Opportunity
�To Consider Model to Reduce Revocations to Prison
�To Consider Building Community Capacity to Increase Public Safety
�Eric Cadora – Mapping Analysis
April 1, 200517
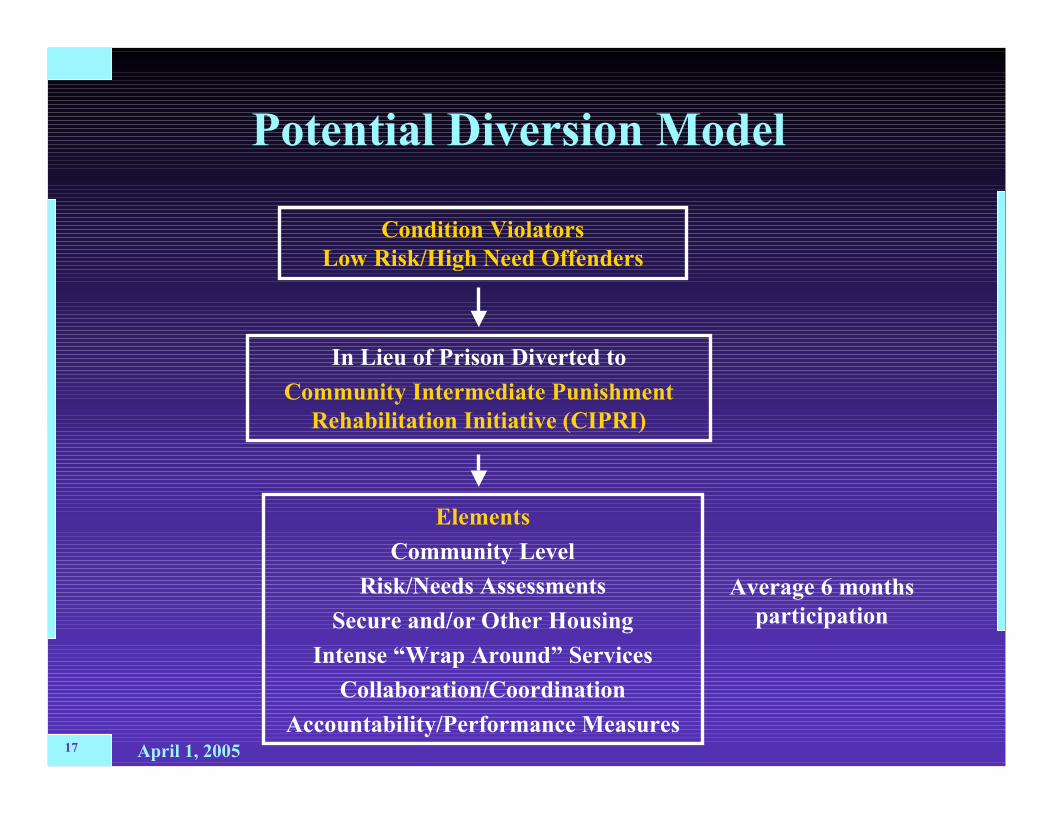
Potential Diversion Model
In Lieu of Prison Diverted to
Community Intermediate Punishment
Rehabilitation Initiative (CIPRI)
Condition Violators
Low Risk/High Need Offenders
Elements
Community Level
Risk/Needs Assessments
Secure and/or Other Housing
Intense “Wrap Around” Services
Collaboration/Coordination
Accountability/Performance Measures
Average 6 months
participation

April 1, 200518
Prison Cost of Potential Diversion Group
Probation Revocations/Conditions
30% of 2,538
= 761
Parole Revocations/Conditions
30% of 3,335
= 1,000
Assumption: 30% of Conditions Violators Low Risk/High Need
10 Months (300 Days) in Prison at
$52.17 per day
= $11,910,411
6 Months (180 Days) in Prison
at $52.17 per day
=$9,390,600
1,761 Offenders = $21,301,011
LOS Prison Cost

April 1, 200519
Potential Prison Recidivism Cost
Condition Violators
Low Risk/High Need Offenders
1,761 Offenders
Assumption (No Data Available)
20% Will Recidivate to Prison with a New Sentence
Three Years After Release
352
Cost of Staying in Prison for Average of 4.6 Years (55.4 Months)*
$30,520,702
*Average calculated by Sentencing Commission

April 1, 200520
Scenario Comparing Costs
$41,909,326$51,822,713Total Cost
$22,890,526$30,520,702Recidivism LOS
Prison Cost
15%20%Three Year
Recidivism Rate
$19,018,800$21,301,011LOS Cost
6 Months10 Months Probationers
6 Months ParoleesLOS
$60.00$52.17Cost-Per-Day
1,7611,761Offenders Served
CIPRIStatus Quo

April 1, 200521
Potential Benefits
• Cost Avoidance/Savings for Group
� $9,913,387
� Higher cost avoidance if costs-per-day are less and/or recidivism reduction is better and vice versa
• Annualized Prison Capacity Impact
� Approximately 750 beds available for other uses
� Assumption that no facilities will be closed
• Prison Management Perspective
� Prison case workers and pre-release staff can concentrate on longer term offenders
� More classification/program flexibility by operating at lower capacity level
• Public Safety
� Lower recidivism for group diverted
� Community capacity to address local problems

April 1, 200522
Cost Avoidance Per 100 Offenders
100
Condition Violators
Low Risk/High Need Offenders
(43 Probationers/57 Parolees)
Prison CIPRI
Prison LOS Cost
$1,208,257
Recidivism LOS Cost
$1,734,131
Total
$2,942,388
LOS Cost
$1,080,000
Recidivism LOS Cost
$1,300,598
Total
$2,380,598
$561,790 in Cost
Avoidance for
Every 100
Offenders
Diverted to
CIPRI

April 1, 200523
Overview Today
• Prison Population Trends
• Use of Prison as Intermediate Sanction
• Window of Opportunity
�To Consider Model to Reduce Revocations to Prison
�To Consider Building Community Capacity to Increase Public Safety
�Eric Cadora – Mapping Analysis

April 1, 200524
Thank You