Presentation to Fully Developed Suburbs Meeting Metropolitan Council Myron Orfield 7/15/2013
126
Presentation to Fully Developed Suburbs Meeting Metropolitan Council Myron Orfield 7/15/2013
description
Presentation to Fully Developed Suburbs Meeting Metropolitan Council Myron Orfield 7/15/2013. Fair Housing Equity Assessment (FHEA) Opportunity Clusters. Northwest Minneapolis Suburban School Demographics. Northwest Minneapolis Suburbs Race and Ethnicity 1995-2013. - PowerPoint PPT Presentation
Transcript of Presentation to Fully Developed Suburbs Meeting Metropolitan Council Myron Orfield 7/15/2013

Presentation toFully Developed Suburbs Meeting
Metropolitan Council
Myron Orfield7/15/2013

Fair Housing Equity Assessment (FHEA)Opportunity Clusters

Overall Characteristics of the Opportunity Clusters (from the FHEA Analysis)
Cluster
Moderate Access to Jobs, ServicesAverage School PerformanceModerate Exposure to PollutantsModerate Crime RatesRacially Integrated, but in transition
Low Access to Jobs, ServicesAbove Average School PerformanceLow Exposure to PollutantsLow Crime RatesStill Largely White but increasing in diversity
High Access to Jobs, ServicesBelow Average School PerformanceHigh Exposure to PollutantsHigh Crime RatesLargely Non-white
Low Access to Jobs, ServicesAbove Average School PerformanceLow Exposure to PollutantsLow Crime RatesLargely White


Selected Characteristics of the Opportunity Clusters (from the FHEA Analysis)
%Total Poverty
Cluster Tracts Population Rate White Black Hispanic Asian Other
208 780,026 26 68 11 8 9 4319 1,481,405 13 84 4 4 5 3133 403,730 45 54 21 11 8 5
44 182,371 11 94 1 2 2 2
704 2,847,532 21 76 8 6 6 3
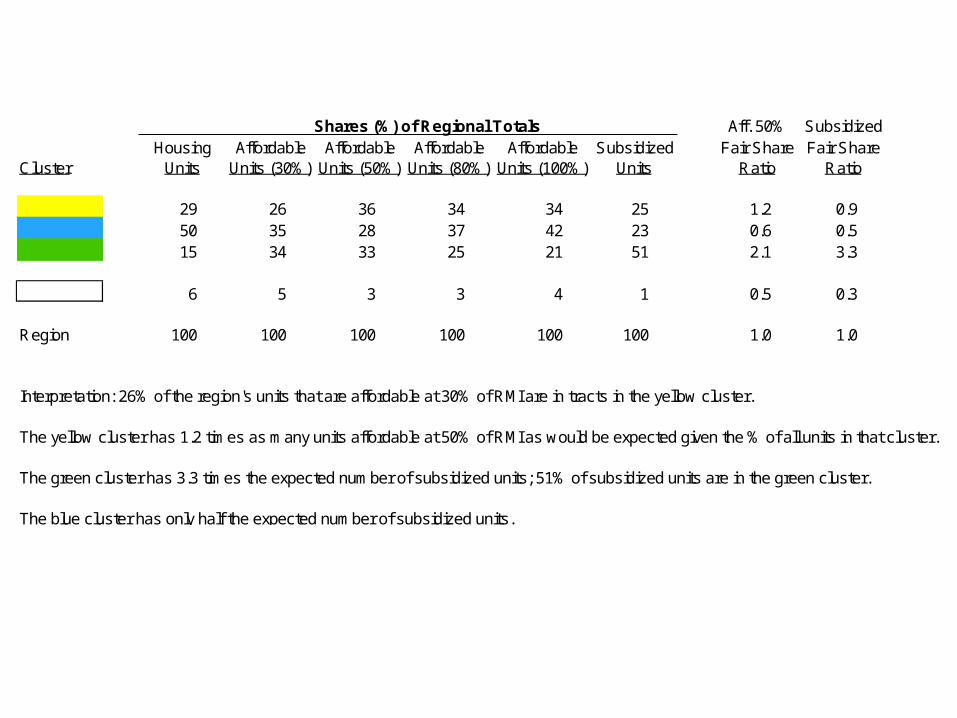
Shares (%) of Regional Totals Aff. 50% SubsidizedHousing Affordable Affordable Affordable Affordable Subsidized Fair Share Fair Share
Cluster Units Units (30%) Units (50%) Units (80%) Units (100%) Units Ratio Ratio
29 26 36 34 34 25 1.2 0.950 35 28 37 42 23 0.6 0.515 34 33 25 21 51 2.1 3.3
6 5 3 3 4 1 0.5 0.3
Region 100 100 100 100 100 100 1.0 1.0
Interpretation: 26% of the region's units that are affordable at 30% of RMI are in tracts in the yellow cluster.
The yellow cluster has 1.2 times as many units affordable at 50% of RMI as would be expected given the % of all units in that cluster.
The green cluster has 3.3 times the expected number of subsidized units; 51% of subsidized units are in the green cluster.
The blue cluster has only half the expected number of subsidized units.
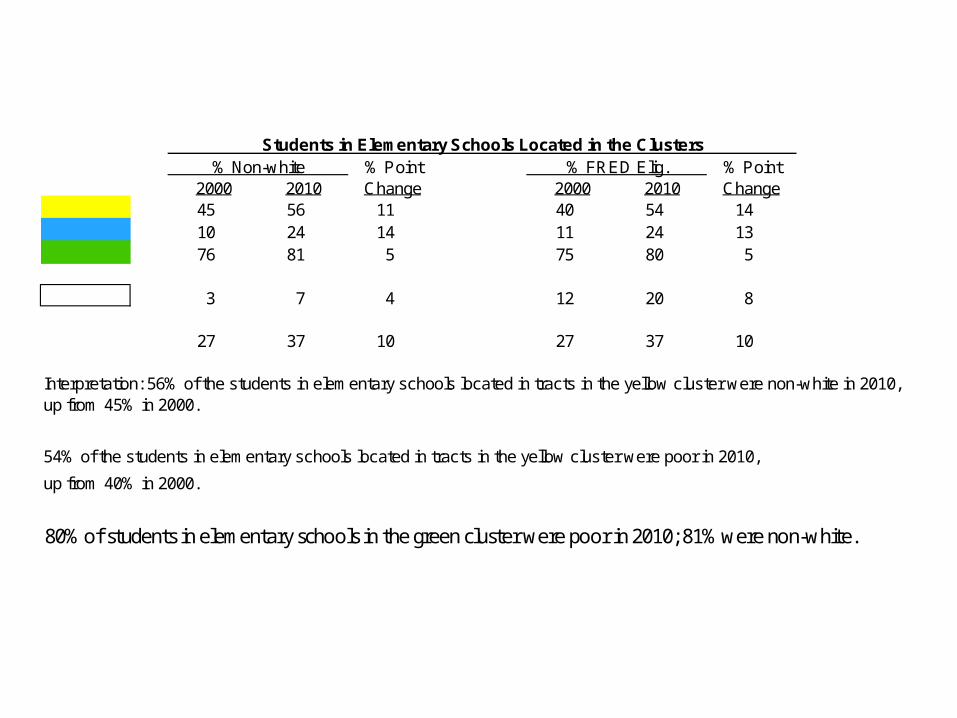
Students in Elementary Schools Located in the Clusters% Non-white % Point % FRED Elig. % Point
2000 2010 Change 2000 2010 Change45 56 11 40 54 1410 24 14 11 24 1376 81 5 75 80 5
3 7 4 12 20 8
27 37 10 27 37 10
Interpretation: 56% of the students in elementary schools located in tracts in the yellow cluster were non-white in 2010,up from 45% in 2000.
54% of the students in elementary schools located in tracts in the yellow cluster were poor in 2010,
up from 40% in 2000.
80% of students in elementary schools in the green cluster were poor in 2010; 81% were non-white.

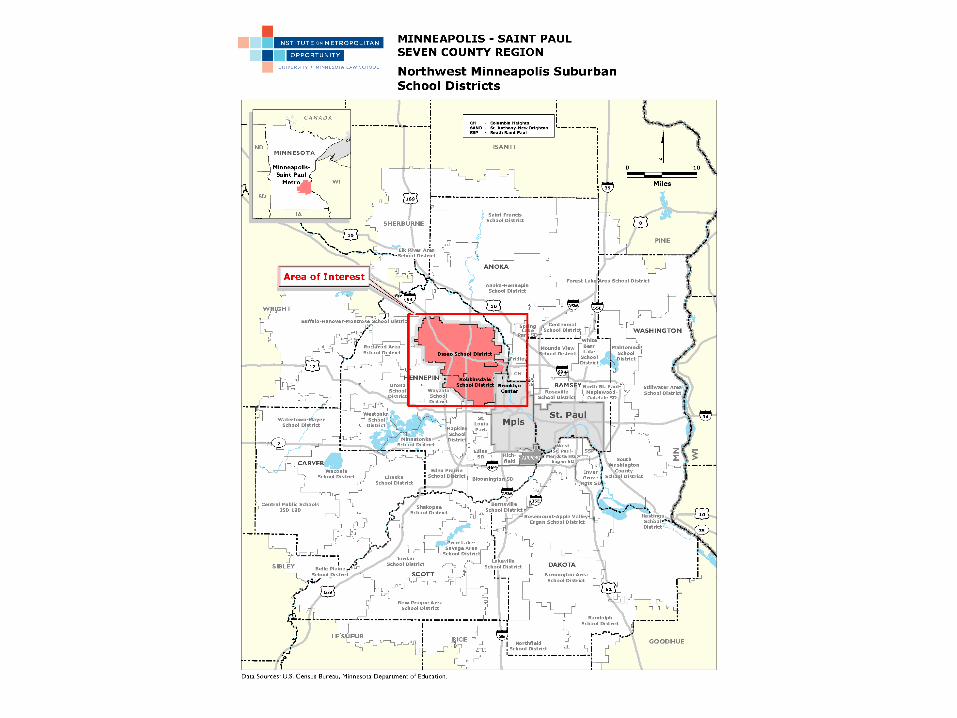
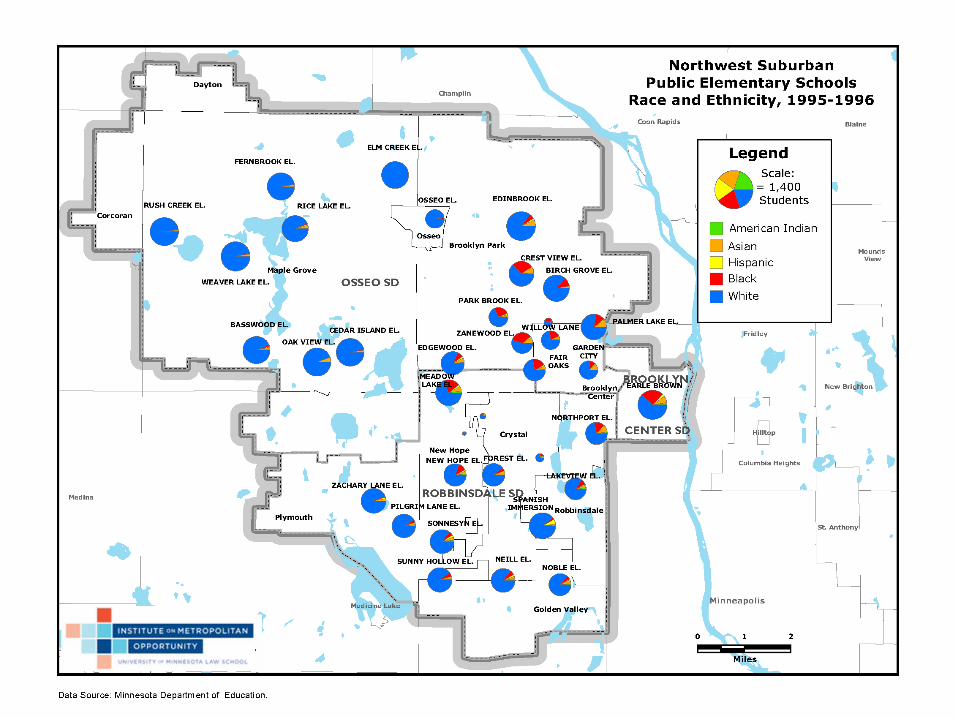
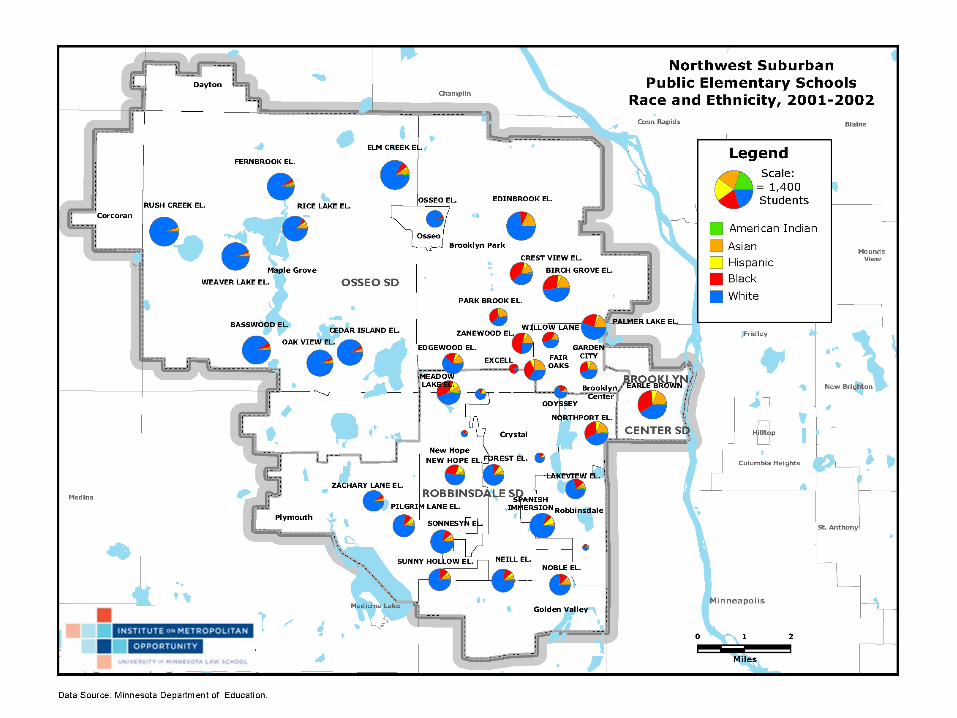
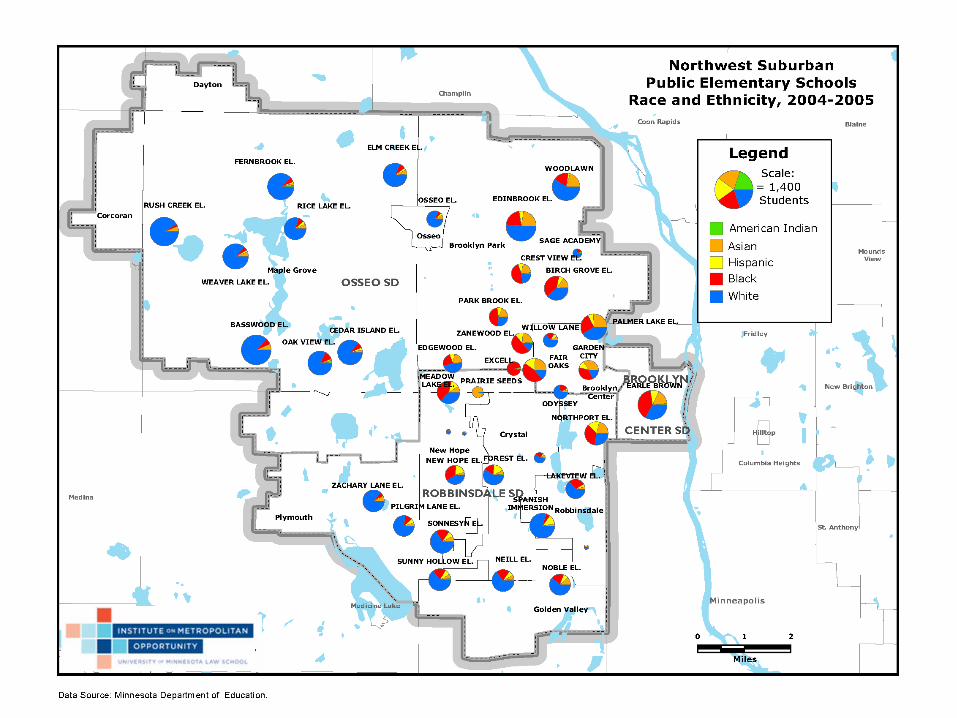
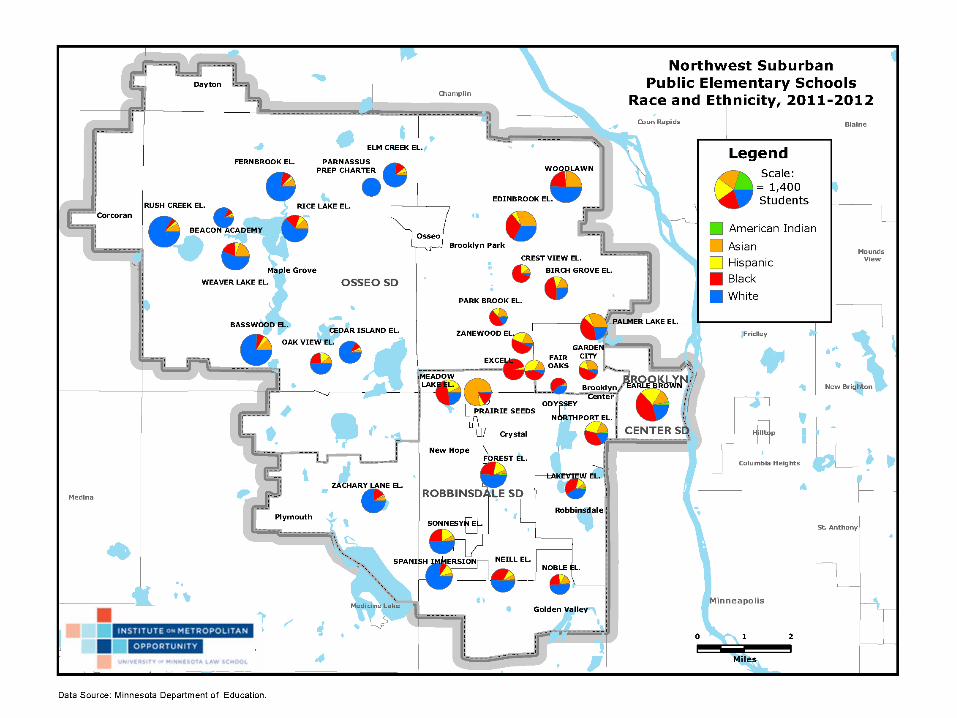
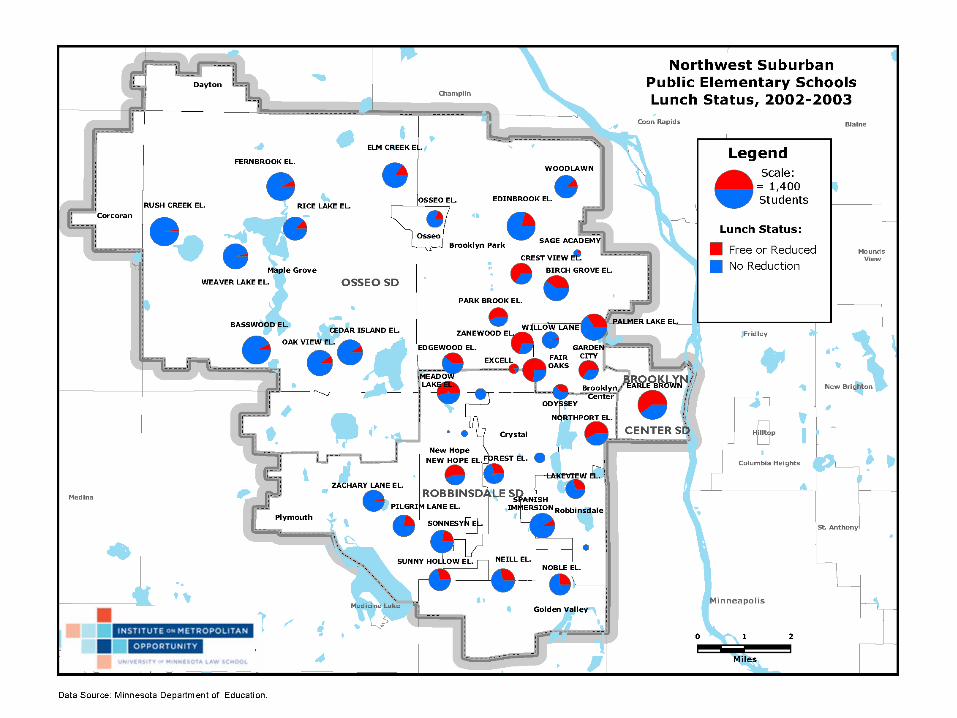
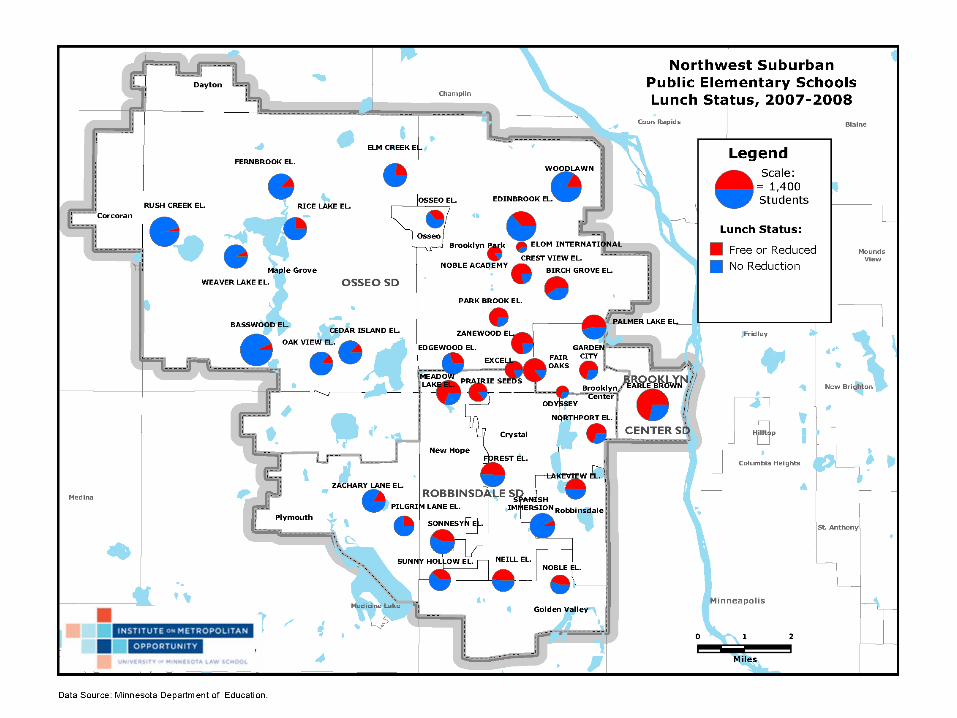
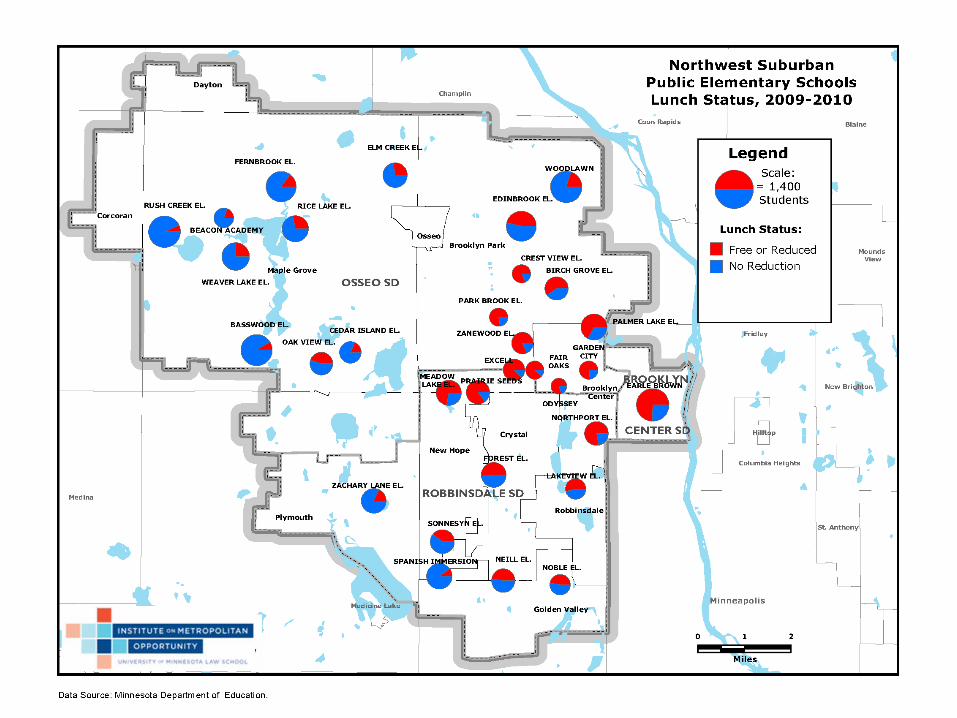
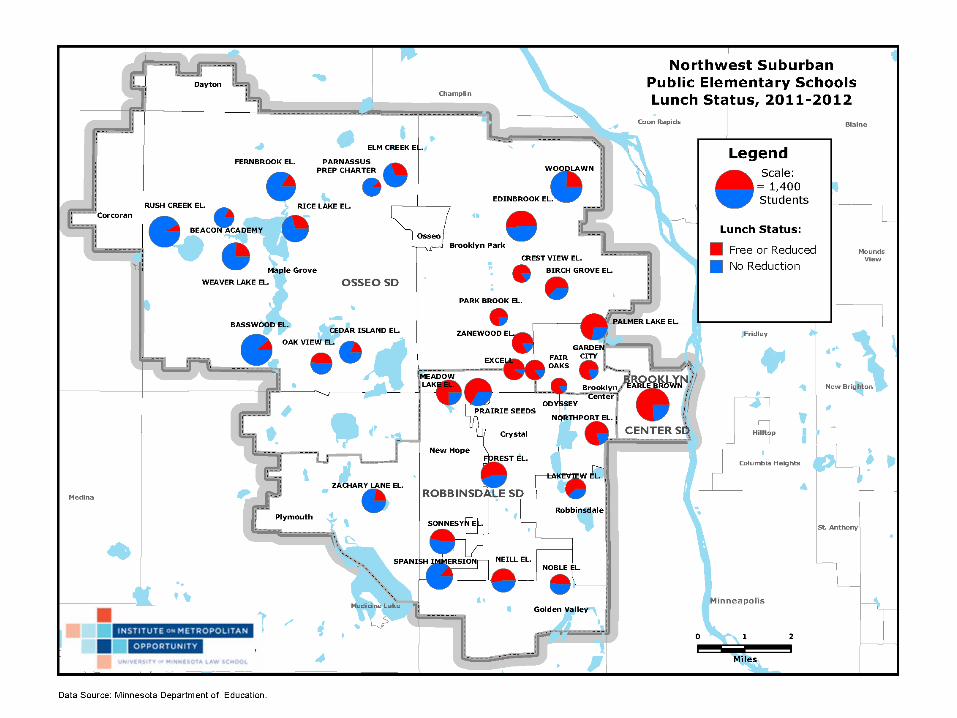
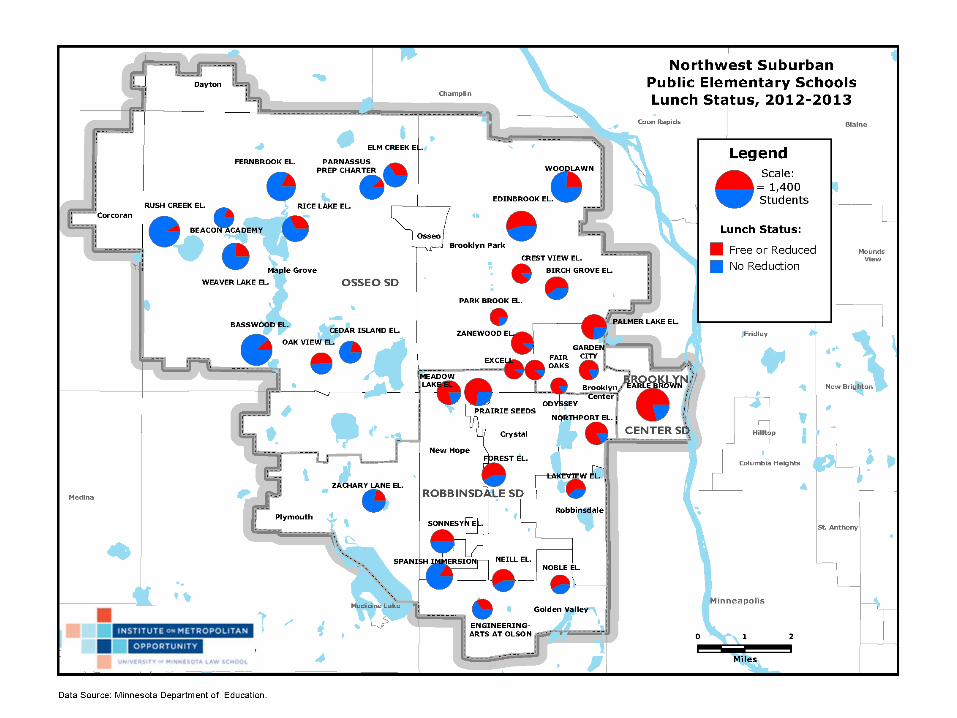
Northwest Minneapolis Suburban School
Demographics
Northwest MinneapolisSuburbs
Race and Ethnicity1995-2013


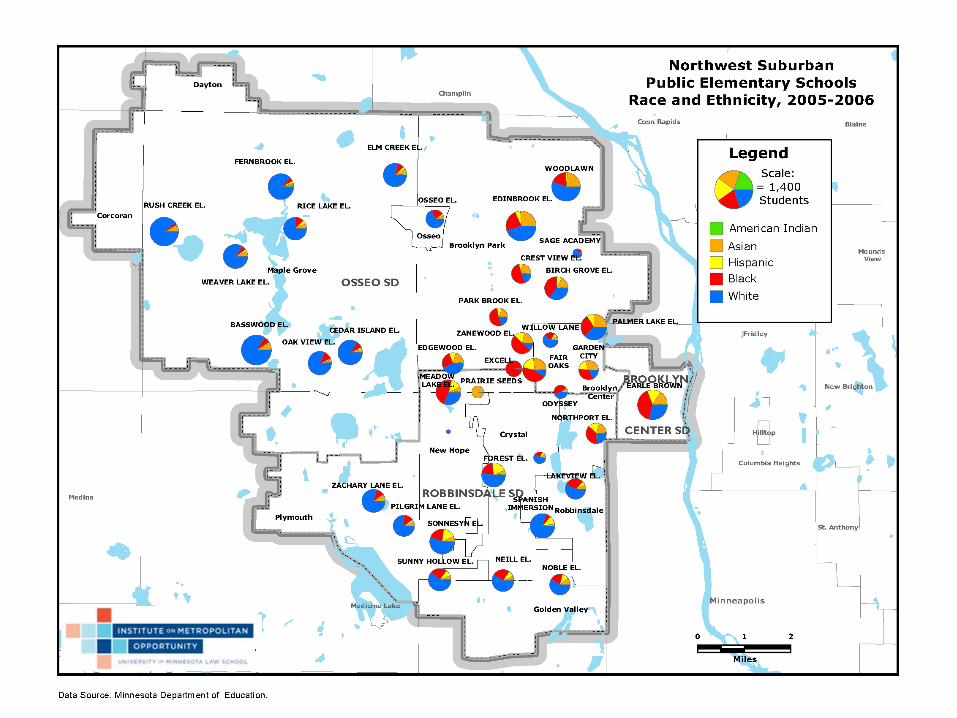


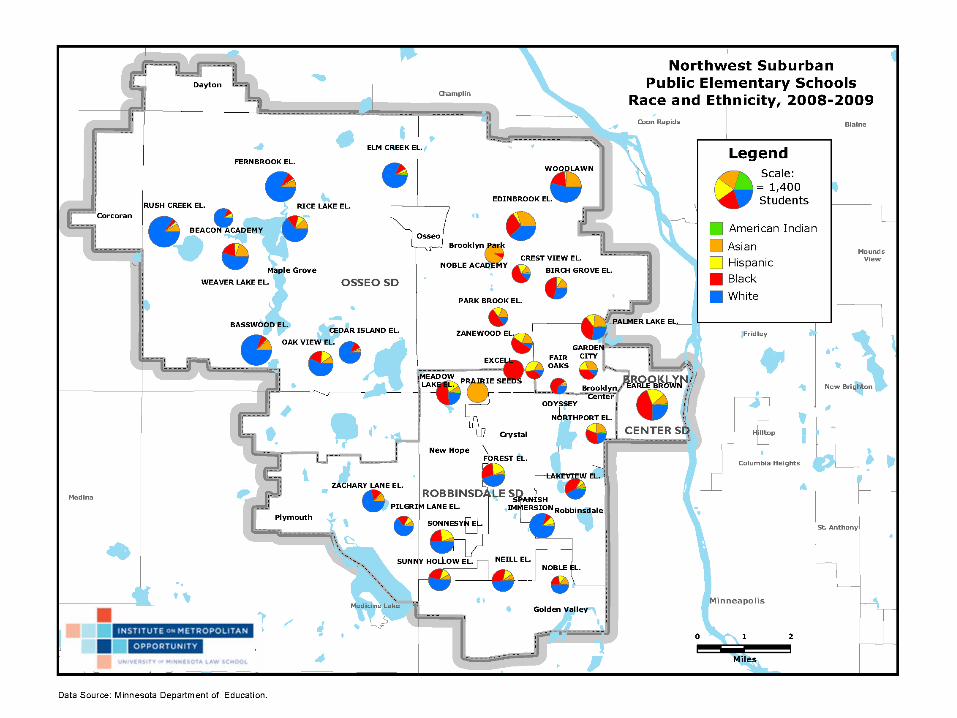
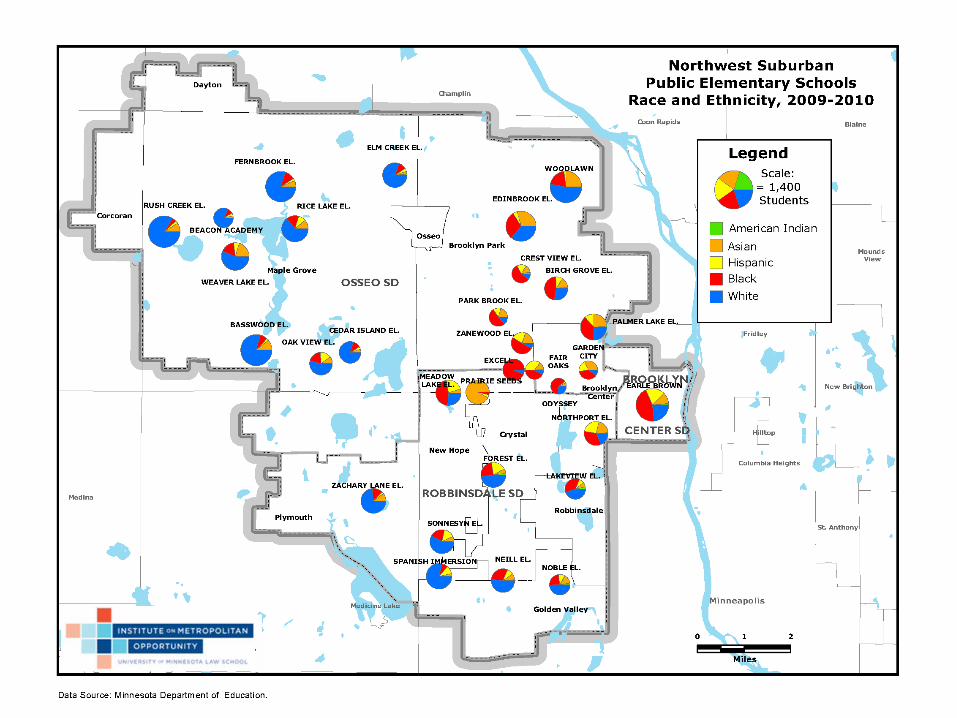
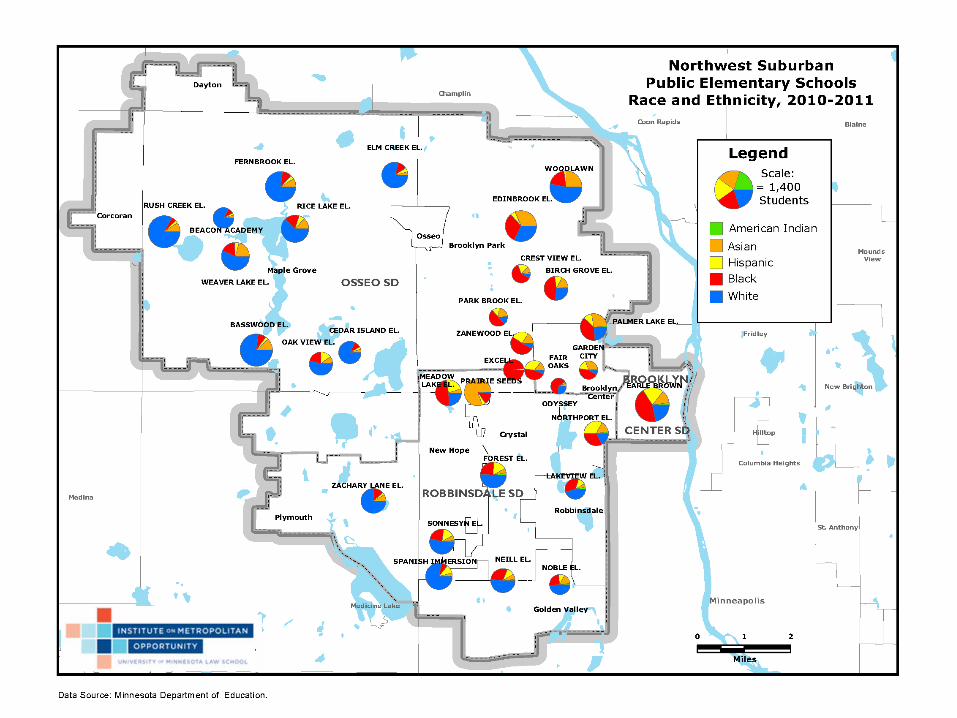

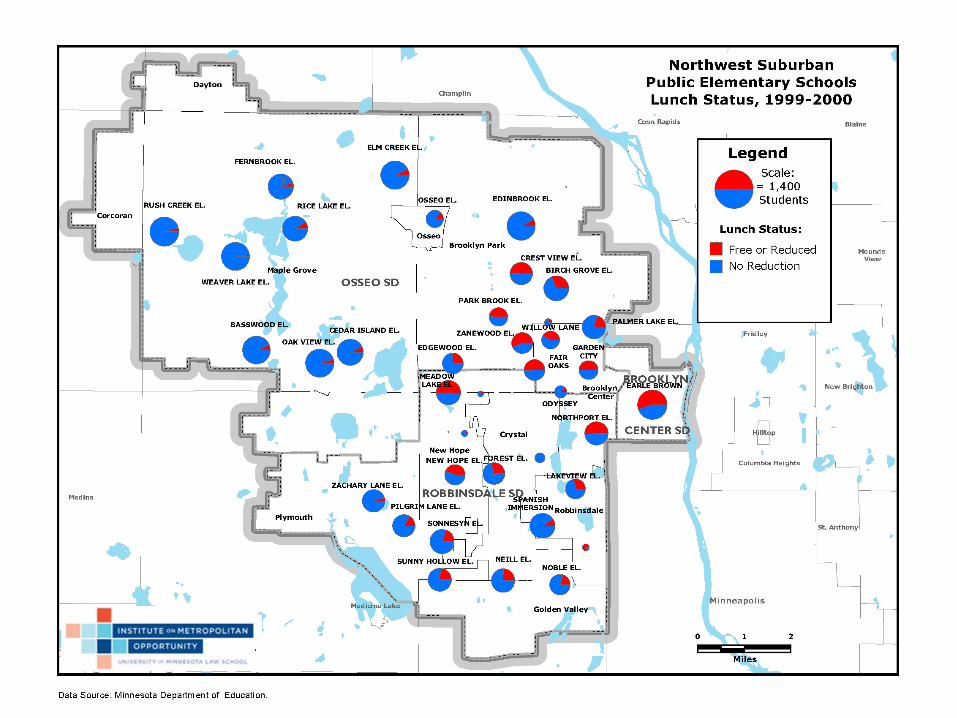
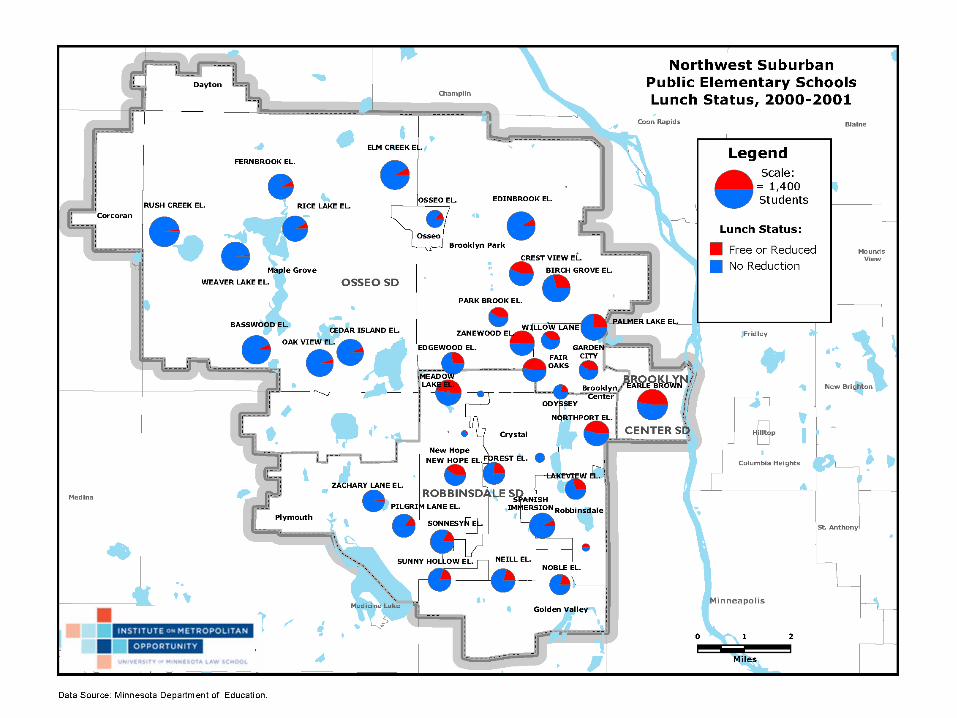
Northwest MinneapolisSuburbs
Free Lunch Eligibility1997-2013


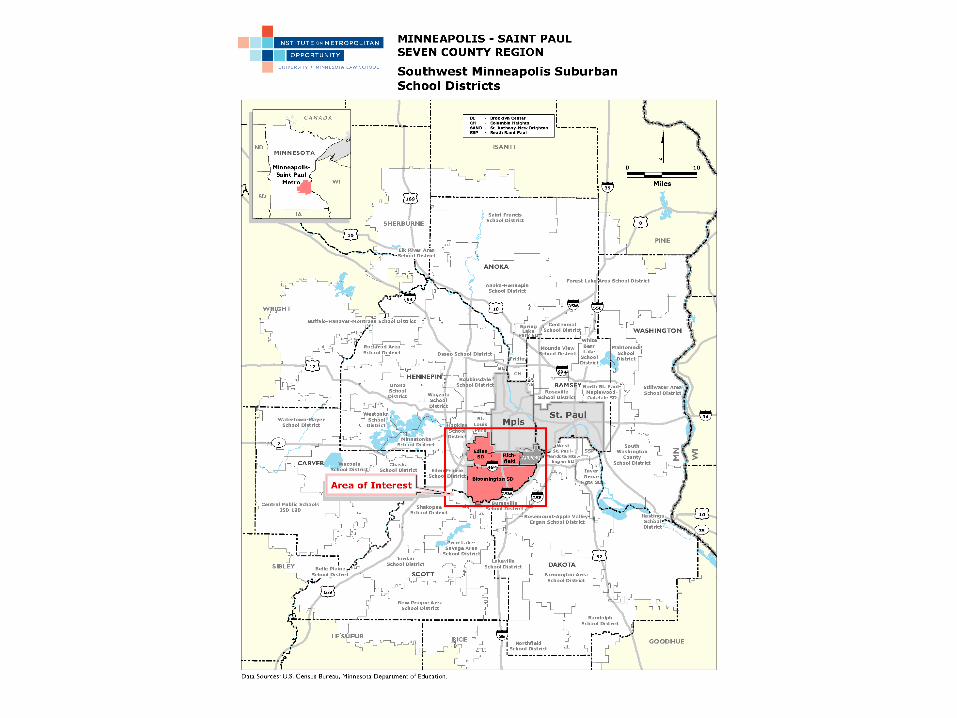
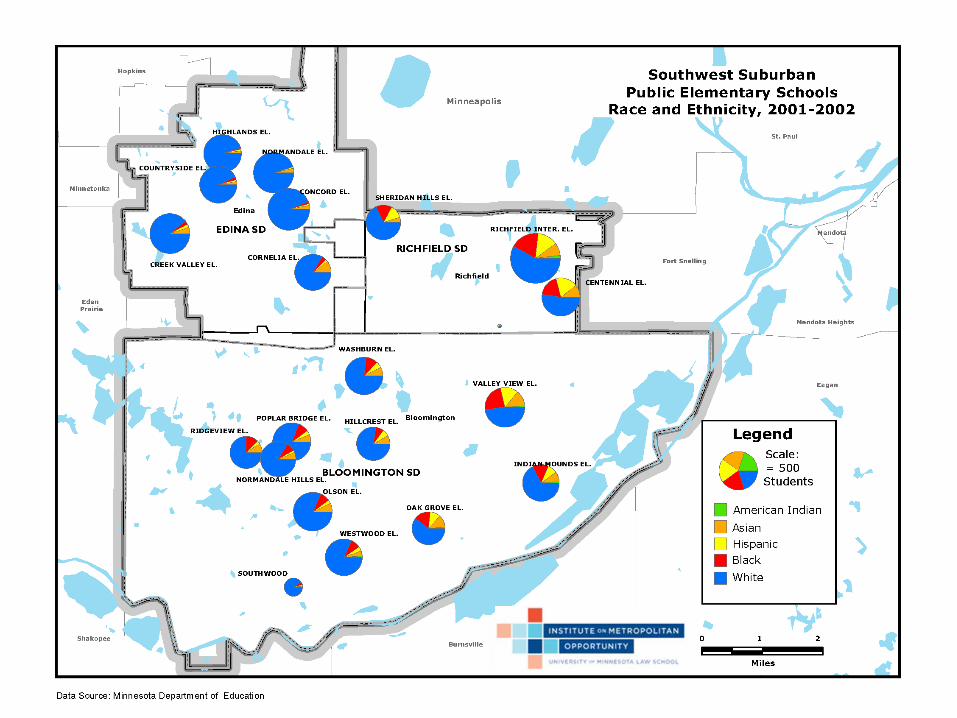
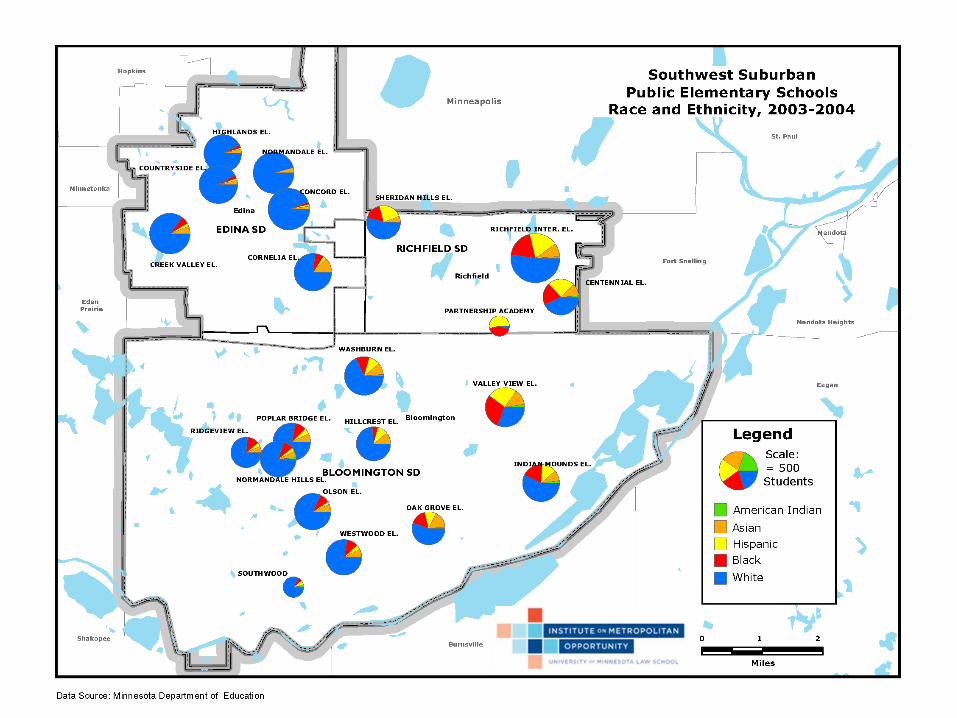
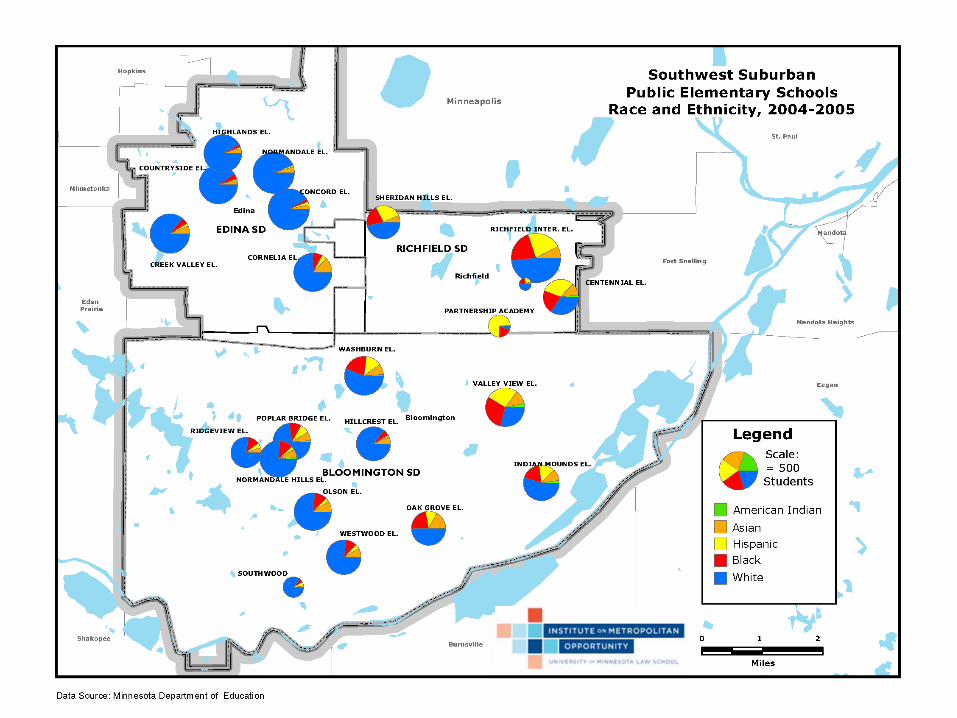
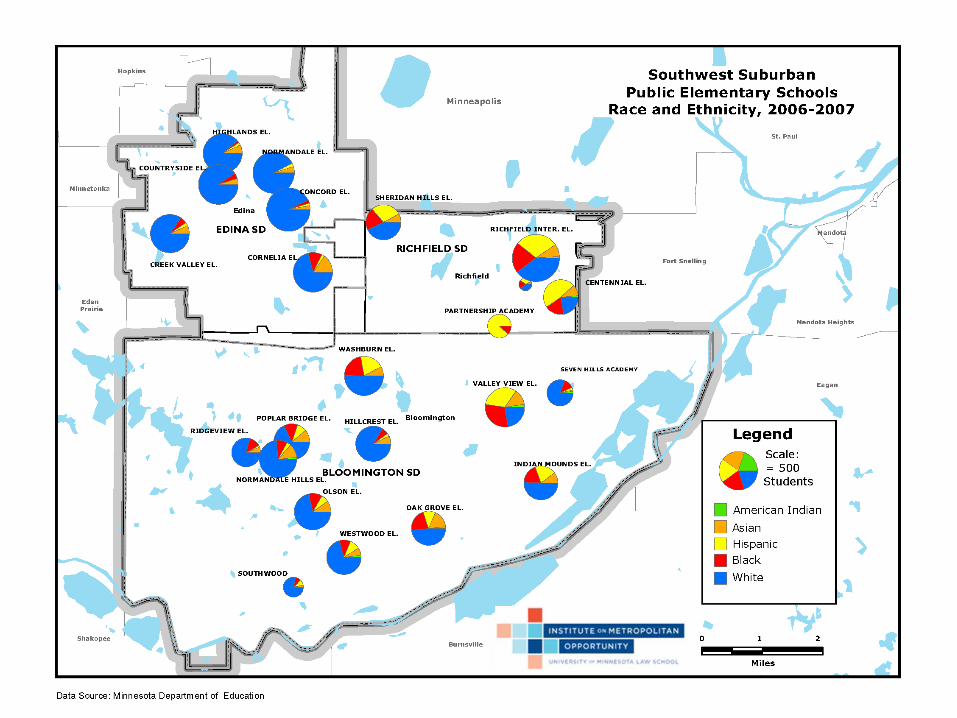
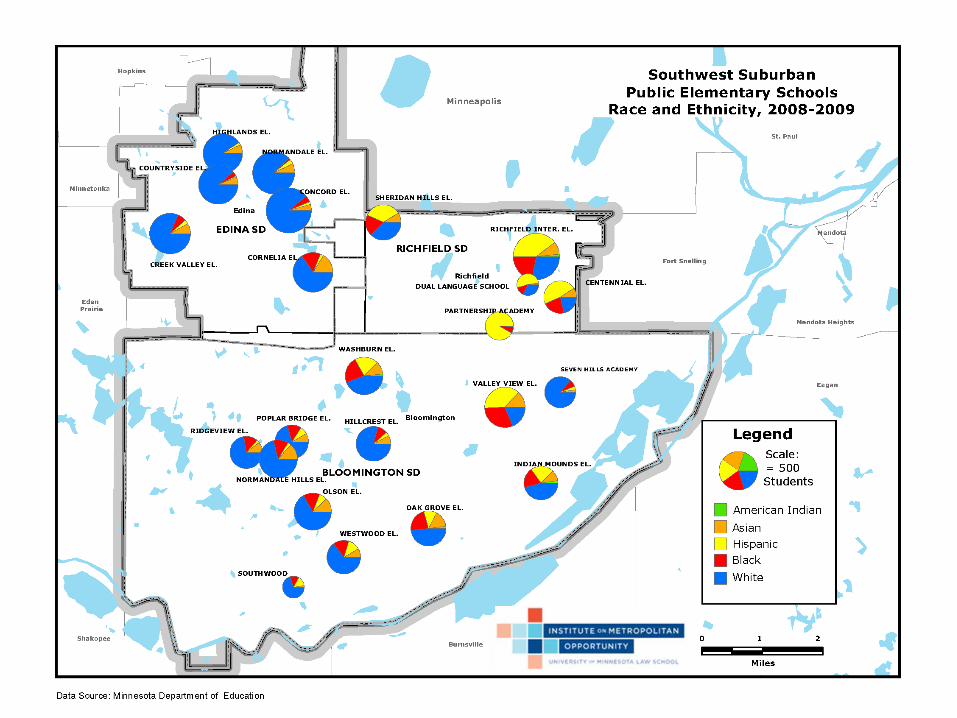
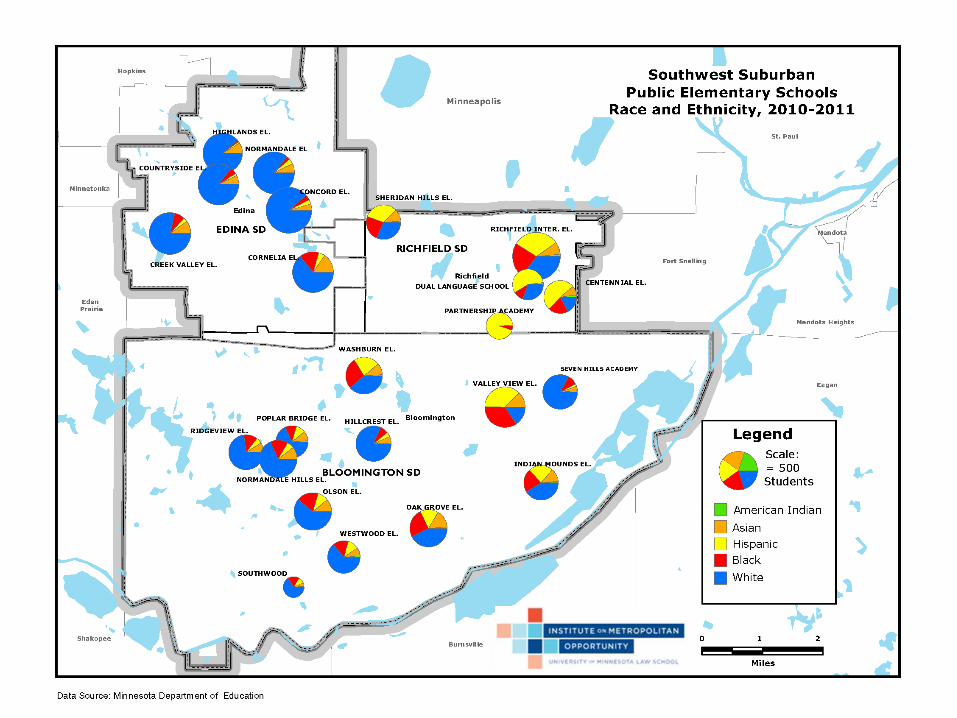
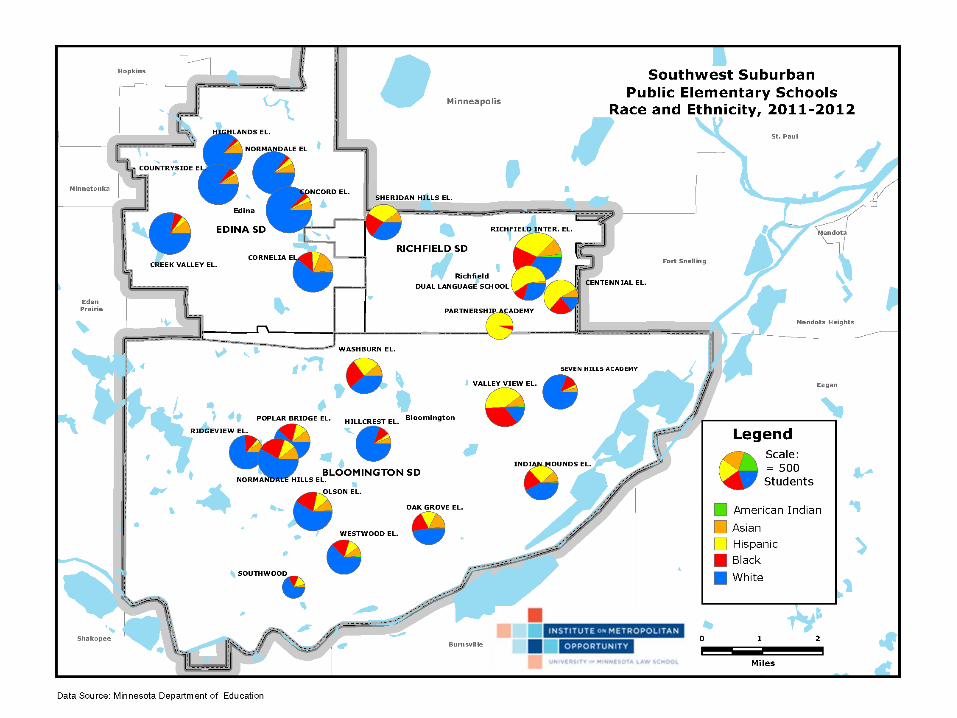
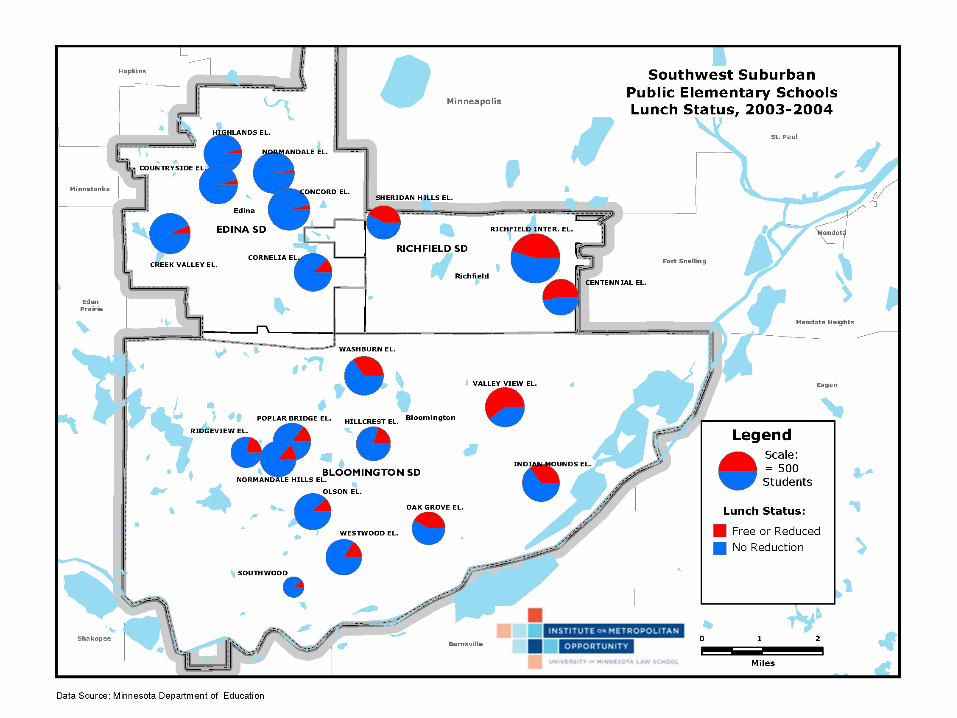
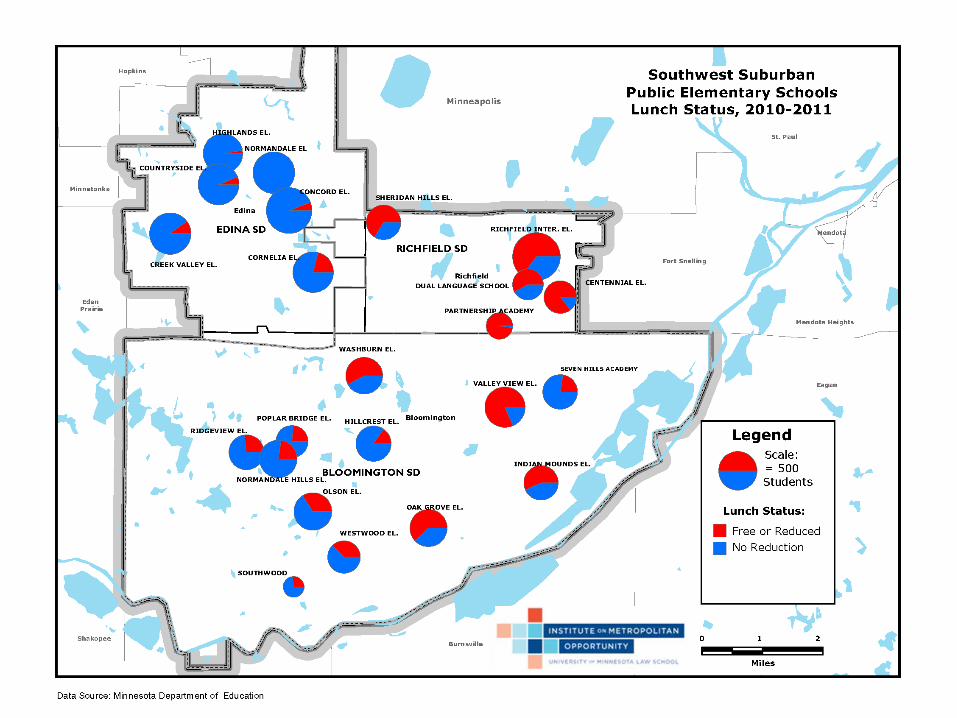
Southwest Minneapolis Suburban School
Demographics

Southwest MinneapolisSuburbs
Race and Ethnicity1995-2013


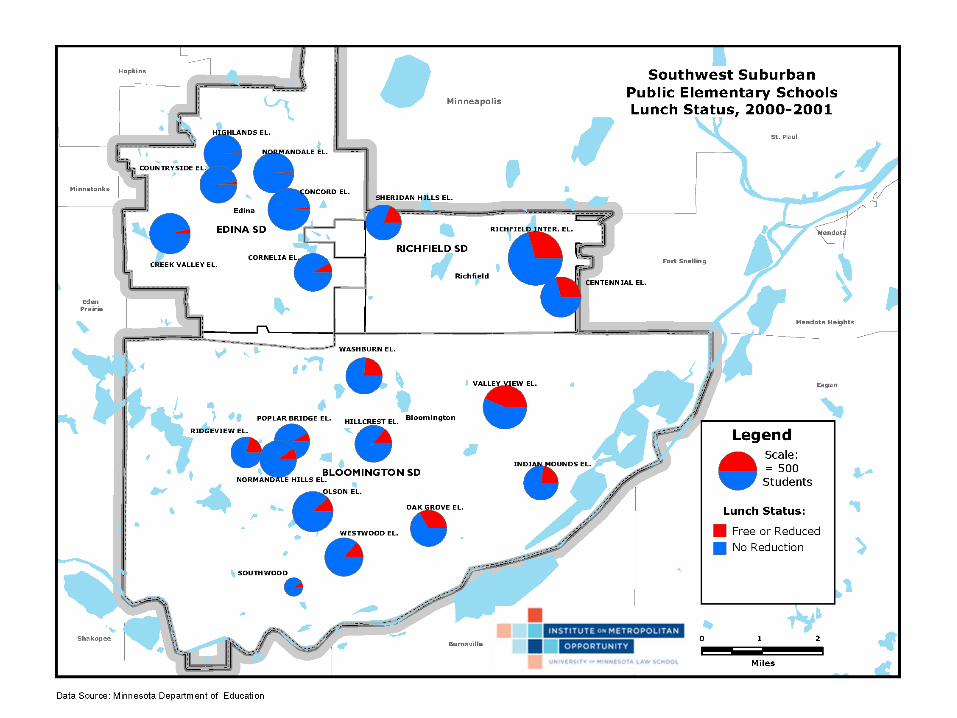
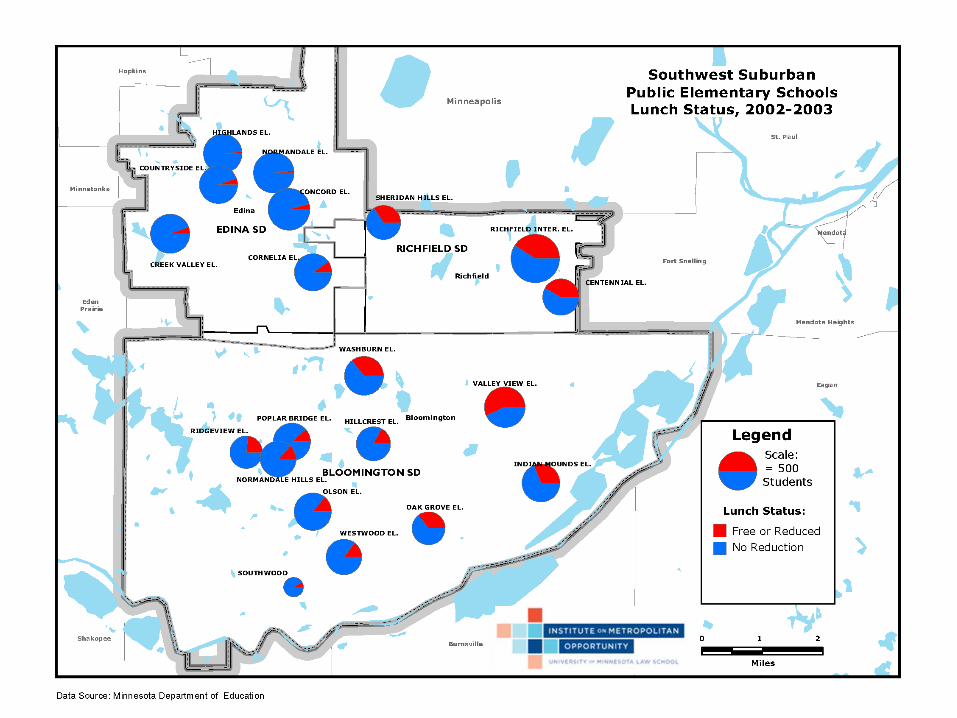
Southwest MinneapolisSuburbs
Free Lunch Eligibility1997-2013


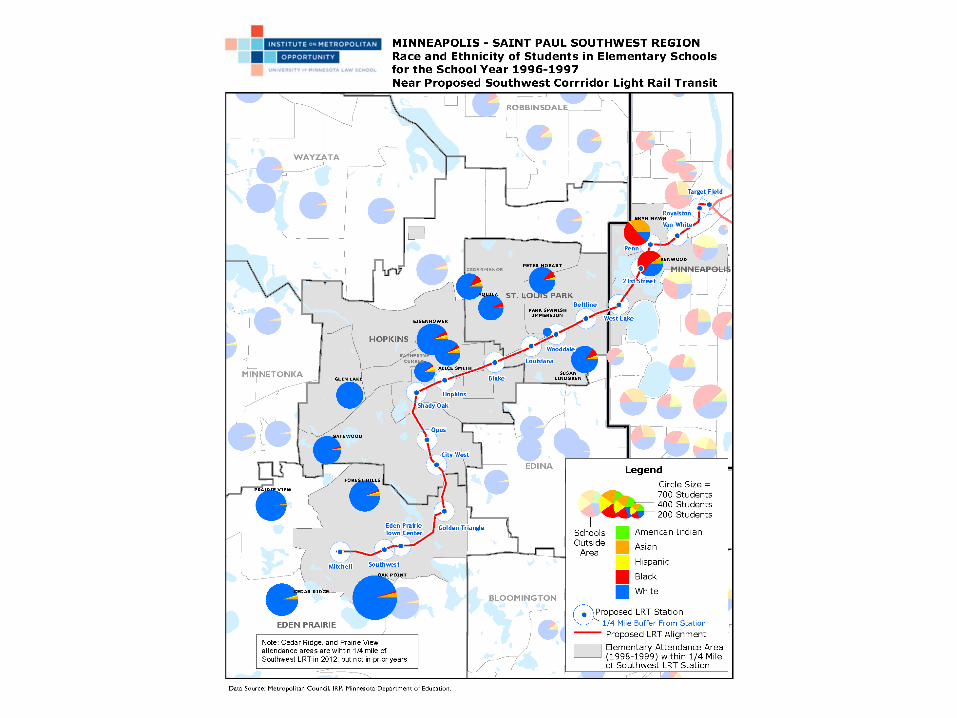
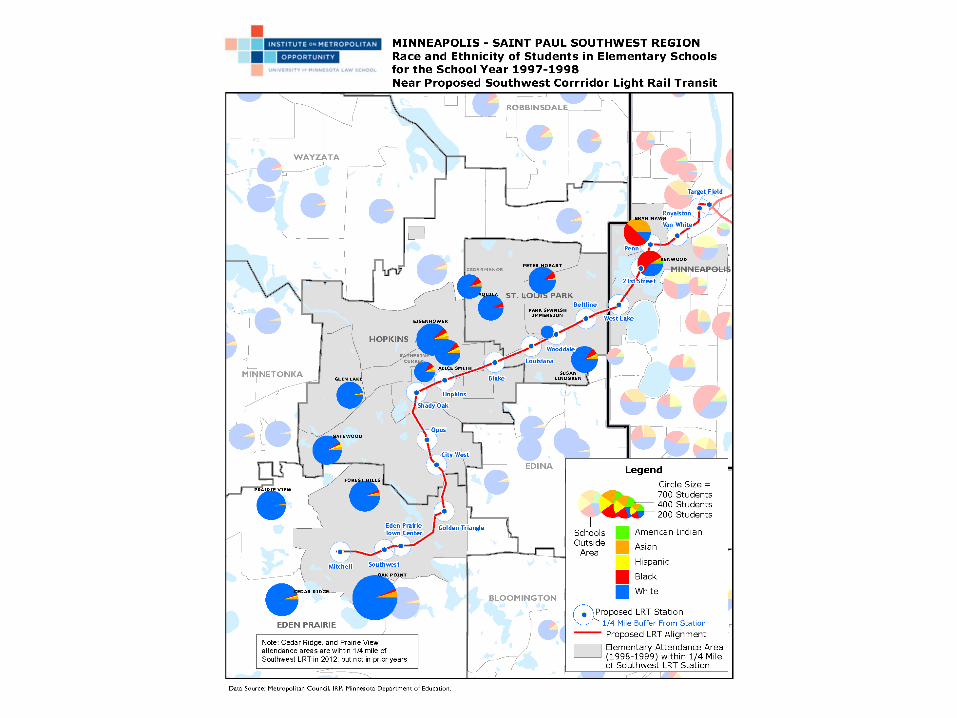
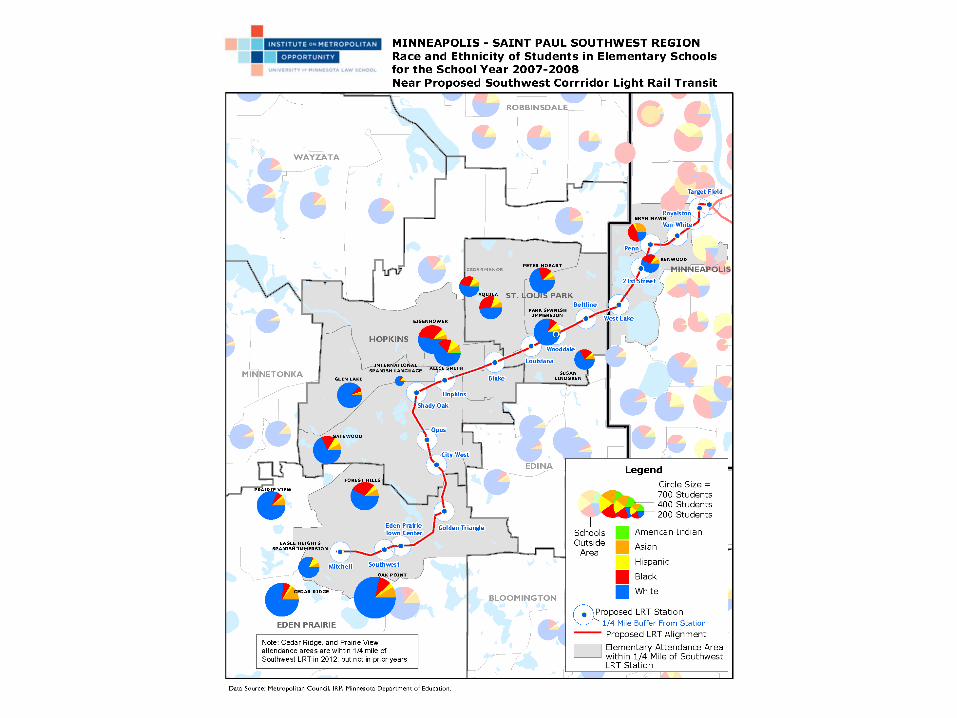
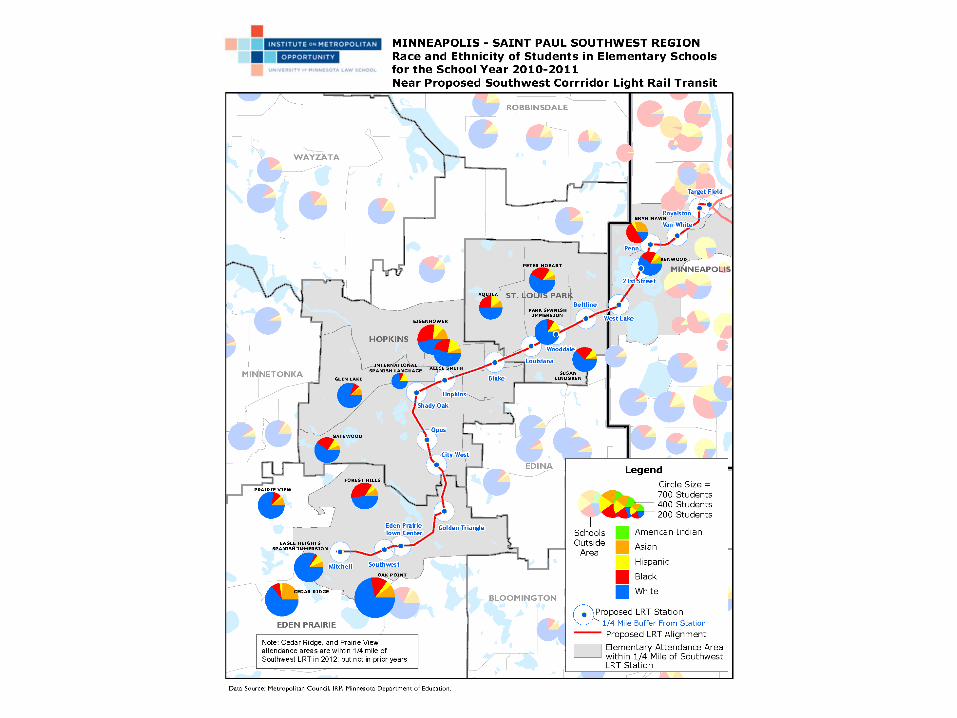
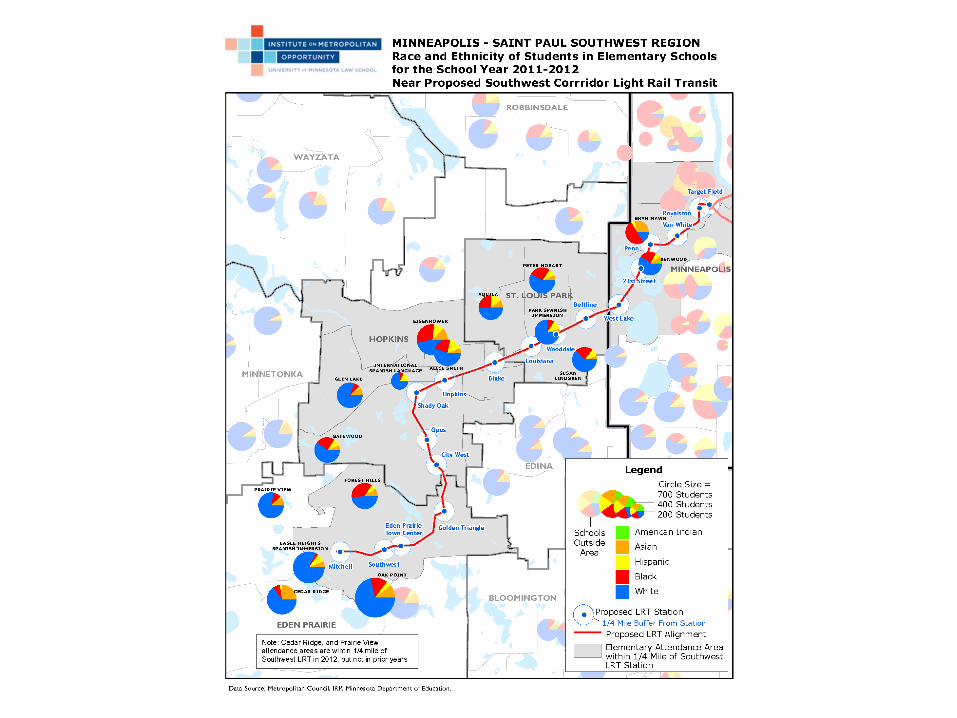
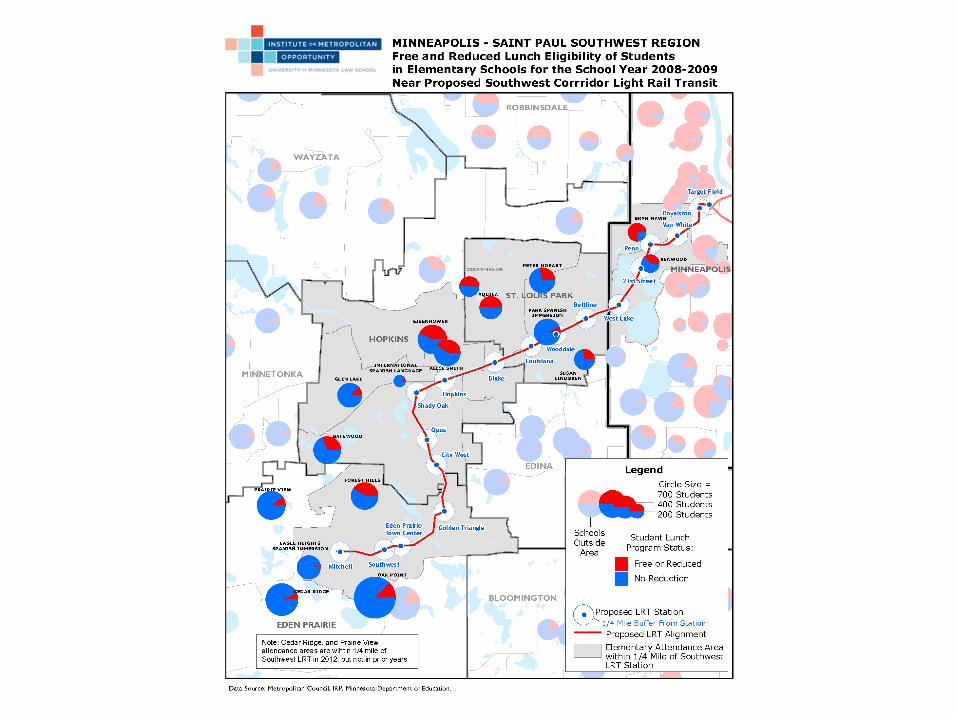
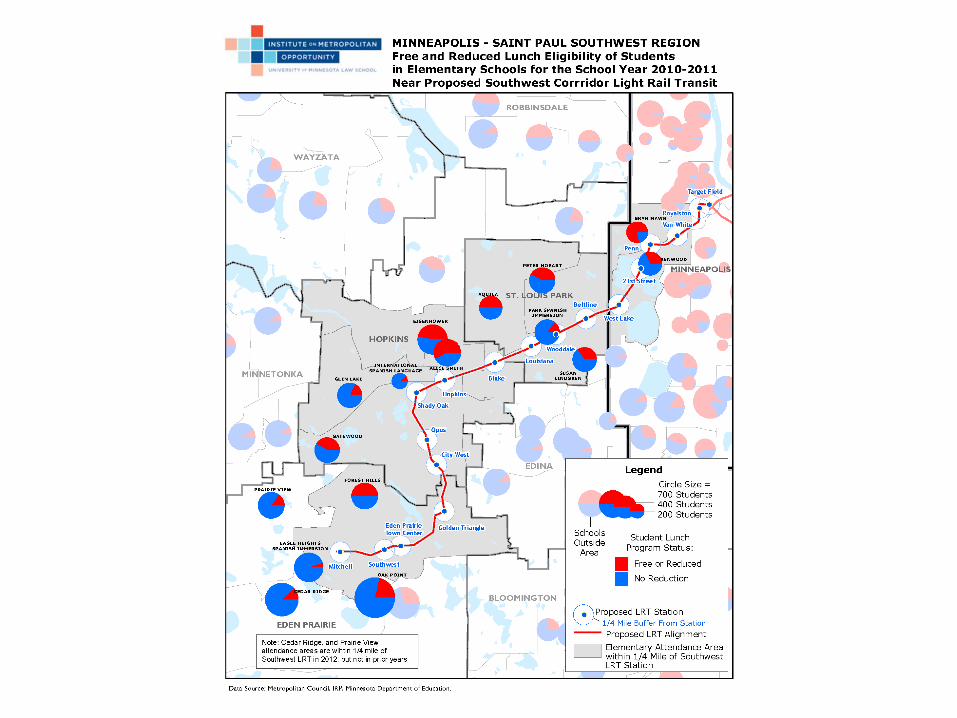
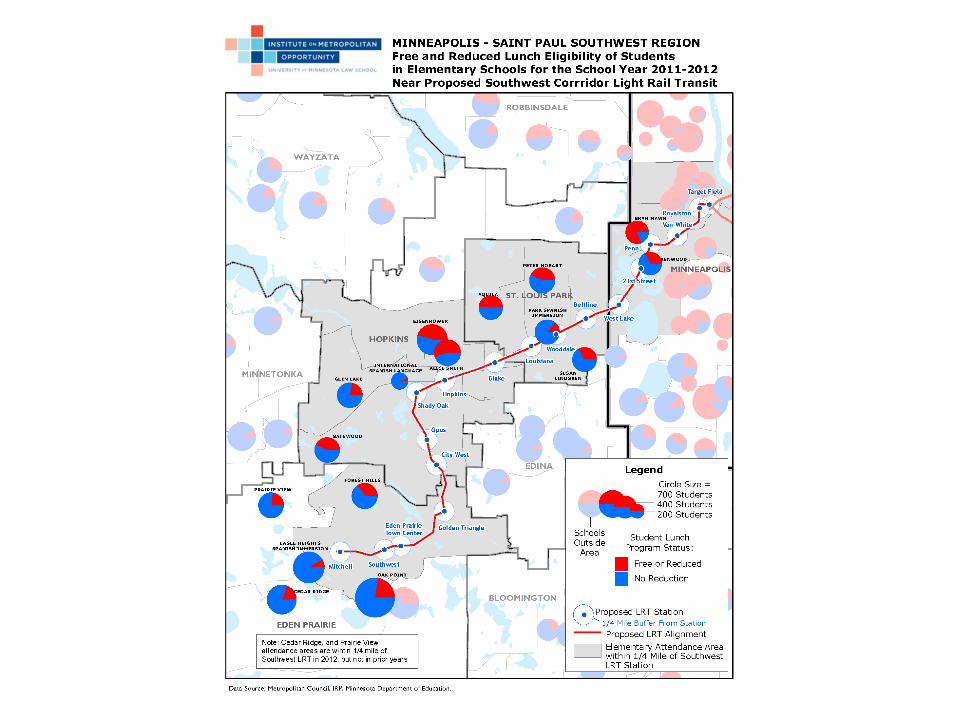
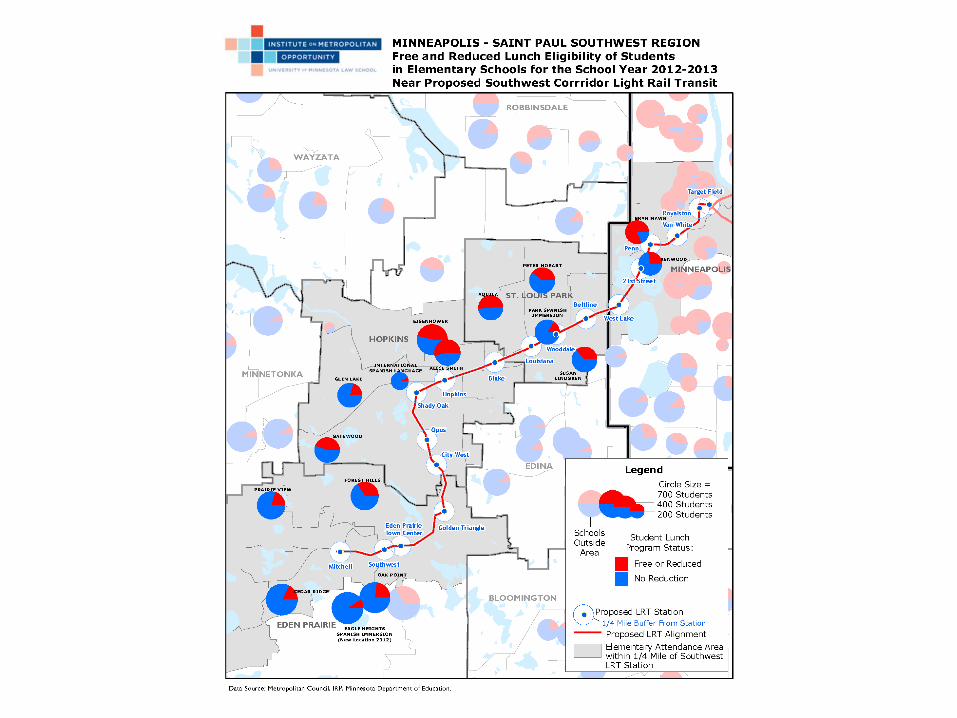
Southwest Corridor LRTSchool Demographics


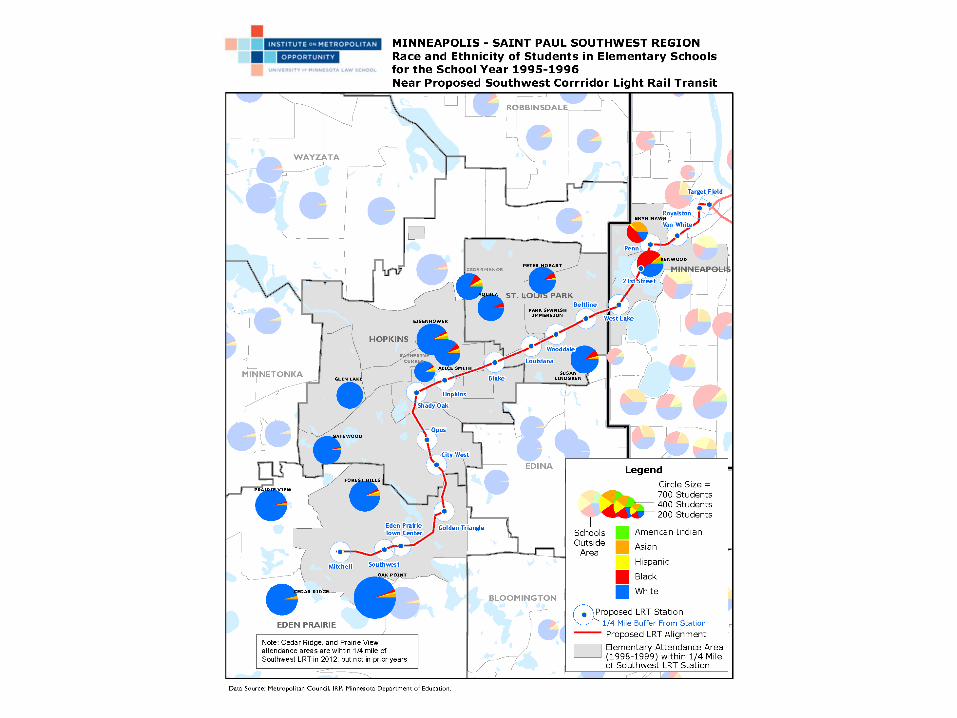
Southwest Corridor LRTRace and Ethnicity
1995-2013


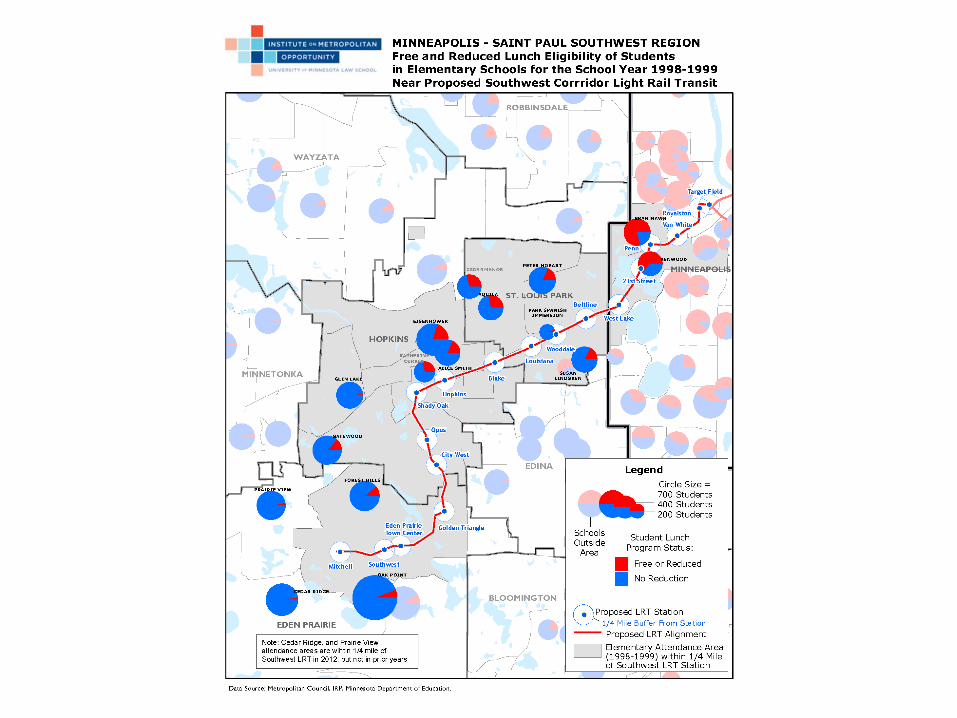
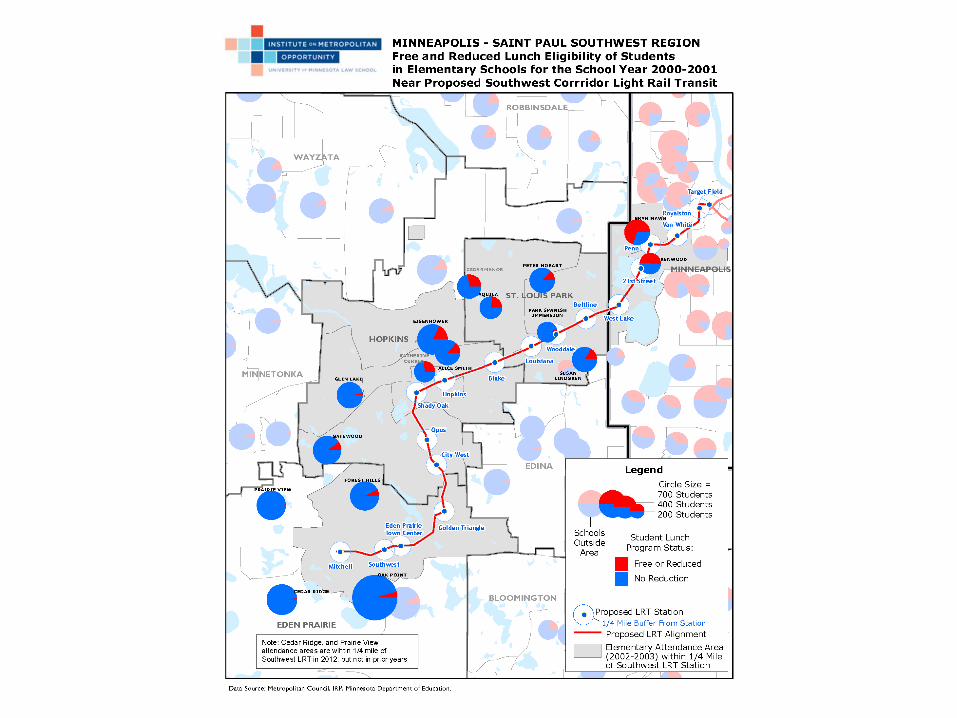
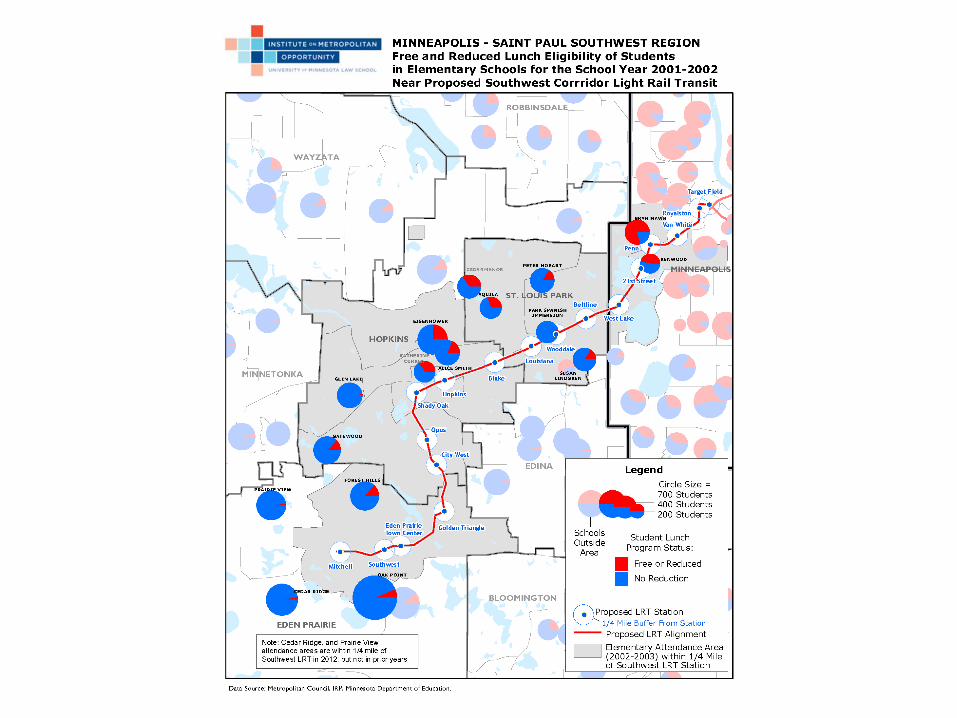
Southwest Corridor LRTLunch Program Eligibility
1997-2013


Twin CitiesAffordable Housing


Twin CitiesDiverse Suburbs


Contact Us:http://www.law.umn.edu/metro.html