Presentation Title Goes Here Business Process Management.
21
Presentation Title Goes Here Business Process Management
-
Upload
shauna-pope -
Category
Documents
-
view
215 -
download
0
Transcript of Presentation Title Goes Here Business Process Management.

Presentation Title Goes HereBusiness Process Management

2The Natural Evolution of Outsourcing
• Onshore capital expenditure avoidance • Improve Process and Technology
Productivity
• Variable Cost Flexibility• Minimize capital investment
Capacity
• Redefine Core Competency• Preservation of cash & improved working capital• Take Processes to Best-in-class
CompetitivenessTODAY
Labor Arbitrage• 25-50% cost savings • Leverage global talent pool
Common Concerns: Data Privacy Issues, Control, Cultural Match, Visibility and Flexibility, Ability to Scale, Knowledge Transfer, IP Protectionism

3
Four Major Trends that Will Reshape the Global Landscape
Population Growth Increasingly
Concentrated in Emerging Countries
World’s Population Becomes Urbanized
Economic Power Shifts to Developing
Nations
Developed Countries’ Labor Forces
Substantially Ageand Decline

Irreversible Trends Fueling the Global Demand for Business Process & Technology Management Solutions
Market for Global Outsourcing to Triple by 2020 to $1.6 TrillionMarket for Global Outsourcing to Triple by 2020 to $1.6 Trillion
Working Age Population
• Japan 10%
• UK 2% • US 7% • Scandinavia 0%
• India 23%
• Virtual supply
• Cost pressures
• Partnerships
• Social networks
• Domain knowledge
• Continued uncertainty in 2010 and beyond
• Pressure to penetrate into newer markets
• Cost control / margin improvement
• Converting capital to operating costs
• Business
• Technology
• Engineering
• R&D
• Standardized, consistent, value-add
Irreversible Trends
Irreversible Trends
Ecosystems of ExpertiseEcosystems of Expertise
Increasing Client
Acceptance
Increasing Client
Acceptance++ ++ ==
DemographicsTalent Supply
ChainRedefining Core
vs. Non-CoreGlobalization of
Services
Accelerating Momentum
Accelerating Momentum
© 2010 Copyright Genpact. All Rights Reserved.
4
Customers are Looking to Drive Change in their Operations to Become More Effective Globally
5
© 2010 Copyright Genpact. All Rights Reserved.
• Arbitrage & Efficiency are table stakes
• Customers are expecting innovation & transformation being accelerated through outsourcing
• Customer growth needs shifting to Developing economies – Suppliers expanding delivery foot print to cope with demand
• New Demand in China, India, Brazil, SE Asia
• Customers expecting Supplier to invest in “science” of business process management

IT Players Building “Process Expertise”
Process Power0% 100%
IT Players Acquiring BPOs
IT Services BPO
Software Providers – Evolving
System Integration
Work Flow Redesigning
Hardware Manufacturers + IT Services
?
The Changing Competitive Landscape…

Resilient Top Tier Financial Performance
• Spun off from GE as an independent company in 2005
• Listed on NYSE in 2007 (Symbol: G)
• Successful secondary public offering in March 2010
• Strong growth with revenues growing at 22% CAGR since
2006
• Diversified revenue base excluding GE growing at 100%+
CAGR since 2004
• Strong balance sheet and cash flows, including
approximately $430MM of cash and cash equivalents
Outstanding ResultsOutstanding Results
Note: $ in millions 1Excluding GE
CAGR 100%1
2005 2006 2007 2008 2009
2006 2007 2008 2009
613613
823823
1041
1041
1120
1120
Revenue Growth
160160
342342
551551
669669
4242
2020
Global Clients
22%
2004
© 2010 Copyright Genpact. All Rights Reserved.
7

Complexity, Scale and Diversity
• Unparalleled diversity & depth of services –over 3,000 processes managed
• Serving 400+ clients representing 40+ industries across 15+ countries
• Extensive skills range to match service range – from simple invoice processing to complex statistical modeling
13 Countries | 39 Delivery Centers | 25 Languages | 43,300+ Employees
Serving Clients Across the GlobeServing Clients Across the Globe
© 2010 Copyright Genpact. All Rights Reserved.
8

Co
re E
nte
rpri
se
Se
rvic
es
Te
ch
no
log
y
Se
rvic
es
Procurement & Supply Chain
• Indirect/Direct Sourcing & Procurement• Demand Forecasting• Inventory Optimization• Fleet & Logistics Services• After Market Services
Banking and Lending Ops• Application Processing• Underwriting• Claims Management• Mortgage Orientation and Servicing• Payment, Booking and Funding of Loans and Leases
Finance & Accounting• Accounts Payable• Order to Cash• General Accounting• Closing & Reporting• Treasury & Tax• Financial Planning/Analysis• Payroll
Enterprise Application Services• Enterprise Applications Solutions (Oracle, SAP, Siebel)• Business Intelligence/Data Warehousing• Technology Integration (ADM, BPM, Testing)
IT Infrastructure Management Services• End User Computing/Help-Desk Services• Enterprise Computing• Database & Middleware• Network, Voice & Security Services
Kn
ow
led
ge
S
erv
ice
s
Reengineering: Procure to Pay, Record to Close, Inquiry to Order, Order to Cash, Collections, Treasury & Tax
Analytics & Research: Marketing, Pricing, Inventory Optimization, Customer Loyalty/Surveys, Contract Management
End-to-End Portfolio of Core Business and Technology Services
Risk Management: Internal Audit, SOX Advisory, Regulatory, Enterprise, IT, Fraud Risk
Legal Processing: Contract Drafting, Legislative Monitoring, Research & Analysis
Collections & Customer Service• Early & Late Stage Collections• Analytics/Skip Tracing• Bankruptcy Originations• Customer Care• Technical/Product Support• Customer Acquisition & Sales
9

Offerings Ranging From Simple to Complex
© 2010 Copyright Genpact. All Rights Reserved.
Low Medium High
Procurement & Supply Chain
Banking & Lending Ops
Finance & Accounting
Collections & Customer Service
Enterprise Application Services
IT Infrastructure MgmtServices
• Accrual • Fixed Assets • Inter-Company
Reconciliations• Accounts Payable• T&E• Master Data Management
and System/Platform Maintenance
• Closing and Consolidation• Credit Risk• Management Reporting• Treasury• Contract Administration• Order Management• Cash Applications• Reporting• Supply Chain/ Cost Accounting
• SEC and Statutory Filings• External Reporting• Budgeting and Forecasting• Audit Support• Tax• Collections and Billing• Exception Management• Payroll
• Imaging/Document Management
• Helpdesk • IT Asset Mgmt.• Managed Network/Security/ Voice
Services
• Remote Infrastructure Mgmt.• Database/ Middleware support
• Originations• Account Servicing• Mutual Funds Servicing• Investment Banking• Actuarial Services• Product Planning & Development• New Business & Underwriting• Claims Management• Reinsurance• Billing & Collections
• Acquisitions & Sales• Early Stage Collections• Technical & Product Support• Customer Care Services
• Third Party Recovery
• Transactions Servicing• Voice Servicing• Booking/Funding Billing• Cash Applications• Annuities Servicing• Agent Services• Policy Set-up/ Serving/
Administration• Marketing & Distribution
• Application Deployment• Oracle• SAP• Business Intelligence/ Data Warehousing• Technology Integration/ Testing
• Indirect Sourcing & Procurement
• Fleet & Logistics Services• After Market Services
• Demand Forecasting• Direct Sourcing &
Procurement• Optimization – Inventory,
Field Services, Warranty
• Account Payables • Order Management
Complexity
10

Global, Blue-chip and Discerning Clients
Banking, Financial Services & Insurance
High-Tech
Pharma and Healthcare
CPG/Retail
Manufacturing Others
Business Services
+ 2 Leading Fortune 500 Insurers
+ Leading Global Reinsurer
+ Leading Personal Insurer in US
+ 2 Leading US Retail Banks
+ 2 Leading Global Conglomerates
+ Top Global Automaker
+ Global Publishing Co.
+ Leading Package Delivery Co.
+ Leading Internet Services Co. + Leading Data Management Co.
400+ Clients• 35+ Fortune 500 • 95+ Fortune 2000400+ Clients• 35+ Fortune 500 • 95+ Fortune 2000
+ 4 of 10 Largest Pharmaceutical Cos
+ 2 Leading Healthcare Information Cos.
© 2010 Copyright Genpact. All Rights Reserved.
11
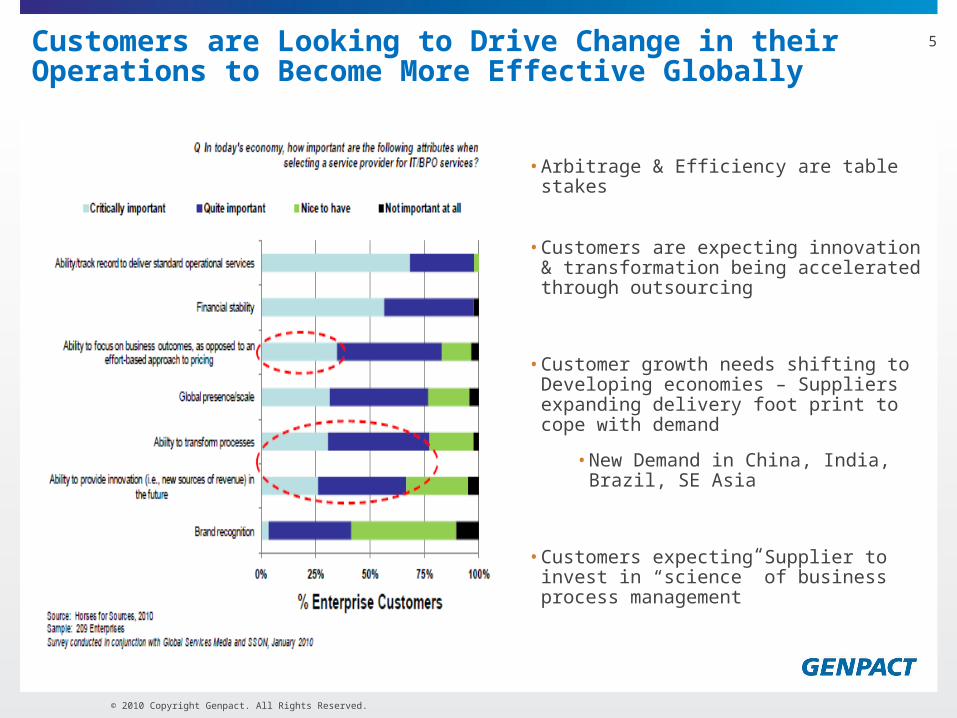
A Global Supply Chain of Talent, Skills and Expertise
Global Diverse Workforce• 43,300 employees, 13 countries, 25 languages• 40% gender diversity at the associate level• 80% of positions filled internally
Top Talent through Robust Hiring Engine• 12,000+ hires globally, 6% acceptance rate• Innovative hiring solutions – storefronts in tier-2 cities, employee referrals• Campus recruitment program with premier B-schools globally Continuous Training & Development • GE organization development systems • Vertical and subject matter expertise certifications (LOMA, CSCP, CPIM, CFA)• 8000 + employees enrolled in Education@Work programs• 40,00 hours of leadership training in 2009 - partnership with premier institutes like
Harvard and Duke
10,000 +Green Belts*
375+Blackbelts* / MBBs*
800+Insurance Certified
1,211+CA / CPA
100+Actuaries
4,000+MBAs & Diploma holders
5,000+IT Resources
75+PhDs & Doctors
50+Nationalities
25+Languages
Great talent, well managed and quick to align with the business priorities…
- Global Operations Leader, Leading Financial Co.
20,000+Graduates
5,000+Post-Graduates
Retain and Grow Talent Through Industry Leading PracticesRetain and Grow Talent Through Industry Leading Practices
© 2010 Copyright Genpact. All Rights Reserved.
12
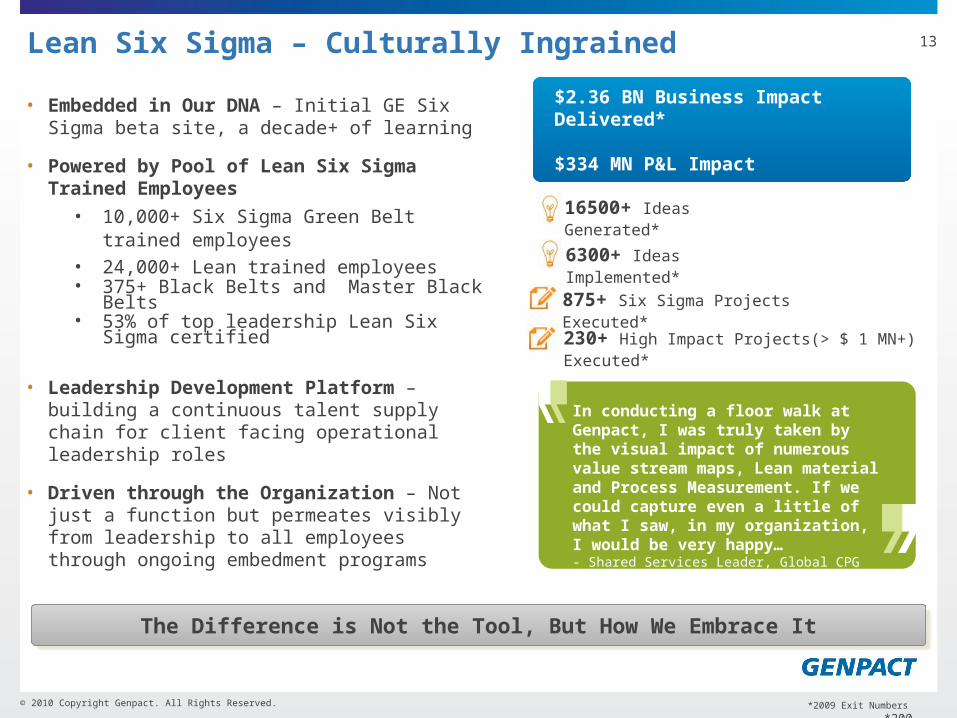
Lean Six Sigma – Culturally Ingrained
© 2010 Copyright Genpact. All Rights Reserved.
• Embedded in Our DNA – Initial GE Six Sigma beta site, a decade+ of learning
• Powered by Pool of Lean Six Sigma Trained Employees
• 10,000+ Six Sigma Green Belt trained employees
• 24,000+ Lean trained employees• 375+ Black Belts and Master Black Belts• 53% of top leadership Lean Six Sigma
certified
• Leadership Development Platform – building a continuous talent supply chain for client facing operational leadership roles
• Driven through the Organization – Not just a function but permeates visibly from leadership to all employees through ongoing embedment programs
The Difference is Not the Tool, But How We Embrace ItThe Difference is Not the Tool, But How We Embrace It
$2.36 BN Business Impact Delivered*
$334 MN P&L Impact
16500+ Ideas Generated*
6300+ Ideas Implemented*
875+ Six Sigma Projects Executed*
In conducting a floor walk at Genpact, I was truly taken by the visual impact of numerous value stream maps, Lean material and Process Measurement. If we could capture even a little of what I saw, in my organization, I would be very happy… - Shared Services Leader, Global CPG Company
230+ High Impact Projects(> $ 1 MN+) Executed*
*2009 Exit Numbers
13

© 2010 Copyright Genpact. All Rights Reserved.
Over $2 Billion Delivered to Clients in Business Impact in 2009Over $2 Billion Delivered to Clients in Business Impact in 2009
Operating Excellence Ecosystem that Maximizes Value Creation
*Figures indicative of a $5 BN company
14
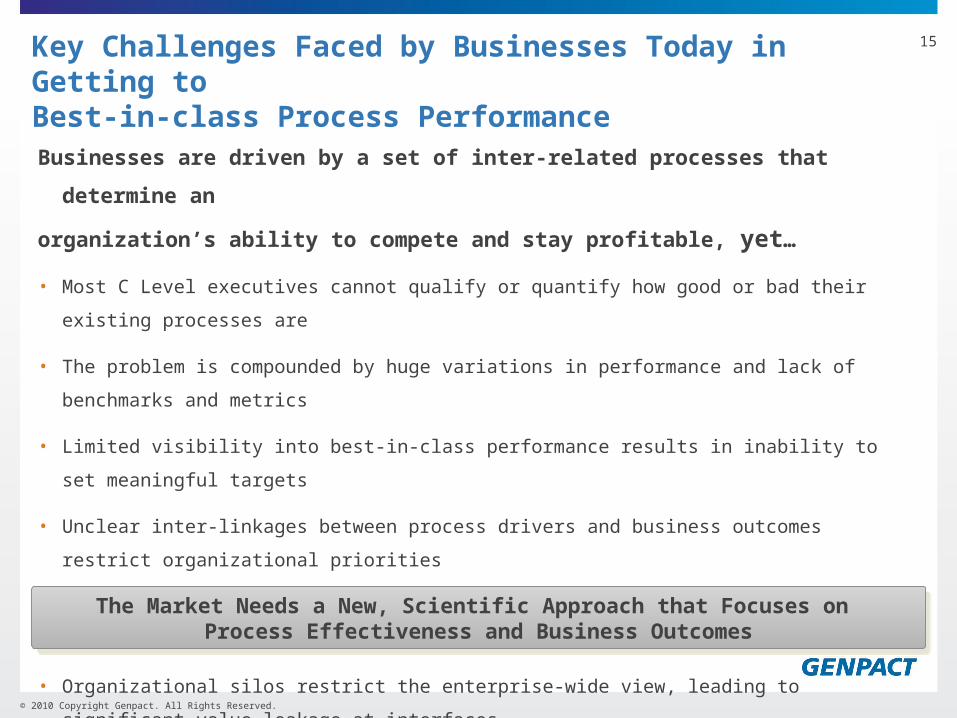
Key Challenges Faced by Businesses Today in Getting toBest-in-class Process Performance
Businesses are driven by a set of inter-related processes that determine an
organization’s ability to compete and stay profitable, yet…
• Most C Level executives cannot qualify or quantify how good or bad their existing processes are
• The problem is compounded by huge variations in performance and lack of benchmarks and metrics
• Limited visibility into best-in-class performance results in inability to set meaningful targets
• Unclear inter-linkages between process drivers and business outcomes restrict organizational
priorities
• Focus on process efficiency versus overall effectiveness leaves large value unaddressed
• Organizational silos restrict the enterprise-wide view, leading to significant value leakage at interfaces
• Use of technology without process rigor delivers benefits far less than estimated
The Market Needs a New, Scientific Approach that Focuses on Process Effectiveness and Business Outcomes
The Market Needs a New, Scientific Approach that Focuses on Process Effectiveness and Business Outcomes
© 2010 Copyright Genpact. All Rights Reserved.
15
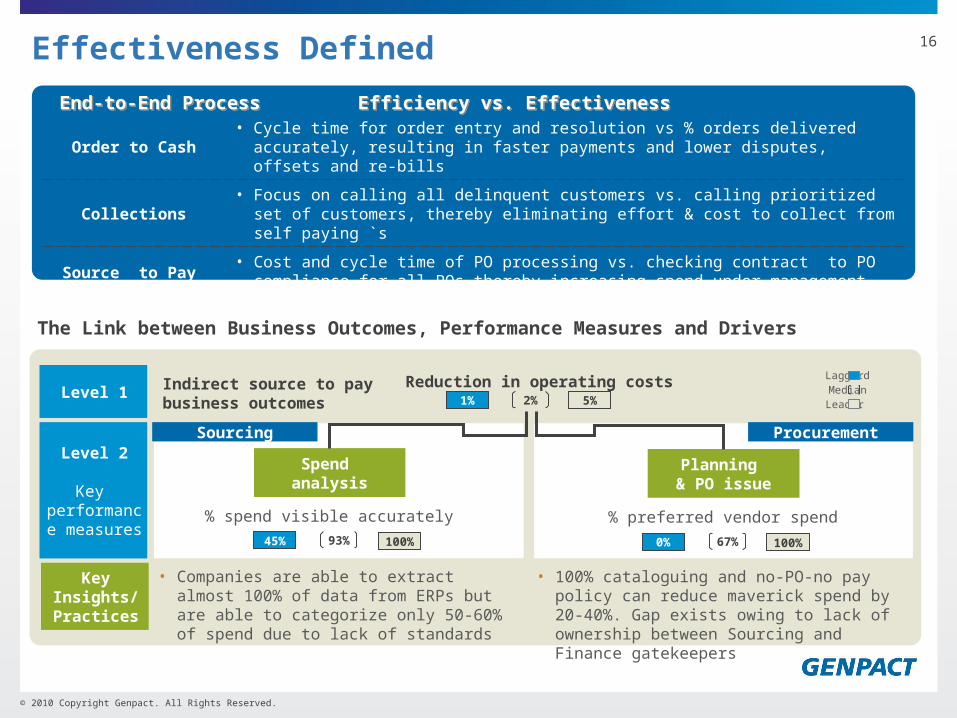
Effectiveness Defined
Order to Cash• Cycle time for order entry and resolution vs % orders delivered accurately, resulting in
faster payments and lower disputes, offsets and re-bills
Collections• Focus on calling all delinquent customers vs. calling prioritized set of customers, thereby
eliminating effort & cost to collect from self paying `s
Source to Pay • Cost and cycle time of PO processing vs. checking contract to PO compliance for all POs
thereby increasing spend under management
End-to-End Process Efficiency vs. EffectivenessEnd-to-End Process Efficiency vs. Effectiveness
© 2010 Copyright Genpact. All Rights Reserved.
Level 1 Indirect source to pay business outcomes
Level 2
Key performance
measures% spend visible accurately % preferred vendor spend
Spend analysis
Planning & PO issue
45% 100%93% 0% 100%67%
1% 5%2%
Reduction in operating costs
Procurement
• Companies are able to extract almost 100% of data from ERPs but are able to categorize only 50-60% of spend due to lack of standards
Laggard
LeaderMedian
Key Insights/Practices
Sourcing
The Link between Business Outcomes, Performance Measures and Drivers
• 100% cataloguing and no-PO-no pay policy can reduce maverick spend by 20-40%. Gap exists owing to lack of ownership between Sourcing and Finance gatekeepers
16
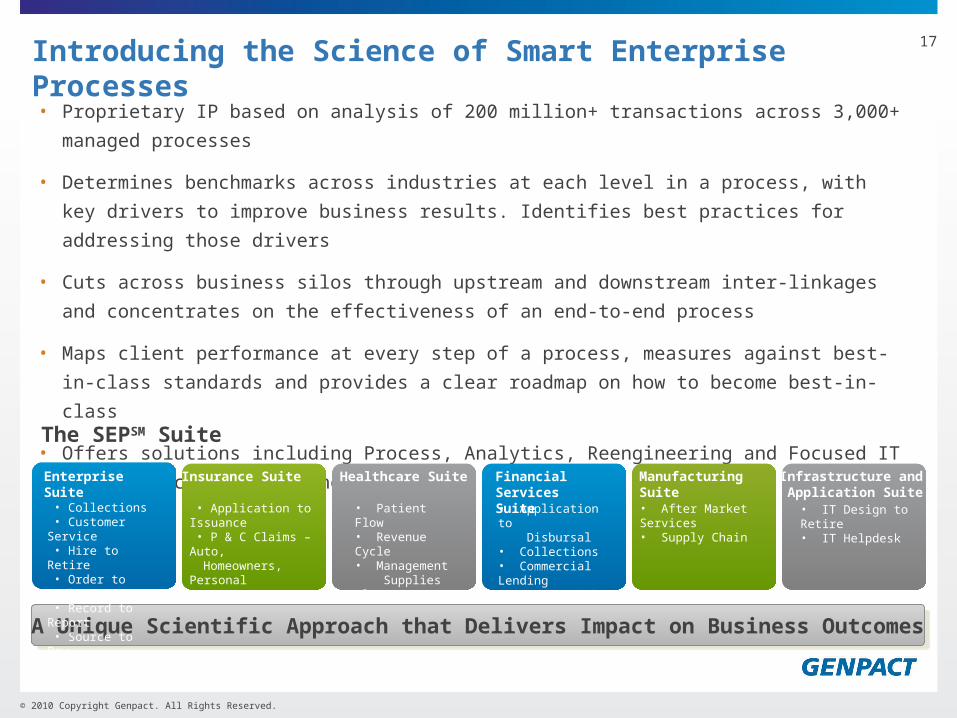
• Proprietary IP based on analysis of 200 million+ transactions across 3,000+ managed processes
• Determines benchmarks across industries at each level in a process, with key drivers to improve
business results. Identifies best practices for addressing those drivers
• Cuts across business silos through upstream and downstream inter-linkages and concentrates on the
effectiveness of an end-to-end process
• Maps client performance at every step of a process, measures against best-in-class standards and
provides a clear roadmap on how to become best-in-class
• Offers solutions including Process, Analytics, Reengineering and Focused IT based on achieving
business impact
A Unique Scientific Approach that Delivers Impact on Business OutcomesA Unique Scientific Approach that Delivers Impact on Business Outcomes
Introducing the Science of Smart Enterprise Processes
• Collections• Application to Disbursal • Commercial Lending• Credit Risk
© 2010 Copyright Genpact. All Rights Reserved.
Enterprise Suite Insurance Suite
• Application to Issuance • P & C Claims – Auto, Homeowners, Personal
Healthcare Suite
• Patient Flow• Revenue Cycle• Management Supplies Flow
Financial ServicesSuite• Application to Disbursal• Collections• Commercial Lending• Credit Risk
Manufacturing Suite Infrastructure and Application Suite• IT Design to Retire• IT Helpdesk
The SEPSM Suite
• Collections • Customer
Service• Hire to Retire• Order to Cash• Record to Report• Source to Pay
• After Market Services• Supply Chain
17

• An insurance provider can release up to 50% of claim handler capacity & reduce overall settlement cycle time by 40% by enhancing claims segmentation and the adjudication process
• 30% reduction in call volumes can be achieved through analytics of customer calling behavior, effective usage of IVR & improving first time resolution
• By cutting down on spoilage, pricing errors, fines and fuel surcharges by 50% to 75%, a $5 billion CPG company can increase its annual earnings from $15 million to $20 million
• A commercial lending organization can eliminate about 1/3rd of early stage delinquencies through focused early stage collections and eliminate administrative delinquencies by reducing booking, billing and cash errors
• For a $5 billion pharmaceutical company, improving 1% revenue leakage can translate into $50 million top-line impact
• For a typical $40-50 BN in asset credit card issuer, analytics around agent measurement systems and customized training plans can impact losses by ~$100 MM
Real World Insights – the Power of SEPSM
Enabling Business Process Effectiveness to Deliver 2-5X Measurable Business Outcomes
Enabling Business Process Effectiveness to Deliver 2-5X Measurable Business Outcomes
© 2010 Copyright Genpact. All Rights Reserved.
18

Smart Enabling Technologies
•Unique ability to combine the best of technology, functional capabilities and business process
• Legacy of building smart & innovative Point and Platform Solutions to drive customer value and enhance internal system effectiveness
• Strategic industry collaboration to deliver IT business value
Continuing to Build & Invest in Technology to Deliver Value to CustomersContinuing to Build & Invest in Technology to Deliver Value to Customers
© 2010 Copyright Genpact. All Rights Reserved.

External Collaboration – Changing the Way We Work
• 700+ registered experts; 30% experts with 25+ yrs. experience
• Time to solution reduced by 80%
What was the Problem? What was the Benefit?
Case StudyHow was SolutionXchange Leveraged?
• Identify critical factors that account for maximum leakage in claims
• Understand measures to flag fraud in active claims to proactively fix leakage
• Identified US based industry expert with 20+ years domain experience
• Engagement period over 6 weeks
• Communities, discussion forums & formal submissions on website
• Developing point solution for claims leakage to drive loss cost reduction of ~$10-12MM / $1B of premium for Insurance Clients
Use benchmarks to develop processes for credit control and pricing
Establish procedures & controls to improve accuracy of revenue accounting
Identify factors driving income leakage to reduce yield degradation
Software
Insurance
Telecom
CommercialFinance
Web 2.0 based Genpact network for collaboration between our SMEs, clients and high quality external experts
Identify critical factors to reduce claims leakage and overpayments
Enabling Access to Global Expertise for Our ClientsEnabling Access to Global Expertise for Our Clients
20

© 2010 Copyright Genpact. All Rights Reserved.
Common Myths and Realities
•Long term partnership not just a vendor relationship - multiple points of interaction, hand-offs
•Cultural match, integration, soft issues key to success - as much as SLAs and expertise
•Technology, people, knowledge transfer issues exist during transition - response is the key
•Our people must feel like your people - to drive maximum impact in the long term
•Multiple vendors perhaps a good buying decision but not always a good business decision - each vendor
demands time and attention
•Partnering requires strong leadership, buy-in at multiple levels – easy to under-estimate but getting it right
first time is vital
•Visible and transparent transition process – sometimes good, sometimes bad, be prepared
A Strategic Long-term Decision & Commitment to Drive Business SuccessA Strategic Long-term Decision & Commitment to Drive Business Success
21