Presentation of the Q2/2019 results
27
Presentation of the Q2/2019 results Martin Lindqvist, President & CEO Håkan Folin, CFO July 19, 2019
Transcript of Presentation of the Q2/2019 results
Presentation of the Q2/2019 resultsMartin Lindqvist, President & CEOHåkan Folin, CFO
July 19, 2019

Agenda
►Summary of Q2/2019
►Performance by division
►Financials
►Outlook
►Q&A
2
3
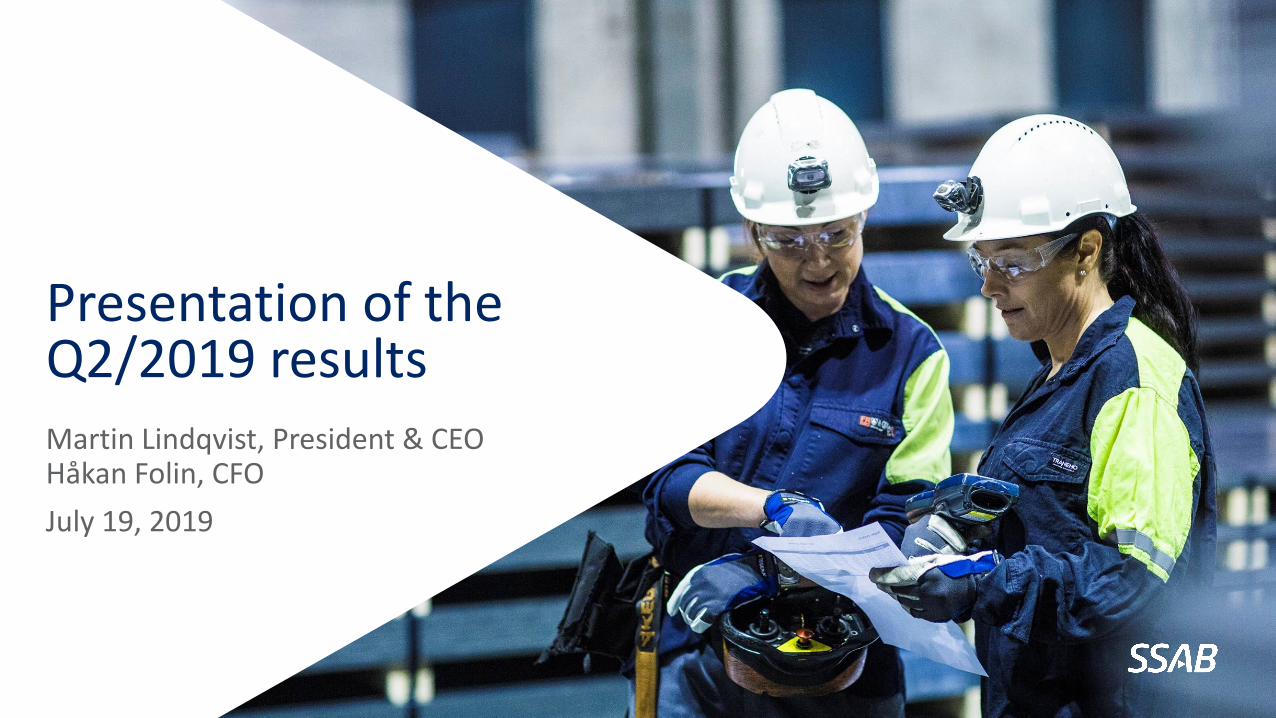
Spot price development: Hot-Rolled Coil (HRC) in Northern Europe, Plate in US, HRC in China
Indexed (Jan 2016 =100)
Q2
Northern Europe/HRC
US/Plate
HRC, Northern Europe
Plate, US
HRC, China
Weak price trend in the US and margin squeeze in Europe
Good demand from end-segments, but
cautious sentiment at distributors, spot plate prices, as well as scrap
prices, decreased
0
50
100
150
200
250Ja
n 1
6
Feb
16
Mar
16
Ap
r 1
6
May
16
Jun
16
Jul 1
6
Au
g 1
6
Sep
16
Oct
16
No
v 1
6
De
c 1
6
Jan
17
Feb
17
Mar
17
Ap
r 1
7
May
17
Jun
17
Jul 1
7
Au
g 1
7
Sep
17
Oct
17
No
v 1
7
De
c 1
7
Jan
18
Feb
18
Mar
18
Ap
r 1
8
May
18
Jun
18
Jul 1
8
Au
g 1
8
Sep
18
Oct
18
No
v 1
8
De
c 1
8
Jan
19
Feb
19
Mar
19
Ap
r 1
9
May
19
Jun
19
Jul 1
9
Northern Europe US China
Weaker demand in automotive and cautious sentiment at distributors, spot prices decreased, sharp increase in iron
ore price

Summary of Q2/2019Improved earnings for SSAB Americas, decline in SSAB Europe
►EBIT of SEK 1,316m, down SEK 314m vs. Q2/18, and SEK 358m vs. Q1/19+ SSAB Americas’ result improved y-on-y driven by
higher prices
+ SSAB Special Steels’ result improved slightly
- SSAB Europe’s result declined mainly due to higher iron ore costs
►Strong operating cash flow of SEK 1.7bn
►Earnings per share SEK 0.98 (1.27)
SEKm Q2/2019 Q2/2018 Q1/2019 2018
Sales 20,654 19,263 20,017 74,941
EBITDA 2,419 2,582 2,755 8,712
EBIT 1,316 1,630 1,674 4,940
Operating cash flow
1,696 1,325 1,139 5,969
Earnings per share (SEK)
0.98 1.27 1.24 3.45
Gearing %1) 16 20 13 14
Shipments, ktonnes
1,722 1,811 1,744 6,899
Key figures
1) Excluding IFRS 16
Performance by division
Sales and EBITDA marginSEKm
6
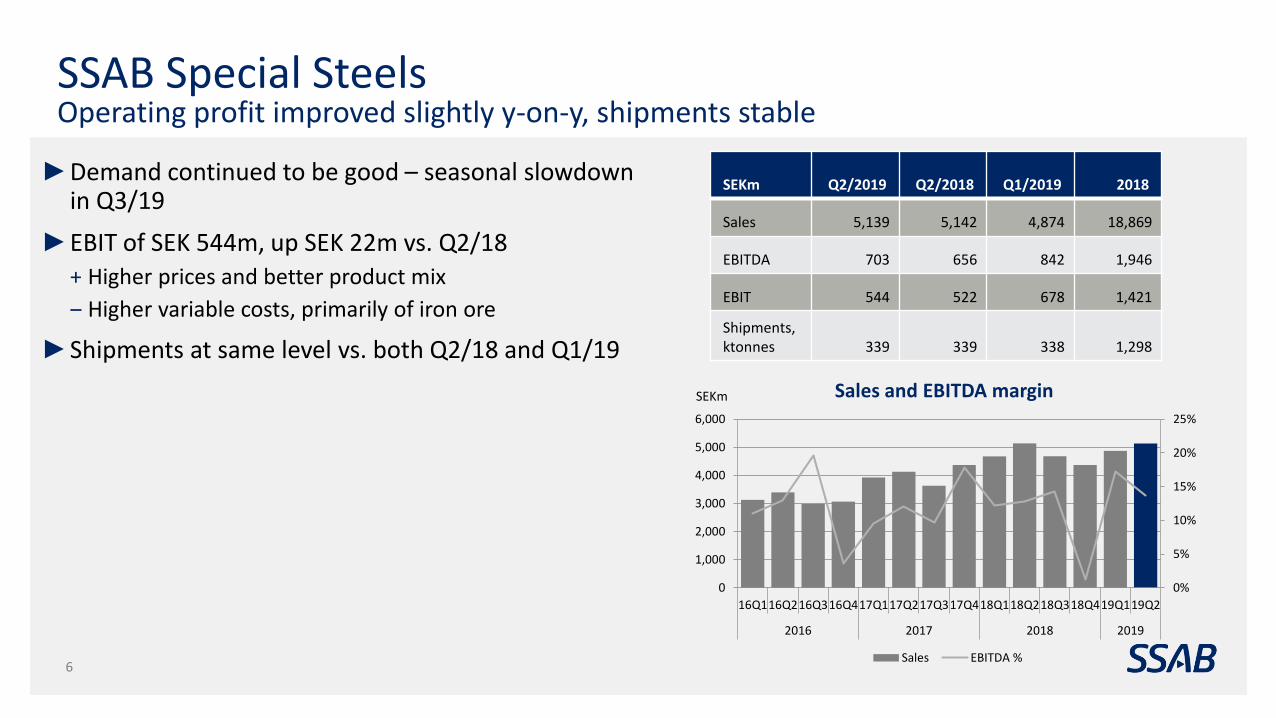
SSAB Special SteelsOperating profit improved slightly y-on-y, shipments stable
►Demand continued to be good – seasonal slowdown in Q3/19
►EBIT of SEK 544m, up SEK 22m vs. Q2/18+ Higher prices and better product mix
‒ Higher variable costs, primarily of iron ore
►Shipments at same level vs. both Q2/18 and Q1/19
SEKm Q2/2019 Q2/2018 Q1/2019 2018
Sales 5,139 5,142 4,874 18,869
EBITDA 703 656 842 1,946
EBIT 544 522 678 1,421
Shipments,ktonnes 339 339 338 1,298
0%
5%
10%
15%
20%
25%
0
1,000
2,000
3,000
4,000
5,000
6,000
16Q116Q216Q316Q417Q117Q217Q317Q418Q118Q218Q318Q419Q119Q2
2016 2017 2018 2019
Sales EBITDA %
SEKm
7
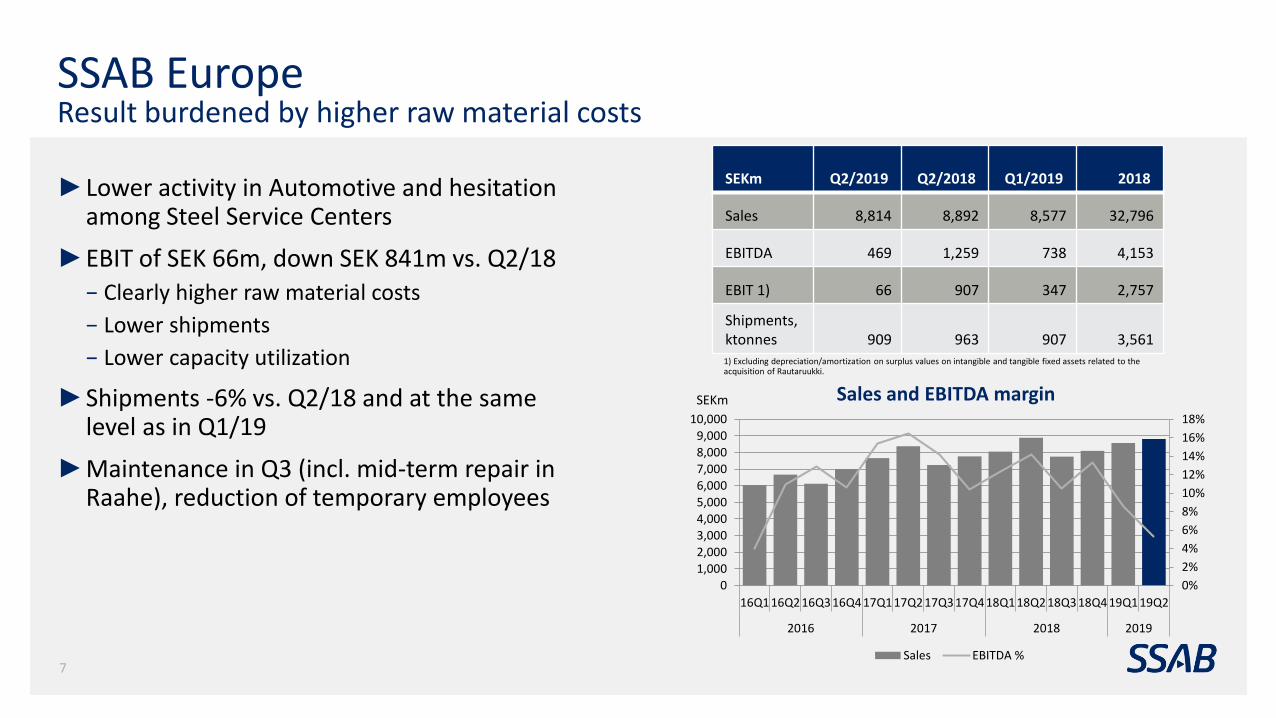
SSAB Europe Result burdened by higher raw material costs
►Lower activity in Automotive and hesitation among Steel Service Centers
►EBIT of SEK 66m, down SEK 841m vs. Q2/18− Clearly higher raw material costs
− Lower shipments
− Lower capacity utilization
►Shipments -6% vs. Q2/18 and at the same level as in Q1/19
►Maintenance in Q3 (incl. mid-term repair in Raahe), reduction of temporary employees
Sales and EBITDA margin
SEKm Q2/2019 Q2/2018 Q1/2019 2018
Sales 8,814 8,892 8,577 32,796
EBITDA 469 1,259 738 4,153
EBIT 1) 66 907 347 2,757
Shipments,ktonnes 909 963 907 3,5611) Excluding depreciation/amortization on surplus values on intangible and tangible fixed assets related to the acquisition of Rautaruukki.
0%
2%
4%
6%
8%
10%
12%
14%
16%
18%
0
1,000
2,000
3,000
4,000
5,000
6,000
7,000
8,000
9,000
10,000
16Q1 16Q2 16Q3 16Q4 17Q1 17Q2 17Q3 17Q4 18Q1 18Q2 18Q3 18Q4 19Q1 19Q2
2016 2017 2018 2019
Sales EBITDA %
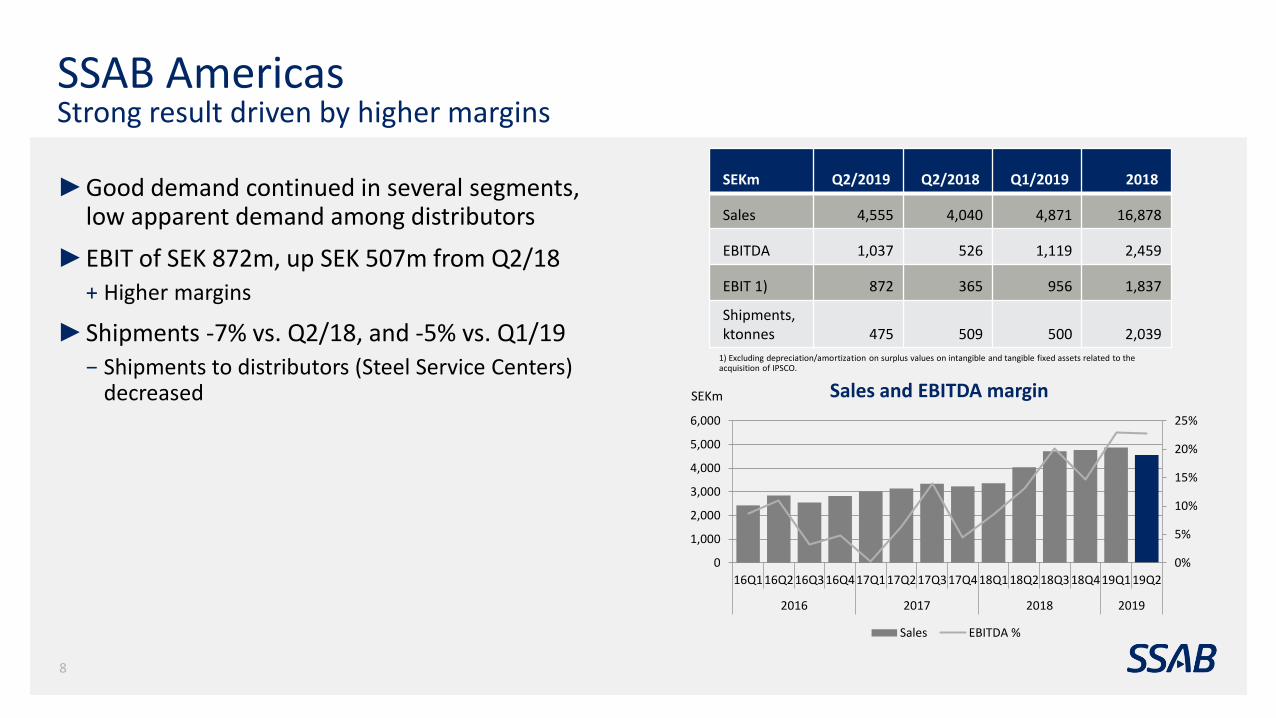
SSAB AmericasStrong result driven by higher margins
►Good demand continued in several segments, low apparent demand among distributors
►EBIT of SEK 872m, up SEK 507m from Q2/18+ Higher margins
►Shipments -7% vs. Q2/18, and -5% vs. Q1/19− Shipments to distributors (Steel Service Centers)
decreased SEKm Sales and EBITDA margin
SEKm Q2/2019 Q2/2018 Q1/2019 2018
Sales 4,555 4,040 4,871 16,878
EBITDA 1,037 526 1,119 2,459
EBIT 1) 872 365 956 1,837
Shipments,ktonnes 475 509 500 2,039
1) Excluding depreciation/amortization on surplus values on intangible and tangible fixed assets related to the acquisition of IPSCO.
0%
5%
10%
15%
20%
25%
0
1,000
2,000
3,000
4,000
5,000
6,000
16Q1 16Q216Q316Q417Q1 17Q217Q3 17Q418Q118Q218Q3 18Q419Q1 19Q2
2016 2017 2018 2019
Sales EBITDA %
8
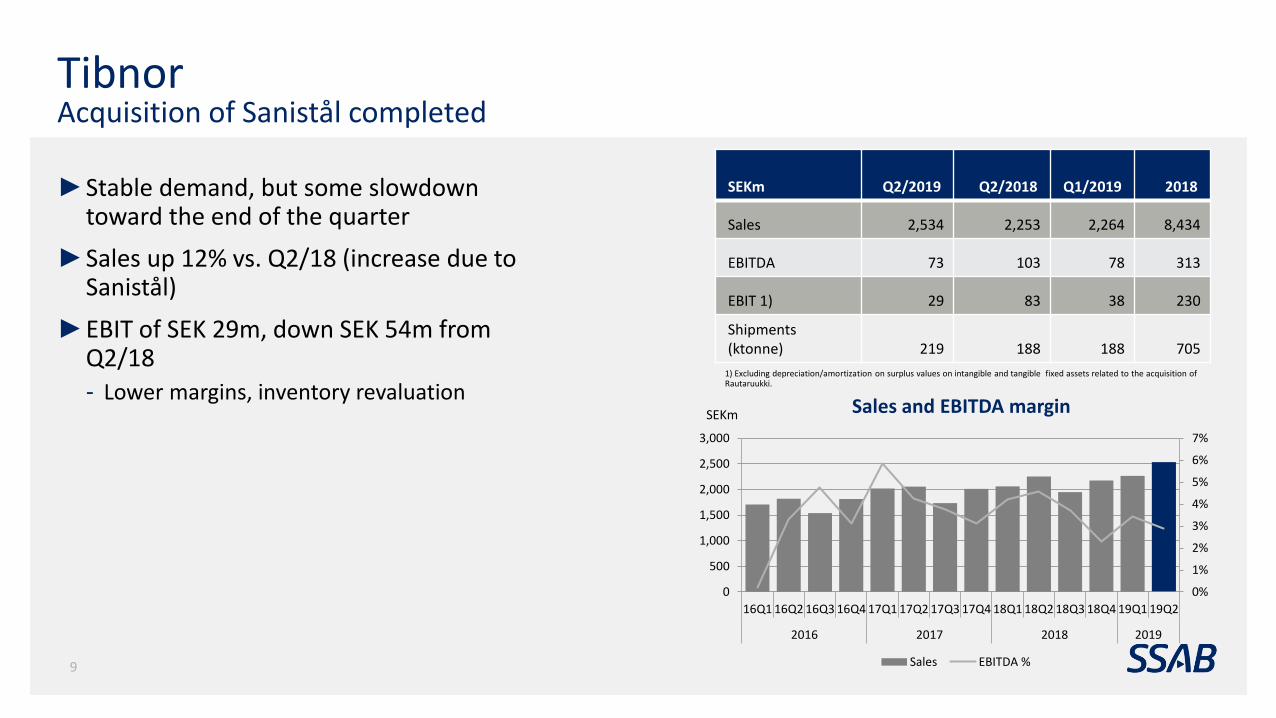
TibnorAcquisition of Sanistål completed
►Stable demand, but some slowdown toward the end of the quarter
►Sales up 12% vs. Q2/18 (increase due to Sanistål)
►EBIT of SEK 29m, down SEK 54m from Q2/18- Lower margins, inventory revaluation
9
SEKm Sales and EBITDA margin
SEKm Q2/2019 Q2/2018 Q1/2019 2018
Sales 2,534 2,253 2,264 8,434
EBITDA 73 103 78 313
EBIT 1) 29 83 38 230
Shipments(ktonne) 219 188 188 705
1) Excluding depreciation/amortization on surplus values on intangible and tangible fixed assets related to the acquisition of Rautaruukki.
0%
1%
2%
3%
4%
5%
6%
7%
0
500
1,000
1,500
2,000
2,500
3,000
16Q1 16Q2 16Q3 16Q4 17Q1 17Q2 17Q3 17Q4 18Q1 18Q2 18Q3 18Q4 19Q1 19Q2
2016 2017 2018 2019
Sales EBITDA %
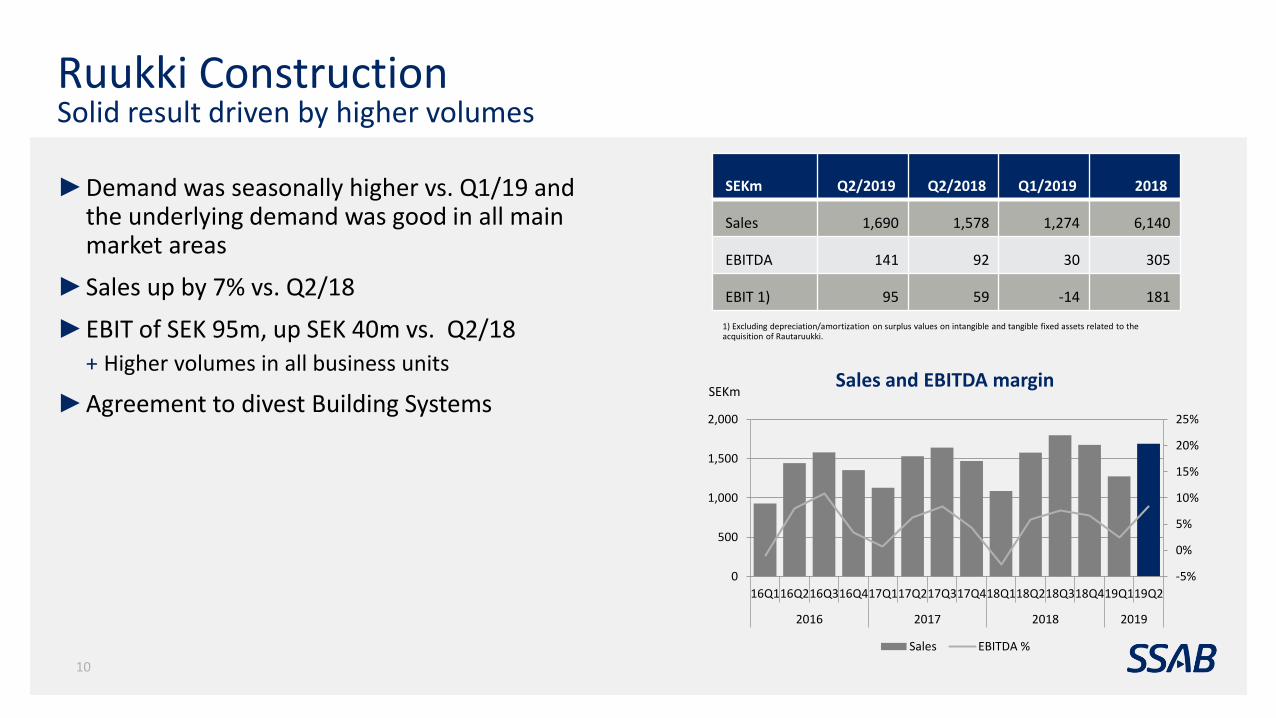
Ruukki ConstructionSolid result driven by higher volumes
►Demand was seasonally higher vs. Q1/19 and the underlying demand was good in all main market areas
►Sales up by 7% vs. Q2/18
►EBIT of SEK 95m, up SEK 40m vs. Q2/18 + Higher volumes in all business units
►Agreement to divest Building Systems
10
SEKmSales and EBITDA margin
SEKm Q2/2019 Q2/2018 Q1/2019 2018
Sales 1,690 1,578 1,274 6,140
EBITDA 141 92 30 305
EBIT 1) 95 59 -14 181
1) Excluding depreciation/amortization on surplus values on intangible and tangible fixed assets related to the acquisition of Rautaruukki.
-5%
0%
5%
10%
15%
20%
25%
0
500
1,000
1,500
2,000
16Q116Q216Q316Q417Q117Q217Q317Q418Q118Q218Q318Q419Q119Q2
2016 2017 2018 2019
Sales EBITDA %

Financials

Slightly weaker trend in Group earnings
12
Sales
EBITDA and EBITDA margin2
Shipments1
EBITDA per tonne delivered steel2
1) Including the steel operations: Special Steels, Europe and Americas
2) Excluding items affecting comparability
0
5,000
10,000
15,000
20,000
25,000
16Q1 16Q2 16Q3 16Q4 17Q1 17Q2 17Q3 17Q4 18Q1 18Q2 18Q3 18Q4 19Q1 19Q2
2016 2017 2018 2019
SEK
mill
ion
0
200
400
600
800
1,000
1,200
1,400
1,600
1,800
2,000
16Q1 16Q2 16Q3 16Q4 17Q1 17Q2 17Q3 17Q4 18Q1 18Q2 18Q3 18Q4 19Q1 19Q2
2016 2017 2018 2019
kto
ns
0%
2%
4%
6%
8%
10%
12%
14%
0
500
1,000
1,500
2,000
2,500
3,000
16Q1 16Q2 16Q3 16Q4 17Q1 17Q2 17Q3 17Q4 18Q1 18Q2 18Q3 18Q4 19Q1 19Q2
2016 2017 2018 2019
SEK
mill
ion
EBITDA EBITDA %
0
200
400
600
800
1000
1200
1400
1600
1800
16Q1 16Q2 16Q3 16Q4 17Q1 17Q2 17Q3 17Q4 18Q1 18Q2 18Q3 18Q4 19Q1 19Q2
2016 2017 2018 2019
SEK
/to
nn
e
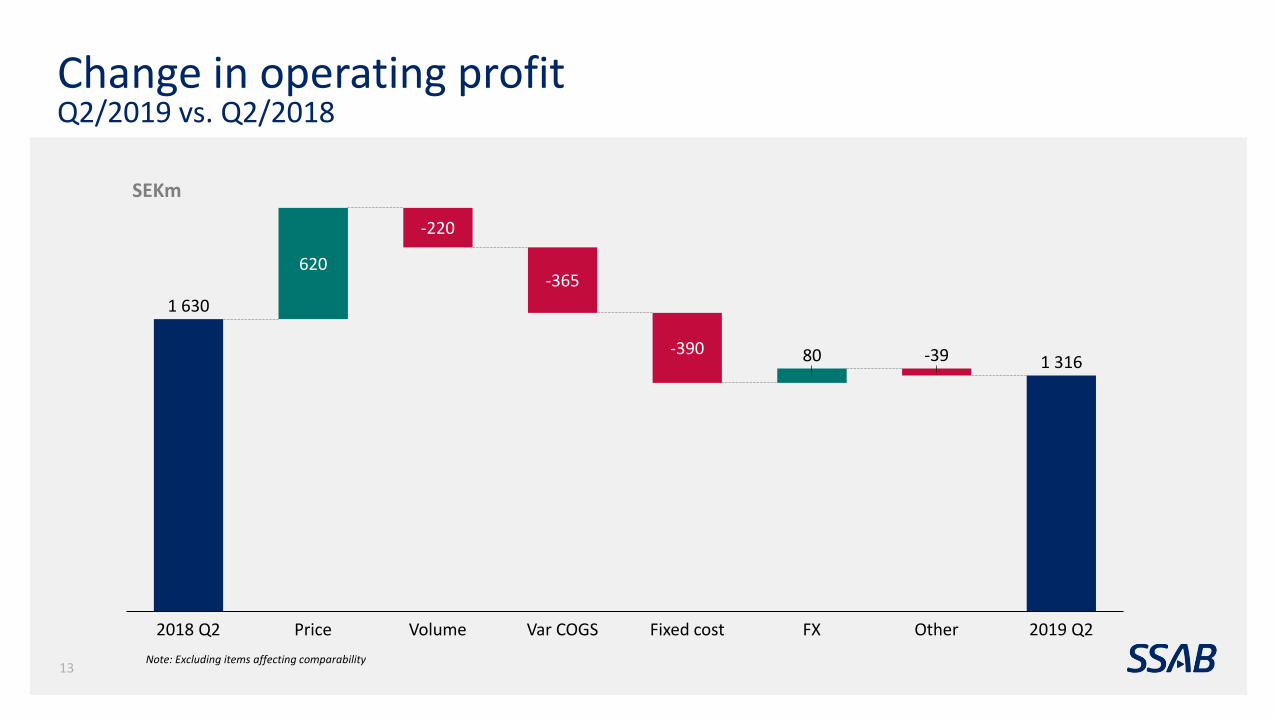
Change in operating profit Q2/2019 vs. Q2/2018
SEKm
Note: Excluding items affecting comparability
620
80
Volume2018 Q2 Price Var COGS
-220
-365
Fixed cost
-390
FX
-39
Other 2019 Q2
1 630
1 316
13
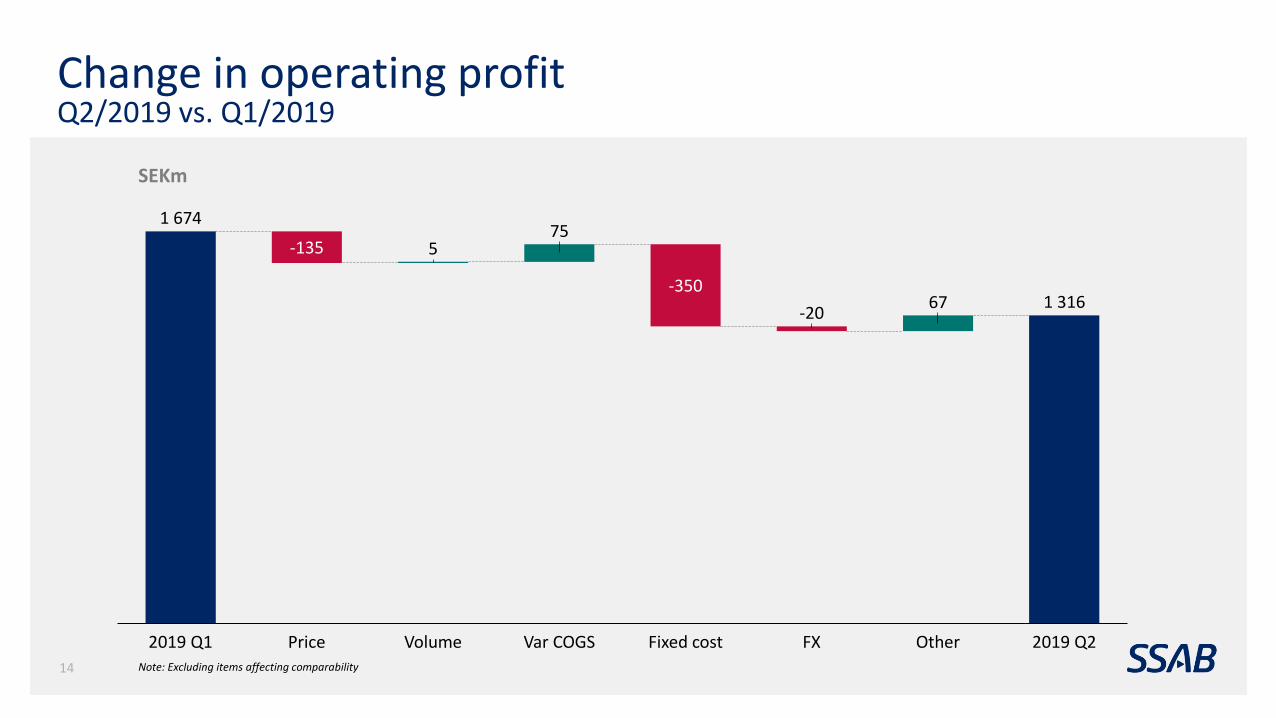
Change in operating profit Q2/2019 vs. Q1/2019
SEKm
Note: Excluding items affecting comparability
575
67
-135
2019 Q1 Var COGSPrice Volume
-350
Fixed cost
1 674
-20
FX Other 2019 Q2
1 316
14

Operating cash flow at good levelNet cash flow impacted by dividend payout and Sanistål acquisition
SEKm Q2/2019 Q2/2018 Q1/2019 2018
Operating profit before depreciation/amortization 2,419 2,582 2,755 8,712
Change in working capital -240 -805 -1,256 -967
Maintenance expenditure -401 -417 -352 -1,943
Other -82 -34 -9 167
Operating cash flow 1,696 1,325 1,139 5,969
Financial items -150 -235 -93 -541
Taxes -702 -105 -254 -628
Cash flow from current operations 845 986 791 4,800
Strategic capital expenditure in plant and machinery -231 -90 -113 -397
Acquisitions of shares and operations -595 - -175 -11
Divestments of shares and operations - - - 76
Cash flow before dividend 19 896 503 4,468
Dividend paid to shareholders -1,545 -1,030 - -1,030
Dividend, non-controlling interest -6 -2 - -3
Acquisition, non-controlling interest -45 - - -
Net cash flow -1,577 -136 503 3,435
0
2000
4000
6000
8000
10000
12000
Cash andback-upfacilities
2019 2020 2021 2022 2023 2024+
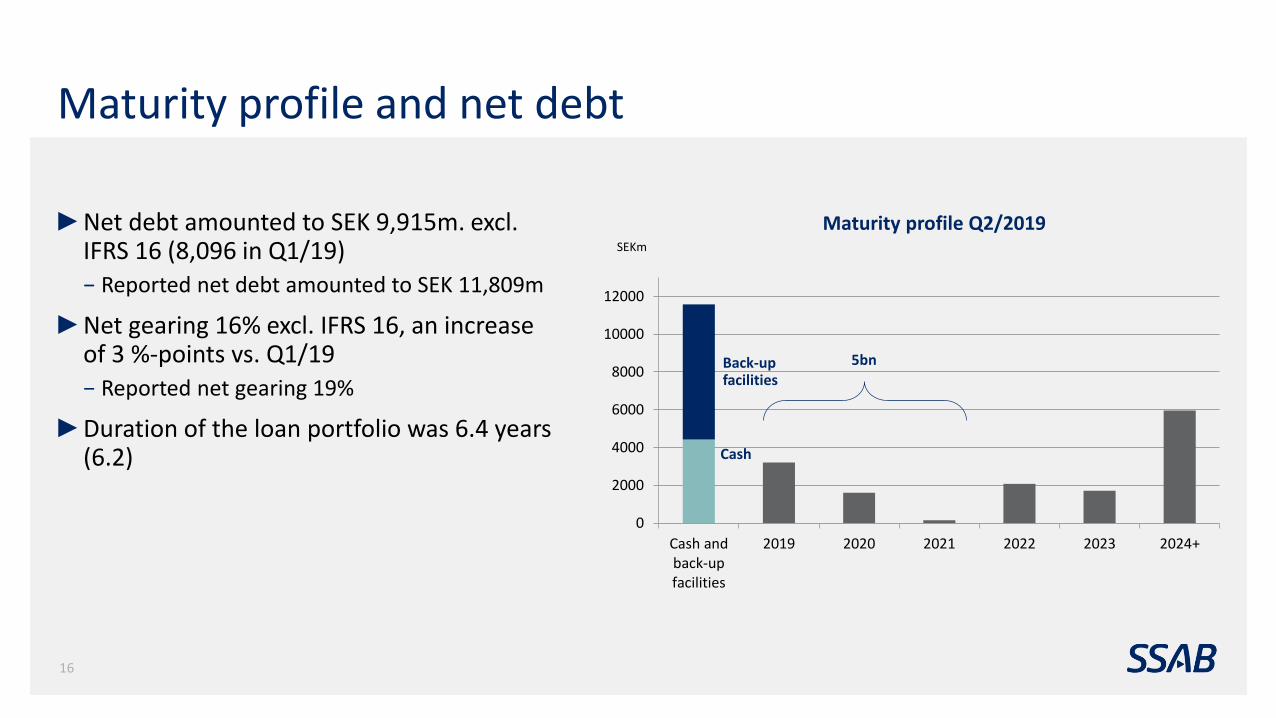
Maturity profile and net debt
►Net debt amounted to SEK 9,915m. excl. IFRS 16 (8,096 in Q1/19)− Reported net debt amounted to SEK 11,809m
►Net gearing 16% excl. IFRS 16, an increase of 3 %-points vs. Q1/19− Reported net gearing 19%
►Duration of the loan portfolio was 6.4 years (6.2)
SEKm
Maturity profile Q2/2019
5bn
Cash
Back-upfacilities
16

Purchase prices for iron ore rose sharplyThe main impact will be in Q3/19
►Average coking coal purchase price in Q2/19 was 9% lower in terms of SEK (-11% in USD) vs. Q1/19
Coking coal
Iron ore
► Average pellet purchase price in Q2/19 was 18% higher in terms of SEK (14% in USD) vs. Q1/19
► Higher purchase prices in Q2 will mostly affect the result of Q3 2019
SSAB’s purchase price, coking coal and iron ore
Indexed
50
100
150
200
250
300
350
Q12016
Q22016
Q32016
Q42016
Q12017
Q22017
Q32017
Q42017
Q12018
Q22018
Q32018
Q42018
Q12019
Q22019
Coal ( SSAB purchase price, index) Iron ore (SSAB purchase price, index)
17

Scrap spot prices continued to decrease in Q2
►SSAB’s average purchase price for scrap was 10% lower in Q2/19 vs. Q1/19 (USD)
Scrap spot priceUSD/gross ton
Q2
Source: AMM
0
50
100
150
200
250
300
350
400
Jan
-16
Feb
-16
Mar
-16
Ap
r-1
6M
ay-1
6Ju
n-1
6Ju
l-1
6A
ug-
16
Sep
-16
Oct
-16
No
v-1
6D
ec-
16
Jan
-17
Feb
-17
Mar
-17
Ap
r-1
7M
ay-1
7Ju
n-1
7Ju
l-1
7A
ug-
17
Sep
-17
Oct
-17
No
v-1
7D
ec-
17
Jan
-18
Feb
-18
Mar
-18
Ap
r-1
8M
ay-1
8Ju
n-1
8Ju
l-1
8A
ug
18
Sep
18
Oct
18
No
v 2
01
8D
ec
20
18
Jan
19
Feb
19
Mar
19
Ap
r 1
9M
ay 1
9Ju
n 1
9Ju
l 19
Chicago #1HM Scrap (AMM) [USD/gross ton]
18
Outlook and summary

Outlook for Q1 for SSAB’s key customer segments
Segment Q3/2019 Comments
Heavy Transport Some reduction in European heavy truck production, from high level
Good activity in the US – rail cars and barges
Automotive Weak demand in main markets
Structural growth in AHSS
Construction Machinery Lower momentum, but still at good level
Material Handling High activity in Mining in several regions – both maintenance and new equipment
Energy Solid demand in wind energy
High activity in US oil and gas segment
Construction Good underlying demand level
Some uncertainty in residential market in Scandinavia
Service Centers Very cautious in US during Q2, potential restocking end of Q3
Hesitation in Europe20
WeakHealthyStrong
SSAB’s outlook for main customer segments Q3/2019
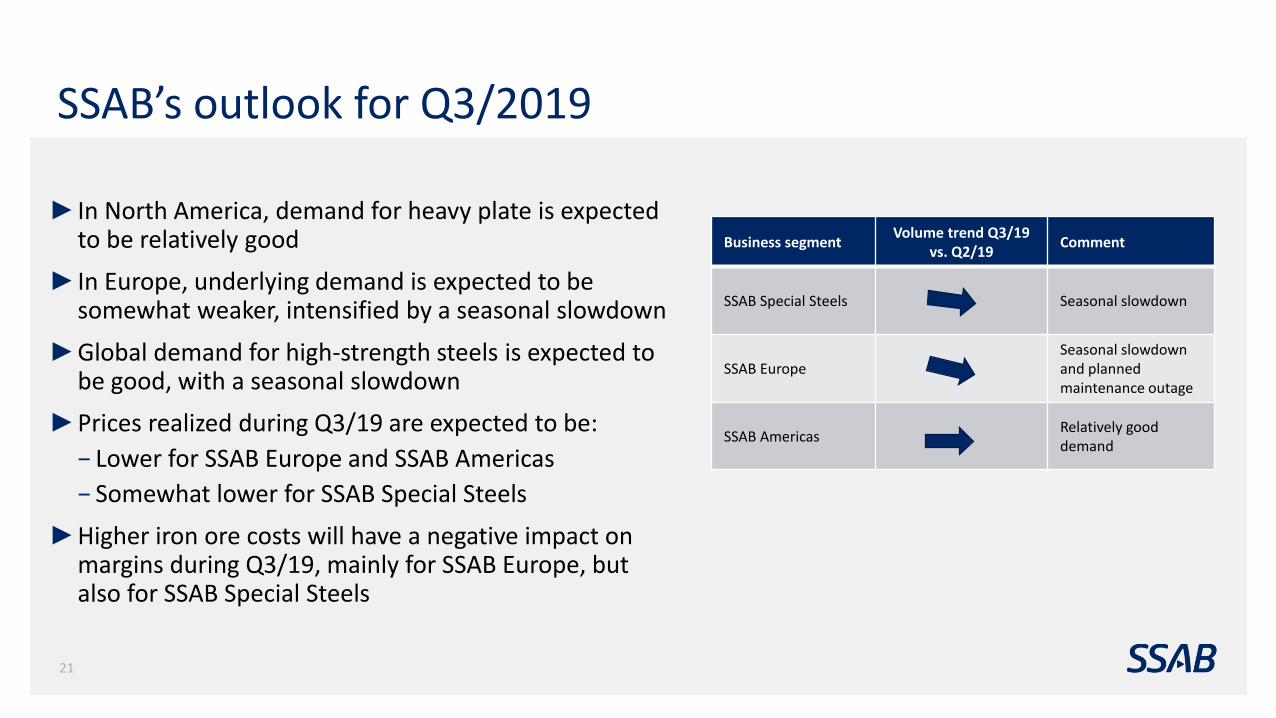
SSAB’s outlook for Q3/2019
Business segmentVolume trend Q3/19
vs. Q2/19Comment
SSAB Special Steels Seasonal slowdown
SSAB EuropeSeasonal slowdown and planned maintenance outage
SSAB AmericasRelatively good demand
► In North America, demand for heavy plate is expected to be relatively good
► In Europe, underlying demand is expected to be somewhat weaker, intensified by a seasonal slowdown
►Global demand for high-strength steels is expected to be good, with a seasonal slowdown
►Prices realized during Q3/19 are expected to be:
− Lower for SSAB Europe and SSAB Americas
− Somewhat lower for SSAB Special Steels
►Higher iron ore costs will have a negative impact on margins during Q3/19, mainly for SSAB Europe, but also for SSAB Special Steels
21

Summary
►Major result improvement from SSAB Americas
►SSAB Europe’s result dropped mainly due to iron ore
►Flexibility measures − Reduction of temporary employees
− Smaller BF in Oxelösund will be idled
− Execute planned cost reductions in all divisions
►Strong balance sheet – regardless of business cycle
22

Questions & Answers

Appendix
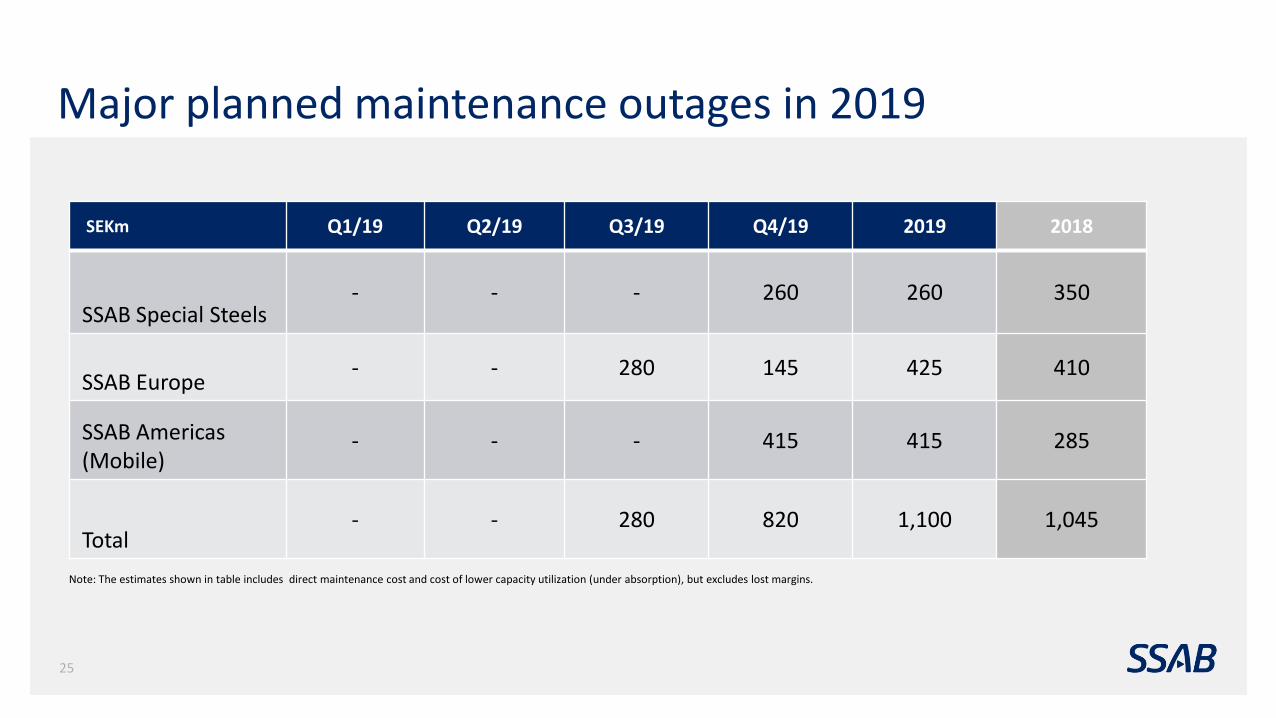
Major planned maintenance outages in 2019
SEKm Q1/19 Q2/19 Q3/19 Q4/19 2019 2018
SSAB Special Steels- - - 260 260 350
SSAB Europe - - 280 145 425 410
SSAB Americas (Mobile)
- - - 415 415 285
Total - - 280 820 1,100 1,045
Note: The estimates shown in table includes direct maintenance cost and cost of lower capacity utilization (under absorption), but excludes lost margins.
25
Debt cost and duration
%
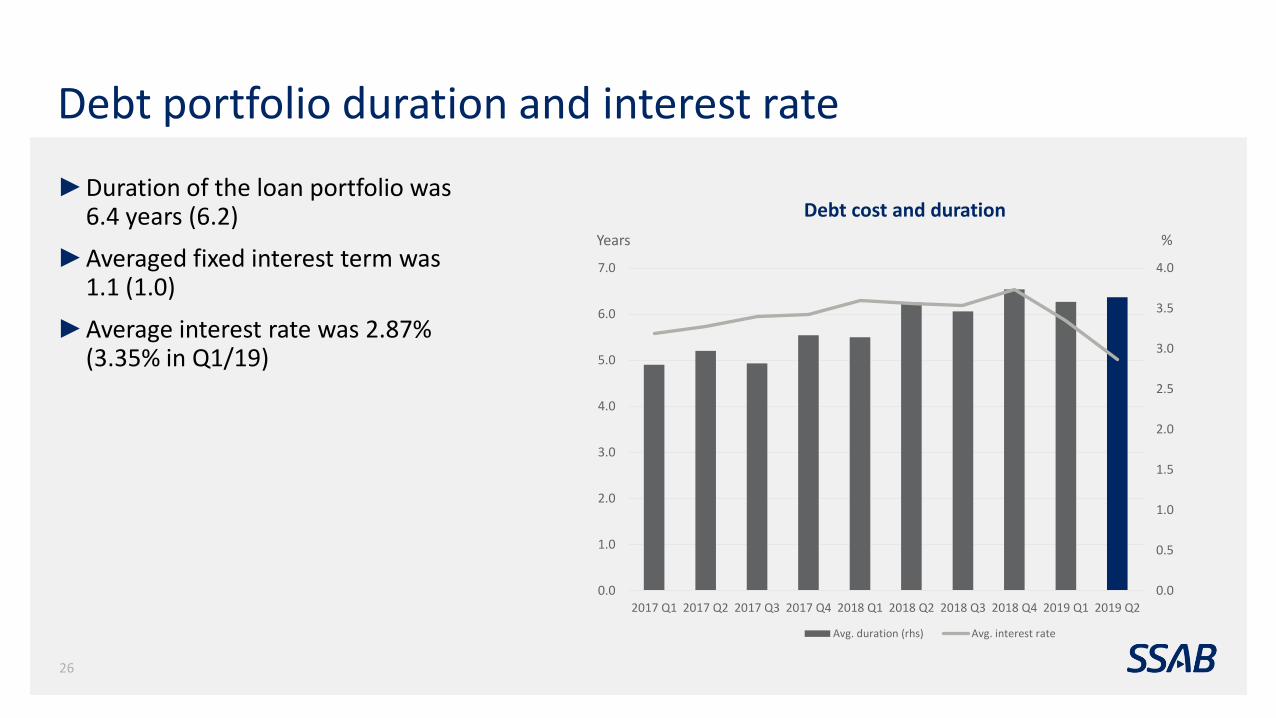
Debt portfolio duration and interest rate
►Duration of the loan portfolio was 6.4 years (6.2)
►Averaged fixed interest term was 1.1 (1.0)
►Average interest rate was 2.87% (3.35% in Q1/19)
Years
0.0
0.5
1.0
1.5
2.0
2.5
3.0
3.5
4.0
2017 Q1 2017 Q2 2017 Q3 2017 Q4 2018 Q1 2018 Q2 2018 Q3 2018 Q4 2019 Q1 2019 Q2
0.0
1.0
2.0
3.0
4.0
5.0
6.0
7.0
Avg. duration (rhs) Avg. interest rate
26