Presentation of D/S NORDEN in rates and tonnage prices; ... – Mainly Handymax focus: Coal, iron...
17
1 DAMPSKIBSSELSKABET NORDEN A/S, AMALIEGADE 49, DK-1256 COPENHAGEN www.ds-norden.com Presentation of D/S NORDEN Copenhagen, April 2006
Transcript of Presentation of D/S NORDEN in rates and tonnage prices; ... – Mainly Handymax focus: Coal, iron...

1DAMPSKIBSSELSKABET NORDEN A/S, AMALIEGADE 49, DK-1256 COPENHAGEN www.ds-norden.com
Presentation of D/S NORDEN
Copenhagen, April 2006

2DAMPSKIBSSELSKABET NORDEN A/S, AMALIEGADE 49, DK-1256 COPENHAGEN www.ds-norden.com
FORWARD-LOOKING STATEMENTS
This presentation contains certain forward-looking statements reflecting the
management’s present judgment of future events and financial results.
Statements relating to 2006 and subsequent years are subject to uncertainty,
and “NORDEN”s actual results may therefore differ from the projections.
Factors that may cause such variance include, but are not limited to, changes in
macro-economic and political conditions, particularly in the Company’s principal
markets; changes to the Company’s rate assumptions and operating costs;
volatility in rates and tonnage prices; regulatory changes; any disruptions to
traffic and operations as a result of external events, etc.
The presentation should not be interpreted as a recommendation to trade
shares in Dampskibsselskabet NORDEN A/S.

3DAMPSKIBSSELSKABET NORDEN A/S, AMALIEGADE 49, DK-1256 COPENHAGEN www.ds-norden.com
TODAY’S AGENDA
Overview
Operating model
Dry Cargo
Tanker
2006 Headlines
Q&A Session
This presentation can be found on www.ds-norden.com

4DAMPSKIBSSELSKABET NORDEN A/S, AMALIEGADE 49, DK-1256 COPENHAGEN www.ds-norden.com
NORDEN in Brief
2005 revenue: USD 1.3 bn75% drycargo earnings, but tank share growing
– Mainly Handymax focus: Coal, iron ore, cement etc.
– Mainly oil product focus – with some crude exposure
124 vessels trading with 50 for delivery– 110 in Drycargo (+35)
– 14 in Tank (+15)
Growth supported by high coverage– Extensive risk management focus
– Customer partnerships
TankUSD 124 mill.
A fully integrated global operator within drycargo and tank
BulkUSD 1.2 bn.
2005 EBITDA: USD 216 mill.*
TankUSD 57 mill.
BulkUSD 165 mill.
Expected net result 2006: USD 110-130 mill.
Current market cap: USD 1 bn*Note: Includes USD 6 mill. in unallocated costs
OVERVIEW

5DAMPSKIBSSELSKABET NORDEN A/S, AMALIEGADE 49, DK-1256 COPENHAGEN www.ds-norden.com
Operating model
Owned (7)
Chartered w. POP (17)
Short term chartered
(86)
Flexible fleet Coverage & customer focus
Contracts of Affreightment
TC out
FFA market
FlexibilityAdds scaleArbitrage opportunities
*Note: Figures indicate drycargo fleet as of end 2005. POP= Purchase option
Asset playTechnical competences in-house
Option based flexibility5-7 year firm periods
Quick and easy cover
Customer relationsLogistical efficiencies
2-5 year firm periods
Total capacity* Coverage
Spot market
The right people make it all work
OVERVIEW

6DAMPSKIBSSELSKABET NORDEN A/S, AMALIEGADE 49, DK-1256 COPENHAGEN www.ds-norden.com
Customer Focused Organisation
Annapolis
Rio de Janeiro
Shanghai
Mumbai
Singapore
Copenhagen
SPOT MARKET
Fulfil individual customer needs on day-to-day basis by fast, reliable and cost efficient transportation.
Market approach
CORE CUSTOMERS
Develop long lasting relationships by constantly adapting to meet customers’ needs and requirements.
KEY PARTNERS
Add value to our partners’ business through exchange of knowledge and share risks and rewards
Core Values: Reliability, Flexibility and Empathy
OVERVIEW

7DAMPSKIBSSELSKABET NORDEN A/S, AMALIEGADE 49, DK-1256 COPENHAGEN www.ds-norden.com
NORDEN Drycargo Overview
0
200
400
600
800
1000
1200
1400
2001 2002 2003 2004 2005
USDm
0%
2%
4%
6%
8%
10%
12%
14%
16%
18%
20%
Margin
Revenue
EBITDA margin
Revenue and EBITDA margin
1172
Fleet data Q4-04 Q4-05Own 2 7Long term TC with POPs 21 17Total active core fleet 23 24
Other 84 86Total active 107 110
Gross for delivery 27 35
Gross fleet 134 145
Financials 2004 2005 GrowthRevenues 1.062 1.172 10%Costs 864 1.007 17%EBITDA 198 165 -17%
Depreciations 1 6 304%Vessel sales & J/Vs 37 80 114%Operating profit 234 239 2%
14%
DRY CARGO
8DAMPSKIBSSELSKABET NORDEN A/S, AMALIEGADE 49, DK-1256 COPENHAGEN www.ds-norden.com
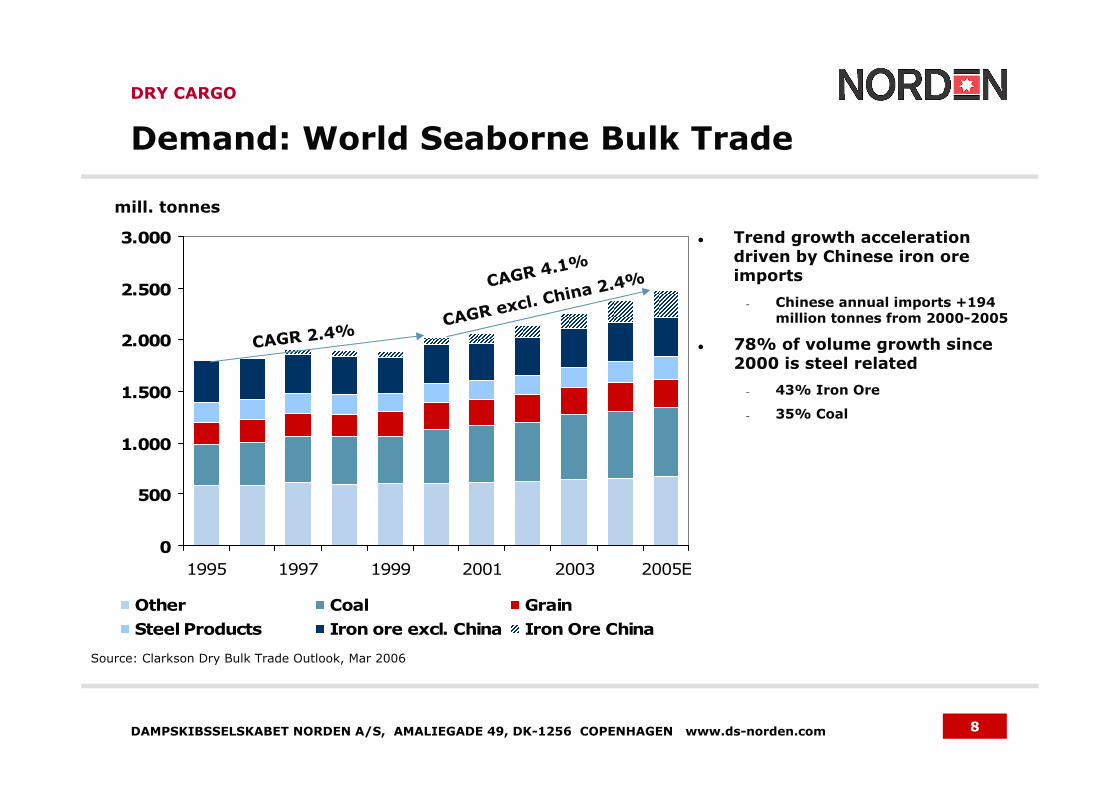
Demand: World Seaborne Bulk Trade
Trend growth acceleration driven by Chinese iron oreimports
– Chinese annual imports +194 million tonnes from 2000-2005
78% of volume growth since2000 is steel related
– 43% Iron Ore
– 35% Coal
0
500
1.000
1.500
2.000
2.500
3.000
1995 1997 1999 2001 2003 2005E
Other Coal GrainSteel Products Iron ore excl. China Iron Ore China
CAGR 2.4%
CAGR 4.1%
CAGR excl. China 2.4%
mill. tonnes
Source: Clarkson Dry Bulk Trade Outlook, Mar 2006
DRY CARGO

9DAMPSKIBSSELSKABET NORDEN A/S, AMALIEGADE 49, DK-1256 COPENHAGEN www.ds-norden.com
Demand: Vast Long Term Potential Remains
419469
629
985
1.163
0
200
400
600
800
1.000
1.200
1.400
1995
1996
1997
1998
1999
2000
2001
2002
2003
2004
Tai
wan
S. K
orea
Japan
Germ
any
USA
230
84
Consumption of crude steel per capita
China
During economic development, steel
consumption usually peaks at high level before falling back to long-term level of
350-400 kg/capita
Kg/capita
Source: International Iron and Steel Institute, Steel Statistics 2005
All things being equal, a doubling to 460kg/capita means iron ore imports have to increase by 210 mill. tonnes per year
DRY CARGO

10DAMPSKIBSSELSKABET NORDEN A/S, AMALIEGADE 49, DK-1256 COPENHAGEN www.ds-norden.com
Supply: Factors Mitigating Fleet Growth
Share of vessels >20 years old exceedorderbook
Scrapping currentlyat historical low
Congestion back to low levels but remainpotential future swing factor
61%
22% 24%
15%
28%
7%
18%22% 22%
18%
0%
10%
20%
30%
40%
50%
60%
70%
Handysize Handymax Panamax Capesize Totaldrycargo
+20 years Orderbook
Orderbook and 20+ year old vessels in pct. of current fleet (dwt)
Source: Clarkson Dry Bulk Trade Outlook, mar 2006
DRY CARGO

11DAMPSKIBSSELSKABET NORDEN A/S, AMALIEGADE 49, DK-1256 COPENHAGEN www.ds-norden.com
DRY CARGO MARKET IS NORMALISING
DRY CARGO
Baltic Dry Index 2004 & 2005/06 YTD
0
1.000
2.000
3.000
4.000
5.000
6.000
7.000
Jan
Fe
b
Ma
r
Ap
r
Ma
y
Jun
Jul
Au
g
Se
p
Oct
No
v
De
c
Jan
Fe
b
Ma
r
2004
2004 avg.
2005 avg.
2005/06
Super-cycle ended in 2005
Demand growth more than halved to 4%
– Chinese iron-ore import growth moderated
– Lower demand growth for coal
– Growth still strong in historical perspective
Some 5% increase in global fleet
Prices of 2nd hand and new-buildings down from historical highs in Q1 2005
Outlook for 2006
Rates below 2005 but still above historical average
– Supply growth of 6-7%
– Demand growth of 3,5-4,5%
Ship values expected to remain firm
BDI avg.-25%

12DAMPSKIBSSELSKABET NORDEN A/S, AMALIEGADE 49, DK-1256 COPENHAGEN www.ds-norden.com
NORDEN Tanker Overview
0
20
40
60
80
100
120
140
2001 2002 2003 2004 2005
USDm
0%
5%
10%
15%
20%
25%
30%
35%
40%
45%
50%
MarginRevenue
EBITDA margin
Revenue and EBITDA margin
125
46%
Financials 2004 2005 GrowthRevenues 105 125 19%Costs 63 67 7%EBITDA 42 57 37%
Depreciations 11 9 -18%Vessel sales & J/Vs 13 49 284%Operating profit 43 97 122%
Fleet data Q4-04 Q4-05Own 5 3Long term TC with POPs 3 3Total active core fleet 8 6
Other 8 8Total active 16 14
Gross for delivery 9 15
Gross fleet 25 29
TANKER

13DAMPSKIBSSELSKABET NORDEN A/S, AMALIEGADE 49, DK-1256 COPENHAGEN www.ds-norden.com
Tank Operations: Product Tankers
Singapore
Copenhagen
Handysize MR
NORDEN product tankers operated in Norient Product Pool
– 15 vessels trading in pool
– Primarily in spot market
– 35-40% period cover
Petrol, diesel, jet fuel, naphta
Customers: Oil traders and major oil companies
Flexible trading areas
Main trading areas:
Aim to become one of the 3 largest product tanker pools by 2007
TANKER

14DAMPSKIBSSELSKABET NORDEN A/S, AMALIEGADE 49, DK-1256 COPENHAGEN www.ds-norden.com
Strong Market in 2005
Market up 7% on average
Strong Q4 due to hurricanes
Structural factors outweighed tough supply/demand balance
– supply +7.3%; oil demand +1.3%
– new refinery capacity built far from consuming areas
– huge impact of disruptions due to tight balance in market
Market outlook for 2006
Rates marginally below 2005-avg
Unexpected events may again shift supply/demand balance
TANKER
Baltic Clean Tanker Index 2004 & 2005/06 YTD
0
500
1.000
1.500
2.000
2.500
Jan Mar May Jul Sep Nov Jan Mar
2004 2005 2006 2004 avg 2005 avg
20042005/06
BCTI avg.+7%

15DAMPSKIBSSELSKABET NORDEN A/S, AMALIEGADE 49, DK-1256 COPENHAGEN www.ds-norden.com
Value of Fleet
51Chartered vessels without POPs
20052004
49
159
36
25
10
123
92
24
7
9Vessels to be delivered:New-buildings (own)
174Total gross fleet
56Hereof with POPs
* POPs = Purchase options
50Total to be delivered
36Chartered vessels with POPs
124Total active vessels
94Chartered vessels without POPs
20Chartered vessels with POPs
10Active fleet:Owned vessels
Fleet
0
500
1.000
1.500
2.000
2.500
3.000
3.500
4.000
4.500
2002 2003 2004 2005
TCs with POPsNet Asset Value per shareShare price (year end)
On balance
Off balance
Total theoretical NAV DKK 4,059 per share
FLEET

16DAMPSKIBSSELSKABET NORDEN A/S, AMALIEGADE 49, DK-1256 COPENHAGEN www.ds-norden.com
Well-Positioned for Continued Profitable Growth
Fleet quality and flexibility
– Competitive and “deep” tonnage book
– Option based model
People & systems
– Risk management
– Strong focus on ”software” quality
Strong market position
– Well-known brand with longreputation for quality and reliability
– Leading positions in Handymax and Panamax, and establishing one in product tank
Continued healthy growth in demand supports rates
– Global GDP growth expectations above 4% for 2006
– Vast potential remains in China
– Tonne-mile factor adds to tonnage demand growth in both drycargo and tank
Mitigating factors to large orderbook
– Scrapping is at historical low
– In drycargo, vessels above 20 years outweigh total current orderbook
Scalable business model Attractive market fundamentals

17DAMPSKIBSSELSKABET NORDEN A/S, AMALIEGADE 49, DK-1256 COPENHAGEN www.ds-norden.com
Questions and answers
This presentation can be found on www.ds-norden.com