September 2008 Rewrite the Future in Côte d’Ivoire September 2006- September 2008.
Upload
egbert-taylorCategory
view
214download
0
PresentationPresentationNovember 26, 2008November 26, 2008
PresentationPresentationNovember 26, 2008November 26, 2008

Key figures Key figures of the year 2007 - 2008of the year 2007 - 2008
ending at September 30, 2008ending at September 30, 2008
(October 1, 2007 – September 30, 2008)(October 1, 2007 – September 30, 2008)
Key figures Key figures of the year 2007 - 2008of the year 2007 - 2008
ending at September 30, 2008ending at September 30, 2008
(October 1, 2007 – September 30, 2008)(October 1, 2007 – September 30, 2008)

2006/2007(Oct. 06–Sept. 07) % Change
SALES (reported)
Currency Translation Impact
Changes in Consolidation Scope (Korea Ratings)
SALES(like-for-like)
744.8 586.9 -21.2%
744.8 624.0 -16.2%
55.5
(in € millions) 2007/2008(Oct. 07–Sept. 08)
-18.4
Sales from reported to Like-for-LikeSales from reported to Like-for-LikeSales from reported to Like-for-LikeSales from reported to Like-for-Like

Sales by CompanySales by Company(reported)(reported)
Sales by CompanySales by Company(reported)(reported)
SALES(reported)
744.8 586.9 21.2%
623.4 447.9FITCH GROUP
Fitch Ratings (excl. Korea Ratings)Korea RatingsFitch Ratings
Intercompany Eliminations
28.2%36.119.2
484.0 24.7%
- 2.9 - 2.0
Algorithmics 105.1 104.9 0.2%
642.6
(in € millions) 2006/2007(Oct. 06–Sept. 07) % Change2007/2008
(Oct. 07–Sept. 08)
-
-
-
-

Sales by CompanySales by Company(like-for-like)(like-for-like)
Sales by CompanySales by Company(like-for-like)(like-for-like)
SALES(like-for-like)
744.8 624.0 16.2%
623.4 490.9FITCH GROUP
Fitch Ratings (excl. Korea Ratings)Korea RatingsFitch Ratings
21.3%21.519.2
512.4 20.3%
-2.9 -2.3Algorithmics 105.1 113.9 8.4%
642.612.0%
(in € millions)
Intercompany Eliminations
2006/2007(Oct. 06–Sept. 07) % Change2007/2008
(Oct. 07–Sept. 08)
-
+-
+
-

2006/2007(Oct. 06–Sept. 07) %
2007/2008(Oct. 07–Sept. 08)
%
1 USA 343.8 46.2 % 214.1 36.5 %
2 UK 111.4 15.0 % 78.3 13.3 %
3 South Korea 21.7 2.9 % 37.6 6.4 %
4 Germany 28.8 3.9 % 28.8 4.9 %
5 Spain 16.6 2.2 % 16.5 2.8 %
6 France 19.3 2.6 % 16.4 2.8 %
7 Switzerland 12.6 1.7 % 16.0 2.7 %
8 Netherlands 20.3 2.7 % 15.9 2.7 %
9 Italy 14.3 1.9 % 15.9 2.7 %
10 Mexico 4.4 0.6 % 11.5 2.0 %
79.6 % 76.8 %
Sales by Geographic RegionsSales by Geographic Regions(reported)(reported)
Sales by Geographic RegionsSales by Geographic Regions(reported)(reported)
Total Sales % (reported)Total Sales % (reported)
From SalesFrom Salesto Recurring Operating Incometo Recurring Operating Income
From SalesFrom Salesto Recurring Operating Incometo Recurring Operating Income
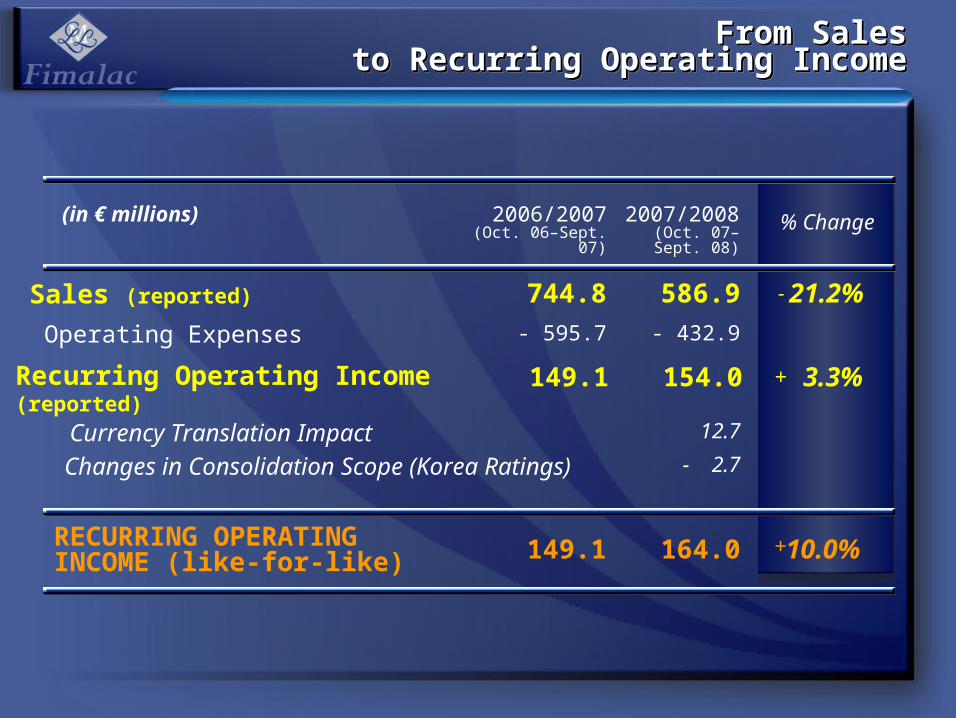
RECURRING OPERATINGINCOME (like-for-like) 149.1 164.0 10.0%
- 595.7 - 432.9
Sales (reported)
149.1 154.0 3.3%
12.7
- 2.7
744.8 586.9 21.2%
Operating Expenses
Recurring Operating Income (reported)
Currency Translation Impact
Changes in Consolidation Scope (Korea Ratings)
(in € millions) 2006/2007(Oct. 06–Sept. 07) % Change2007/2008
(Oct. 07–Sept. 08)
-
+
+

Recurring Operating Income by CompanyRecurring Operating Income by Company(reported)(reported)
Recurring Operating Income by CompanyRecurring Operating Income by Company(reported)(reported)
RECURRING OPERATINGINCOME (reported) 149.1 154.0 3.3%
190.4 171.8FITCH GROUP
9.8%6.4
193.0 178.2 7.7%
-10.0 -9.6
159.1 163.6 2.8%Fitch Ratings (excl. Korea Ratings)
Other (Parent Company & Holdings)
Korea Ratings
Fitch Ratings
-33.9 -14.6 56.9%Algorithmics
2.6
(in € millions) 2006/2007(Oct. 06–Sept. 07) % Change2007/2008
(Oct. 07–Sept. 08)
-
+
+
+
-

Recurring Operating Income by CompanyRecurring Operating Income by Company(like-for-like)(like-for-like)
Recurring Operating Income by CompanyRecurring Operating Income by Company(like-for-like)(like-for-like)
Operating Margin Rate (ROI / Sales)Operating Margin Rate (ROI / Sales)30.0%30.0%21.4%21.4%20.0%20.0%
27.8%27.8%26.3%26.3%
Fitch Ratings LevelFitch Ratings LevelFitch Group LevelFitch Group LevelFimalac Consolidation LevelFimalac Consolidation Level
RECURRING OPERATINGINCOME (like-for-like) 149.1 164.0 10.0%
190.4 183.3FITCH GROUP
3.7%3.7
193.0 187.0 3.1%
-10.0 -9.6
159.1 173.6 9.1%Fitch Ratings (excl. Korea Ratings)Korea Ratings
Fitch Ratings
-33.9 -13.4 60.5%Algorithmics
2.6
(in € millions) 2006/2007(Oct. 06–Sept. 07) % Change2007/2008
(Oct. 07–Sept. 08)
Other (Parent Company & Holdings)
-
+
-
+
+
36.5%36.5%

From Recurring Operating Income From Recurring Operating Income to Operating Result to Operating Result (reported)(reported)
From Recurring Operating Income From Recurring Operating Income to Operating Result to Operating Result (reported)(reported)
OPERATING RESULT (reported)
165.0 118.0
Recurring Operating Income(reported)
15.9 -36.0
149.1 154.0
Other Operating Income & Expense
(in € millions) 2006/2007(Oct. 06–Sept. 07)
2007/2008(Oct. 07–Sept. 08)
From Operating Result From Operating Result to Net Earnings to Net Earnings (reported)(reported)From Operating Result From Operating Result to Net Earnings to Net Earnings (reported)(reported)
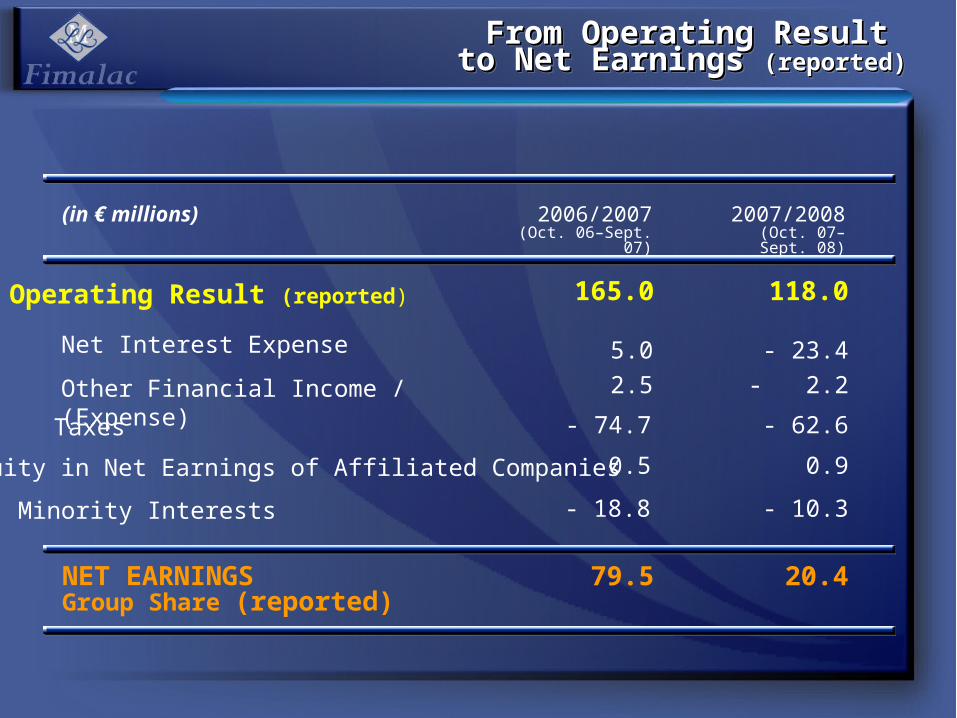
NET EARNINGSGroup Share (reported)
79.5 20.4
Operating Result (reported)
5.0
165.0 118.0
Net Interest Expense
- 74.7Taxes
0.5Equity in Net Earnings of Affiliated Companies
- 18.8Minority Interests
- 23.4
- 62.6
0.9
- 10.3
Other Financial Income / (Expense) 2.5 - 2.2
(in € millions) 2006/2007(Oct. 06–Sept. 07)
2007/2008(Oct. 07–Sept. 08)

Evolution of Fimalac’s ShareholdingEvolution of Fimalac’s ShareholdingEvolution of Fimalac’s ShareholdingEvolution of Fimalac’s Shareholding
including Reserved Treasury Stocks(stock options)
Majority Shareholder
Treasury Stocks
Others
09/30/2007
100.0%
1.1%
66.3%
6.9%
26.8%
09/30/2008
100.0%
1.2%
73.6%
2.1%
24.3%

Cash and Cash Equivalents / (Net Debt) by CompanyCash and Cash Equivalents / (Net Debt) by CompanyCash and Cash Equivalents / (Net Debt) by CompanyCash and Cash Equivalents / (Net Debt) by Company
Fitch Group
Parent Company & Holdings
Net Cash/(Debt) Position (excl. Building)
- 160
+ 243
+ 83
North Colonnade (London Building) - 225
- 225
+ 143
- 82
- 192
09/30/2007 09/30/2008(in € millions)


Group HistoryGroup History Group HistoryGroup History

Group StructureGroup StructureGroup StructureGroup Structure
80% 20%

Fitch Group Fitch Group Revenue TrendRevenue Trend
Fitch Group Fitch Group Revenue TrendRevenue Trend
In US $ MilIn US $ Mil
Note: Includes Korea Ratings as of April 2007
$305$356
$455$511
$693
$774
$989
$882
$0
$200
$400
$600
$800
$1 000
$1 200
2001
2002
2003
2004
2005
2005
/2006
2006
/2007
2007
/2008

In US $ Mil
Fitch Group Fitch Group EBITDA TrendEBITDA Trend
Fitch Group Fitch Group EBITDA TrendEBITDA Trend
$93$109
$164
$189
$233$246
$327
$288
$0
$50
$100
$150
$200
$250
$300
$350

In US $ Mil
Fitch Group Fitch Group Operating Income TrendOperating Income Trend
Fitch Group Fitch Group Operating Income TrendOperating Income Trend
$72$83
$113 $110
$150$160
$211
$246
$0
$50
$100
$150
$200
$250
$300
2001
2002
2003
2004
2005
2005
/2006
2006
/2007
2007
/2008

Fitch Group Fitch Group Revenue to Operating IncomeRevenue to Operating Income
Fitch Group Fitch Group Revenue to Operating IncomeRevenue to Operating Income
in US$ millions 2006/2007 2007/2008 % Change
RevenueRevenue 988.5988.5 881.6881.6 - 10.8%- 10.8%
Personnel costsPersonnel costs 482.2482.2 433.3433.3 - 10.1%- 10.1%
External expensesExternal expenses 179.6179.6 160.2160.2 - 10.8%- 10.8%
Total chargesTotal charges 661.7661.7 593.5593.5 - 10.3%- 10.3%
EBITDAEBITDA 326.8326.8 288.1288.1 -11.8%-11.8%Profit sharing planProfit sharing plan 70.170.1 - 2.5- 2.5
DepreciationDepreciation 21.021.0 18.918.9
Intangible assets amortizationIntangible assets amortization 24.524.5 26.026.0
Operating IncomeOperating Income 211.2211.2 245.7245.7 +16.3%+16.3%

Financial HighlightsFinancial HighlightsFinancial HighlightsFinancial Highlights
(US$ millions)(US$ millions) RevenueRevenue EBITDAEBITDA Op IncomeOp Income
06/0706/07 07/0807/08 06/0706/07 07/0807/08 06/0706/07 07/0807/08
FITCH GROUPFITCH GROUP 988.5988.5 881.6881.6 -10.8%-10.8% 326.8326.8 288.1288.1 -11.8%-11.8% 211.2211.2 245.7245.7 +16.3%+16.3%
Fitch RatingsFitch Ratings 827.4827.4 672.8672.8 -18.7%-18.7% 338.1338.1 270.1270.1 -20.1%-20.1% 252.8252.8 258.0258.0 +2.1%+2.1%
Korea RatingsKorea Ratings 25.625.6 54.254.2 5.25.2 13.113.1 3.43.4 9.69.6
AlgorithmicsAlgorithmics 139.4139.4 157.7157.7 +13.1%+13.1% -16.5-16.5 4.94.9 -45.0-45.0 -21.9-21.9
EliminationsEliminations -3.9-3.9 -3.1-3.1
Note: Includes Korea Ratings as of April 2007


Evolution of Recent Market Evolution of Recent Market EventsEvents
Evolution of Recent Market Evolution of Recent Market EventsEvents
The credit situation began with declining performance of RMBS and CDOs The credit situation began with declining performance of RMBS and CDOs backed by U.S. subprime residential mortgagesbacked by U.S. subprime residential mortgages
The contagion effects of the subprime crisis soon spread to other assets The contagion effects of the subprime crisis soon spread to other assets classes, institutions and geographic regionsclasses, institutions and geographic regions
September 2008 marked the beginning of a particularly turbulent periodSeptember 2008 marked the beginning of a particularly turbulent period

In response, governments around the world have taken actions to shore up In response, governments around the world have taken actions to shore up the debt capital markets and support the global financial services industrythe debt capital markets and support the global financial services industry
The global financial markets continue to experience an unprecedented level The global financial markets continue to experience an unprecedented level of stress and volatilityof stress and volatility
Illiquidity, price volatility and widening spreads across asset classes are Illiquidity, price volatility and widening spreads across asset classes are impacting both short-and long-term credit marketsimpacting both short-and long-term credit markets
Evolution of Recent Market Evolution of Recent Market EventsEvents
Evolution of Recent Market Evolution of Recent Market EventsEvents

Impact on FitchImpact on FitchImpact on FitchImpact on Fitch
Key market dynamics impact Fitch in several ways:Key market dynamics impact Fitch in several ways:
Constrained debt market activity
Evolving credit fundamentals
Change in the global regulatory environment

Global Debt IssuanceGlobal Debt IssuanceGlobal Debt IssuanceGlobal Debt Issuance
Calendar 2008 saw global debt issuance volume significantly decreaseCalendar 2008 saw global debt issuance volume significantly decrease
For the first 9 months of calendar 2008, debt issuance totaled $3.5 trillion, a 36% decline from the same period last year and the slowest 9 month period since 2002
3Q08, down 57% over the prior quarter, was the slowest quarter for debt issuance since 2000
Source: Thomson Reuters

Debt Issuance: Structured Debt Issuance: Structured FinanceFinance
Debt Issuance: Structured Debt Issuance: Structured FinanceFinance
Global structured finance issuance volume totaled $450 billion in calendar Global structured finance issuance volume totaled $450 billion in calendar 3Q08 YTD3Q08 YTD
Issuance volume through 3Q08 represents an 80% drop in issuance compared to the same period in 2007
Securitizations year-to-date comprise 13% of total global debt issuance, down from 40% from the same period last year
Source: Thomson Reuters
Global Structured Finance Issuance
0
500
1 000
1 500
2 000
2 500
3 000
3 500
2003 2004 2005 2006 2007 3Q08 YTD
Issu
ance
($B
)
MBS (RMBS & CMBS) ABS (ABS & CDOs)

Debt Issuance: Structured Debt Issuance: Structured FinanceFinance
Debt Issuance: Structured Debt Issuance: Structured FinanceFinance
The US structured finance market The US structured finance market saw its lowest volumes in 3Q08 since saw its lowest volumes in 3Q08 since 19951995
Year over year, 3Q08 YTD US Year over year, 3Q08 YTD US issuance declined across all asset issuance declined across all asset classes compared to 3Q07 YTDclasses compared to 3Q07 YTD
Issuance volumes in the EMEA Issuance volumes in the EMEA structured finance market were also structured finance market were also impactedimpacted
3Q08 YTD issuance down 90% from the same period last year
Sources: Thomson Reuters, JPMorgan, Dealogic, Goldman Sachs
US Structured Finance Issuance
0
500
1 000
1 500
2 000
2 500
Issu
ance
($B
)

Debt Issuance: Corporate Finance Debt Issuance: Corporate Finance Investment GradeInvestment Grade
Debt Issuance: Corporate Finance Debt Issuance: Corporate Finance Investment GradeInvestment Grade
Source: Thomson Reuters, Dealogic, Goldman Sachs
0
200
400
600
800
1 000
3Q 06 4Q 06 1Q 07 2Q 07 3Q 07 4Q 07 1Q 08 2Q 08 3Q 08
$ B
illio
nsUS Non-US
Global Investment Grade Bond IssuanceGlobal Investment Grade Bond Issuance
3Q08 YTD investment grade 3Q08 YTD investment grade corporate debt issuance declined 19% corporate debt issuance declined 19% year-over-yearyear-over-year
3Q08 saw the worst quarter since 2003
Financial institutions have been Financial institutions have been particularly impacted particularly impacted In the US, financial institutions issuance
fell 37% in 3Q08 YTD relative to the prior year
Recent government guarantees of bank debt issuance facilitating some issuance
A tight credit market and a slowing A tight credit market and a slowing global economy have also impacted global economy have also impacted non-financial debt issuance as the cost non-financial debt issuance as the cost of debt financing has risenof debt financing has risen
Debt Issuance: Corporate FinanceDebt Issuance: Corporate FinanceHigh Yield and Leverage LoansHigh Yield and Leverage Loans
Debt Issuance: Corporate FinanceDebt Issuance: Corporate FinanceHigh Yield and Leverage LoansHigh Yield and Leverage Loans
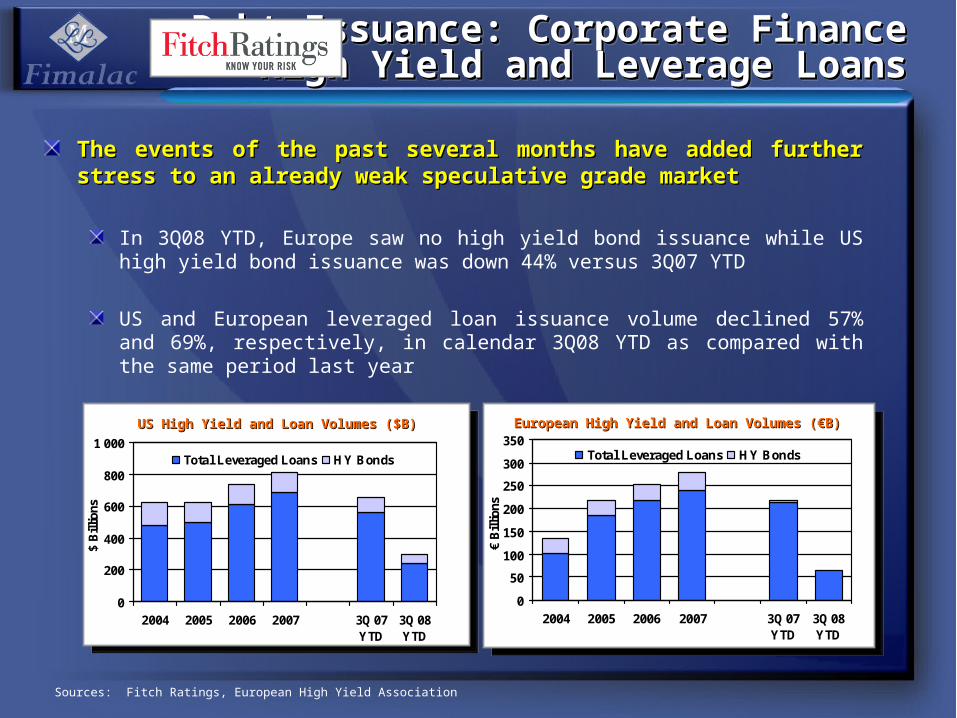
The events of the past several months have added further stress to an The events of the past several months have added further stress to an already weak speculative grade marketalready weak speculative grade market
In 3Q08 YTD, Europe saw no high yield bond issuance while US high yield bond issuance was down 44% versus 3Q07 YTD
US and European leveraged loan issuance volume declined 57% and 69%, respectively, in calendar 3Q08 YTD as compared with the same period last year
0
200
400
600
800
1 000
2004 2005 2006 2007 3Q 07YTD
3Q 08YTD
$ B
illio
ns
Total Leveraged Loans HY Bonds
US High Yield and Loan Volumes ($B)US High Yield and Loan Volumes ($B)
Sources: Fitch Ratings, European High Yield Association
0
50
100
150
200
250
300
350
2004 2005 2006 2007 3Q 07YTD
3Q 08YTD
€ B
illio
ns
Total Leveraged Loans HY Bonds
European High Yield and Loan Volumes (European High Yield and Loan Volumes (€B)€B)

Ratings Activity: Structured Ratings Activity: Structured FinanceFinance
Ratings Activity: Structured Ratings Activity: Structured FinanceFinance
During 2008, credit rating downgrades exceeded rating upgrades, a During 2008, credit rating downgrades exceeded rating upgrades, a reflection of the level of deterioration in structured financereflection of the level of deterioration in structured finance
The areas most impacted by downgrades include:The areas most impacted by downgrades include:
US RMBS, primarily the 2005-2007 subprime and Alt-A vintages
US and European CDOs, due to poor performance of underlying collateral
European CMBS and RMBS, although on a smaller scale, resulting from deteriorating collateral
Downgrades impacting mostly junior tranches

Ratings Activity: Ratings Activity: European Structured FinanceEuropean Structured Finance
Ratings Activity: Ratings Activity: European Structured FinanceEuropean Structured Finance
As demonstrated by rating activity in EMEA, downgrades have exceeded As demonstrated by rating activity in EMEA, downgrades have exceeded upgrades in recent quartersupgrades in recent quarters
CDOs most heavily impacted

Ratings Activity: Ratings Activity: Financial Institutions Financial Institutions
Ratings Activity: Ratings Activity: Financial Institutions Financial Institutions
Credit quality among financial institutions shifted in 2008Credit quality among financial institutions shifted in 2008Rating actions increased as the crisis intensified in Q3
However, many financial institutions have benefited from government intervention
Financial institutions generally remain highly rated- normally in the ‘AA’ or ‘A’ categories
Fitch Global Financial Institution Rating Actions*
0
25
50
75
100
125
150
175
1Q04 2Q04 3Q04 4Q04 1Q05 2Q05 3Q05 4Q05 1Q06 2Q06 3Q06 4Q06 1Q07 2Q07 3Q07 4Q07 1Q08 2Q08 3Q08
Downgrades Upgrades
*Includes Bank, Non-Bank Financial Institutions, and Insurance IDR rating actions, which may include actions taken on both parent and subsidiary ratings, where subsidiary has rated debt by Fitch.
(No. of Actions)

Ratings Activity: Ratings Activity: Non-Financial Corporates Non-Financial Corporates
Ratings Activity: Ratings Activity: Non-Financial Corporates Non-Financial Corporates
A weakening global economy and instability in the capital markets has also A weakening global economy and instability in the capital markets has also affected non-financial corporate issuersaffected non-financial corporate issuers
Although there was an increasing number of downgrades in 2008, rating activity was more balanced than in structured finance and financial institutions
Fitch Global Industrial Rating Actions*
0
25
50
75
100
125
1Q04 2Q04 3Q04 4Q04 1Q05 2Q05 3Q05 4Q05 1Q06 2Q06 3Q06 4Q06 1Q07 2Q07 3Q07 4Q07 1Q08 2Q08 3Q08
Downgrades Upgrades
*Includes IDR rating actions, which may include actions taken on both parent and subsidiary ratings, where subsidiary has rated
debt by Fitch.
(No. of Actions)

Fitch Credit InitiativesFitch Credit InitiativesFitch Credit InitiativesFitch Credit Initiatives
As market conditions unfolded, Fitch has focused on ensuring the quality and As market conditions unfolded, Fitch has focused on ensuring the quality and appropriateness of its credit analyticsappropriateness of its credit analytics
Fitch has also been keenly focused on finding the right balance in our ratingsFitch has also been keenly focused on finding the right balance in our ratings
Examples of recent credit initiatives:Examples of recent credit initiatives:Rating outlooks for U.S. Structured Finance
On-site reviews of residential loan servicers and originators
Projected loss analysis for structured finance CDOs
Updated criteria for CDOs exposed to corporate debt and structured finance
Updated criteria for bank ratings
Proposed changes to municipal ratings scale (will reassess in 1Q09)

Regulatory Environment – USRegulatory Environment – USRegulatory Environment – USRegulatory Environment – US
In response to evolving market conditions, various In response to evolving market conditions, various regulatory bodies have regulatory bodies have undertaken assessments of the broader financial markets and the specific roles undertaken assessments of the broader financial markets and the specific roles and policies of rating agenciesand policies of rating agencies
Securities and Exchange Commission (SEC)Securities and Exchange Commission (SEC)Regulatory oversight via the 2006 Credit Rating Agency Reform Act
Ongoing assessment of the US ratings industry in 2007 and 2008
Published initial proposals in June 2008; final rules set for December 3
US CongressUS CongressSeveral hearings on various markets and industries as a result of market conditions
October 2008 hearing on the role of credit rating agencies
Additional hearings likely in 2009
Broad-based reassessment of US financial regulatory regime possible

Regulatory Environment – EURegulatory Environment – EURegulatory Environment – EURegulatory Environment – EU
International Organization of Securities Commissions (IOSCO)International Organization of Securities Commissions (IOSCO)
Published a final report containing amendments to its Code of Conduct Fundamentals for Rating Agencies in April 2008
European CommissionEuropean Commission
On November 12, the EC released its proposal outlining new regulatory requirements for rating agencies across the European Union
Proposed regulation to be approved by EU Parliament and Council
G-20 SummitG-20 Summit
November 15/16 discussion held in Washington focused on market reforms and financial stability

Fitch SolutionsFitch SolutionsFitch SolutionsFitch Solutions
Division that consolidates all non-rating products and services, product Division that consolidates all non-rating products and services, product development, and the firm's product sales forcedevelopment, and the firm's product sales force
Reinforces and further separates Fitch’s analytical activities from commercial activities
Offering a wide range of fixed income content, analytical tools and Offering a wide range of fixed income content, analytical tools and servicesservices
Fitch ResearchAnalytics
Risk and Performance Pricing and Valuation Structured Finance Surveillance
Services Fitch Training

Fitch Solutions (continued)Fitch Solutions (continued)Fitch Solutions (continued)Fitch Solutions (continued)
Stable, growth-oriented business modelStable, growth-oriented business modelOver 1,200 subscribing firms and 8,600 users
Subscription-based revenue streamsSubscription-based revenue streamsPredictable, recurring revenue
Traditionally strong renewal rates
Not directly tied to issuance
New products and partnerships to meet investors’ need for increased New products and partnerships to meet investors’ need for increased transparency and additional risk measures – E.g.,transparency and additional risk measures – E.g.,
Acquired equity stake in Portsmouth Financial Systems in May 2008; Increased in October 2008
Launched Risk & Performance Analytics Platform in June 2008
Announced partnership with NumeriX, a leading structured credit analytics provider, in November 2008

Revenue by SegmentRevenue by SegmentRevenue by SegmentRevenue by Segment
((US$ millions)US$ millions) RevenueRevenue
2006/20072006/2007 2007/20082007/2008 % change% change
FITCH RATINGSFITCH RATINGS 827.4827.4 672.8672.8 -18.7%-18.7%
Structured FinanceStructured Finance 422.9422.9 232.6232.6 -45.0%-45.0%
Corporate FinanceCorporate Finance 315.0315.0 336.1336.1 +6.7%+6.7%
Subscriptions / Training Subscriptions / Training (Fitch Solutions)(Fitch Solutions)
89.589.5 104.1104.1 +16.3%+16.3%
KOREA RATINGSKOREA RATINGS 25.625.6 54.254.2

((US$ millions)US$ millions) RevenueRevenue
2006/20072006/2007 2007/20082007/2008 % change% change
FITCH RATINGSFITCH RATINGS 827.4827.4 672.8672.8 -18.7%-18.7%
North AmericaNorth America 432.5432.5 295.5295.5 -31.7%-31.7%
EMEAEMEA 314.4314.4 297.0297.0 -5.5%-5.5%
Latin AmericaLatin America 39.239.2 42.442.4 +8.2%+8.2%
Asia PacificAsia Pacific 41.341.3 37.937.9 -8.2%-8.2%
KOREA RATINGSKOREA RATINGS 25.625.6 54.254.2
Note: The 2006/2007 regional split reflects minor changes in regional reporting from previously reported figures.Note: The 2006/2007 regional split reflects minor changes in regional reporting from previously reported figures.
Revenue by RegionRevenue by RegionRevenue by RegionRevenue by Region

Fitch Ratings Fitch Ratings EBITDA and Operating IncomeEBITDA and Operating Income
Fitch Ratings Fitch Ratings EBITDA and Operating IncomeEBITDA and Operating Income
Note: Financials exclude Korea RatingsNote: Financials exclude Korea Ratings
(in US$ millions) 2006/2007 2007/2008 % Change
Revenue Revenue 827.4827.4 672.8672.8 -18.7%-18.7%
EBITDA EBITDA 338.1338.1 270.1270.1 -20.1%-20.1%
EBITDA MarginEBITDA Margin 40.9%40.9% 40.2%40.2%
Profit sharing planProfit sharing plan 70.070.0 -2.6-2.6
Depreciation & AmortizationDepreciation & Amortization 15.315.3 14.714.7
Operating Income Operating Income 252.8252.8 258.0258.0 +2.1%+2.1%
Operating Income MarginOperating Income Margin 30.6%30.6% 38.3%38.3%

Expense ManagementExpense ManagementExpense ManagementExpense Management
Fitch continues to focus on managing Fitch continues to focus on managing expensesexpenses
Headcount-related costs are the largest Headcount-related costs are the largest component of controllable expenses component of controllable expenses
Headcount declined 12% in fiscal 2008 due to natural attrition and planned staff reductions
Variable compensation expenses, bonus accruals, and incentive compensation charges have been reduced
Careful expense management, balanced Careful expense management, balanced with focused investments in areas of with focused investments in areas of continued growth, will provide Fitch with a continued growth, will provide Fitch with a stable platform to move forwardstable platform to move forward
Global Headcount
1 3501 447
1 617
1 827
2 064
2 214
1 942
0
500
1 000
1 500
2 000
2 500
2002 2003 2004 2005 2006 2007 2008
Note: Excludes Korea Ratings. For years 2002-2005, as of Dec Note: Excludes Korea Ratings. For years 2002-2005, as of Dec 31. For year 2006-2008, as of Sept 30.31. For year 2006-2008, as of Sept 30.

ConclusionConclusionConclusionConclusion
The entire organization has rallied around the urgency of the credit challenges, The entire organization has rallied around the urgency of the credit challenges, aiming to be timely and transparent with our research and ratingsaiming to be timely and transparent with our research and ratings
The company is striving for balance and perspective while beingThe company is striving for balance and perspective while beingResponsive to the realities of the market
Focused on the quality of our analytical work
Transparent in our dealings with key constituencies
Disciplined in managing the business
Given continued stress in the financial markets and lack of visibility into future Given continued stress in the financial markets and lack of visibility into future debt market activity, we are not offering a revenue outlook for fiscal 2009debt market activity, we are not offering a revenue outlook for fiscal 2009


AlgorithmicsAlgorithmicsHighlightsHighlights
AlgorithmicsAlgorithmicsHighlightsHighlights
157 New License Orders157 New License Orders♦ Strong add-on sales and new business Strong add-on sales and new business
400 Software Solution clients 400 Software Solution clients ♦ Continuing expansion into buy-sideContinuing expansion into buy-side accounts, and new geographical accounts, and new geographical
marketsmarkets
151 Content and Data clients 151 Content and Data clients ♦ Addition of new clients, however also attrition due to consolidationAddition of new clients, however also attrition due to consolidation
735 professionals in 22 global offices 735 professionals in 22 global offices ♦ Increased operating leverage: revenue growth at slightly reduced staff Increased operating leverage: revenue growth at slightly reduced staff
levels (compared to March update) levels (compared to March update)

Market Risk Solutions
176 clients
Credit and Capital Solutions
121 clients
Operational Risk Solutions
98 clients
Collateral Management Solutions
70 clients
AlgorithmicsAlgorithmicsSolution Achievements Solution Achievements
AlgorithmicsAlgorithmicsSolution Achievements Solution Achievements

AlgorithmicsAlgorithmicsGrowth TrajectoryGrowth Trajectory
AlgorithmicsAlgorithmicsGrowth TrajectoryGrowth Trajectory
Algorithmics revenue is nearly Algorithmics revenue is nearly double what it was at the time of its double what it was at the time of its acquisition by Fitchacquisition by Fitch
Focused investments have delivered Focused investments have delivered top-line growthtop-line growth
Broadened geographic footprint
Extended vertical reach
Enhanced technology platforms
Algorithmics Revenue
$0
$50
$100
$150
$200
2004
2005
2005
/2006
2006
/2007
2007
/2008
Note: Fitch acquired Algorithmics on January 25, 2005. The 2004 figure is a proforma estimate representing the year ended January 2005 plus legacy FRM revenue. The 2005 figure represents revenue previously reported for the calendar year ended December 2005. All other years represent revenue previously reported for the Fimalac fiscal year ended September 30.
In US $ Mil

AlgorithmicsAlgorithmicsRevenue by RegionRevenue by Region
AlgorithmicsAlgorithmicsRevenue by RegionRevenue by Region
(in millions of US$)2006/2007
(Oct 06 – Sept 07)
2007/2008(Oct 07 - Sept08)
% Change
North AmericaNorth America 37.0 38.7 + 4.6%
Europe, Middle East & AfricaEurope, Middle East & Africa 81.1 97.7 +20.5%
Latin AmericaLatin America 4.5 5.6 +24.4%
Asia PacificAsia Pacific 16.8 15.7 - 6.5%
TOTAL ALGORITHMICSTOTAL ALGORITHMICS 139.4*139.4* 157.7*157.7* +13.1%+13.1%
*Includes inter-company revenue of $3.9M and $3.1M for the period ending September 07 and 08 respectively. *Includes inter-company revenue of $3.9M and $3.1M for the period ending September 07 and 08 respectively.

AlgorithmicsAlgorithmicsEBITDA and Operating Income EBITDA and Operating Income
AlgorithmicsAlgorithmicsEBITDA and Operating Income EBITDA and Operating Income
*Includes inter-company revenue of $3.9M and $3.1M for the period ending September 07 and 08 respectively. *Includes inter-company revenue of $3.9M and $3.1M for the period ending September 07 and 08 respectively.
(in (in millions of US$)millions of US$) 2006/20072006/2007(Oct 06 – Sept (Oct 06 – Sept
07)07)
2007/20082007/2008(Oct 07 - Sept 08)(Oct 07 - Sept 08)
% Change% Change
RevenueRevenue 139.4*139.4* 157.7*157.7* +13.1%+13.1%
EBITDAEBITDA - 16.5- 16.5 + 4.9+ 4.9
Profit sharing planProfit sharing plan 0.10.1 0.10.1
DepreciationDepreciation 5.75.7 5.15.1
Intangible assets amortizationIntangible assets amortization 22.722.7 21.621.6
Recurring Operating IncomeRecurring Operating Income - 45.0- 45.0 - 21.9- 21.9

AlgorithmicsAlgorithmicsMarket Drivers Market Drivers
AlgorithmicsAlgorithmicsMarket Drivers Market Drivers
Current market turmoil reinforces the importance of effective risk management and will also lead to more comprehensive regulation
Risk aware business applications are seen as a pre-condition for informed growth
Sound risk management has become a critical requirement in ‘related’ market verticals and emerging markets
Growing demands on risk management and cost pressures reinforce ‘buy’ over ‘build’ decisions
Positive long term demand drivers may be balanced in the short term by the effects of uncertainty and consolidation in the industry

AlgorithmicsAlgorithmicsInvestment FocusInvestment Focus
AlgorithmicsAlgorithmicsInvestment FocusInvestment Focus
Establishing presence in new geographical marketsEstablishing presence in new geographical markets
August 13, 2008 – “BlueCrest Capital Management announced that, as of July 1, 2008, Algorithmics' Algo Risk Service is in production for the risk management practice of BlueCrest. This brings together the world's leading provider of enterprise risk solutions and one of the top ten largest hedge fund firms in Europe. “
September 17, 2008 – “Allianz Group, the leading global services provider in insurance, banking and asset management, has chosen Algorithmics for its award-winning expertise in portfolio replication and enterprise risk management that will enable Allianz to calculate its risk capital across the entire group and meet its Solvency II requirements. “
April 9, 2008 – Algorithmics ranked by Celent as a leader for advanced features and technology and a leader for depth of client services in their 'Beyond Basel II: Evaluating the Financial and Credit Risk Solution Vendors 2008' .
Investing in managed service solutions for asset managers and hedge Investing in managed service solutions for asset managers and hedge fundsfunds
Continued focus on core solutions Continued focus on core solutions
Deepening penetration of the insurance industry Deepening penetration of the insurance industry
September 15, 2008 – “ Shin Kong Financial Holding Co, Ltd (SKFH), the Taiwanese financial services group, has chosen Algorithmics' market risk solution for enterprise risk management across the whole group. “
September 11, 2008 – Algorithmics has been issued a patent for its "Generator Libraries", the innovative building blocks used as the code base for its risk solutions. The patent has been awarded for the Generator's innovative design and structure which allows for extensibility and consistency in Algorithmics' underlying code base.”
Investing in Innovation to continue leadership in the market Investing in Innovation to continue leadership in the market

AlgorithmicsAlgorithmicsRecognized LeadershipRecognized Leadership
AlgorithmicsAlgorithmicsRecognized LeadershipRecognized Leadership
2007 -- Risk Rankings: 5 First Place Finishes2007 -- Risk Rankings: 5 First Place Finishes““Algorithmics held its dominant position in market, credit, operational risk, collateral Algorithmics held its dominant position in market, credit, operational risk, collateral management and Basel IImanagement and Basel II””..
2008 2008 –– Buy-Side Technology Awards: Best Product Buy-Side Technology Awards: Best ProductWon Won ““Best Buy-Side Risk/Portfolio Analytics ProductBest Buy-Side Risk/Portfolio Analytics Product””
2008 2008 –– Gartner Magic Quadrant for Operational Risk: Ranked as Gartner Magic Quadrant for Operational Risk: Ranked as Leader Leader Ranked as a leader in 2008 GartnerRanked as a leader in 2008 Gartner ’’s Operational Risk report. s Operational Risk report.
2008 2008 –– The Banker: Wholesale & Capital Markets Award for Risk The Banker: Wholesale & Capital Markets Award for Risk ManagementManagementRecognized for a stochastic pricing model for work with client Intesa SanpaoloRecognized for a stochastic pricing model for work with client Intesa Sanpaolo
2008 -- Banking Technology Awards -- Best Risk Management 2008 -- Banking Technology Awards -- Best Risk Management Technology Achievement Technology Achievement With Bank of America for their Integrated Credit Engine. With Bank of America for their Integrated Credit Engine.