Presentation human impact on droughts and hot temperatures
52
Introduction Preliminary results Outlook Supplement. figures 1 Human influence on droughts and temperature extremes Brigitte Mueller [email protected]
-
Upload
brigitte-mueller -
Category
Data & Analytics
-
view
42 -
download
2
Transcript of Presentation human impact on droughts and hot temperatures

Introduction Preliminary results Outlook Supplement. figures
1
Human influence on droughts and temperature extremes Brigitte Mueller
Introduction Preliminary results Outlook Supplement. figures
2
Outline
1. Why study extremes?
2. Soil moisture impacts on hot extremes (coupling)
3. Human influence on changes in soil moisture
4. Human influence on hot future summers
1. Motivation 2. Coupling 3. Human influence on droughts 4. Hot summers
Introduction Preliminary results Outlook Supplement. figures
3
Motivation
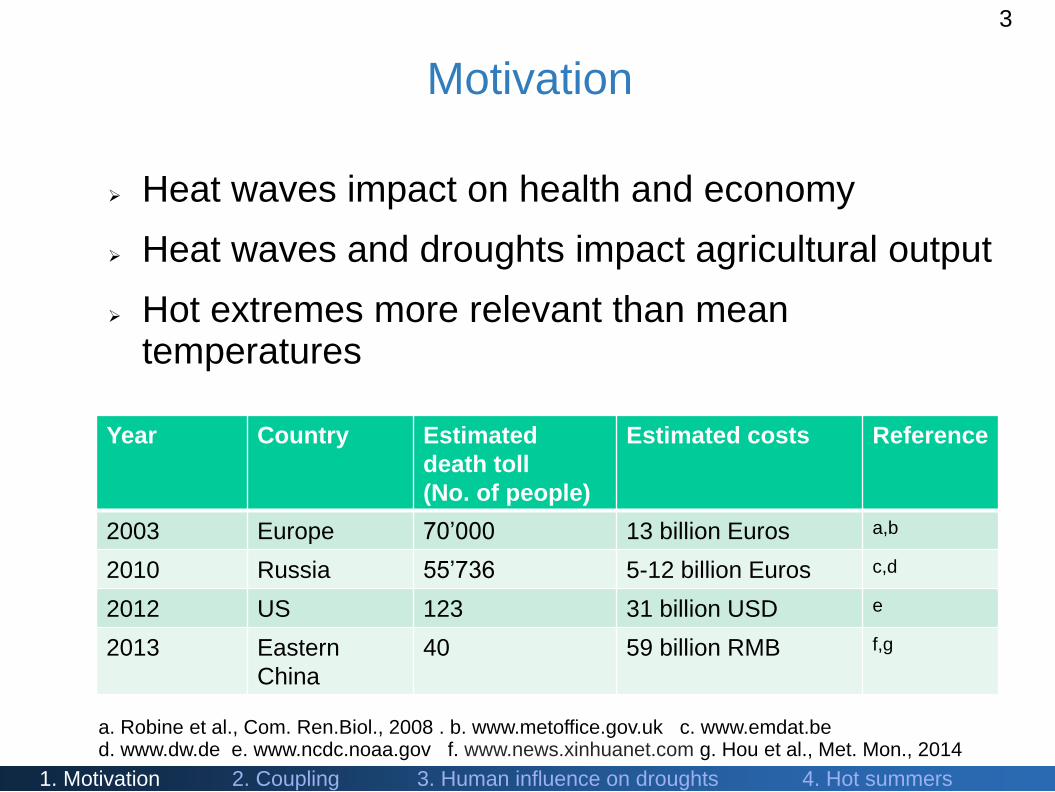
Heat waves impact on health and economy
Heat waves and droughts impact agricultural output
Hot extremes more relevant than mean temperatures
1. Motivation 2. Coupling 3. Human influence on droughts 4. Hot summers
Year Country Estimated
death toll
(No. of people)
Estimated costs Reference
2003 Europe 70’000 13 billion Euros a,b
2010 Russia 55’736 5-12 billion Euros c,d
2012 US 123 31 billion USD e
2013 Eastern
China
40 59 billion RMB f,g
a. Robine et al., Com. Ren.Biol., 2008 . b. www.metoffice.gov.uk c. www.emdat.be d. www.dw.de e. www.ncdc.noaa.gov f. www.news.xinhuanet.com g. Hou et al., Met. Mon., 2014

Introduction Preliminary results Outlook Supplement. figures
4
Motivation: Increase in hot extremes
1. Motivation 2. Coupling 3. Human influence on droughts 4. Hot summers
Cold Average Hot
Pro
babili
ty d
ensity
Temperature distribution

Introduction Preliminary results Outlook Supplement. figures
5
Motivation: Increase in hot extremes
Similar to a Figure from IPCC 2007 and 2013
1. Motivation 2. Coupling 3. Human influence on droughts 4. Hot summers
Cold Average Hot
Pro
babili
ty d
ensity
Temperature distribution
New climate

Introduction Preliminary results Outlook Supplement. figures
6
Motivation: Increase in hot extremes
Seneviratne, Donat, Mueller and Alexander (Nature Climate Change), 2014
Increase in extremely hot global land temperature vs. increase in mean temperature
Trends 1997 - 2012
Extreme T
Mean T
Tem
pera
ture
anom
aly
[K
]
K per 10 years
1. Motivation 2. Coupling 3. Human influence on droughts 4. Hot summers
Txp95 over land ─ Tmean over land
Tmean ocean + land
─
─ ─

Introduction Preliminary results Outlook Supplement. figures
7
Precipitation
Evaporation
Temperature/extreme T
Runoff
Soil moisture
Greenhouse Gases
Floods
Importance of soil moisture
Agricultural production
1. Motivation 2. Coupling 3. Human influence on droughts 4. Hot summers

Introduction Preliminary results Outlook Supplement. figures
8
Importance of soil moisture
1. Motivation 2. Coupling 3. Human influence on droughts 4. Hot summers
Precipitation
Evaporation
Temperature/extreme T
Runoff
Soil moisture
Greenhouse Gases
Agricultural production Floods
www.newscientist.org www.oklahomafarmreports.com

Introduction Preliminary results Outlook Supplement. figures
9
Outline
1. Motivation 2. Coupling 3. Human influence on droughts 4. Hot summers
1. Why study extremes?
2. Soil moisture impacts on hot extremes (coupling)
3. Human influence on changes in soil moisture
4. Human influence on hot future summers

Introduction Preliminary results Outlook Supplement. figures
10
Land water and energy balances
Seneviratne et al. (Earth-Sci. Reviews), 2010
1. Motivation 2. Coupling 3. Human influence on droughts 4. Hot summers
Water balance ΔS = P – E – Rs - Rg
Energy balance ΔH = Rn – λE – SH – G
Variables S: Soil water storage P: Precipitation E: Evapotranspi- ration R: Runoff H: Ground heat storage SW: Shortwave radiation LW: Longwave radiation λE: Latent heat of vaporization * Evaporation SH: Sensible heat flux G: Ground heat flux Rn: Net radiation

Introduction Preliminary results Outlook Supplement. figures
11
Land – atmosphere feedback
Wet soils Dry soils
Alexander (Nature Geoscience), 2011
1. Motivation 2. Coupling 3. Human influence on droughts 4. Hot summers

Introduction Preliminary results Outlook Supplement. figures
12
Land – atmosphere feedback
1. Motivation 2. Coupling 3. Human influence on droughts 4. Hot summers
Seneviratne et al. (Earth-Sci. Reviews), 2010 Alexander (Nature Geoscience), 2011

Introduction Preliminary results Outlook Supplement. figures
13
Mueller and Seneviratne (PNAS), 2012
Land-atmosphere coupling with observations
Correlation: Number of hot days and preceding drought index 1979-2010
Hatched areas significant at 10% level White: Not defined
Hot days at hottest month of each year Drought index before that month: Precipitation deficit over 3 months (standardized precipitation index SPI)
1. Motivation 2. Coupling 3. Human influence on droughts 4. Hot summers
Hot day
Temperature
> 1 wet -0.99 to 0.99 near normal < -1 dry

Introduction Preliminary results Outlook Supplement. figures
14
% of years
Probability after dry conditions After wet conditions
Occurrence of above average # of hot days
Mueller and Seneviratne (PNAS), 2012
1. Motivation 2. Coupling 3. Human influence on droughts 4. Hot summers

Introduction Preliminary results Outlook Supplement. figures
15
Mueller and Seneviratne (GRL), 2014
Evaporation bias (annual)
Land-surface impact on temperature in models
CMIP5 minus reference data
Too wet
1. Motivation 2. Coupling 3. Human influence on droughts 4. Hot summers
Temperature bias (annual)
Too cold

Introduction Preliminary results Outlook Supplement. figures
16
Mueller and Seneviratne (GRL), 2014
Evaporation bias (annual)
Land-surface impact on temperature in models
Mueller et al., (HESS), 2013
Evapotranspiration (40 datasets), 1989-1995 CMIP5 minus reference data
Too wet
1. Motivation 2. Coupling 3. Human influence on droughts 4. Hot summers
Temperature bias (annual)
Too cold

Introduction Preliminary results Outlook Supplement. figures
17
Outline
1. Motivation 2. Coupling 3. Human influence on droughts 4. Hot summers
1. Why study extremes?
2. Soil moisture impacts on hot extremes (coupling)
3. Human influence on changes in soil moisture
4. Human influence on hot future summers

Introduction Preliminary results Outlook Supplement. figures
18
Changes in the water cycle
Precipitation
Evaporation
Temperature/extreme T
Runoff
Soil moisture
Greenhouse Gases
Agricultural production Floods
www.newscientist.org www.oklahomafarmreports.com
1. Motivation 2. Coupling 3. Human influence on droughts 4. Hot summers

Introduction Preliminary results Outlook Supplement. figures
19
Changes in the water cycle
1. Motivation 2. Coupling 3. Human influence on droughts 4. Hot summers
Seneviratne et al. (Earth-Sci. Reviews), 2010
Water balance ΔS = P – E – Rs - Rg

Introduction Preliminary results Outlook Supplement. figures
20
Changes in the water cycle
1. Motivation 2. Coupling 3. Human influence on droughts 4. Hot summers
Dots: Robust. Hatching: Not significant (rel. to internal climate variability)
RCP8.5 scenario (2081-2100 minus 1986-2005)
Sedláček and Knutti (Environ. Res. Lett), 2014
Future minus past
Introduction Preliminary results Outlook Supplement. figures
21
1) Are changes in soil moisture and droughts distinguishable from internal climate variability?
→ Detection
2) Are changes due to human influence?
→ Attribution
Changes in droughts
1. Motivation 2. Coupling 3. Human influence on droughts 4. Hot summers

Introduction Preliminary results Outlook Supplement. figures
22
Central line of evidence that has supported statements such as …’most of the observed increase in global average temperature since the mid-20th century is very likely due to the observed increase in anthropogenic greenhouse gas concentrations’
IPCC AR5, Chapter 10, 2013
Detection and Attribution
1. Motivation 2. Coupling 3. Human influence on droughts 4. Hot summers

Introduction Preliminary results Outlook Supplement. figures
23
Detection and Attribution
1. Motivation 2. Coupling 3. Human influence on droughts 4. Hot summers
Figure from NOAA NCDC / CICS-NC
1. Detection
Observed variable

Introduction Preliminary results Outlook Supplement. figures
24
Detection and Attribution
1. Motivation 2. Coupling 3. Human influence on droughts 4. Hot summers
Figure from NOAA NCDC / CICS-NC
1. Detection
Internal variability: Variability due to natural internal processes (ENSO, PDO etc.)
Observed variable

Introduction Preliminary results Outlook Supplement. figures
25
Detection and Attribution
1. Motivation 2. Coupling 3. Human influence on droughts 4. Hot summers
Figure from NOAA NCDC / CICS-NC
Natural forcings Anthropogenic forcings
1. Detection 2. Attribution

Introduction Preliminary results Outlook Supplement. figures
26
Attribution
Observations
1. Motivation 2. Coupling 3. Human influence on droughts 4. Hot summers
- Greenhouse gases - Anthropogenic aerosols - Volcanic aerosols - Solar variability - Internal variability
Climate model
Hypotheses: Anthropogenic (ANT)? Natural (NAT)?
Pictures right top and bottom from NOAA

Introduction Preliminary results Outlook Supplement. figures
27
Detection and Attribution
1. Motivation 2. Coupling 3. Human influence on droughts 4. Hot summers
1986 - 1996
XYY = X × β + ε
Adapted from Weaver and Zwiers (Nature), 2000
1946 -1956
Evaluate amplitude estimates Evaluate goodness of fit
Observations Model simulations

Introduction Preliminary results Outlook Supplement. figures
28
Detection and Attribution
1. Motivation 2. Coupling 3. Human influence on droughts 4. Hot summers
1986 - 1996
XYY = X × β + ε
Adapted from Weaver and Zwiers (Nature), 2000
1946 -1956
Evaluate amplitude estimates Evaluate goodness of fit
Observations Model simulations
Signal detected in observations
0ˆ β=(XT C-1X) -1XTC-1Y

Introduction Preliminary results Outlook Supplement. figures
29
Warm season soil moisture trends 1951-2005
Adapted from: Mueller and Zhang, submitted to Climatic Change
ALL
NAT
OBS
Obs
NAT
ALL
Soil moisture Drought area
1. Motivation 2. Coupling 3. Human influence on droughts 4. Hot summers
Region: Northern mid-latitudes
Observations Natural + Anthropogenic Only natural forcing

Introduction Preliminary results Outlook Supplement. figures
30
Scaling factors β
Adapted from: Mueller and Zhang, submitted to Climatic Change
Detected if > 0 Bars: 5-95% confidence intervals
Soil moisture Drought area
ALL NAT ALL NAT
1. Motivation 2. Coupling 3. Human influence on droughts 4. Hot summers
ALL = natural and anthropogenic forcing NAT = only natural

Introduction Preliminary results Outlook Supplement. figures
31
Outline
1. Motivation 2. Coupling 3. Human influence on droughts 4. Hot summers
1. Why study extremes?
2. Soil moisture impacts on hot extremes (coupling)
3. Human influence on changes in soil moisture
4. Human influence on hot future summers
Introduction Preliminary results Outlook Supplement. figures
32
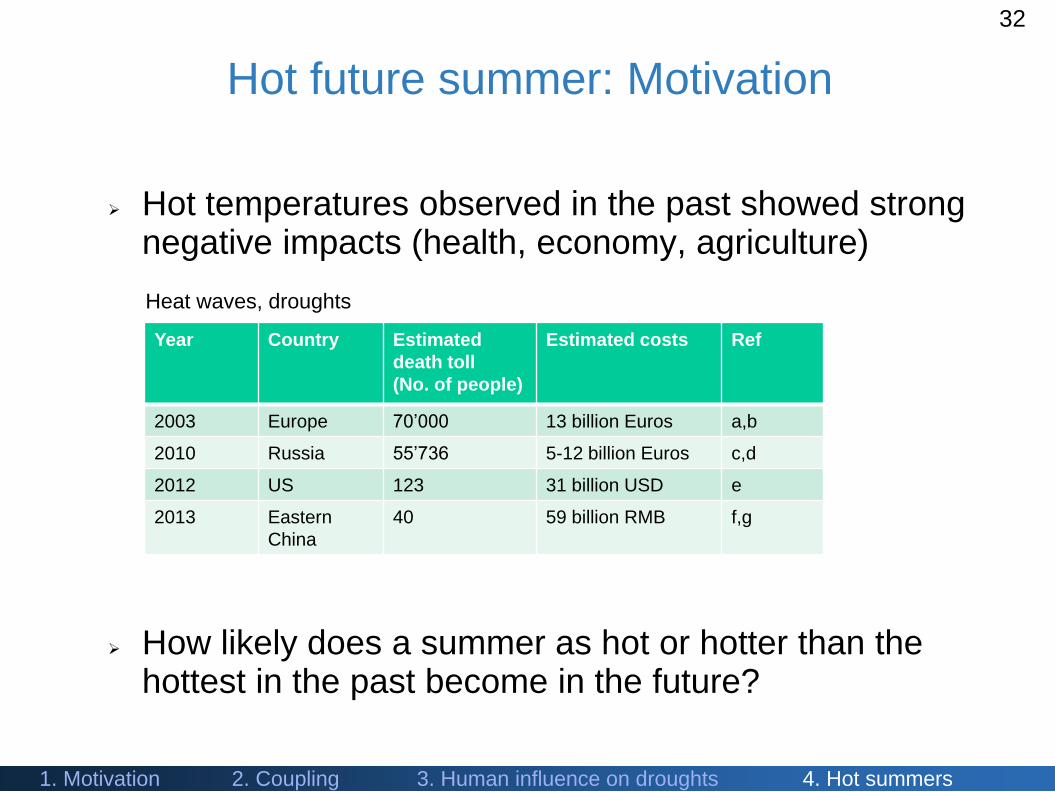
Hot temperatures observed in the past showed strong negative impacts (health, economy, agriculture)
How likely does a summer as hot or hotter than the hottest in the past become in the future?
Hot future summer: Motivation
1. Motivation 2. Coupling 3. Human influence on droughts 4. Hot summers
Year Country Estimated
death toll
(No. of people)
Estimated costs Ref
2003 Europe 70’000 13 billion Euros a,b
2010 Russia 55’736 5-12 billion Euros c,d
2012 US 123 31 billion USD e
2013 Eastern
China
40 59 billion RMB f,g
Heat waves, droughts

Introduction Preliminary results Outlook Supplement. figures
33
Regions for summer land temperature
1. Motivation 2. Coupling 3. Human influence on droughts 4. Hot summers

Introduction Preliminary results Outlook Supplement. figures
34
Summer temperature Eastern Asia
CMIP5 simulations: ALL = anthropogenic and natural forcing (54 runs) NAT = only natural forcing (45 runs) RCP4.5 and 8.5 = representative concentration pathway (15 runs) Observations: CRU
Tem
pera
ture
anom
aly
[K
]
1. Motivation 2. Coupling 3. Human influence on droughts 4. Hot summers

Introduction Preliminary results Outlook Supplement. figures
35
Representative Concentration Pathways
1. Motivation 2. Coupling 3. Human influence on droughts 4. Hot summers
Data obtained from http://www.pik-potsdam.de/~mmalte/rcps/
Emissions
CO2
Concentrations
0
5
10
15
20
25
30
35
2000 2020 2040 2060 2080 2100
CO
2-E
mis
sio
ns (
GtC
/yr)
RCP8.5
RCP4.5
0
200
400
600
800
1000
1200
1400
2000 2020 2040 2060 2080 2100
CO
2-E
q C
on
ce
ntr
ation
(p
pm
)
RCP8.5
RCP4.5

Introduction Preliminary results Outlook Supplement. figures
36
Summer temperature Eastern Asia
Historical hottest year 2010: 0.94 K above climatology How much more likely is a 2010 summer in the future?
Tem
pera
ture
anom
aly
[K
]
1. Motivation 2. Coupling 3. Human influence on droughts 4. Hot summers

Introduction Preliminary results Outlook Supplement. figures
37
Constraining simulations with observations
1. Motivation 2. Coupling 3. Human influence on droughts 4. Hot summers
Adjust past and future simulations 1. In detection and attribution framework, calculate factor β
ALL by
which simulations need to be scaled to match best the observations
2. Adjust simulations with scaling factors βALL
Xadjusted
= XALL
*βALL
where X is the ensemble mean of the simulations.
3. Add internal variability to obtain a set of possible temperatures
Xrec
= XALL
*βALL
+ Controlsimulationsindividual
where Controlsimulations are 390 samples of internal variability.

Introduction Preliminary results Outlook Supplement. figures
38
Exceedance probabilities
Exceedance p
robabili
ty in %
Probability of exceeding maximum historic temperature (Eastern Asia)
1. Motivation 2. Coupling 3. Human influence on droughts 4. Hot summers
Results consistent with Sun et al. (Nat Clim Change), 2014 for Eastern China

Introduction Preliminary results Outlook Supplement. figures
39
1. Motivation 2. Coupling 3. Human influence on droughts 4. Hot summers
Regions for summer land temperature

Introduction Preliminary results Outlook Supplement. figures
40
Percentage of population experiencing 1 in 2 summers hotter than the past maximum
─ under RCP4.5
─ under RCP8.5
Hottest historical summers will be the norm for more than half of the world's population by 2035
Population affected by hot summers
Mueller, Zhang and Zwiers, in preparation
1. Motivation 2. Coupling 3. Human influence on droughts 4. Hot summers
Perc
ent of w
orld p
opula
tio
n [%
]

Introduction Preliminary results Outlook Supplement. figures
41
Percentage of population experiencing 1 in 2 summers hotter than the past maximum
─ under RCP4.5
─ under RCP8.5
Hottest historical summers will be the norm for more than half of the world's population by 2035
Population affected by hot summers
Mueller, Zhang and Zwiers, in preparation
1. Motivation 2. Coupling 3. Human influence on droughts 4. Hot summers
Perc
ent of w
orld p
opula
tio
n [%
]
Introduction Preliminary results Outlook Supplement. figures
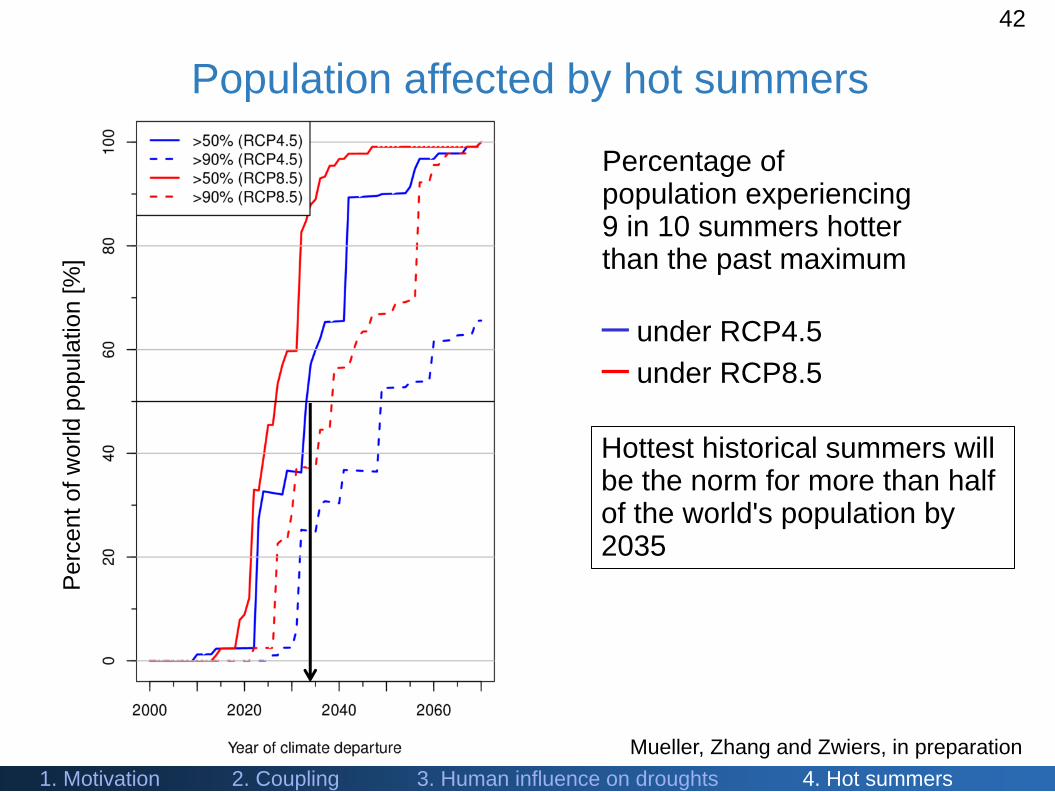
42
Hottest historical summers will be the norm for more than half of the world's population by 2035
Population affected by hot summers
Mueller, Zhang and Zwiers, in preparation
1. Motivation 2. Coupling 3. Human influence on droughts 4. Hot summers
Percentage of population experiencing 9 in 10 summers hotter than the past maximum
─ under RCP4.5
─ under RCP8.5
Perc
ent of w
orld p
opula
tio
n [%
]

Introduction Preliminary results Outlook Supplement. figures
43
Hot temperatures strong increase in the last 30 years
Soil moisture influences temperature extremes in large fraction of the globe
Potential for seasonal prediction
Summary I.
# hot days and drought
1. Motivation 2. Coupling 3. Human influence on droughts 4. Hot summers

Introduction Preliminary results Outlook Supplement. figures
44
Northern hemispheric land areas have become drier
Human influence on changes in soil moisture are significant
Strong increase in probabilities for future hot summers after 2020, especially without climate action
Summary II.
1. Motivation 2. Coupling 3. Human influence on droughts 4. Hot summers
Soil moisture

Introduction Preliminary results Outlook Supplement. figures
45
Local versus large scale effect on droughts, evaporation and temperature
Improving simulations of temperature selecting models with good representation of land-atmosphere coupling
Response of global water cycle to increasing greenhouse gases
Regional climate change
Open questions

Introduction Preliminary results Outlook Supplement. figures
46
Local versus large scale effect on droughts, evaporation and temperature
Improving simulations of temperature selecting models with good representation of land-atmosphere coupling
Response of global water cycle to increasing greenhouse gases
Regional climate change
Thank you

Introduction Preliminary results Outlook Supplement. figures
47
New info updated after presentation
Papers mentioned are now published:
Mueller, B., X. Zhang , and F.W. Zwiers (2016): Historically
hottest summers projected to be the norm for more than half of
the world's population within 20 years, Environmental Research
Letters.Climatic Change. Link
Mueller, B., and X. Zhang (2016): Causes of drying trends in
northern hemispheric land areas in reconstructed soil moisture
data, Climatic Change. Link
Supplementary

Introduction Preliminary results Outlook Supplement. figures
48
Short explanation of detection and attribution algorithm used in the presented analyses
Supplementary

Introduction Preliminary results Outlook Supplement. figures
49
Total least square model
Y = β*X + ϵ with X=X0 + ϵX and Y=Y0 + ϵY
β=(XT C-1X) -1XTC-1Y
C covariance of ϵ, internal variability C estimated from control simulations C Y =λCX : Assumption tested with residual consistency test

Introduction Preliminary results Outlook Supplement. figures
50
Assumption: X
ANT = X
ALL - X
NAT
Y = βANT
*XANT
+ βNAT
*XNAT
+ ε
Two-signal detection

Introduction Preliminary results Outlook Supplement. figures
51
Two-signal results ANT and NAT

Introduction Preliminary results Outlook Supplement. figures
52
Internal variability