Presentation for investors and shareholders -...
25
1 Presentation for investors and shareholders for Q2 2016 August, 10 2016 Belgrade Anton Fyodorov
Transcript of Presentation for investors and shareholders -...

1
Presentation for investors and shareholders
for Q2 2016
August, 10 2016 Belgrade
Anton Fyodorov

2
NIS in Q2 2016
Exploration and Production
• Testing ended with a positive outcome at two exploratory wells, one is in the testing phase.
• Estimated reserves increment in 2016 – 3.7%.
• Kumane – Investment Project upheld by NIS IB (drilling in August 2016)
• RAG Kiha-004 – drilled, oil recovery during testing
• Blocks Ex-7 and Ex-8 - Phase 3 of seismic operations ended, data processing is in progress
• Testing of Jimbolia-6 well is finished – resulted in gas flow.
• Turija II – 3D seismic data processing completed. The acquisition is in progress on the Južni Banat I polygon
• Drilling Plan for the entire year was fulfilled (19 wells)
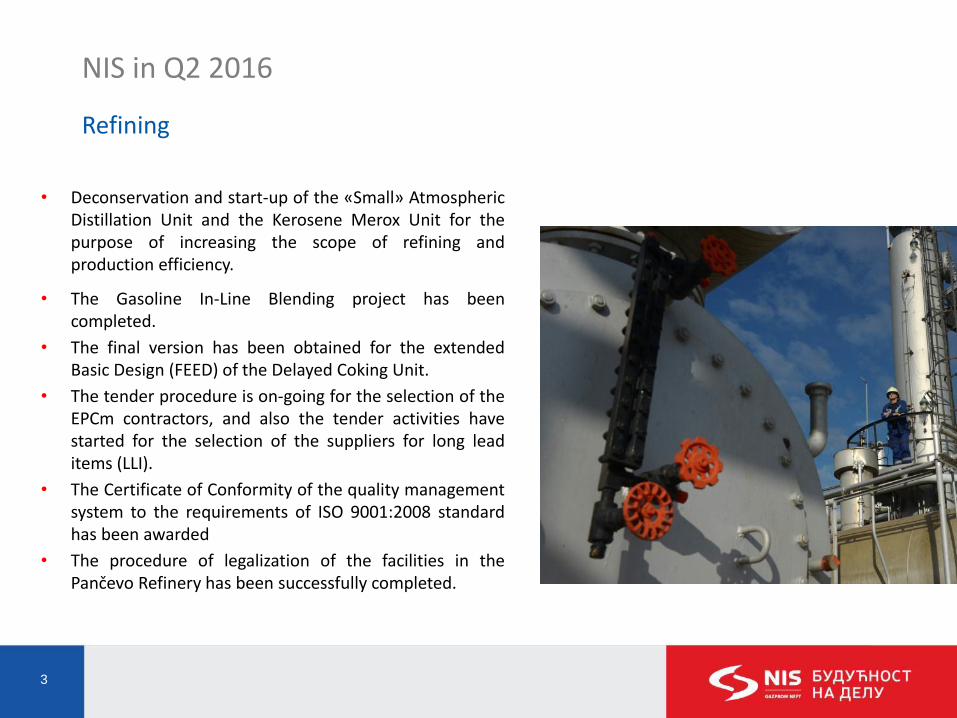
3
NIS in Q2 2016
Refining
• Deconservation and start-up of the «Small» Atmospheric Distillation Unit and the Kerosene Merox Unit for the purpose of increasing the scope of refining and production efficiency.
• The Gasoline In-Line Blending project has been completed.
• The final version has been obtained for the extended Basic Design (FEED) of the Delayed Coking Unit.
• The tender procedure is on-going for the selection of the EPCm contractors, and also the tender activities have started for the selection of the suppliers for long lead items (LLI).
• The Certificate of Conformity of the quality management system to the requirements of ISO 9001:2008 standard has been awarded
• The procedure of legalization of the facilities in the Pančevo Refinery has been successfully completed.

4
NIS in Q2 2016
Sales and Distribution
• Beginning of sale of branded fuel G-Drive diesel in the Serbian market
• Beginning of sale of branded fuel G-Drive 100 in the Romanian market
• The supply of fuel for intercontinental flights has started
• The beginning of the implementation of the program of PS operational activities optimization
• 2 new tank trucks for transportation of jet fuel

5
NIS in Q2 2016
Energy
• Small power plant Majdan (2.4 MW)
- Works in final stage • Small power plant Miloševo (9.8 MW)
- Agreement reached with the Exploration and Production Block that the complete design activities will be carried out by the NTC
• CNG station at PS Čačak 1 - construction activities finished - obtaining the approval for the type of measuring device
from the Directorate of Measures and Precious Metals - exploitation by the end of July.
• CNG Station “Ostrovo” - Gas exploitation approved - The main mining project completed - Access road from the village of Ostrovo built - Ground-leveling works in progress
• CPP Pančevo - Tender closed; evaluation of bids underway
• Windpark Plandište - obtained PPA (feed in).
6
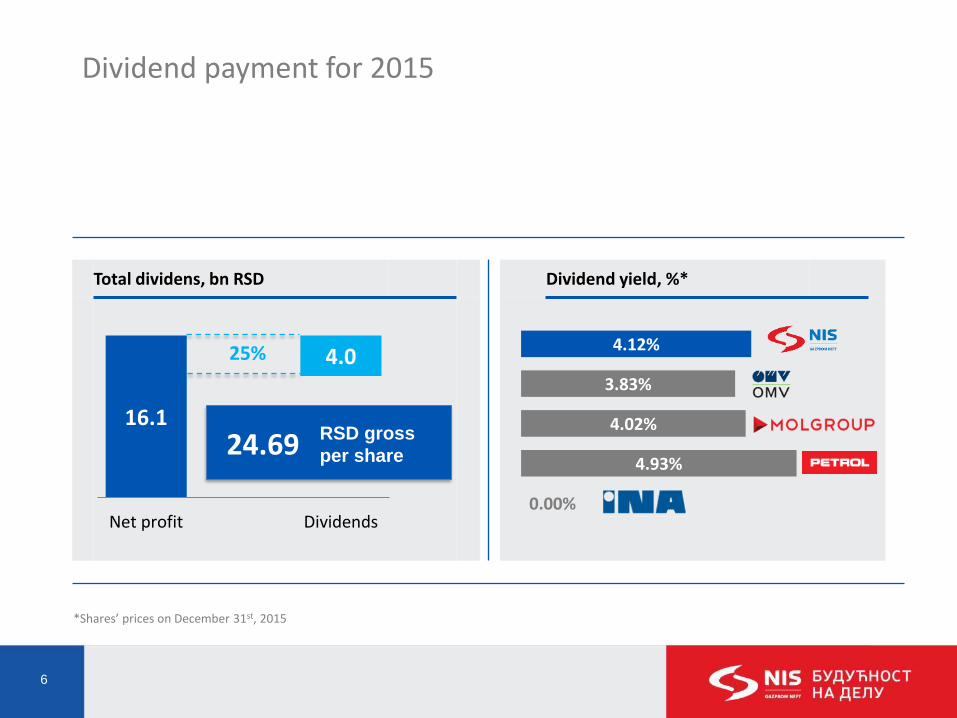
Dividend payment for 2015
16,1
Total dividens, bn RSD Dividend yield, %*
16.1
4.0
Net profit Dividends
25%
24.69 RSD gross
per share
0.00%
4.93%
4.02%
3.83%
4.12%
*Shares’ prices on December 31st, 2015
7
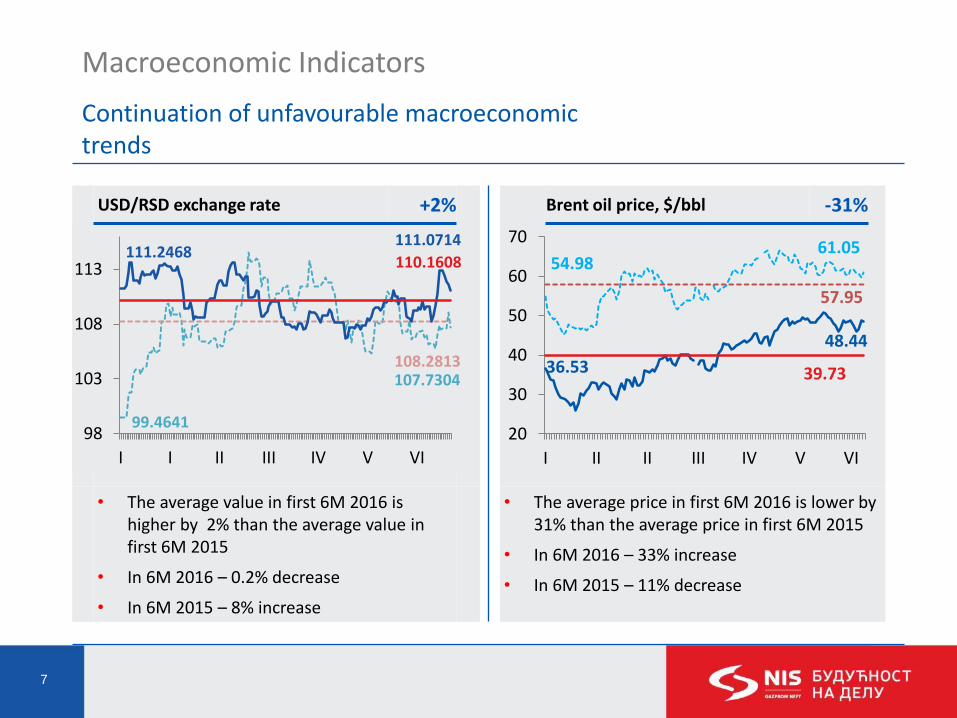
Macroeconomic Indicators
Continuation of unfavourable macroeconomic trends
USD/RSD exchange rate +2% Brent oil price, $/bbl -31%
• The average value in first 6M 2016 is higher by 2% than the average value in first 6M 2015
• In 6М 2016 – 0.2% decrease
• In 6М 2015 – 8% increase
• The average price in first 6M 2016 is lower by 31% than the average price in first 6M 2015
• In 6М 2016 – 33% increase
• In 6М 2015 – 11% decrease
99.4641
107.7304 108.2813
111.2468 111.0714
110.1608
98
103
108
113
I I II III IV V VI
36.53
48.44
39.73
54.98 61.05
57.95
20
30
40
50
60
70
I II II III IV V VI

8
HSE Indicators
Positive trend
Increase in transparency LTIF RAR
LTIF – Rate of Injuries (fatalities with injuries that caused lost work days , multiplied by 1 million and divided by the number of working hours. RAR - the number of road accidents per kilometers travelled , multiplied by 1 million
2.2
1.67
3.41
Plan2016
6М 2016
6М 2015
0.32
0.21
0.43
Plan2016
6М 2016
6М 2015
Major events
Medium events
Minor events
Pot.
events
51%
24%
51%
6М 2015. 6М 2016.
8,233 26,043
572 452
67 44
7 4
34%

9
Q2 2016 Key Indicators
NIS Group
Q2
2016. Q2
2015. ∆
𝐐𝟐 𝟐𝟎𝟏𝟔.
𝐐𝟐 𝟐𝟎𝟏𝟓.
(%) Key Indicators
Јединица мере
6M 2016.
6M 2015.
∆𝟔𝐌 𝟐𝟎𝟏𝟔.
𝟔𝑴 𝟐𝟎𝟏𝟓.
(%)
43.88 61.46 -29% Urals $/bbl 38.1 57.2 -33%
2.9 9.6 -70% Net income bn RSD 3.1 5.0 -36%
9.4 13.8 -32% EBITDA bn RSD 13.2 21.0 -37%
46.0 57.0 -19% Sales revenues bn RSD 81.4 103.4 -21%
5.0 19.9 -75% OCF bn RSD 8.6 24.3 -65%
43.5 37.7 +15% Calculated liabilities from taxes and other public revenues
bn RSD 76.3 67.2 +13%
366.4 398.1 -8% Crude oil and gas production thou. t.o.e. 743 795 -7%
243 267 -9% Domestic crude oil production thou. tons 493 536 -8%
974 828 +18% Oil and semi-finished products refining volumes thou. tons 1,750 1,512 +16%
850 782 +9% Total sales of petroleum products thou. tons 1,553 1,463 +6%
67 48 +40% Sales – foreign assets thou. tons 123 89 +38
655 611 +7% Sales of petroleum products in the domestic market thou. tons 1,217 1,160 +5%
506 481 +5% Motor fuels thou. tons 919 870 +6%
180 172 +5% Retail thou. tons 331 313 +6%
4.5 5.5 -18% CAPEX bn RSD 9.1 12.5 -27%
680 571 +19% Total indebtedness to banks mn USD 680 571 +19%

10
Motor Fuel Market Trends
6М 2016/6M 2015
Key factors boosting the region’s motor fuel consumption: - Low fuel prices - Positive macroeconomic parameters - Increase of fuel demand in transport
segment
Slovenia
3.5%
Croatia
1.8%
B&H
2.8%
Hungary
3.8% Romania
3.5%
Bulgaria
2.6%
Serbia
2.2% Serbia • Motor fuels consumption growth:
- Gasoline - Diesel – lower price and bigger activities
for road building companies, as well as growth in transportation
• Part of diesel consumption moved into the
“grey” zone
11
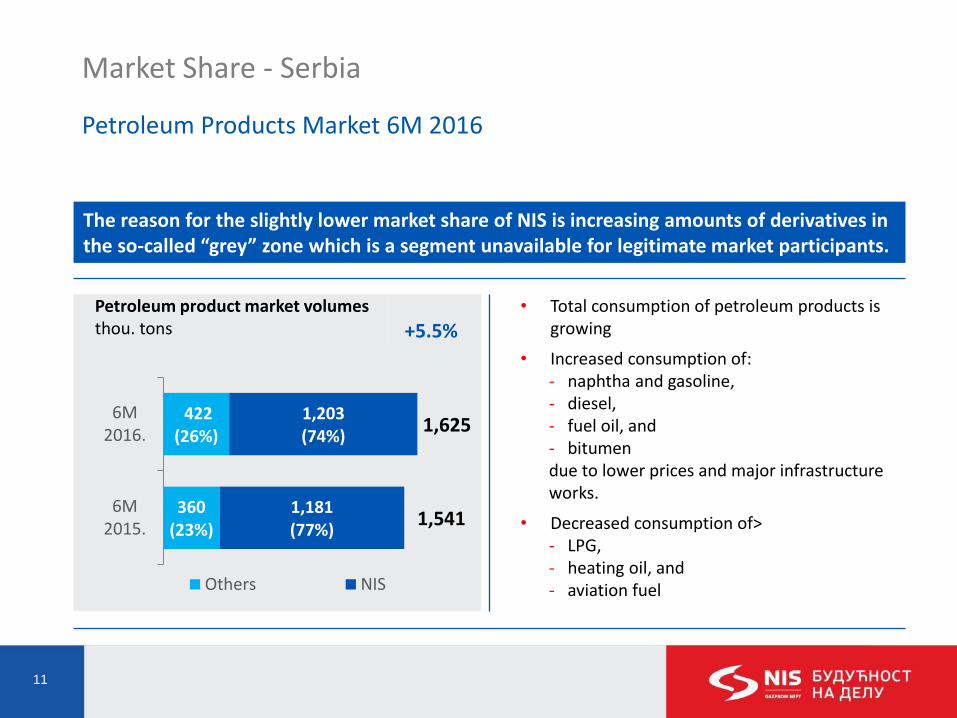
Market Share - Serbia
Petroleum Products Market 6М 2016
Petroleum product market volumes thou. tons +5.5%
• Total consumption of petroleum products is growing
• Increased consumption of: - naphtha and gasoline, - diesel, - fuel oil, and - bitumen due to lower prices and major infrastructure works.
• Decreased consumption of> - LPG, - heating oil, and - aviation fuel
The reason for the slightly lower market share of NIS is increasing amounts of derivatives in the so-called “grey” zone which is a segment unavailable for legitimate market participants.
360 (23%)
422 (26%)
1,181 (77%)
1,203 (74%)
1,541
1,625
6M2015.
6M2016.
Others NIS

12
Market Share - Serbia
Retail Market 6М 2016
Retail market volumes thou. tons +2.3%
• Increase of retail market volume by 2.3%
• Increased demand due to: - Lower prices, - Mild winter - Growth in transport - Early start of agriculture works
• NIS increased its market share by 1%
• For NIS increase in sales of: - gasoline - diesel - auto gas
431 (58%)
431 (57%)
312 (42%)
329 (43%)
743
760
6M2015.
6M2016.
Others NIS

13
Market Share - Region
6М 2016*
Bosnia and Herzegovina
No. Of PSs: 35 % entire mark.: 11.7% % retail mark.: 10.7%
Romania
No. Of PSs: 18 % entire mark.: 0.6% % retail mark.: 0.9%
Bulgaria
No. Of PSs: 35 % entire mark.: 4.5% % retail mark.: 4.3%
*Compared with market share for 6М 2015
14
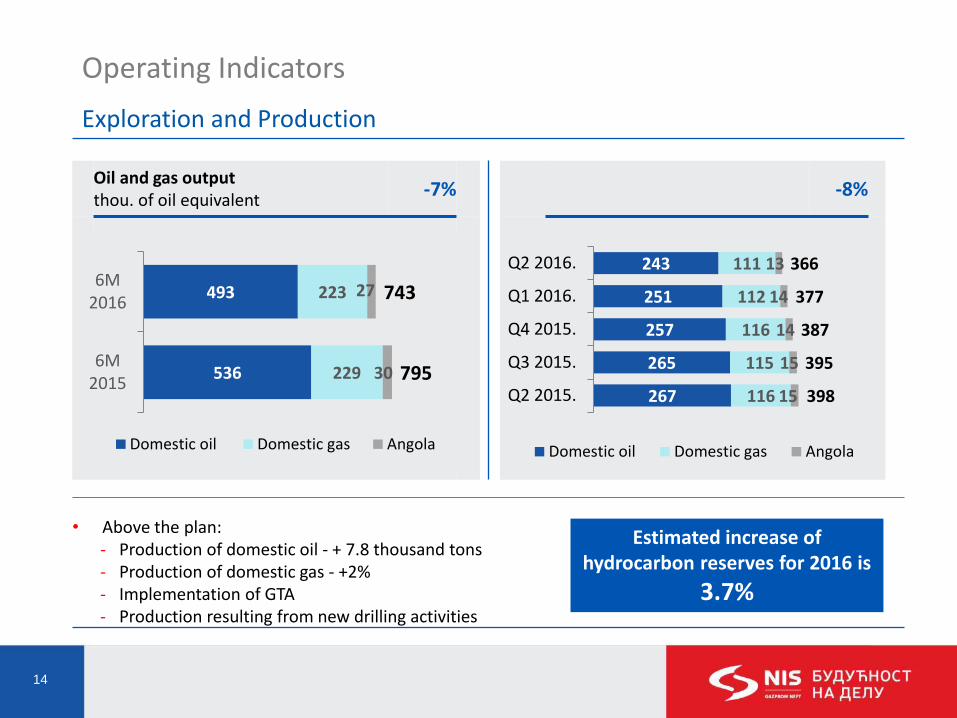
Operating Indicators
Exploration and Production
Oil and gas output thou. of oil equivalent
-7% -8%
• Above the plan: - Production of domestic oil - + 7.8 thousand tons - Production of domestic gas - +2% - Implementation of GTA - Production resulting from new drilling activities
267
265
257
251
243
116
115
116
112
111
15
15
14
14
13
398
395
387
377
366
Q2 2015.
Q3 2015.
Q4 2015.
Q1 2016.
Q2 2016.
Domestic oil Domestic gas Angola
Estimated increase of hydrocarbon reserves for 2016 is
3.7%
536
493
229
223
30
27
795
743
6M2015
6M2016
Domestic oil Domestic gas Angola
15
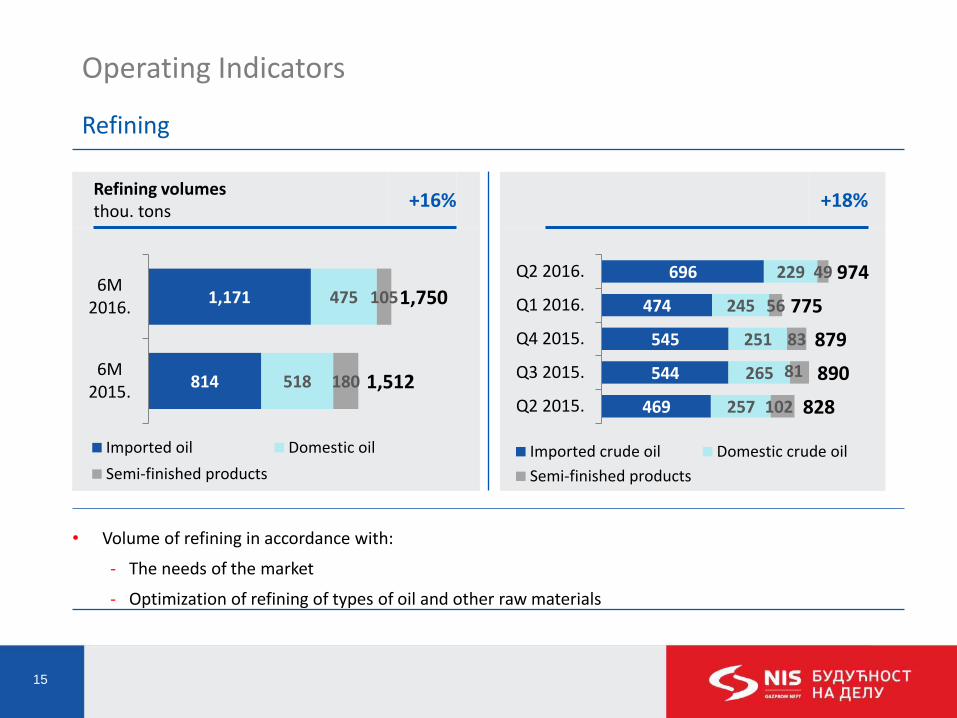
Operating Indicators
Refining
Refining volumes thou. tons
+16% +18%
• Volume of refining in accordance with:
- The needs of the market
- Optimization of refining of types of oil and other raw materials
814
1,171
518
475
180
105
1,512
1,750
6M2015.
6M2016.
Imported oil Domestic oil
Semi-finished products
469
544
545
474
696
257
265
251
245
229
102
81
83
56
49
828
890
879
775
974
Q2 2015.
Q3 2015.
Q4 2015.
Q1 2016.
Q2 2016.
Imported crude oil Domestic crude oil
Semi-finished products

16
Operating Indicators
Sales and Distribution
Sales volumes* thou. tons
+6% +9%
• Retail - Serbia - volume growth by 6%
• Wholesale - Serbia - volume growth by 5%
• Export - at the same level • Foreign assets - volume growth by 38%
313
331
89
123
847
886
214
214
1,463
1,553
6M2015.
6M2016.
Retail - Serbia Foreign assetsWholesale - Serbia Export
172
183
185
151
180
48
54
52
56
67
439
501
555
411
476
123
134
127
86
128
782
872
920
703
850
Q2 2015.
Q3 2015.
Q4 2015.
Q1 2016.
Q2 2016.
Retail - Serbia Foreign assetsWholesale - Serbia Export
*internal sale included (6M 2016: app. 6 thousand tons; 6M 2015: app. 7 thousand tons)
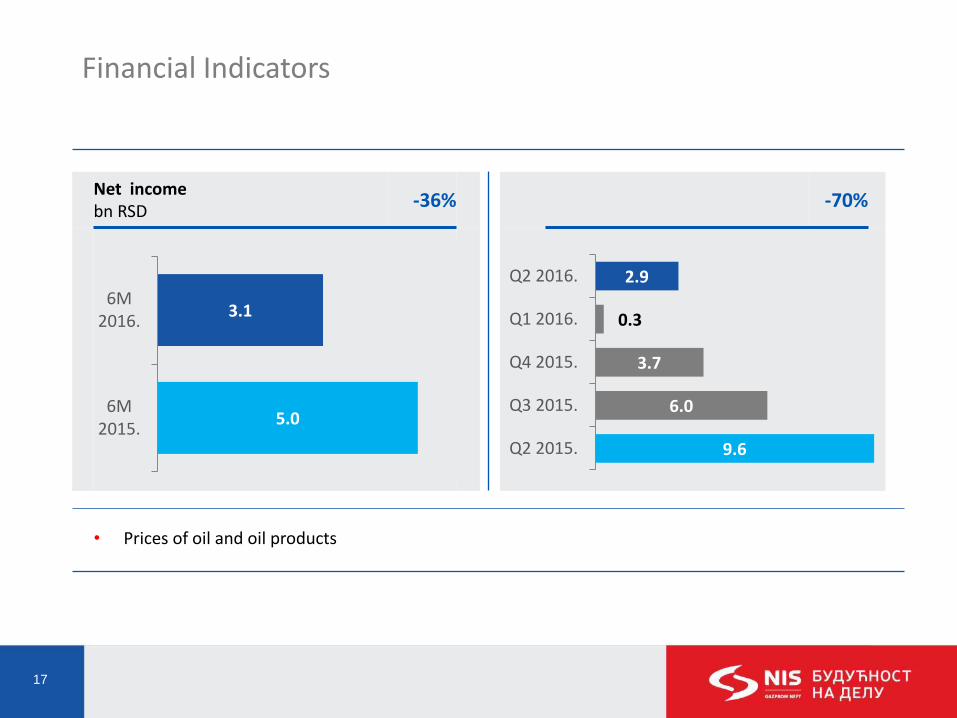
17
Financial Indicators
Net income bn RSD
-36% -70%
• Prices of oil and oil products
9.6
6.0
3.7
0.3
2.9
Q2 2015.
Q3 2015.
Q4 2015.
Q1 2016.
Q2 2016.
5.0
3.1
6M2015.
6M2016.

18
Financial Indicators
EBITDA bn RSD
-37% -32%
• Negative impact of oil prices (Urals - decrease by 33% in comparison with 6M 2015)
13.8
11.3
14.2
3.8
9.4
Q2 2015.
Q3 2015.
Q4 2015.
Q1 2016.
Q2 2016.
21.0
13.2
6M2015.
6M2016.

19
Financial Indicators
OCF bn RSD
-65% -75%
• Inflow lower by RSD 14.4 billion - Low prices of oil products
• Outflow higher by RSD 1.4 billion - Higher commitments to the state and higher commitments to suppliers
19.9
11.7
15.0
3.6
5.0
Q2 2015.
Q3 2015.
Q4 2015.
Q1 2016.
Q2 2016.
24.3
8.6
6M2015.
6M2016.

20
Financial Indicators
CAPEX bn RSD
-27% Investments by segments bn RSD
• The biggest investments in the Exploration and Production • Prioritization of investment portfolio
82%
2% 8%
2%
4%
2% Exploration andproduction
Services
Refining
Sales anddistribution
Energy
Corporate centre30.3
28.0
12.5
9.1
2015.actual
2016.forecast
6M 2015.
6M 2016.

21
Improvement of Operational Efficiency
Effect of operational efficiency improvement measures on EBITDA indicator bn RSD
1.3
0.4
2.8
0.4 0.5
0.4
5.9 5.9
3.2 0.3
0.1
0.0 0.1
0.2
0.4
1.0
0.0
1.0
0.5
1.1
1.1
0.7
0.3
0.2
0.0 0.2
0.0
0.5 1.2
0.0
1.2
1.9
0.7
2.8 0.7
0.7
1.3 8.1
1.2 9.3
4.4
Explorationand
production
Services Refining Sales anddistribution
Energy Corp. centre(Functions)
NISestimate
2016
Preventeddamage
Total NISestimate
2016
6M 2016
Measures (BP, QPR1, QPR2) Additional measures (QPR2) Prevented damage Potential
59%
55%
3.7 bn RSD
22
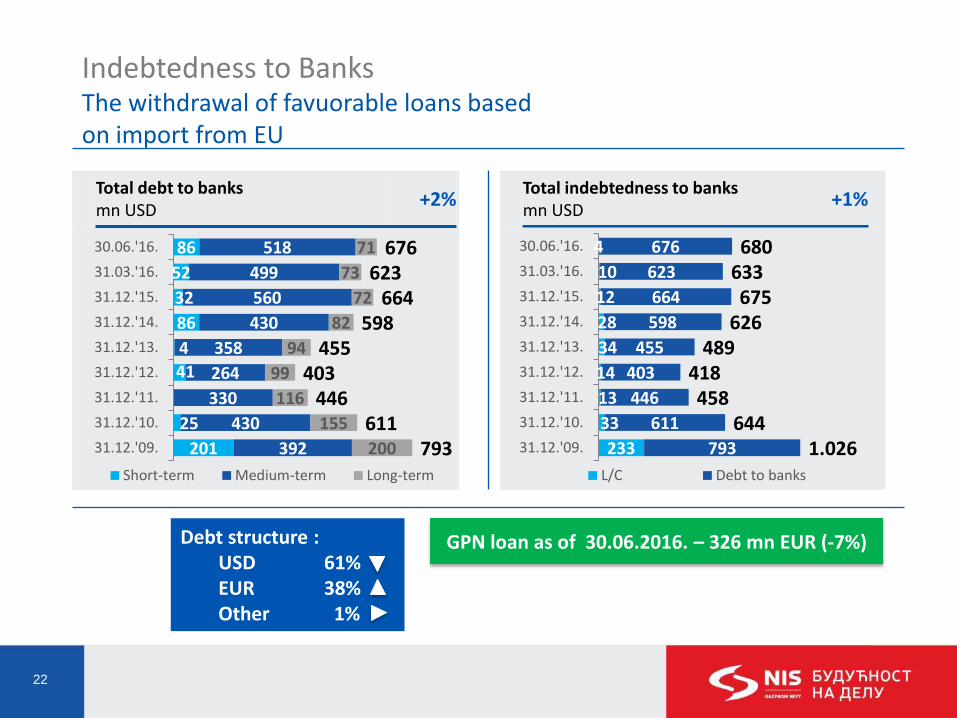
Indebtedness to Banks The withdrawal of favuorable loans based on import from EU
Total debt to banks mn USD
+2% Total indebtedness to banks mn USD
+1%
201
25
41
4
86
32
52
86
392
430
330
264
358
430
560
499
518
200
155
116
99
94
82
72
73
71
793 611
446 403
455 598
664 623
676
31.12.'09.
31.12.'10.
31.12.'11.
31.12.'12.
31.12.'13.
31.12.'14.
31.12.'15.
31.03.'16.
30.06.'16.
Short-term Medium-term Long-term
233
33
13
14
34
28
12
10
4
793
611
446
403
455
598
664
623
676
1.026 644
458 418
489 626
675 633 680
31.12.'09.
31.12.'10.
31.12.'11.
31.12.'12.
31.12.'13.
31.12.'14.
31.12.'15.
31.03.'16.
30.06.'16.
L/C Debt to banks
Debt structure : USD 61% EUR 38% Other 1%
GPN loan as of 30.06.2016. – 326 mn EUR (-7%)

23
Comparative Analysis
EBITDA margin (%) EBITDA/FTE (thou. USD) Daily sales(t/day)
Share of light products (%) OPEX ($/boe)
33
18.2
16.3
14.6
3.7
17.2
27.0
18.4
17.9
6.2
1.3
14.2
7.8 6.6 6.6
5.5 5.3
4.9
6.1
4.9 1.5
12.3
12.2
6.3
6.4
Н/Д
9.3 87.4
75.4
75.0
73.1
71.0
76.2
3. 4.
4.
2.
2. 1.

24
∆ The average price of Urals oil is lower than the macro assumptions in the Business plan
∆ Limited opportunities for long term loans
∆ Positive net result
∆ Oil and gas production is above the plan even with the lower volume of investments
∆ Growth of sales
∆ Progress of Energy projects
25
Disclaimer
This presentation has been prepared by NIS a.d. Novi Sad (the “Company”), and comprises the slides for a presentation to investors concerning NIS
Group. Presentation does not constitute or form part of any offer or invitation, or any solicitation of any offer to sell or purchase or subscribe for, any
shares or other securities representing shares in the Company, nor shall it or any part of it nor the fact of its presentation or distribution form the basis
of, or be relied on in connection with, any contract or investment decision.
Any viewer of this presentation considering a purchase of such securities is hereby reminded that any such sale or purchase should be made solely on
the basis of the information contained in other publicly available documents and will be subject to the restrictions set out therein. No reliance may be
placed for any purposes whatsoever on the information contained in this presentation, or any other material discussed at any presentation or on its
completeness, accuracy or fairness. The information in this presentation should not be treated as giving investment advice or recommendation. All
reasonable measures are taken to ensure that the facts stated in this presentation are accurate, and that the opinions expressed are fair and
reasonable. However, the contents of this presentation have not been adopted by the corporate body’s of Company. Accordingly, no representation or
warranty, express or implied, is made or given by or on behalf of the Company or any of its members, directors, officers or employees or any other
person as to the accuracy, completeness or fairness of the information or opinions contained in or discussed at this presentation. None of the Company
or any of their respective members, directors, officers or employees nor any other person accepts any liability whatsoever for any loss howsoever
arising from any use of this presentation or its contents or otherwise arising in connection therewith.
The information in this presentation includes forward-looking statements. These forward-looking statements include all matters that are not historical
facts, statements regarding the Company’s and NIS Group’s intentions, beliefs or current expectations concerning, among other things, the NIS Group’s
results of operations, financial condition, liquidity, prospects, growth, strategies, and the industry in which the Company and NIS Group operate. By their
nature, forward-looking statements involve risks and uncertainties, including, without limitation, the risks and uncertainties to be set in other publicly
available documents, because they relate to events and depend on circumstances that may or may not occur in the future. The Company cautions you
that forward looking statements are not guarantees of future performance and that its actual results of operations, financial condition and liquidity and
the development of the industry in which the Company operates may differ materially from those made in or suggested by the forward-looking
statements contained in this presentation. In addition, even if the NIS Group’s results of operations, financial condition and liquidity and the
development of the industry in which the Company and NIS Group operate are consistent with the forward-looking statements contained in this
presentation, those results or developments may not be indicative of results or developments in future periods. The information and opinions contained
in this presentation are provided as at the date of this presentation and are subject to change without notice.
No person is under any obligation to update or keep current the information contained herein.
By attending the presentation you confirm that you have read and understood foregoing limitations.