
Presentation 4 consult, c insight and comm-safety
22
Consultation, Customer Insight & Community Safety Louise Meats, Leigh Roberts 26 th March 2015
-
Upload
cambridgeshireinsight -
Category
Government & Nonprofit
-
view
304 -
download
0
Transcript of Presentation 4 consult, c insight and comm-safety

Consultation, Customer Insight &
Community Safety
Louise Meats, Leigh Roberts26th March 2015

Who are we?Hopefully, most of you know…
• The County Council’s central research & information section. • We provide a wide variety of information on the people and economy of
Cambridgeshire in order to help plan services for the county.• Our work is divided up into a number of specific research areas including:
– Informing policy and service development• Population and demographic areas• School pupil forecasting• Economic and labour market analysis• Crime & community safety research• Housing research• Health data• Deprivation research• Census and Quality of Life information
– Consultations & surveys– Data dissemination

LARF (Local Area Research Fortnight)
• Mon 16th: Who we are, Cambridgeshire Insight and Open Data
• Thurs 19th: Demography and Pupil Forecasting• Mon 23th: Economy and Housing• Thurs 26th: Consultations, Customer Insight,
and Community Safety
• 16-27 March Lunchtime drop-ins, Room 015

Consultation:“It’s good to talk”
• Why do we do it?– As a Council
• It’s our legal duty!• Evaluate and set performance standards• Indicate how well a service contributes to a policy area• Assist with determining service levels• Identify cost savings• Enable services to make informed choices• Trigger further investigation into any issues• Improve the take-up of services• User satisfaction can be monitored and improved over time
– Within the Research Group• Helping colleagues • Ensuring consistency• Legal duties• How and why we need to consult

Robust response?
• All about the confidence intervals….. • We want to be sure our results are as close to
those we would get if everyone replied. (IE within 3%)

What makes a good consultation?
• Preparation
• Promotion
• Presentation (/Design)

Consultation
• Three key messages to communicate:– Explore the need to consult.
• Don’t consult the public if you’ve already made the decisions.
– Identify an appropriate tool.• Online? Face to face? ‘Piggy-backing’ existing
meetings? Postal? Door-to-door? Etcetcetc….• Smart Survey, not SurveyMonkey.
– Publicise your consultation.• Consultations database.• Communications Team.

Customer Knowledge / Insight
• Getting to know your communities– Understanding need and expectations– Feeding this into the design and delivery of services
• Varying tools– Census– Social analysis tools: OAC / MOSAIC– Direct experience: Performance data, survey results,
front-line workers

Customer Knowledge / Insight

• Open source, free tool by the ONS
• Socio-demographic data
• Uses 62 variables to define communities:
– 22 Demographic– 4 Household composition– 9 Housing– 11 Socio-economic– 16 Employment
Output Area Classifications - OAC
• 3 levels to the classification:– 8 supergroups– 24 groups– 67 sub groups

• Free tool.
OAC for Cambridgeshire

Community Safety
• 5 Community Safety Partnerships• Police & Crime Commissioner• DAAT• Public Health• CFA

Working in Partnership to achieve
• Make communities safer• Fewer victims• Reduce repeat victimisation• Reduce re-offending• Help victims access support/ CPS

How?
• The part of research– Knowing the victims– Understand why, where and what happened– Knowing the offenders– Understand why, where and what they need– Understand what interventions work

Victim Rate
MaleFemale
Comparison with South Cambs

Cambridgeshire and Peterborough Figures
• Data analysis identified 9,088 unique repeat victims, who were victimised 21,533 times (more than 1 in 5 of victim records were for a repeat victim).
• For the study, repeat victims were split into two categories, one with repeat victimisation for less than four times, 8,393 victims victimised 18,155 times; and another victimised four or more times, 695 unique victims, victimised 3,378 times.
• 1 in 5 victims are at risk of becoming repeat victims for violence or for criminal damage.
• 1 in 8 victims are at risk of becoming repeat victims for burglary and 1 in 10 are at risk for theft.


Repetition Period with Cumulative percentage
• 42% repeated within 3 months 62% repeated within 3 months• 60% repeated within 6 months 80% repeated within 6 months
-8.0 -4.0 0.0 4.0 8.0 12.0
1
2
3
4
5
6
7
8
9
1 0
1 1
1 2
1 3
1 4
1 5
1 6
1 7
1 8
1 9
2 0
2 1
2 2
2 3
2 4
2 5
2 6
2 7
2 8
2 9
3 0
3 1
3 2
3 3
3 4
3 5
3 6
3 7
3 8
3 9
4 0
4 1
4 2
4 3
4 4
4 5
4 6
4 7
4 8
4 9
5 0
5 1
No
min
al
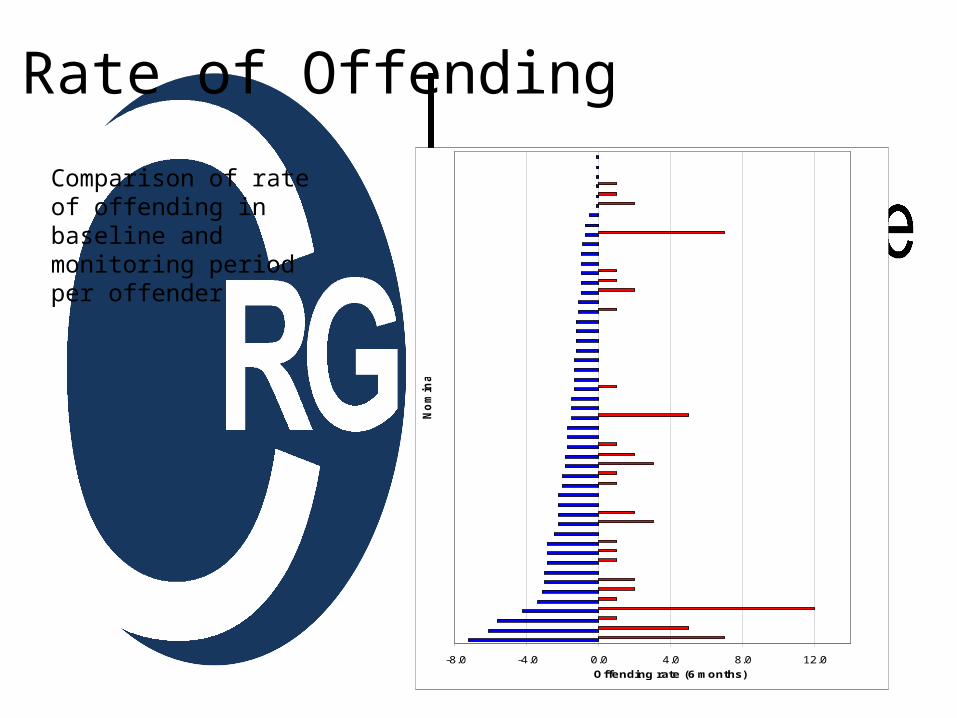
Offending rate (6 months)
Baseline
Rate of Offending
Comparison of rate of offending in baseline and monitoring period per offender

Changes in Offending

In practice
• What changes?
– Victims Hub– Continuation of funding for effective interventions– Data sharing to rescue victims from exploitation– Prevention & education
@CambsInsight
pinterest.com/cambsinsight
Cambridgeshire Insight
Come visit us! Shire Hall – Room 015
W: www.cambridgeshireinsight.org.uk
T: 01223 715300
![[DE] PROJECT CONSULT Newsletter 2013 | PROJECT CONSULT Unternehmensberatung GmbH](https://static.fdocuments.net/doc/165x107/579078681a28ab6874c25153/de-project-consult-newsletter-2013-project-consult-unternehmensberatung.jpg)

![[DE] PROJECT CONSULT Newsletter 2008 | PROJECT CONSULT Unternehmensberatung GmbH](https://static.fdocuments.net/doc/165x107/579078681a28ab6874c250b1/de-project-consult-newsletter-2008-project-consult-unternehmensberatung.jpg)


![[DE] PROJECT CONSULT Newsletter 2006 | PROJECT CONSULT Unternehmensberatung GmbH](https://static.fdocuments.net/doc/165x107/579078681a28ab6874c25078/de-project-consult-newsletter-2006-project-consult-unternehmensberatung.jpg)


![[DE] PROJECT CONSULT Newsletter 2010 | PROJECT CONSULT Unternehmensberatung GmbH](https://static.fdocuments.net/doc/165x107/579078681a28ab6874c250ef/de-project-consult-newsletter-2010-project-consult-unternehmensberatung.jpg)


![[DE] PROJECT CONSULT Newsletter 2015 | PROJECT CONSULT Unternehmensberatung GmbH](https://static.fdocuments.net/doc/165x107/579078681a28ab6874c251bb/de-project-consult-newsletter-2015-project-consult-unternehmensberatung.jpg)


![[DE] PROJECT CONSULT Newsletter 2012 | PROJECT CONSULT Unternehmensberatung GmbH](https://static.fdocuments.net/doc/165x107/579078681a28ab6874c2513d/de-project-consult-newsletter-2012-project-consult-unternehmensberatung.jpg)