Presentation 1H2015 Results
21
29 th June 2015
-
Upload
acciona -
Category
Investor Relations
-
view
395 -
download
0
Transcript of Presentation 1H2015 Results

29th June 2015

H1 2015 2
Disclaimer
This document has been prepared by ACCIONA, S.A. (“ACCIONA” or the “Company”) exclusively for use during the presentation of financial results for the first half of2015 (H1 2015). Therefore it cannot be disclosed or made public by any person or entity with an aim other than the one expressed above, without the prior writtenconsent of the Company.
The Company does not assume any liability for the content of this document if used for different purposes thereof.
The information and any opinions or statements made in this document have not been verified by independent third parties, nor audited; therefore no express orimplied warranty is made as to the impartiality, accuracy, completeness or correctness of the information or the opinions or statements expressed herein.
Neither the Company, its subsidiaries or any entity within ACCIONA Group or subsidiaries, any of its advisors or representatives assume liability of any kind, whether fornegligence or any other reason, for any damage or loss arising from any use of this document or its contents.
The information contained in this document on the price at which securities issued by ACCIONA have been bought or sold, or on the performance of those securities,cannot be used to predict the future performance of securities issued by ACCIONA.
Neither this document nor any part of it constitutes a contract, nor may it be used for incorporation into or construction of any contract or agreement.
IMPORTANT INFORMATION
This document does not constitute an offer or invitation to purchase or subscribe shares, in accordance with the provisions of the Spanish Securities Market Law (Law24/1988, of July 28, as amended and restated from time to time), Royal Decree-Law 5/2005, of March 11, and/or Royal Decree 1310/2005, of November 4, and itsimplementing regulations.
In addition, this document does not constitute an offer of purchase, sale or exchange, nor a request for an offer of purchase, sale or exchange of securities, nor arequest for any vote or approval in any other jurisdiction.
Particularly, this document does not constitute an offer to purchase, sell or exchange or the solicitation of an offer to purchase, sell or exchange any securities.
FORWARD-LOOKING STATEMENTS
This document contains forward-looking information and statements about ACCIONA, including financial projections and estimates and their underlying assumptions,statements regarding plans, objectives and expectations with respect to future operations, capital expenditures, synergies, products and services, and statementsregarding future performance. Forward-looking statements are statements that are not historical facts and are generally identified by the words “expects”, “anticipates”,“believes”, “intends”, “estimates” and similar expressions.
Although ACCIONA believes that the expectations reflected in such forward-looking statements are reasonable, investors and holders of ACCIONA shares are cautionedthat forward-looking information and statements are subject to various risks and uncertainties, many of which are difficult to predict and generally beyond the control ofACCIONA, that could cause actual results and developments to differ materially from those expressed in, or implied or projected by, the forward-looking informationand statements. These risks and uncertainties include those discussed or identified in the documents sent by ACCIONA to the Comisión Nacional del Mercado deValores, which are accessible to the public.
Forward-looking statements are not guarantees of future performance. They have not been reviewed by the auditors of ACCIONA. You are cautioned not to place unduereliance on the forward-looking statements, which speak only as of the date they were made. All subsequent oral or written forward-looking statements attributable toACCIONA or any of its members, directors, officers, employees or any persons acting on its behalf are expressly qualified in their entirety by the cautionary statementabove. All forward-looking statements included herein are based on information available to ACCIONA, on the date hereof. Except as required by applicable law,ACCIONA does not undertake any obligation to publicly update or revise any forward-looking statements, whether as a result of new information, future events orotherwise.
#ACCIONA1H15
H1 2015 3
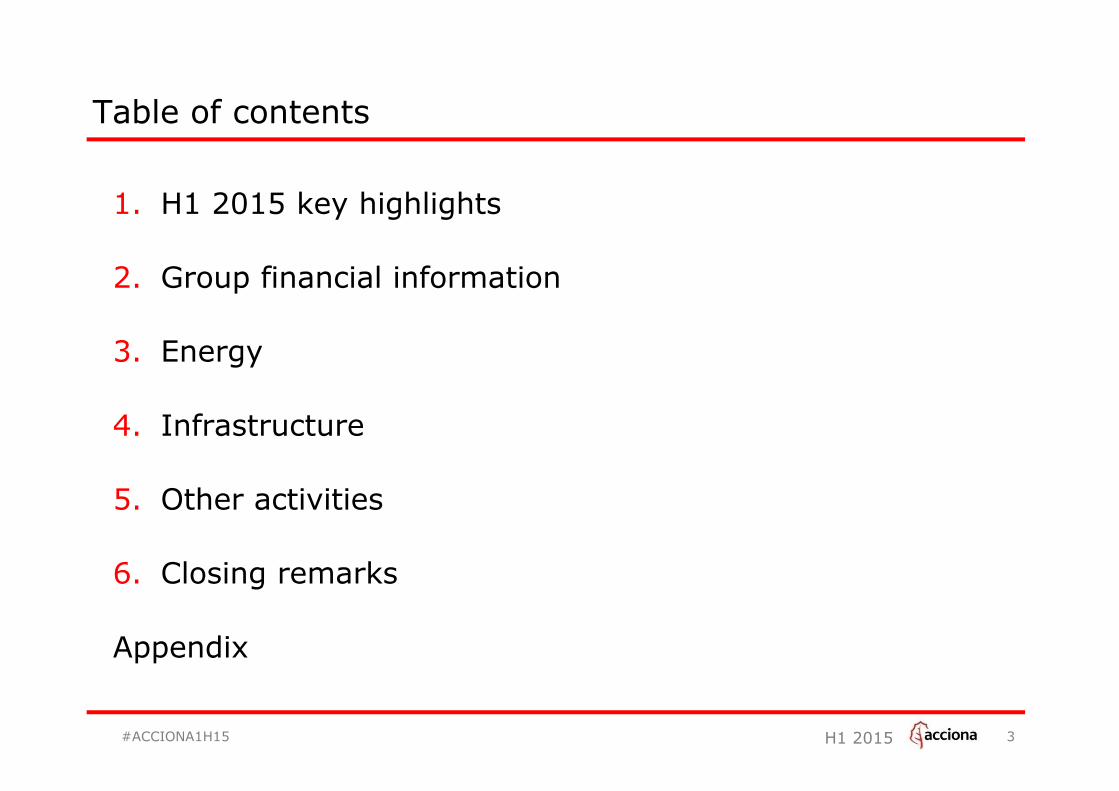
Table of contents
1. H1 2015 key highlights
2. Group financial information
3. Energy
4. Infrastructure
5. Other activities
6. Closing remarks
Appendix
#ACCIONA1H15

H1 2015 4
H1 2015 key figures
Revenues
EBITDA
Ordinary capex
NFD (vs Dec 14)
(€m)
3,304
573
99
5,153
9.9%
21.4%
-48.2%
-2.7%
% Chg.
EBIT 313 23.5%
Ordinary EBT 153 183.2%
#ACCIONA1H15

H1 2015 55
Group: Capex by division
� Ordinary capex down 48% vs H1 2014
levels
� Energy captures most of the investment
effort (66%):
- 93MW of wind installed in South
Africa during Q1 2015 completing
the 138MW of Gouda windfarm
- Q2 2015 capex mainly focused on
30MW windfarm in Poland currently
under construction
Key highlightsCapex breakdown
By division
Jan-Jun 14 Jan-Jun 15
Energy 188 65
Infrastructure 21 30
Construction 10 11
Water 5 13
Service 6 6
Other Activities -18 3
Net ordinary capex 190 99
Extraordinary divestments
-83 -51
Total net capex 108 47
Capex(€m)
#ACCIONA1H15

H1 2015
Group debt breakdown
Recourse
Non-recourse
Euro
US Dollar
Other
Fixed
Variable
Group: Debt breakdown by division and nature
Gross debt - Nature
Gross debt - Currency
Gross debt - Interest rate
H1 2015 net debt 2.7% lower than as of FY 2014H1 2015 net debt 2.7% lower than as of FY 2014
6
31-Dec-14
(€m) Net debtRecourse
debt
Non-
recourse
debt
Gross
debt
Cash +
C. Equiv.Net debt
Energy 4,653 1,306 4,050 5,356 -814 4,542
Infrastructure 252 477 523 999 -682 317
Construction 119 368 398 766 -543 223
Water 111 60 119 179 -120 59
Services 23 49 6 54 -19 35
Other businesses 145 15 188 203 -103 100
Corporate 243 528 0 528 -334 194
Total 5,294 2,326 4,761 7,087 -1,934 5,153
Average cost of debt 5.6% 5.5%
30-Jun-15
#ACCIONA1H15

H1 2015
Recourse debt: €2,326m
Cash + undrawn corporate credit lines of €3.9bnCash + undrawn corporate credit lines of €3.9bn
Average life 2.72 years vs. 2.44 as of Dec 2014Average life 2.72 years vs. 2.44 as of Dec 2014
Group: Recourse debt & liquidity
Bank debt
Non bank debt
Recourse debt amortization schedule (€m)
Bank debt vs. capital markets
Convertiblebond¹
7¹ Accounting value of convertible bond
309
Recourse debt (€m) 30-Jun-15
Bank debt 807
Commercial paper programme 369
Bonds 292
Convertible bond 309
Other (ECAs, Supranationals) 549
Capital markets 1,519
Recourse debt 2,326
Liquidity (€m) 30-Jun-15
Cash 1,934
Available committed credit lines 1,945
Total liquidity 3,879
H1 2015
84
165 171 179 191 19946
77 8088
104123
14
27 2731
32
39
39
29 1110
9
6
2015 2016 2017 2018 2019 Average2020-24
184
298
290309
336367
88
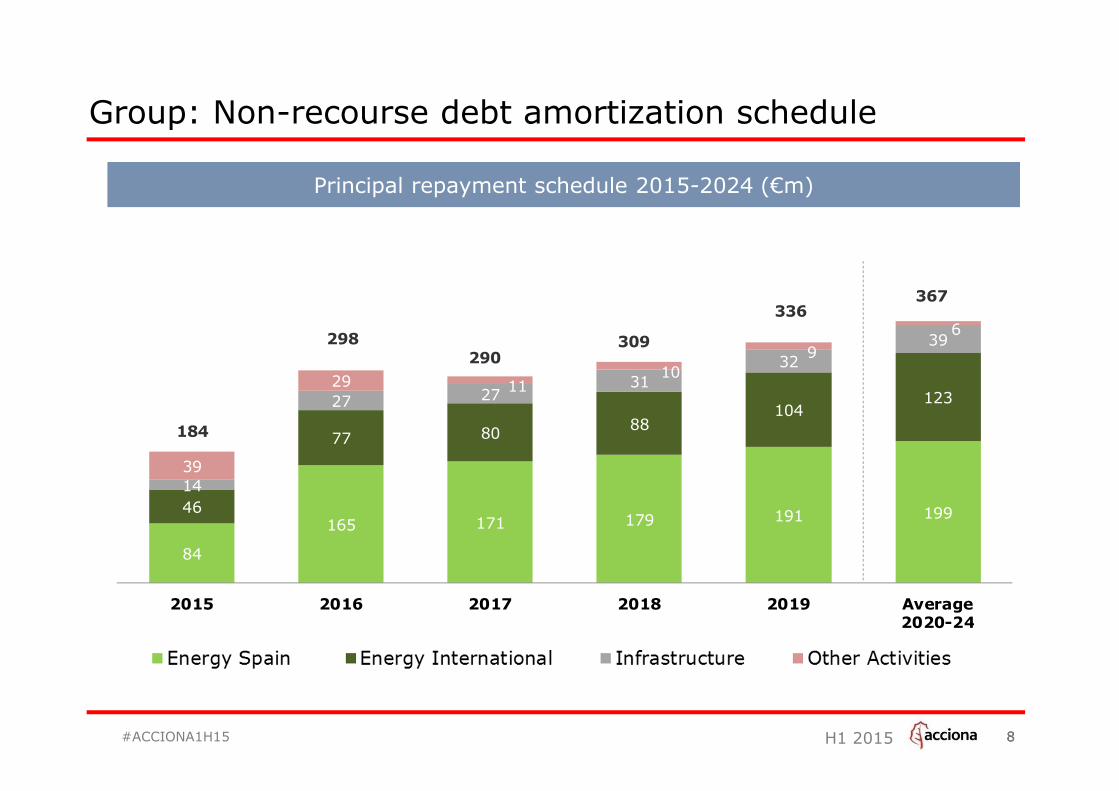
Group: Debt amortization schedulePrincipal repayment schedule 2015-2024 (€m)
Group: Non-recourse debt amortization schedule
#ACCIONA1H15

H1 2015
395
509
182466
Operating CF Investment CF Financing CF
-€242m +€45m +€56m
4,319 4,576
9
Group: Net debt evolution
9
Debt associated to work in progress Derivatives
Net debt reconciliation H1 2015 (€m)
-€141m (-3%)
#ACCIONA1H15
Extraordinary divestments
& Others

H1 2015
Energy: Key figures
Key figures EBITDA evolution (€m)
Capacity Production Industrial & Develop.
� Net improvement of €69m relative to
H1 2014, boosted by AWP turnaround
� Consolidated production flat vs H1 2014
� new capacity and higher wind & solar
load factors compensated lower
hydraulicity
� Consolidated installed capacity exceeds
7GW following the installations of 266MW
in LTM
-50MW
+266MW 7,021MW6,804MW
H1 2014 H1 2015Reduction* Install.LTM
Consolidated capacity variation
10¹ Development and Construction* Includes a reduction of 9MW of cogeneration and the disposal of 41MW of hydro
(Million Euro) Jan-Jun 14 Jan-Jun 15 Chg. Chg. (%)
Revenues 980 1,460 480 48.9%
EBITDA 363 472 108 29.9%
Margin (%) 37.0% 32.3%
EBITDA (€m) Jan-Jun 15 Chg. (€m)
Windpower 45 +49
D&C¹ 3 +19
TOTAL 48 +69
Consolidated TWh Jan-Jun 15 Chg. (%)
Wind Spain 4.10 2.7%
Wind International 3.38 7.8%
Hydro 1.27 -26.8%
Solar and other 0.566 23.4%
TOTAL 9.32 -0.1%

H1 2015
Under constr.
Total Consolidated Eq accounted Net Consolidated
Wind Spain 4,743 3,466 619 4,074 0
Wind international 2,437 2,195 49 1,443 30
Conventional Hydro 640 640 0 640 0
Hydro special regime 248 248 0 248 0
Solar Thermoelectric 314 314 0 262 0
Biomass 61 61 0 59 0
Solar PV 143 97 30 55 0
TOTAL 8,586 7,021 698 6,782 30
MW Installed MW
EBITDA
Associates
11
Energy: Installed capacity and under construction
Installed MW + Under construction MW @ H1 2015
Wind
Under construction
�Poland 30MW
Netincome
#ACCIONA1H15

H1 2015
46
-34
12
1,047
423
-526
944
BacklogDec 2014
Awarded Installed BacklogJun 2015
3rd parties & EPC
Group
1,093
-560
956
12
Energy: ACCIONA Windpower
� Revenues increase more than 2.5x vs H1 2014
� EBITDA improves +€49m
� AWP installs 560MW in H1 2015 vs 241MW in
H1 2014
− 100% international
− 100% 3MW turbine
− 94% for third party clients
− 6% for ACCIONA group
Key highlights
Key figures Backlog evolution (MW)
423MW awarded in H1 2015
� 100% for third party clients
� 100% 3MW turbine
423MW awarded in H1 2015
� 100% for third party clients
� 100% 3MW turbine
#ACCIONA1H15
(Million Euro) Jan-Jun 14 Jan-Jun 15 Chg. Chg. (%)
Revenues 210 561 351 167.1%
EBITDA -5 45 49 n.m.
Margin (%) -2.2% 8.0%
H1 2015 13
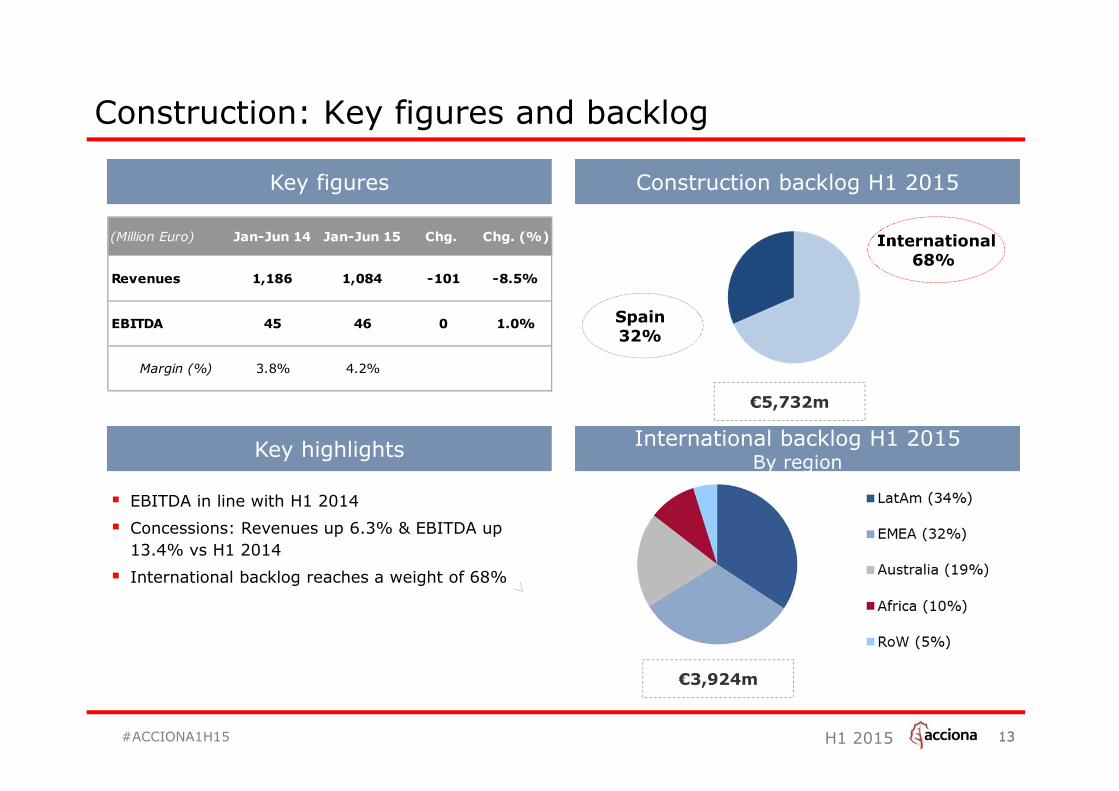
Construction: Key figures and backlog
Key figures
� EBITDA in line with H1 2014
� Concessions: Revenues up 6.3% & EBITDA up
13.4% vs H1 2014
� International backlog reaches a weight of 68%
Key highlights
13
International backlog H1 2015By region
Construction backlog H1 2015
€5,732m
Spain 32%
International68%
€3,924m
(Million Euro) Jan-Jun 14 Jan-Jun 15 Chg. Chg. (%)
Revenues 1,186 1,084 -101 -8.5%
EBITDA 45 46 0 1.0%
Margin (%) 3.8% 4.2%
#ACCIONA1H15
H1 2015
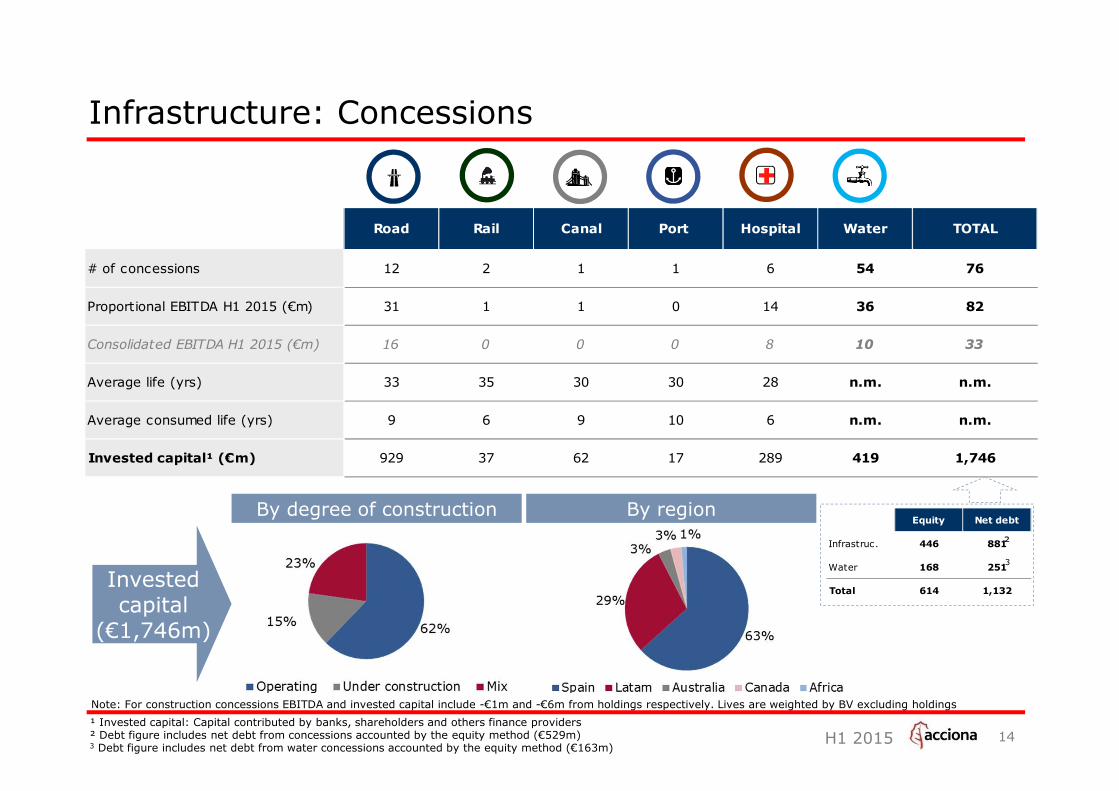
Equity Net debt
Infrastruc. 446 881
Water 168 251
Total 614 1,132
Infrastructure: Concessions
Invested capital
(€1,746m)
14
By degree of construction By region
¹ Invested capital: Capital contributed by banks, shareholders and others finance providers² Debt figure includes net debt from concessions accounted by the equity method (€529m)3 Debt figure includes net debt from water concessions accounted by the equity method (€163m)
Note: For construction concessions EBITDA and invested capital include -€1m and -€6m from holdings respectively. Lives are weighted by BV excluding holdings
²
3
Road Rail Canal Port Hospital Water TOTAL
# of concessions 12 2 1 1 6 54 76
Proportional EBITDA H1 2015 (€m) 31 1 1 0 14 36 82
Consolidated EBITDA H1 2015 (€m) 16 0 0 0 8 10 33
Average life (yrs) 33 35 30 30 28 n.m. n.m.
Average consumed life (yrs) 9 6 9 10 6 n.m. n.m.
Invested capital¹ (€m) 929 37 62 17 289 419 1,746

H1 2015 15
Water and Service
� EBITDA up 13.3% to €13m
� Water backlog stands at €9.8bn:
− D&C: €0.6bn
− O&M: €9.1bn
� ACCIONA’s consortium awarded the design,
construction and later O&M of two desalination
plants in Qatar � $525m revenues in aggregate
Water: key figures
Key highlights
Service: key figures
� ACCIONA Service includes: facility services,
airport handling, waste management, logistic
services and other
� Revenues up 4.9% to €352m boosted by higher
volumes at facility services
� EBITDA up 15% vs H1 2014
Key highlights
(Million Euro) Jan-Jun 14 Jan-Jun 15 Chg. Chg. (%)
Revenues 214 187 -27 -12.5%
EBITDA 11 13 1 13.3%
Margin (%) 5.2% 6.8%
(€m) ene-jun 14 ene-jun 15 Var. Var. (%)
Ingresos 335 352 16 4.9%
EBITDA 9 11 1 15.0%
Margen (%) 2.7% 3.0%
#ACCIONA1H15

H1 2015 16
Other activities
Other activities: key figures
Other activities: EBITDA breakdown
Trasmediterranea:
� Trasmediterranea’s revenues up 1.1% to €187m
� EBITDA increases €7m mainly due to higher
volumes, lower fuel cost in the period and
improvement in the fleet efficiency
Bestinver:
� AUM stood at €5,373m as of June 2015
� Bestinver reported EBITDA of €31m on lower
AUM
Key highlights
(Million Euro) Jan-Jun 14 Jan-Jun 15 Chg. Chg. (%)
Revenues 339 278 -61 -18.1%
EBITDA 42 32 -10 -23.6%
Margin (%) 12.3% 11.5%
(Million Euro) Jan-Jun 14 Jan-Jun 15 Chg. Chg. (%)
Trasmediterranea -5 2 7 n.m.
Real Estate 5 0 -5 -94.3%
Bestinver 44 31 -12 -28.3%
Corp. & other -2 -1 1 -18.8%
EBITDA 42 32 -10 -23.6%
#ACCIONA1H15

H1 2015
Closing remarks
17
Strong H1 2015 results …
� Group revenues €3,304m (+10%)
� Group EBITDA €573m (+21%)
� Group EBT €153m (+71%)
… on the back of a strong performance of the Energy business
� Revenues €1,460m (+49%) and EBITDA €472m (+30%)
… based on growth of international generation + significant improvement of AWP
Net Financial Debt €5,153m down -2.7% vs. Dec 2014
Capex contained: €99m
#ACCIONA1H15

Appendix

H1 2015 19
Energy: Capacity under the accounting equity method
Detail of capacity accounted under the equity method
Note: Average COD weighted per MW
30-Jun-15 MW GWh EBITDA NFD Average COD
Wind Spain 619 806 32 233 2005
Wind International 49 60 3 12 2005
Australia 33 39 2 8 2005
Hungary 12 15 1 4 2006
USA 4 7 0 0 2003
Solar PV 30 31 11 94 2008
Total equity accounted 698 897 46 339 2006
H1 2015 (proportional figures)

H1 2015
Energy: Wind drivers by country
Wind prices (€/MWh) and Load factors (%)
20Note: USA includes a “normalized” PTC of $23/MWh (~€21/MWh)
Chg. (%)
Av. price (€/MWh) LF (%) Av. price (€/MWh) LF (%) Av. price (€/MWh)
Spain Average 60.7 28.1% 46.5 27.8% 30.5%
Spain - Regulated 70.2 55.2
Spain - Not regulated 42.3 28.0
Canada 56.0 32.2% 53.1 35.0% 5.5%
USA 48.1 36.3% 44.1 44.0% 9.1%
India 55.1 23.9% 46.8 25.4% 17.6%
Mexico 65.1 48.9% 51.6 39.9% 26.2%
Costa Rica 102.1 80.2% n.m. n.m. n.m.
Australia 73.8 35.9% 67.9 34.8% 8.6%
Greece 84.5 24.8% 87.1 32.3% -3.0%
Poland 91.4 27.2% 97.7 26.4% -6.4%
Croatia 104.5 35.8% 103.1 34.8% 1.4%
Portugal 105.4 29.2% 107.0 33.2% -1.4%
Hungary 111.9 28.5% 111.5 24.9% 0.4%
Italy 141.3 20.3% 140.5 19.3% 0.5%
Chile 96.5 23.4% n.m. n.m. n.m.
H1 2015 H1 2014

29th June 2015