
Presentación de PowerPoint -...
22
Cartografía anual de incendios forestales (1985-2015) en el Noroeste de España a partir de serie temporal de datos Landsat y algoritmo Composite2Change Cristina Gómez, Jesús Martínez-Fernández, Fernando Montes, Isabel Aulló-Maestro, Antonio Vázquez INIA (España) Txomin Hermosilla, Nicholas C. Coops University of British Columbia (Canada) Joanne C. White , Mike A. Wulder Canadian Forest Service (Canada) Source: Laboratorio de incendios forestales INIA-CIFOR Congreso Nacional de Teledetección, 2017 (Murcia)
Transcript of Presentación de PowerPoint -...

Cartografía anual de incendios forestales (1985-2015) en el Noroeste de España a partir de serie temporal de datos Landsat y
algoritmo Composite2Change
Cristina Gómez, Jesús Martínez-Fernández, Fernando Montes, Isabel Aulló-Maestro, Antonio Vázquez INIA (España) Txomin Hermosilla, Nicholas C. Coops University of British Columbia (Canada)
Joanne C. White , Mike A. Wulder Canadian Forest Service (Canada)
Source: Laboratorio de incendios forestales INIA-CIFOR
Congreso Nacional de Teledetección, 2017 (Murcia)

• Time Series of Landsat data (1984-2016) • Image composites:
Target date “end of fire season” Sources of data: USGS and ESA archives
• Temporal normalization (IR-MAD)
APPROACH
• Composite2Change (C2C) algorithm • Breakpoint algorithm NBR • Spectral trend analysis • Non fire detection specific

Area burnt in 30 years: 755984 ha
RESULTS
Proportion of Area burnt per fire-size type each decade
1986-1995 1996-2005 2006-2015
> 500 ha 50 - 500 ha 1 – 50 ha < 1 ha
21.8% of scene 40.4% of forest area

Landsat scene path/row: 203 / 031 WHERE?
PO
RTU
GA
L SPAIN
Salamanca
Zamora
León
Lugo
Orense
Vila Real
Braganca
Area: 3 467 458 ha Forest area: 1 869 096 ha
Forest ecosystems: Treed Quercus pyrenaica Willd., Quercus robur L., Quercus ilex L. Pinus pinaster Ait. Pinus sylvestris L. Castanea sativa Mill. Eucaliptus globulus Labill Shrub Herb
Forest mask CORINE

Composite type Compositing period Preference Rule
Annual composite
Target DOY ± range
(for a single year)
DOY (relative to a target DOY, i.e., Sept 15)
Sensor
Archive
Proxy composite
Same as annual BAP
Gaps are assigned a proxy value by examining a
temporal trajectory of pixel values at the same
or neighboring pixel locations
Annual composite as source
Change detection + contextual rule base
Composite lexicon
Adapted from White et al. 2014
White, J. C., M. A. Wulder, G. W. Hobart, J. E. Luther, T. Hermosilla, P. Griffiths, N. C. Coops, et al. 2014. “Pixel-Based Image Compositing for Large-Area Dense Time Series Applications and Science.” Canadian Journal of Remote Sensing 40 (3): 192–212. doi:10.1080/07038992.2014.945827
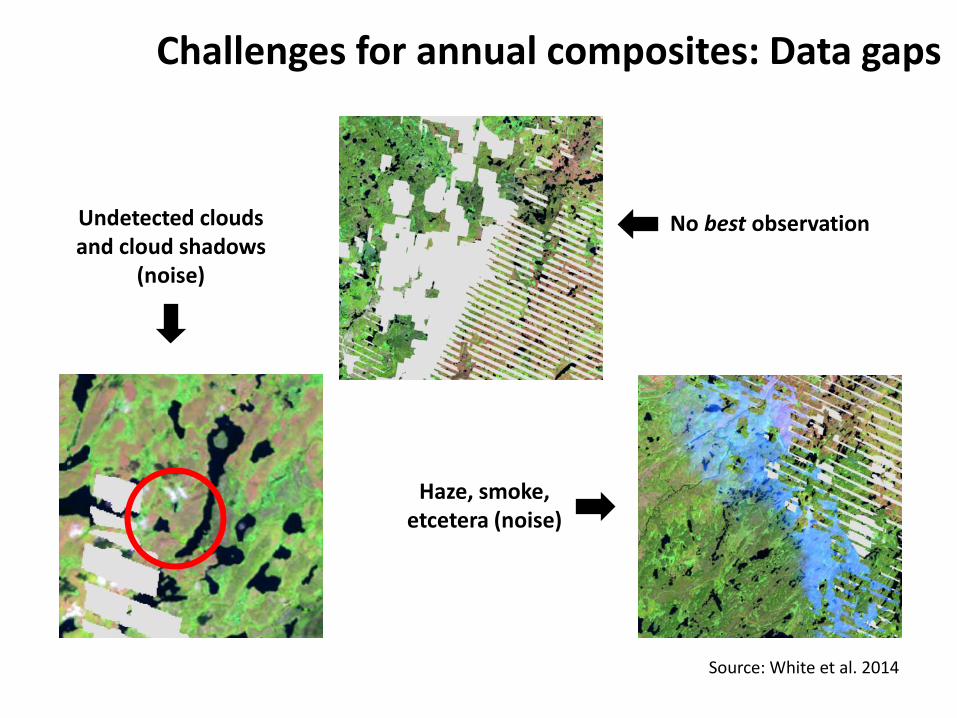
No best observation Undetected clouds and cloud shadows
(noise)
Haze, smoke, etcetera (noise)
Challenges for annual composites: Data gaps
Source: White et al. 2014

IMAGE COMPOSITES
Image availability
0
1
2
3
4
19
84
19
86
19
88
19
90
19
92
19
94
19
96
19
98
20
00
20
02
20
04
20
06
20
08
20
10
20
12
20
14
20
16
USGS ESA
• Target DOY 259: 15 September
• 30 June-1 October • < 70% cloud coverage • TM, OLI, ETM+ • Archive: USGS > ESA
Annual series “End of summer fire season”
max: 282 (October 9th)
min: 199 (July 18th)
aver: 250 259
main DOY
Composites 71 images (58% USGS-42% ESA) Average main DOY: 249 Average DOY: 244
1-4 images/composite Majority of 2 images/composite
Random Forest
Attributed changes
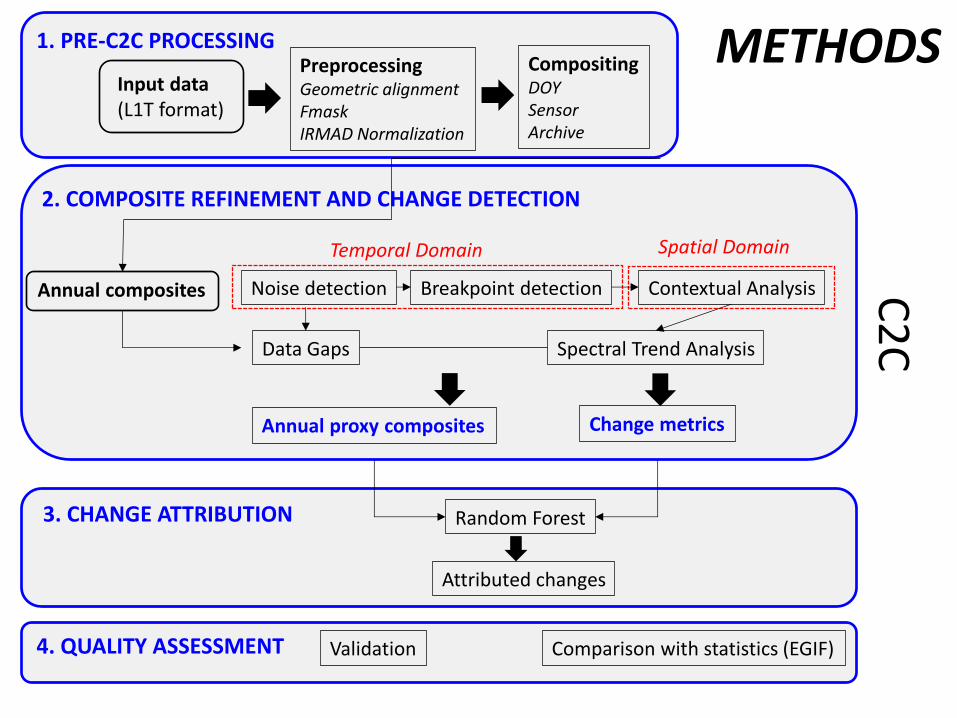
3. CHANGE ATTRIBUTION
METHODS Preprocessing Geometric alignment Fmask IRMAD Normalization
Compositing DOY Sensor Archive
1. PRE-C2C PROCESSING
Input data (L1T format)
Annual proxy composites Change metrics
Noise detection Breakpoint detection Contextual Analysis
Data Gaps
Temporal Domain Spatial Domain
Spectral Trend Analysis
C2
C
2. COMPOSITE REFINEMENT AND CHANGE DETECTION
Annual composites
4. QUALITY ASSESSMENT Validation Comparison with statistics (EGIF)

COMPOSITE2CHANGE - C2C
Algorithm fully described in:
Hermosilla T, Wulder MA, White JC, Coops NC, Hobart GW, 2015a. An Integrated Landsat Time Series Protocol for Change Detection and Generation of Annual Gap-Free Surface Reflectance Composites. Remote Sensing of Environment 158, 220–234. Hermosilla T, Wulder MA, White JC, Coops NC, Hobart GW, 2015b. Regional detection, characterization, and attribution of annual forest change from 1984 to 2012 using Landsat-derived time-series metrics. Remote Sensing of Environment 170, 121–132.
Hermosilla T, Wulder MA, White JC, Coops NC, Hobart GW, Campbell LB, 2016. Mass data processing of time series Landsat imagery: pixels to data products for forest monitoring. IJDE. http://dx.doi.org/10.1080/17538947.2016.1187673

Normalized Burn Ratio (NBR) spectral trend
CHANGE DETECTION Spectral Trend Analysis
Aggregation to object: minimum 0.5 ha
Maximum 6 segments 2 changes in 1985-2015
~20% changed pixels
Pixel level

Trend Analysis Metric
Pre-change1
Pre-change magnitude variation
Pre-change persistence
Pre-change evolution rate
Change
(negative
segments)
Change year
Change persistence
Change magnitude variation
Change rate
First change year
First change persistence
Last change year
Last change persistence
Post-change1
Post-change magnitude variation
Post-change persistence
Post-change evolution rate
Change detection outputs

Agriculture
1985
1986
1987
1988
1989
1990
1991
1992
1993
1994
1995
1996
1997
1998
1999
2000
2001
2002
2003
2004
2005
2006
2007
2008
2009
2010
2011
2012
2013
2014
2015
No change
Water
Change Year Change detection outputs

Magnitude Trend Analysis Metric
Pre-change1
Pre-change magnitude variation
Pre-change persistence
Pre-change evolution rate
Change
(negative
segments)
Change year
Change persistence
Change magnitude variation
Change rate
First change year
First change persistence
Last change year
Last change persistence
Post-change1
Post-change magnitude variation
Post-change persistence
Post-change evolution rate
Change detection outputs
High : 0
Low : -1.3High
Low

CHANGE ATTRIBUTION
Stand-replacing Non-stand-replacing
Fire Deforestation (infrastructure, other)
Partial (forest treatment, stress)
CHANGE NO CHANGE
Forested Ecosystems
Hierarchical classification
Random Forest classification
Spectral Metrics
Geometrical Metrics
Trend Analysis Metrics 30 variables (out of 55)
128 samples accross temporal series
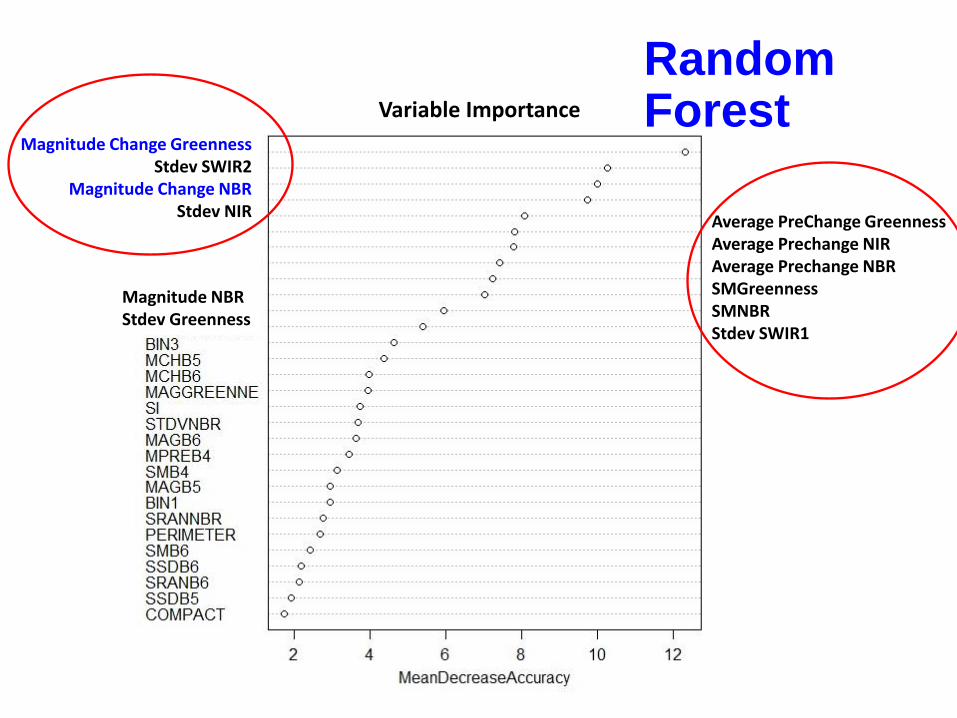
Magnitude Change Greenness Stdev SWIR2
Magnitude Change NBR Stdev NIR
Average PreChange Greenness Average Prechange NIR Average Prechange NBR SMGreenness SMNBR Stdev SWIR1
Magnitude NBR Stdev Greenness
Variable Importance
Random Forest

Random Forest classification
Type of Change
Change/No Change
10.94% error
7.03% error
CHANGE ATTRIBUTION Change Type
Fire Deforestation Partial
0
20000
40000
60000
80000
100000
120000
140000
19
85
19
87
19
89
19
91
19
93
19
95
19
97
19
99
20
01
20
03
20
05
20
07
20
09
20
11
20
13
20
15
Change Type ha
1985-2015

QUALITY ASSESSMENT (1)
Change No change User´s accuracy Commission error
Change prop 92 7 0.929 0.071
No change prop 8 93 0.921 0.079
Producer´s accuracy 0.920 0.930
Omission error 0.080 0.070
Fire Deforestation Partial User’s accuracy Comm. error
Fire 142 1 0 0.993 0.007
Veg replacing 0 41 2 0.953 0.047
Gradual 1 0 48 0.980 0.020
Producer’s accuracy 0.993 0.976 0.960
Omission error 0.007 0.024 0.040
Change detection
Overall accuracy ± margin of error = 92.5% +1.6%
201 pixel samples Stratified random sample
Change attribution
Overall accuracy ± margin of error = 98.3% +1.6%
300 object samples Stratified random sample
Temporal accuracy 97% fires detected year of reference, 3% one year delay
Validation
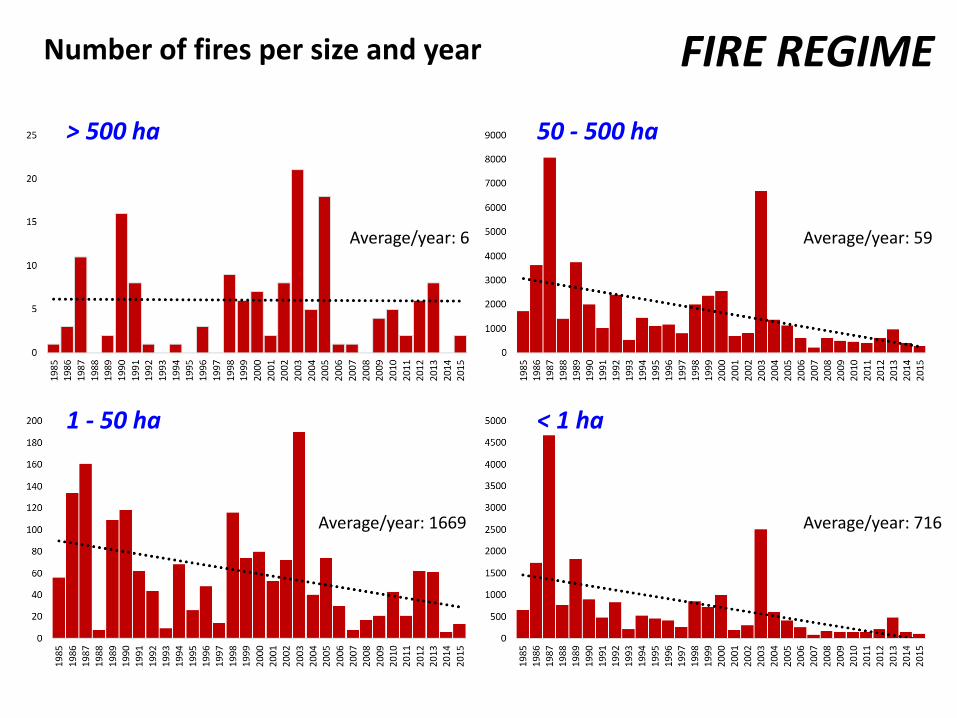
FIRE REGIME
> 500 ha 50 - 500 ha
1 - 50 ha < 1 ha
Number of fires per size and year
6 59 1669 716
Average/year: 6 Average/year: 59
Average/year: 1669 Average/year: 716

QUALITY ASSESSMENT (2) Comparison with oficial statistics
EGIF 1985-2010
EGIF C2C
Total number of fires 9134 30579
Total area burnt 72505 306939
Number of fires per year Area burnt per year (ha)
EGIF C2C EGIF C2C
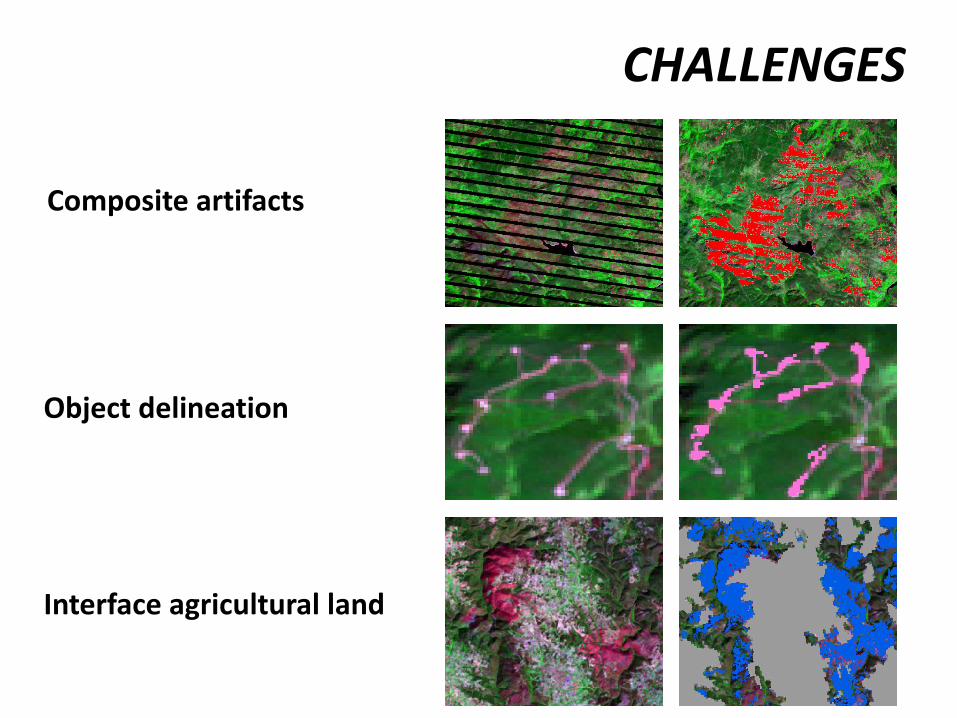
CHALLENGES
Object delineation
Interface agricultural land
Composite artifacts

• Extend to other areas in Spain: Gata
• Interactions between fire and drivers
• Vegetation recovery and invasive species
FUTURE EFFORTS

¡Gracias! [email protected]
AGL2013-46028-R “La gestión forestal frente a los cambios en la dinámica de los ecosistemas forestales: un enfoque multiescala”
AGL2016-76769-C2-1-R “Influencia del régimen de perturbaciones y la gestión en el balance de carbono, estructura y dinámica de las masas forestales”
Ministerio de Economía, Industria y Competitividad.
National Terrestrial Ecosystem Monitoring System: Timely and detailed national cross-sector monitoring for Canada
Canadian Space Agency Government Related Initiatives Program and the Canadian Forest Service of Natural Resources Canada.
Source: Laboratorio de incendios forestales INIA-CIFOR


