
Prescription pharmaceuticals market forecast to 2022 by scalar market research
41
1 Global Prescription Pharmaceuticals Market, By Therapeutic Segment (Cardiovascular Disorders, Inflammatory Conditions, Metabolic Disorders, Oncology, Respiratory Disorders, Others), By Formulations (Capsules, Inhalants, Parenterals, Tablets, Topicals), By Region (Asia, Europe, North America and Rest of the World (RoW) – Market Size and Forecast (2013–2020) Scalar Market Research. June 2016
-
Upload
scalar-market-research -
Category
Business
-
view
317 -
download
0
Transcript of Prescription pharmaceuticals market forecast to 2022 by scalar market research

1
Global Prescription Pharmaceuticals Market, By TherapeuticSegment (Cardiovascular Disorders, Inflammatory Conditions,Metabolic Disorders, Oncology, Respiratory Disorders,Others), By Formulations (Capsules, Inhalants, Parenterals,Tablets, Topicals), By Region (Asia, Europe, North Americaand Rest of the World (RoW) – Market Size and Forecast(2013–2020)
Scalar Market Research.
June 2016

2
Table of Contents
Market Overview ..................................................................................................................................16
1.1 Definitions.............................................................................................................................16
1.2 Research Methodology .........................................................................................................16
1.3 Market Segmentation ...........................................................................................................17
1 Executive Summary.......................................................................................................................19
1.1 Global Prescription Pharmaceuticals Market .......................................................................19
1.2 Global Prescription Pharmaceuticals Market Size (US$ Billion), By Therapeutic Segments(2015 vs. 2020)..................................................................................................................................20
1.3 Global Prescription Pharmaceuticals Market Size (US$ Billion), By Formulations (2015 vs.2020) 21
1.4 Global Prescription Pharmaceuticals Market Size (US$ Billion), By Regions (2015 vs. 2020)21
2 Market Overview ..........................................................................................................................23
2.1 Drivers ...................................................................................................................................23
2.1.1 Increase in the Ageing Population and Lengthening Life Expectancies........................23
2.1.2 Rising Affluence in Emerging Markets ..........................................................................23
2.1.3 Widespread Prevalence of Chronic Diseases................................................................23
2.2 Restraints ..............................................................................................................................24
2.2.1 Government Policies Aimed at Lowering Prescription Drug Prices ..............................24
2.2.2 Generics and Biosimilars Drugs Hampering Prescription Pharmaceuticals Growth.....24
2.3 Opportunities........................................................................................................................25
2.3.1 Emerging Markets are key Pockets...............................................................................25
2.3.2 Increased Healthcare Awareness..................................................................................25
2.4 Trends ...................................................................................................................................25
2.4.1 Increased Spending on Specialty Medicines – Hepatitis, Autoimmune Diseases, andOncology 25
3 Industry Analysis ...........................................................................................................................26
3.1 Supply Chain Analysis............................................................................................................26
3.2 Regulatory Analysis ...............................................................................................................29
3.3 Macroeconomic Indicators ...................................................................................................30
SAMPLE
3
3.3.1 Healthcare Spending (US$ Billion), by Regions (2005 to 2014) ....................................30
3.3.2 Per Capita Healthcare Spending (US$), by Regions (2005 to 2014)..............................30
3.3.3 Public Healthcare Spending (US$ Billion), by Regions (2005 to 2014)..........................30
3.4 Ecosystem Analysis ...............................................................................................................31
3.4.1 Market Size of Top-25 Prescription Pharmaceuticals (2013 to 2015) ..........................31
3.4.2 Therapeutic Segments Benchmarking ..........................................................................32
4 Prescription Pharmaceuticals Markets, by Therapeutic Segments ..............................................34
4.1 Introduction ..........................................................................................................................34
4.1.1 Global Prescription Pharmaceuticals Market Size & Forecast (US$ billion), ByTherapeutic Segments (2015) .......................................................................................................34
4.1.2 Global Prescription Pharmaceuticals Market Size & Forecast (US$ billion), ByTherapeutic Segments (2013 – 2020) ...........................................................................................34
4.2 Cardiovascular Disorders ......................................................................................................35
4.2.1 Global Prescription Pharmaceuticals Market Size & Forecast (US$ billion), ByCardiovascular Disorders, (2013 – 2020) ......................................................................................36
4.2.2 Global Prescription Pharmaceuticals for Cardiovascular Disorders Market Size &Forecast (US$ billion), By Regions (2015 vs. 2020) .......................................................................36
4.2.3 Global Prescription Pharmaceuticals for Cardiovascular Disorders Market Size &Forecast (US$ billion), By Regions (2013 – 2020) .........................................................................37
4.2.4 North America Prescription Pharmaceuticals for Cardiovascular Disorders Market Size& Forecast (US$ billion), By Country (2013 – 2020) .....................................................................37
4.2.5 Europe Prescription Pharmaceuticals for Cardiovascular Disorders Market Size &Forecast (US$ billion), By Country (2013 – 2020) .........................................................................38
4.2.6 Asia Prescription Pharmaceuticals for Cardiovascular Disorders Market Size (US$Billion) & Forecast (US$ billion), By Country (2013 – 2020) .........................................................38
4.2.7 Rest of the World (RoW) Prescription Pharmaceuticals for Cardiovascular DisordersMarket Size & Forecast (US$ billion), By Country (2013 – 2020)..................................................38
4.3 Oncology ...............................................................................................................................39
4.3.1 Global Prescription Pharmaceuticals Market Size & Forecast (US$ billion), By Oncology(2013 – 2020) ................................................................................................................................39
4.3.2 Global Prescription Pharmaceuticals for Oncology Market Size & Forecast (US$billion), By Regions (2015 vs. 2020) ..............................................................................................40
4.3.3 Global Prescription Pharmaceuticals for Oncology Market Size & Forecast (US$billion), By Regions (2013 – 2020).................................................................................................40
4.3.4 North America Prescription Pharmaceuticals for Oncology Market Size & Forecast(US$ billion), By Country (2013 – 2020)........................................................................................41
SAMPLE

4
4.3.5 Europe Prescription Pharmaceuticals for Oncology Market Size & Forecast (US$billion), By Country (2013 – 2020) ................................................................................................41
4.3.6 Asia Prescription Pharmaceuticals for Oncology Market Size & Forecast (US$ billion),By Country (2013 – 2020) .............................................................................................................42
4.3.7 Rest of the World (RoW) Prescription Pharmaceuticals for Oncology Market Size &Forecast (US$ billion), By Country (2013 – 2020) .........................................................................42
4.4 Inflammatory Conditions ......................................................................................................42
4.4.1 Global Prescription Pharmaceuticals Market Size & Forecast (US$ billion), ByInflammatory Conditions (2013 – 2020) .......................................................................................43
4.4.2 Global Prescription Pharmaceuticals Market Size & Forecast for InflammatoryConditions (US$ billion), By Regions (2015 vs. 2020) ...................................................................43
4.4.3 Global Prescription Pharmaceuticals Market Size & Forecast for InflammatoryConditions (US$ billion), By Regions (2013 – 2020)......................................................................44
4.4.4 North America Prescription Pharmaceuticals Market Size & Forecast for InflammatoryConditions (US$ billion), By Country (2013 – 2020)......................................................................44
4.4.5 Europe Prescription Pharmaceuticals Market Size & Forecast for InflammatoryConditions (US$ billion), By Country (2013 – 2020)......................................................................45
4.4.6 Asia Prescription Pharmaceuticals Market Size & Forecast for InflammatoryConditions (US$ billion), By Country (2013 – 2020)......................................................................45
4.4.7 Rest of the World (RoW) Prescription Pharmaceuticals Market Size & Forecast forInflammatory Conditions (US$ billion), By Country (2013 – 2020)...............................................45
4.5 Infectious Diseases................................................................................................................46
4.5.1 Global Prescription Pharmaceuticals Market Size & Forecast (US$ billion), ByInfectious Diseases (2013 – 2020) ................................................................................................46
4.5.2 Global Prescription Pharmaceuticals Market Size & Forecast for Infectious Diseases(US$ billion), By Regions (2015 vs. 2020)......................................................................................47
4.5.3 Global Prescription Pharmaceuticals Market Size & Forecast for Infectious Diseases(US$ billion), By Regions (2013 – 2020) ........................................................................................47
4.5.4 North America Prescription Pharmaceuticals Market Size & Forecast for InfectiousDiseases (US$ billion), By Country (2013 – 2020) .........................................................................48
4.5.5 Europe Prescription Pharmaceuticals Market Size & Forecast for Infectious Diseases(US$ billion), By Country (2013 – 2020)........................................................................................48
4.5.6 Asia Prescription Pharmaceuticals Market Size & Forecast for Infectious Diseases (US$billion), By Country (2013 – 2020) ................................................................................................48
4.5.7 Rest of the World (RoW) Prescription Pharmaceuticals Market Size & Forecast forInfectious Diseases (US$ billion), By Country (2013 – 2020) ........................................................49
4.6 Metabolic Disorders..............................................................................................................49
SAMPLE
5
4.6.1 Global Prescription Pharmaceuticals Market Size & Forecast (US$ billion), ByMetabolic Disorders (2013 – 2020)...............................................................................................49
4.6.2 Global Prescription Pharmaceuticals Market Size & Forecast for Metabolic Disorders(US$ billion), By Regions (2015 vs. 2020)......................................................................................50
4.6.3 Global Prescription Pharmaceuticals Market Size & Forecast for Metabolic Disorders(US$ billion), By Regions (2013 – 2020) ........................................................................................50
4.6.4 North America Prescription Pharmaceuticals Market Size & Forecast for MetabolicDisorders (US$ billion), By Country (2013 – 2020) .......................................................................51
4.6.5 Europe Prescription Pharmaceuticals Market Size & Forecast for Metabolic Disorders(US$ billion), By Country (2013 – 2020)........................................................................................51
4.6.6 Asia Prescription Pharmaceuticals Market Size & Forecast for Metabolic Disorders(US$ billion), By Country (2013 – 2020)........................................................................................51
4.6.7 Rest of the World (RoW) Prescription Pharmaceuticals Market Size & Forecast forMetabolic Disorders (US$ billion), By Country (2013 – 2020) ......................................................52
4.7 Respiratory Disorders ...........................................................................................................52
4.7.1 Global Prescription Pharmaceuticals Market Size & Forecast (US$ billion), ByRespiratory Disorders (2013 – 2020) ............................................................................................52
4.7.2 Global Prescription Pharmaceuticals Market Size & Forecast for Respiratory Disorders(US$ billion), By Regions (2015 vs. 2020)......................................................................................53
4.7.3 Global Prescription Pharmaceuticals Market Size & Forecast for Respiratory Disorders(US$ billion), By Regions (2013 – 2020) ........................................................................................53
4.7.4 North America Prescription Pharmaceuticals Market Size & Forecast for RespiratoryDisorders (US$ billion), By Country (2013 – 2020) .......................................................................54
4.7.5 Europe Prescription Pharmaceuticals Market Size & Forecast for Respiratory Disorders(US$ billion), By Country (2013 – 2020)........................................................................................54
4.7.6 Asia Prescription Pharmaceuticals Market Size & Forecast for Respiratory Disorders(US$ billion), By Country (2013 – 2020)........................................................................................55
4.7.7 Rest of the World (RoW) Prescription Pharmaceuticals Market Size & Forecast forRespiratory Disorders (US$ billion), By Country (2013 – 2020) ....................................................55
4.8 Other Therapeutic Segments ................................................................................................55
4.8.1 Global Prescription Pharmaceuticals Market Size & Forecast (US$ billion), By OtherTherapeutic Segments (2013 – 2020) ...........................................................................................56
4.8.2 Global Prescription Pharmaceuticals Market Size & Forecast for Other TherapeuticSegments (US$ billion), By Regions (2015 vs. 2020) .....................................................................56
4.8.3 Global Prescription Pharmaceuticals Market Size & Forecast for Other TherapeuticSegments (US$ billion), By Regions (2013 – 2020) .......................................................................57
SAMPLE
6
4.8.4 North America Prescription Pharmaceuticals Market Size & Forecast for OtherTherapeutic Segments (US$ billion), By Country (2013 – 2020)...................................................57
4.8.5 Europe Prescription Pharmaceuticals Market Size & Forecast for Other TherapeuticSegments (US$ billion), By Country (2013 – 2020) .......................................................................57
4.8.6 Asia Prescription Pharmaceuticals Market Size & Forecast for Other TherapeuticSegments (US$ billion), By Country (2013 – 2020) .......................................................................58
4.8.7 Rest of the World (RoW) Prescription Pharmaceuticals Market Size & Forecast forOther Therapeutic Segments (US$ billion), By Country (2013 – 2020) ........................................58
5 Prescription Pharmaceuticals Markets, by Formulations .............................................................59
5.1 Introduction ..........................................................................................................................59
5.1.1 Global Prescription Pharmaceuticals Market Size & Forecast (US$ billion), ByFormulations (2015)......................................................................................................................59
5.1.2 Global Prescription Pharmaceuticals Market Size & Forecast (US$ billion), ByFormulations (2013 – 2020)..........................................................................................................59
5.2 Capsules ................................................................................................................................60
5.2.1 Global Capsules Market Size & Forecast (US$ billion) (2013 – 2020)...........................60
5.2.2 Global Capsules Market Size & Forecast (US$ billion), By Regions (2015 vs. 2020) .....61
5.2.3 Global Capsules Market Size & Forecast (US$ billion), By Regions (2013 – 2020) .......61
5.3 Tablets...................................................................................................................................62
5.3.1 Global Tablets Market Size & Forecast (US$ billion), (2013 – 2020) ............................62
5.3.2 Global Tablets Market Size & Forecast (US$ billion), By Regions (2015 vs. 2020) .......62
5.3.3 Global Tablets Market Size & Forecast (US$ billion), By Regions (2013 – 2020)..........63
5.4 Inhalants and Liquids ............................................................................................................63
5.4.1 Global Inhalants and Liquids Market Size & Forecast (US$ billion), (2013 – 2020)......64
5.4.2 Global Inhalants and Liquids Market Size & Forecast (US$ billion), By Regions (2015 vs.2020) 64
5.4.3 Global Inhalants and Liquids Market Size & Forecast (US$ billion), By Regions (2013 –2020) 65
5.5 Parenterals ............................................................................................................................65
5.5.1 Global Parenteral Market Size Market Size & Forecast (US$ billion), (2013 – 2020) ...65
5.5.2 Global Parenteral Market Size & Forecast (US$ billion), By Regions (2015 vs. 2020) ..66
5.5.3 Global Parenterals Market Size & Forecast (US$ billion), By Regions (2013 – 2020) ...66
5.6 Topicals .................................................................................................................................67
5.6.1 Global Topicals Market Size & Forecast (US$ billion), (2013 – 2020) ...........................67
SAMPLE
7
5.6.2 Global Topicals Market Size & Forecast (US$ billion), By Regions (2015 vs. 2020) ......67
5.6.3 Global Topicals Market Size & Forecast (US$ billion), By Regions (2013 – 2020) ........68
6 Geographic Analysis ......................................................................................................................69
6.1 Introduction ..........................................................................................................................69
6.1.1 Global Prescription Pharmaceuticals Market Size vs. CAGR% (2015 – 2020), By Regions.......................................................................................................................................69
6.1.2 Global Prescription Pharmaceuticals Market Size & Forecast (US$ billion), By Regions(2013 – 2020) ................................................................................................................................69
6.2 North America.......................................................................................................................70
6.2.1 North America Prescription Pharmaceuticals Market Size & Forecast (US$ billion), ByCountry (2013 – 2020) ..................................................................................................................70
6.2.2 North America Prescription Pharmaceuticals Market Size & Forecast (US$ billion),(2013 – 2020) ................................................................................................................................70
6.2.3 North America Prescription Pharmaceuticals Market Size & Forecast (US$ billion), ByTherapeutic Segments (2013 – 2020) ...........................................................................................71
6.2.4 North America Prescription Pharmaceuticals Market Size & Forecast (US$ billion), ByFormulations (2013 – 2020)..........................................................................................................72
6.3 Europe...................................................................................................................................73
6.3.1 Europe Prescription Pharmaceuticals Market Size & Forecast (US$ billion), By Country(2013 – 2020) ................................................................................................................................73
6.3.2 Europe Prescription Pharmaceuticals Market Size & Forecast (US$ billion), (2013 –2020) .......................................................................................................................................73
6.3.3 Europe Prescription Pharmaceuticals Market Size & Forecast (US$ billion), ByTherapeutic Segments (2013 – 2020) ...........................................................................................74
6.3.4 Europe Prescription Pharmaceuticals Market Size & Forecast (US$ billion), ByFormulations (2013 – 2020)..........................................................................................................74
6.4 Asia........................................................................................................................................75
6.4.1 Asia Prescription Pharmaceuticals Market Size & Forecast (US$ billion), By Country(2013 – 2020) ................................................................................................................................75
6.5 Asia Prescription Pharmaceuticals Market Size & Forecast (US$ billion), (2013 – 2020).....75
6.5.1 Asia Prescription Pharmaceuticals Market Size & Forecast (US$ billion), ByTherapeutic Segments (2013 – 2020) ...........................................................................................76
6.5.2 Asia Prescription Pharmaceuticals Market Size & Forecast (US$ billion), ByFormulations (2013 – 2020)..........................................................................................................76
6.6 Rest of the World (RoW).......................................................................................................77
SAMPLE

8
6.6.1 RoW Prescription Pharmaceuticals Market Size & Forecast (US$ billion), By Country,(2013 – 2020) ................................................................................................................................77
6.6.2 Row Prescription Pharmaceuticals Market Size & Forecast (US$ billion), (2013 – 2020).......................................................................................................................................77
6.6.3 RoW Prescription Pharmaceuticals Market Size & Forecast (US$ billion), ByTherapeutic Segments (2013 – 2020) ...........................................................................................78
6.6.4 RoW Prescription Pharmaceuticals Market Size & Forecast (US$ billion), ByFormulations (2013 – 2020)..........................................................................................................78
7 Competitive Landscape.................................................................................................................80
7.1 Market Share Analysis...........................................................................................................80
7.2 Market Positioning of Key Players ........................................................................................80
8 Company Profiles ..........................................................................................................................81
8.1 AstraZeneca (U.K.) ................................................................................................................81
8.1.1 Financial Overview: AstraZeneca plc (U.K.) (Europe) (2013 to 2015)...........................81
8.1.2 Revenues of Top-3 Pharmaceutical Products AstraZeneca plc (U.K.) (Europe) (2013 to2015) 82
8.2 Bayer AG (Germany) .............................................................................................................82
8.2.1 Financial Overview: Bayer AG (Germany) (Europe) (2013 to 2015) .............................83
8.2.2 Revenues of Top-3 Pharmaceutical Products: Bayer AG (Germany) (Europe) (2013 to2015) .......................................................................................................................................83
8.3 Gilead Sciences (U.S.)............................................................................................................84
8.3.1 Financial Overview: Gilead Sciences, Inc. (U.S.) (2013 to 2015) ...................................84
8.3.2 Revenues of Top-3 Pharmaceutical Products: Gilead Sciences, Inc. (U.S.) (2013 to2015) .......................................................................................................................................85
8.4 GlaxoSmithKline (U.K.) ..........................................................................................................85
8.4.1 Financial Overview: GlaxoSmithKline plc (U.K.) (Europe) (2013 to 2015) ....................85
8.4.2 Revenues of Top-3 Pharmaceutical Products: GlaxoSmithKline plc (U.K.) (Europe)(2013 to 2015)...............................................................................................................................86
8.5 Johnson & Johnson (U.S.)......................................................................................................87
8.5.1 Financial Overview: Johnson & Johnson (U.S.) (2013 to 2015) ....................................87
8.5.2 Revenues of Top-3 Pharmaceutical Products: Johnson & Johnson (U.S.) (2013 to 2015).......................................................................................................................................88
8.6 Merck & Co (U.S)...................................................................................................................88
8.6.1 Financial Overview: Merck & Co., Inc. (U.S.) (2013 to 2015)........................................88
SAMPLE

9
8.6.2 Revenues of Top-3 Pharmaceutical Products: Merck & Co., Inc. (U.S.) (2013 to 2015)89
8.7 Novartis A.G. (Switzerland) ...................................................................................................90
8.7.1 Financial Overview: Novartis AG (Switzerland) (Europe) (2013 to 2015).....................90
8.7.2 Revenues of Top-3 Pharmaceutical Products: Novartis AG (Switzerland) (Europe)(2013 to 2015)...............................................................................................................................91
8.8 Pfizer (U.S.)............................................................................................................................91
8.8.1 Financial Overview: Pfizer Inc. (U.S.) (2013 to 2015)....................................................91
8.8.2 Revenues of Top-3 Pharmaceutical Products: Pfizer Inc. (U.S.) (2013 to 2015) ...........92
8.9 F. Hoffmann-La Roche (Switzerland) ....................................................................................93
8.9.1 Financial Overview: F. Hoffmann-La Roche (Switzerland) (Europe) (2013 to 2015) ....93
8.9.2 Revenues of Top-3 Pharmaceutical Products: Hoffmann-La Roche (Switzerland)(Europe) (2013 to 2015)................................................................................................................94
8.10 Sanofi S.A.(France) ................................................................................................................94
8.10.1 Financial Overview: Sanofi S.A. (France) (Europe) (2013 to 2015) ...............................94
8.10.2 Revenues of Top-3 Pharmaceutical Products: Sanofi S.A. (France) (Europe) (2013 to2015) .......................................................................................................................................95
9 SCALAR 360 DEGREE MARKET REVIEW.........................................................................................96
10 Appendix .......................................................................................................................................96
10.1 Acronyms ..............................................................................................................................96
10.2 Contact Us................................................................................ Error! Bookmark not defined.
10.3 Disclaimer................................................................................. Error! Bookmark not defined.SAMPLE
10
Table 1. Global Prescription Pharmaceuticals Market ...................................................................19
Table 2. Global Prescription Pharmaceuticals Market Size (US$ Billion), By Therapeutic Segments(2015 vs. 2020)......................................................................................................................................20
Table 3...................................................................................................................................................20
Table 4. Global Prescription Pharmaceuticals Market Size (US$ Billion), By Formulations (2015 vs.2020) 21
Table 5. Global Prescription Pharmaceuticals Market Size (US$ Billion), By Regions (2015 vs.2020) 21
Table 6. Healthcare Spending (US$ Billion), by Regions (2005 to 2014) ........................................30
Table 7. Per Capita Healthcare Spending (US$), by Regions (2005 to 2014)..................................30
Table 8. Public Healthcare Spending (US$ Billion), by Regions (2005 to 2014)..............................30
Table 9. Market Size of Top-25 Prescription Pharmaceuticals (2013 to 2015) ..............................31
Table 10. Therapeutic Segments Benchmarking ..............................................................................32
Table 11. Global Prescription Pharmaceuticals Market Size & Forecast (US$ billion), By TherapeuticSegments (2013 – 2020) .......................................................................................................................34
Table 12. Global Prescription Pharmaceuticals Market Size & Forecast (US$ billion), ByCardiovascular Disorders, (2013 – 2020) ..............................................................................................36
Table 13. Global Prescription Pharmaceuticals for Cardiovascular Disorders Market Size & Forecast(US$ billion), By Regions (2013 – 2020) ................................................................................................37
Table 14. North America Prescription Pharmaceuticals for Cardiovascular Disorders Market Size &Forecast (US$ billion), By Country (2013 – 2020) .................................................................................37
Table 15. Europe Prescription Pharmaceuticals for Cardiovascular Disorders Market Size &Forecast (US$ billion), By Country (2013 – 2020) .................................................................................38
Table 16. Asia Prescription Pharmaceuticals for Cardiovascular Disorders Market Size (US$ Billion)for Asia, By Country (2013 – 2020) .......................................................................................................38
Table 17. Rest of the World (RoW) Prescription Pharmaceuticals for Cardiovascular DisordersMarket Size & Forecast (US$ billion), By Country (2013 – 2020) .........................................................38
Table 18. Global Prescription Pharmaceuticals Market Size & Forecast (US$ billion), By Oncology(2013 – 2020) ........................................................................................................................................39
Table 19. Global Prescription Pharmaceuticals for Oncology Market Size & Forecast (US$ billion),By Regions (2013 – 2020)......................................................................................................................40
Table 20. North America Prescription Pharmaceuticals for Oncology Market Size & Forecast (US$billion), By Country (2013 – 2020) ........................................................................................................41
Table 21. Europe Prescription Pharmaceuticals for Oncology Market Size & Forecast (US$ billion),By Country (2013 – 2020) .....................................................................................................................41
SAMPLE
11
Table 22. Asia Prescription Pharmaceuticals for Oncology Market Size & Forecast (US$ billion), ByCountry (2013 – 2020) ..........................................................................................................................42
Table 23. Rest of the World (RoW), Prescription Pharmaceuticals for Oncology Market Size &Forecast (US$ billion),By Country (2013 – 2020) ..................................................................................42
Table 24. Global Prescription Pharmaceuticals Market Size & Forecast (US$ billion), ByInflammatory Conditions (2013 – 2020)...............................................................................................43
Table 25. Global Prescription Pharmaceuticals Market Size & Forecast for Inflammatory Conditions(US$ billion), By Regions (2013 – 2020) ................................................................................................44
Table 26. North America Prescription Pharmaceuticals Market Size & Forecast for InflammatoryConditions (US$ billion), By Country (2013 – 2020)..............................................................................44
Table 27. Europe Prescription Pharmaceuticals Market Size & Forecast for InflammatoryConditions (US$ billion), By Country (2013 – 2020)..............................................................................45
Table 28. Asia Prescription Pharmaceuticals Market Size & Forecast for Inflammatory Conditions(US$ billion), By Country (2013 – 2020)................................................................................................45
Table 29. Rest of the World (RoW) Prescription Pharmaceuticals Market Size & Forecast forInflammatory Conditions (US$ billion), By Country (2013 – 2020).......................................................45
Table 30. Global Prescription Pharmaceuticals Market Size & Forecast (US$ billion), By InfectiousDiseases (2013 – 2020) .........................................................................................................................46
Table 31. Global Prescription Pharmaceuticals Market Size & Forecast for Infectious Diseases (US$billion), By Regions (2015 vs. 2020) ......................................................................................................47
Table 32. Global Prescription Pharmaceuticals Market Size & Forecast for Infectious Diseases (US$billion), By Regions (2013 – 2020).........................................................................................................47
Table 33. North America Prescription Pharmaceuticals Market Size & Forecast for InfectiousDiseases (US$ billion), By Country (2013 – 2020) .................................................................................48
Table 34. Europe Prescription Pharmaceuticals Market Size & Forecast for Infectious Diseases(US$ billion), By Country (2013 – 2020)................................................................................................48
Table 35. Asia Prescription Pharmaceuticals Market Size & Forecast for Infectious Diseases (US$billion), By Country (2013 – 2020) ........................................................................................................48
Table 36. Rest of the World (RoW) Prescription Pharmaceuticals Market Size & Forecast forInfectious Diseases (US$ billion), By Country (2013 – 2020) ................................................................49
Table 37. Global Prescription Pharmaceuticals Market Size & Forecast (US$ billion), By MetabolicDisorders (2013 – 2020)........................................................................................................................49
Table 38. Global Prescription Pharmaceuticals Market Size & Forecast for Metabolic Disorders(US$ billion), By Regions (2013 – 2020) ................................................................................................50
Table 39. North America Prescription Pharmaceuticals Market Size & Forecast for MetabolicDisorders (US$ billion), By Country (2013 – 2020) ...............................................................................51
Table 40. Europe Prescription Pharmaceuticals Market Size & Forecast for Metabolic Disorders(US$ billion), By Country (2013 – 2020)................................................................................................51
SAMPLE

12
Table 41. Asia Prescription Pharmaceuticals Market Size & Forecast for Metabolic Disorders (US$billion), By Country (2013 – 2020) ........................................................................................................51
Table 42. Rest of the World (RoW) Prescription Pharmaceuticals Market Size & Forecast forMetabolic Disorders (US$ billion), By Country (2013 – 2020) ..............................................................52
Table 43. Global Prescription Pharmaceuticals Market Size & Forecast (US$ billion), By RespiratoryDisorders (2013 – 2020)........................................................................................................................52
Table 44. Global Prescription Pharmaceuticals Market Size & Forecast for Respiratory Disorders(US$ billion), By Regions (2013 – 2020) ................................................................................................53
Table 45. North America Prescription Pharmaceuticals Market Size & Forecast for RespiratoryDisorders (US$ billion), By Country (2013 – 2020) ...............................................................................54
Table 46. Europe Prescription Pharmaceuticals Market Size & Forecast for Respiratory Disorders(US$ billion), By Country (2013 – 2020)................................................................................................54
Table 47. Asia Prescription Pharmaceuticals Market Size & Forecast for Respiratory Disorders (US$billion), By Country (2013 – 2020) ........................................................................................................55
Table 48. Rest of the World (RoW) Prescription Pharmaceuticals Market Size & Forecast forRespiratory Disorders (US$ billion), By Country (2013 – 2020)............................................................55
Table 49. Global Prescription Pharmaceuticals Market Size & Forecast (US$ billion), By OtherTherapeutic Segments (2013 – 2020) ...................................................................................................56
Table 50. Global Prescription Pharmaceuticals Market Size & Forecast for Other TherapeuticSegments (US$ billion), By Regions (2013 – 2020) ...............................................................................57
Table 51. North America Prescription Pharmaceuticals Market Size & Forecast for OtherTherapeutic Segments (US$ billion), By Country (2013 – 2020)...........................................................57
Table 52. Europe Prescription Pharmaceuticals Market Size & Forecast for Other TherapeuticSegments (US$ billion), By Country (2013 – 2020) ...............................................................................57
Table 53. Asia Prescription Pharmaceuticals Market Size & Forecast for Other TherapeuticSegments (US$ billion), By Country (2013 – 2020) ...............................................................................58
Table 54. Rest of the World (RoW) Prescription Pharmaceuticals Market Size & Forecast for OtherTherapeutic Segments (US$ billion), By Country (2013 – 2020)...........................................................58
Table 55. Global Prescription Pharmaceuticals Market Size & Forecast (US$ billion), ByFormulations (2013 – 2020)..................................................................................................................59
Table 56. Global Capsules Market Size & Forecast (US$ billion) (2013 – 2020)...............................60
Table 57. Global Capsules Market Size & Forecast (US$ billion), By Regions (2013 – 2020) ...........61
Table 58. Global Tablets Market Size & Forecast (US$ billion), (2013 – 2020) ................................62
Table 59. Global Tablets Market Size & Forecast (US$ billion), By Regions (2013 – 2020)..............63
Table 60. Global Inhalants and Liquids Market Size & Forecast (US$ billion), (2013 – 2020)..........64
Table 61. Global Inhalants and Liquids Market Size & Forecast (US$ billion), By Regions (2013 –2020) 65
SAMPLE

13
Table 62. Global Parenteral Market Size & Forecast (US$ billion), (2013 – 2020) ...........................65
Table 63. Global Parenterals Market Size & Forecast (US$ billion), By Regions (2013 – 2020) ......66
Table 64. Global Topicals Market Size & Forecast (US$ billion), (2013 – 2020) ...............................67
Table 65. Global Topicals Market Size & Forecast (US$ billion), By Regions (2013 – 2020) ............68
Table 66. Global Prescription Pharmaceuticals Market Size & Forecast (US$ billion), By Regions(2013 – 2020) ........................................................................................................................................69
Table 67. North America Prescription Pharmaceuticals Market Size & Forecast (US$ billion), ByCountry (2013 – 2020) ..........................................................................................................................70
Table 68. North America Prescription Pharmaceuticals Market Size & Forecast (US$ billion), (2013– 2020) 70
Table 69. North America Prescription Pharmaceuticals Market Size & Forecast (US$ billion), ByTherapeutic Segments (2013 – 2020) ...................................................................................................71
Table 70. North America Prescription Pharmaceuticals Market Size & Forecast (US$ billion), ByFormulations (2013 – 2020)..................................................................................................................72
Table 71. Europe Prescription Pharmaceuticals Market Size & Forecast (US$ billion), By Country(2013 – 2020) ........................................................................................................................................73
Table 72. Europe Prescription Pharmaceuticals Market Size & Forecast (US$ billion), (2013 – 2020)73
Table 73. Europe Prescription Pharmaceuticals Market Size & Forecast (US$ billion), ByTherapeutic Segments (2013 – 2020) ...................................................................................................74
Table 74. Europe Prescription Pharmaceuticals Market Size & Forecast (US$ billion), ByFormulations (2013 – 2020)..................................................................................................................74
Table 75. Asia Prescription Pharmaceuticals Market Size & Forecast (US$ billion), By Country (2013– 2020) 75
Table 76. Asia Prescription Pharmaceuticals Market Size & Forecast (US$ billion), (2013 – 2020).75
Table 77. Asia Prescription Pharmaceuticals Market Size & Forecast (US$ billion), By TherapeuticSegments (2013 – 2020) .......................................................................................................................76
Table 78. Asia Prescription Pharmaceuticals Market Size & Forecast (US$ billion), By Formulations(2013 – 2020) ........................................................................................................................................76
Table 79. RoW Prescription Pharmaceuticals Market Size & Forecast (US$ billion), By Country,(2013 – 2020) ........................................................................................................................................77
Table 80. RoW Prescription Pharmaceuticals Market Size & Forecast (US$ billion), (2013 – 2020)77
Table 81. RoW Prescription Pharmaceuticals Market Size & Forecast (US$ billion), By TherapeuticSegments (2013 – 2020) .......................................................................................................................78
Table 82. RoW Prescription Pharmaceuticals Market Size & Forecast (US$ billion), By Formulations(2013 – 2020) ........................................................................................................................................78
SAMPLE
14
Table 83. Financial Overview: AstraZeneca plc (U.K.) (Europe) (2013 to 2015)...............................81
Table 84. Revenues of Top-3 Pharmaceutical Products AstraZeneca plc (U.K.) (Europe) (2013 to2015) ...........................................................................................................................................82
Table 85. Financial Overview: Bayer AG (Germany) (Europe) (2013 to 2015) .................................83
Table 86. Revenues of Top-3 Pharmaceutical Products: Bayer AG (Germany) (Europe) (2013 to2015) ...........................................................................................................................................83
Table 87. Financial Overview: Gilead Sciences, Inc. (U.S.) (2013 to 2015) .......................................84
Table 88. Revenues of Top-3 Pharmaceutical Products: Gilead Sciences, Inc. (U.S.) (2013 to 2015) .............................................................................................................................................85
Table 89. Financial Overview: GlaxoSmithKline plc (U.K.) (Europe) (2013 to 2015) ........................85
Table 90. Revenues of Top-3 Pharmaceutical Products: GlaxoSmithKline plc (U.K.) (Europe) (2013to 2015) ...........................................................................................................................................86
Table 91. Financial Overview: Johnson & Johnson (U.S.) (2013 to 2015) ........................................87
Table 92. Revenues of Top-3 Pharmaceutical Products: Johnson & Johnson (U.S.) (2013 to 2015) 88
Table 93. Financial Overview: Merck & Co., Inc. (U.S.) (2013 to 2015)............................................88
Table 94. Revenues of Top-3 Pharmaceutical Products: Merck & Co., Inc. (U.S.) (2013 to 2015) ...89
Table 95. Financial Overview: Novartis AG (Switzerland) (Europe) (2013 to 2015).........................90
Table 96. Revenues of Top-3 Pharmaceutical Products: Novartis AG (Switzerland) (Europe) (2013to 2015) ...........................................................................................................................................91
Table 97. Financial Overview: Pfizer Inc. (U.S.) (2013 to 2015)........................................................91
Table 98. Revenues of Top-3 Pharmaceutical Products: Pfizer Inc. (U.S.) (2013 to 2015) ...............92
Table 99. Financial Overview: F. Hoffmann-La Roche (Switzerland) (Europe) (2013 to 2015) ........93
Table 100. Revenues of Top-3 Pharmaceutical Products: Hoffmann-La Roche (Switzerland)(Europe) (2013 to 2015)........................................................................................................................94
Table 101. Financial Overview: Sanofi S.A. (France) (Europe) (2013 to 2015) ...............................94
Table 102. Revenues of Top-3 Pharmaceutical Products: Sanofi S.A. (France) (Europe) (2013 to2015) .......................................................................................................................................95
Table 103. Acronyms ......................................................................................................................96
SAMPLE

15
List of Figures
Figure 1. Research Methodology .....................................................................................................16
Figure 2. Prescription Pharmaceuticals Market Segmentation .......................................................17
Figure 3. Global Prescription Pharmaceuticals Market Size & Forecast (US$ billion), By TherapeuticSegments (2015) ...................................................................................................................................34
Figure 4. Global Prescription Pharmaceuticals for Cardiovascular Disorders Market Size & Forecast(US$ billion), By Regions (2015 vs. 2020)..............................................................................................36
Figure 5. Global Prescription Pharmaceuticals for Oncology Market Size & Forecast (US$ billion),By Regions (2015 vs. 2020) ...................................................................................................................40
Figure 6. Global Prescription Pharmaceuticals Market Size & Forecast for Inflammatory Conditions(US$ billion), By Regions (2015 vs. 2020)..............................................................................................43
Figure 7. Global Prescription Pharmaceuticals Market Size & Forecast for Metabolic Disorders(US$ billion), By Regions (2015 vs. 2020)..............................................................................................50
Figure 8. Global Prescription Pharmaceuticals Market Size & Forecast for Respiratory Disorders(US$ billion), By Regions (2015 vs. 2020)..............................................................................................53
Figure 9. Global Prescription Pharmaceuticals Market Size & Forecast for Other TherapeuticSegments (US$ billion), By Regions (2015 vs. 2020).............................................................................56
Figure 10. Global Prescription Pharmaceuticals Market Size & Forecast (US$ billion), ByFormulations (2015)..............................................................................................................................59
Figure 11. Global Capsules Market Size & Forecast (US$ billion), By Regions (2015 vs. 2020) ....61
Figure 12. Global Tablets Market Size & Forecast (US$ billion), By Regions (2015 vs. 2020).......62
Figure 13. Global Inhalants and Liquids Market Size & Forecast (US$ billion), By Regions (2015vs. 2020) .......................................................................................................................................64
Figure 14. Global Parenteral Market Size & Forecast (US$ billion), By Regions (2015 vs. 2020) .66
Figure 15. Global Topicals Market Size & Forecast (US$ billion), By Regions (2015 vs. 2020) ......67
Figure 16. Global Prescription Pharmaceuticals Market Size vs. CAGR% (2015 – 2020), By Regions.......................................................................................................................................69
Figure 17. Market Share Analysis...................................................................................................80
Figure 18. Market Positioning of Key Players ................................................................................80
SAMPLE

16
Market Overview
1.1 DefinitionsThe 'Global Prescription Pharmaceuticals Market – Market Size and Forecast (2013–
2020)' report includes market size and forecast estimates for the period 2013 to
2020. The scope of this report is cardiovascular disorders, inflammatory conditions,
metabolic disorders, oncology, respiratory disorders, and other therapeutic
segments. The report segments the market by therapeutic segments, formulations,
and regions. The report includes market size and forecast estimates for all market
segments in the study period. The report has 2015 as the base year, 2013 and 2014
as the historic years, and 2020 as the forecast year.
The therapeutic segments that are included in this report are cardiovascular
disorders, infectious diseases, inflammatory conditions, metabolic disorders,
oncology, respiratory disorders, and other therapeutic segments. The formulation
segments that are included in this report are capsules, inhalants, parenteral, tablets,
and topicals. The regional market segments included in the report are Asia, Europe,
North America, and Rest of the World.
1.2 Research MethodologyThe research methodology for market research reports at ScalarMR includes a
combination of top-down and bottom-up research formats. Continuous market
tracking, rigorous fact-checking, data-triangulation, and multiple layers of quality
control ensure high-quality data that can be leveraged for actionable insights.
ScalarMR’s research methodology starts with extensive secondary, research.
Important secondary sources include SEC filings, annual reports, financial reports,
investor presentations, and technical & industry publications. Secondary research
helps build a comprehensive map of the structure of the market. It helps identify key
players in all market segments and helps build their profiles by identifying their
financials, product portfolios, and growth strategies. It also identifies qualitative
market factors like regulatory scenario, patent estates, and market developments.
Figure 1. Research Methodology
SAMPLE

17
A bottom-up market sizing format is used to arrive at the top-line market size.
Revenues of key market players used to arrive at the market-specific revenues of
each key market player. A process of inward bracketing is used to arrive at the
market-specific revenues for each key market player. The market specific revenues
are combined to arrive at the top-line global market size. Segment-specific and
regional market sizes are estimated through top-down market sizing.
Data synthesis and triangulation techniques are used to develop the market model.
The model represents current consensus market opinion. The market estimates from
the model are used to generate reports that include qualitative and quantitative
insights into the market.
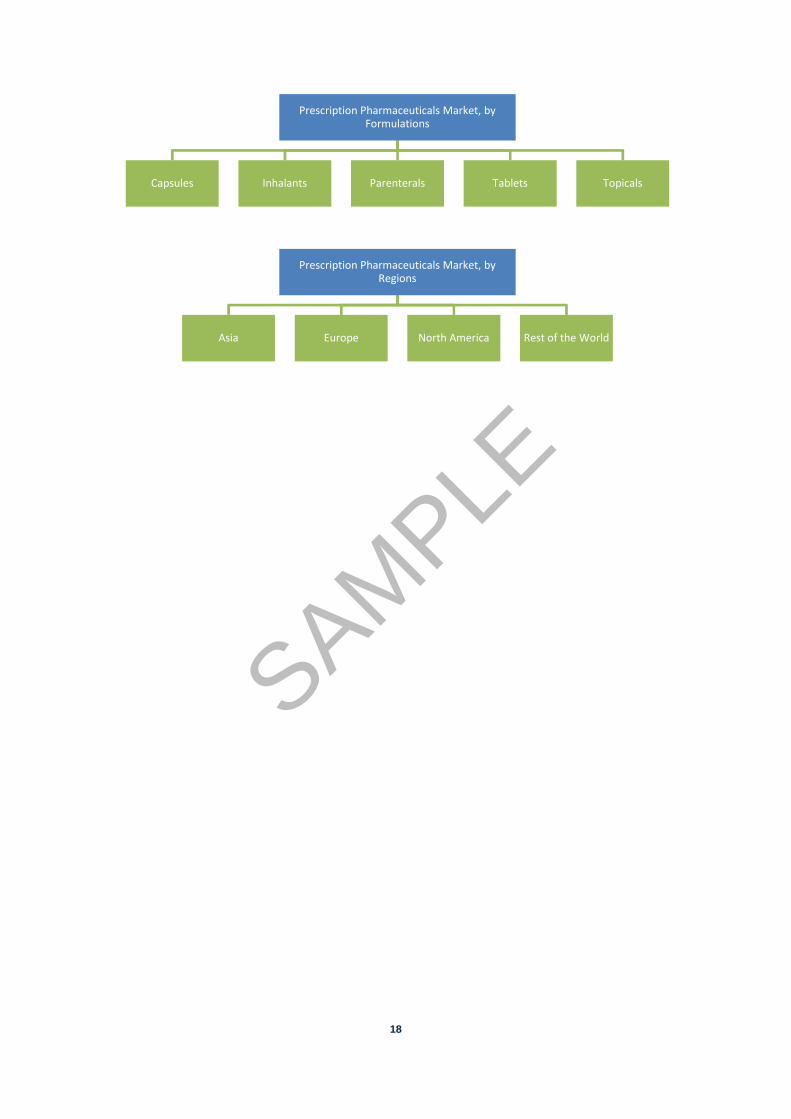
1.3 Market Segmentation
Figure 2. Prescription Pharmaceuticals Market Segmentation
GlobalMarket
Size
Market-specificRevenues of Key Market
Players
Revenues of Key Market Players
Global MarketSize
Segment-specificMarket Size
RegionalMarket
Size
Bottom-up
Top-down
Prescription Pharmaceuticals Market, byTherapeutic Segments
CardiovascularDisorders
InfectiousDiseases
InflammatoryConditions
MetabolicDisorders Oncology Respiratory
DisordersOther
TherapeuticSegments
SAMPLE
18
Prescription Pharmaceuticals Market, byFormulations
Capsules Inhalants Parenterals Tablets Topicals
Prescription Pharmaceuticals Market, byRegions
Asia Europe North America Rest of the World
SAMPLE

19
1 Executive SummaryThe global prescription pharmaceutical market was estimated to be US$ 726.89
billion in 2015. This market is expected to grow at a CAGR of 4.80% in the forecast
period and is expected to be US$ 918.74 billion in 2020. This report segments the
prescription pharmaceuticals market by therapeutic segments, formulations and
regions.
1.1 Global Prescription Pharmaceuticals Market
Table 1. Global Prescription Pharmaceuticals Market
Global Prescription PharmaceuticalsMarket
Market Size (US$ billion) CAGR%(2015 – 2020)2015 2020
Total 726.89 918.74 4.80
Ther
apeu
tic S
egm
ents
Cardiovascular Disorders
Oncology
Inflammatory Conditions
Infectious Diseases
Metabolic Disorders
Respiratory Disorders
Other Therapeutic Segments
Form
ulat
ions
Capsules
Tablets
Inhalants and Liquids
Parenterals
Topicals
Regi
ons
North America
Europe
Asia
RoW
Source: Scalar Market Research Analysis
SAMPLE

20
1.2 Global Prescription Pharmaceuticals Market Size (US$ Billion), ByTherapeutic Segments (2015 vs. 2020)
Table 2. Global Prescription Pharmaceuticals Market Size (US$ Billion), ByTherapeutic Segments (2015 vs. 2020)
Table 3.
Source: Scalar Market Research Analysis
The therapeutic segments of the prescription pharmaceuticals market included in this
report are cardiovascular disorders, oncology, inflammatory conditions, infectious
diseases, metabolic disorders, respiratory disorders, and other therapeutic
segments. Cardiovascular disorders were the largest therapeutic segment in 2015.
This segment was estimated to be US$ XX billion in 2015. On the other hand,
infectious diseases are expected to be the fastest-growing therapeutic segment in
the forecast period. This market segment is expected to grow at a CAGR of XX%
between 2015 and 2020.
129.
05
117.
53
110.
28
95.3
8
83.4
4
36.8
7
154.
34
157.
91
152.
20
138.
36
125.
62
107.
55
44.0
6
193.
03
4.12
5.314.64
5.66 5.21
3.63
4.58
CardiovascularDisorders
Oncology InflammatoryConditions
InfectiousDiseases
MetabolicDisorders
RespiratoryDisorders
Other TherapeuticSegments
CAGR
% (2
015
–20
20)
Mar
ket S
ize (U
SD B
illio
n)
2015 2020 CAGR% (2015 – 2020)
SAMPLE

21
1.3 Global Prescription Pharmaceuticals Market Size (US$ Billion), ByFormulations (2015 vs. 2020)
Table 4. Global Prescription Pharmaceuticals Market Size (US$ Billion), ByFormulations (2015 vs. 2020)
Source: Scalar Market Research Analysis
The formulation segments of the prescription pharmaceuticals market included in this
report are capsules, tablets, inhalants and liquids, parenteral, and topicals. Capsules
were the largest formulation segment in 2015. This segment was estimated to be
US$ XX billion in 2015. It is also expected to be the fastest-growing formulation
segment in the forecast period. This market segment is expected to grow at a CAGR
of XX% between 2015 and 2020.
1.4 Global Prescription Pharmaceuticals Market Size (US$ Billion), ByRegions (2015 vs. 2020)
Table 5. Global Prescription Pharmaceuticals Market Size (US$ Billion), ByRegions (2015 vs. 2020)
269.
45
247.
42
103.
69
71.3
4
34.9
9
356.
16
304.
42
127.
34
89.7
6
41.0
6
5.74
4.23 4.194.70
3.26
Capsules Tablets Inhalants andLiquids
Parenterals Topicals
CAGR
% (2
015
–20
20)
Mar
ket S
ize (U
SD B
illio
n)
2015 2020 CAGR% (2015 – 2020)
295.
77
183.
98
158.
10
89.0
4
364.
41
219.
20
219.
73
115.
40
4.263.57
6.80
5.32
North America Europe Asia RoW
CAGR
% (2
015
–20
20)
Mar
ket S
ize (U
SD B
illio
n)
2015 2020 CAGR% (2015 – 2020)
SAMPLE
22
Source: Scalar Market Research Analysis
The regional segments of the prescription pharmaceuticals market included in this
report are North America, Europe, Asia, and Rest of the World (RoW). North
America was the largest regional segment in 2015. This segment was estimated to
be US$ XX billion in 2015. On the other hand, Asia is expected to be the fastest-
growing regional segment in the forecast period. This market segment is expected to
grow at a CAGR of XX% between 2015 and 2020.
SAMPLE
23
2 Market Overview
2.1 Drivers
2.1.1 Increase in the Ageing Population and Lengthening Life ExpectanciesAccording to the World Health Organization (WHO), in 2010 around 8% of the global
population was aged 65 years and above. In 2015, the elderly population comprised
around 12% of the global population. It has been estimated that by 2050, about 2.1
billion people will be aged above 60 years. The evolution of the population structure
will lead to increased pressure on long-term publicly-funded health, support
programmes for older people. There will be a paradigm shift from acute to chronic
illnesses thereby leading to an increased use of prescription pharmaceuticals.
The rising life expectancy within the older population segment is leading to an
increase in the number and proportion of people at very old ages. People aged 85 or
older constitute around 12% and 6% of world’s 65 and above population in
developed and developing economies respectively. According to Economist
Intelligence Unit (EIU), life expectancy is expected to increase from an estimated
72.7 years in 2013 to 73.7 years by 2018. This will result in a rise in global health
care and life sciences spending.
2.1.2 Rising Affluence in Emerging MarketsGrowing consumer wealth and income levels, increasing government and patient
awareness, and a trend towards healthier lifestyles are anticipated to boost health
care spending to around 8.1% between 2014 and-2018 in Asia. Factors such as
government focus on broader welfare policies and economic expansion will drive the
market for prescription pharmaceuticals. BRICS (Brazil, Russia, India, China, and
South Africa) are among the fastest-growing global economies. According to the
World Economic Forum report, by 2022 around one-third of all global health
expenditure will occur in emerging economies. Increased healthcare spending and
improved access to healthcare in emerging economies will drive the global
prescription pharmaceuticals market.
2.1.3 Widespread Prevalence of Chronic DiseasesChronic diseases namely, heart disease, stroke, cancer, type 2 diabetes, obesity,
and arthritis pose a serious threat to the health of world population. The mortality
SAMPLE

30
formation of the ASEAN Economic Community (AEC) to define the regulatory
landscape for this region.
Thus, across the globe, a strong trend is being observed towards consolidation of
legislature systems into a global drug safety system with balanced business
processes.
3.3 Macroeconomic Indicators
3.3.1 Healthcare Spending (US$ Billion), by Regions (2005 to 2014)Table 6. Healthcare Spending (US$ Billion), by Regions (2005 to 2014)
Regions 2005 2006 2007 2008 2009 2010 2011 2012 2013 2014 CAGR%(2005–2014)
Asia
Europe
North America
Rest of the World
Total
Source: World Bank and Scalar Market Research Analysis
3.3.2 Per Capita Healthcare Spending (US$), by Regions (2005 to 2014)Table 7. Per Capita Healthcare Spending (US$), by Regions (2005 to 2014)
Regions 2005 2006 2007 2008 2009 2010 2011 2012 2013 2014 CAGR%(2005–2014)
Asia
Europe
North America
Rest of the World
Total
Source: World Bank and Scalar Market Research Analysis
3.3.3 Public Healthcare Spending (US$ Billion), by Regions (2005 to 2014)Table 8. Public Healthcare Spending (US$ Billion), by Regions (2005 to 2014)
SAMPLE
31
Regions 2005 2006 2007 2008 2009 2010 2011 2012 2013 2014 CAGR%(2005–2014)
Asia
Europe
North America
Rest of the World
Total
Source: World Bank and Scalar Market Research Analysis
3.4 Ecosystem Analysis
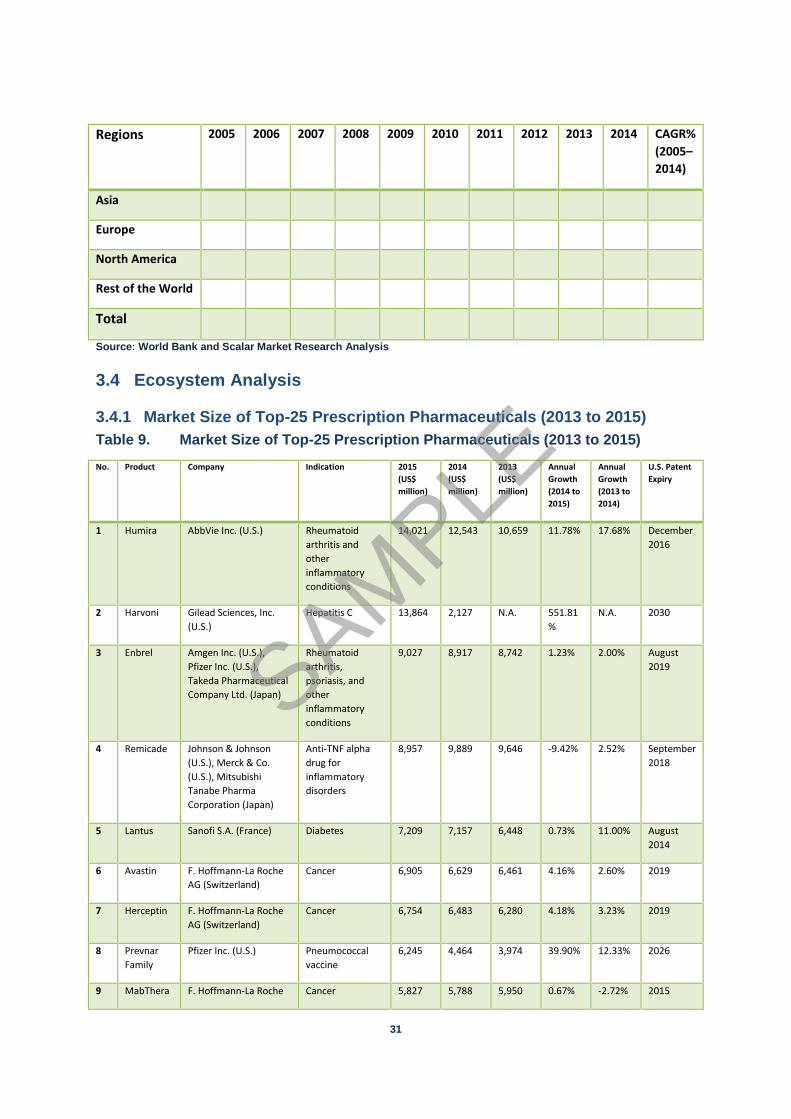
3.4.1 Market Size of Top-25 Prescription Pharmaceuticals (2013 to 2015)Table 9. Market Size of Top-25 Prescription Pharmaceuticals (2013 to 2015)No. Product Company Indication 2015
(US$million)
2014(US$million)
2013(US$million)
AnnualGrowth(2014 to2015)
AnnualGrowth(2013 to2014)
U.S. PatentExpiry
1 Humira AbbVie Inc. (U.S.) Rheumatoidarthritis andotherinflammatoryconditions
14,021 12,543 10,659 11.78% 17.68% December2016
2 Harvoni Gilead Sciences, Inc.(U.S.)
Hepatitis C 13,864 2,127 N.A. 551.81%
N.A. 2030
3 Enbrel Amgen Inc. (U.S.),Pfizer Inc. (U.S.),Takeda PharmaceuticalCompany Ltd. (Japan)
Rheumatoidarthritis,psoriasis, andotherinflammatoryconditions
9,027 8,917 8,742 1.23% 2.00% August2019
4 Remicade Johnson & Johnson(U.S.), Merck & Co.(U.S.), MitsubishiTanabe PharmaCorporation (Japan)
Anti-TNF alphadrug forinflammatorydisorders
8,957 9,889 9,646 -9.42% 2.52% September2018
5 Lantus Sanofi S.A. (France) Diabetes 7,209 7,157 6,448 0.73% 11.00% August2014
6 Avastin F. Hoffmann-La RocheAG (Switzerland)
Cancer 6,905 6,629 6,461 4.16% 2.60% 2019
7 Herceptin F. Hoffmann-La RocheAG (Switzerland)
Cancer 6,754 6,483 6,280 4.18% 3.23% 2019
8 PrevnarFamily
Pfizer Inc. (U.S.) Pneumococcalvaccine
6,245 4,464 3,974 39.90% 12.33% 2026
9 MabThera F. Hoffmann-La Roche Cancer 5,827 5,788 5,950 0.67% -2.72% 2015
SAMPLE
34
4 Prescription Pharmaceuticals Markets, by TherapeuticSegments
4.1 IntroductionThe therapeutic segments of the prescription pharmaceuticals market included in this
report are cardiovascular disorders, oncology, inflammatory conditions, infectious
diseases, metabolic disorders, respiratory disorders, and other therapeutic
segments. Cardiovascular disorders were the largest therapeutic segment in 2015,
while infectious diseases are expected to be the fastest-growing therapeutic
segment in the forecast period.
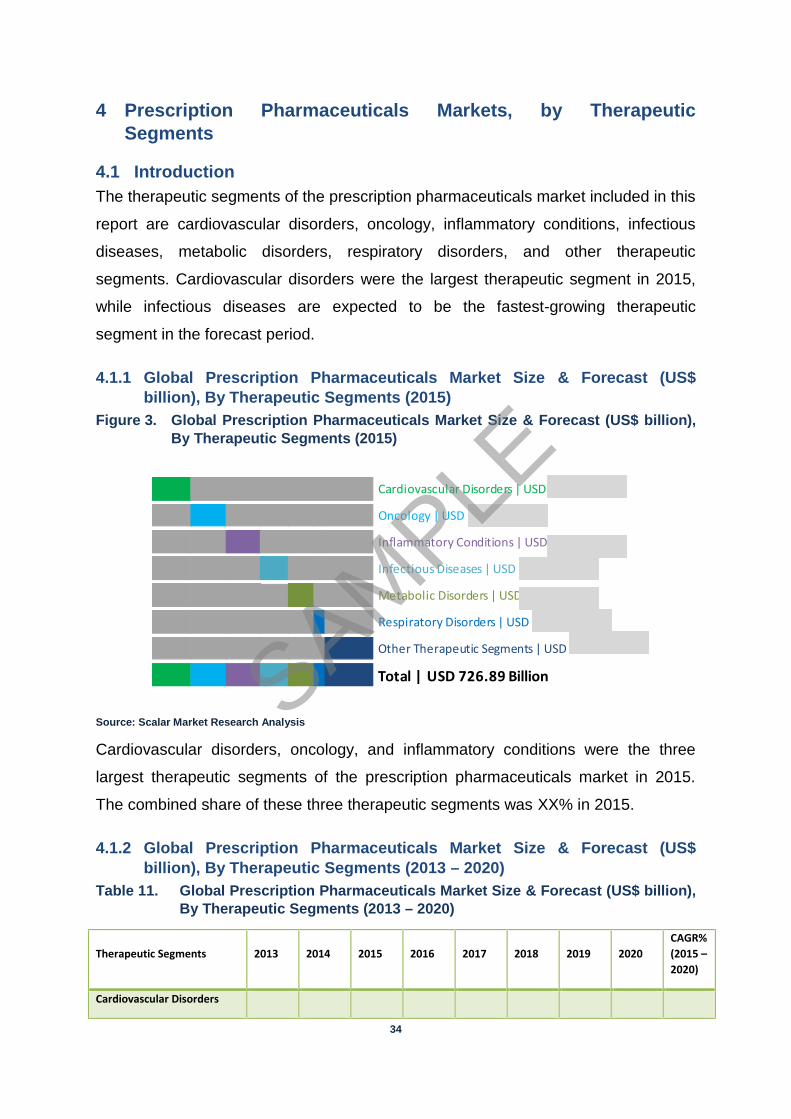
4.1.1 Global Prescription Pharmaceuticals Market Size & Forecast (US$billion), By Therapeutic Segments (2015)
Figure 3. Global Prescription Pharmaceuticals Market Size & Forecast (US$ billion),By Therapeutic Segments (2015)
Source: Scalar Market Research Analysis
Cardiovascular disorders, oncology, and inflammatory conditions were the three
largest therapeutic segments of the prescription pharmaceuticals market in 2015.
The combined share of these three therapeutic segments was XX% in 2015.
4.1.2 Global Prescription Pharmaceuticals Market Size & Forecast (US$billion), By Therapeutic Segments (2013 – 2020)
Table 11. Global Prescription Pharmaceuticals Market Size & Forecast (US$ billion),By Therapeutic Segments (2013 – 2020)
Therapeutic Segments 2013 2014 2015 2016 2017 2018 2019 2020CAGR%(2015 –2020)
Cardiovascular Disorders
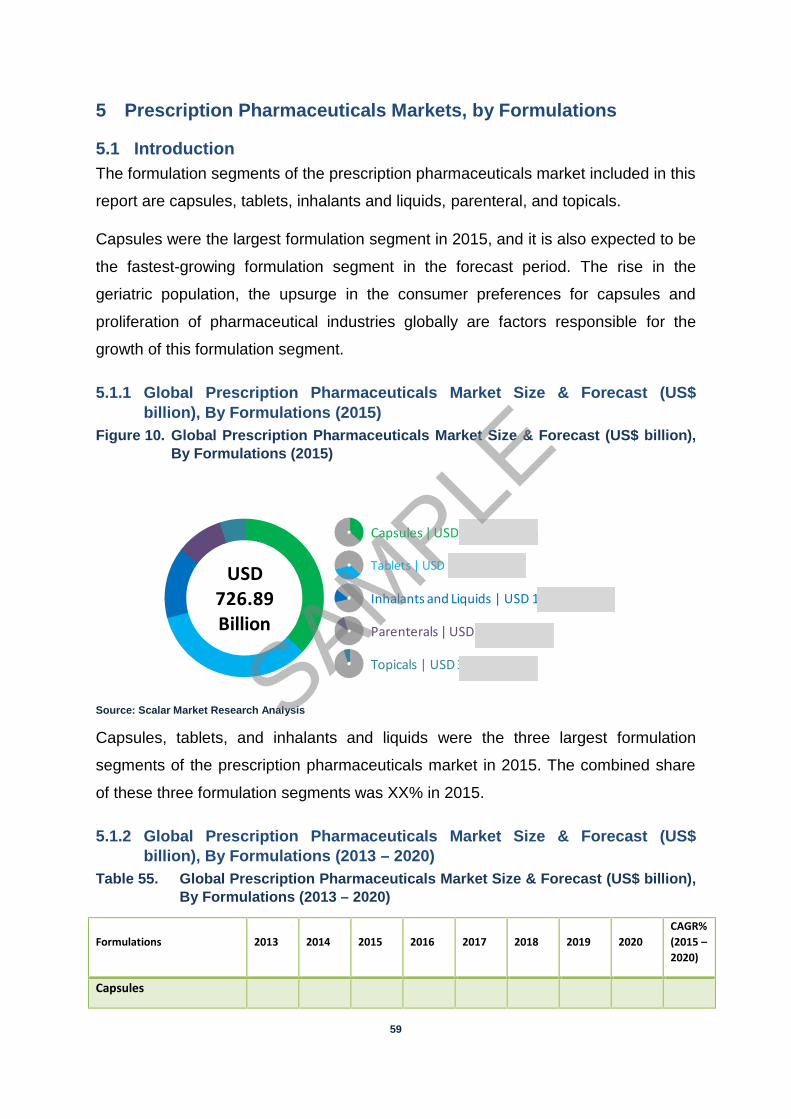
Cardiovascular Disorders | USD 129.05 Billion
Total | USD 726.89 Billion
Oncology | USD 117.53 Billion
Inflammatory Conditions | USD 110.28 Billion
Infectious Diseases | USD 95.38 Billion
Metabolic Disorders | USD 83.44 Billion
Respiratory Disorders | USD 36.87 Billion
Other Therapeutic Segments | USD 154.34 Billion
SAMPLE

35
Oncology
Inflammatory Conditions
Infectious Diseases
Metabolic Disorders
Respiratory Disorders
Other Therapeutic Segments
Total
Source: Scalar Market Research Analysis
Cardiovascular disorders were the largest therapeutic segment of the prescription
pharmaceuticals market in 2015. This market segment is expected to grow at a
CAGR of XX% from US$ XX billion in 2015 to US$ XX billion in 2020.
According to 2015 American Heart Association statistics, cardiovascular disorders
account for 17.3 million deaths per year and is expected to grow to over 23.6 million
deaths by 2030. In the year 2011, around 787,000 people in the U.S. died from
stroke, heart disease and other cardiovascular diseases in 2011. The cardiovascular
disorders tend to account for more deaths in comparison to all forms of cancer
combined.
4.2 Cardiovascular DisordersCardiovascular disorder was the largest therapeutic segments in 2015. This segment
includes a wide range of disease categories including hypertension, dyslipidemia,
stroke, atherosclerosis, thrombosis, and coronary artery disease. According to World
Heart Federation, the risk factors for cardiovascular disorders include unchangeable
factors such as age, sex, and heredity, and changeable factors like diet, obesity,
tobacco consumption, stress, and physical inactivity. The rate of cardiovascular
disorders is high in developed and rapidly increasing in developing countries dues to
changes in lifestyle and nutrition.
SAMPLE

36
4.2.1 Global Prescription Pharmaceuticals Market Size & Forecast (US$billion), By Cardiovascular Disorders, (2013 – 2020)
Table 12. Global Prescription Pharmaceuticals Market Size & Forecast (US$ billion),By Cardiovascular Disorders, (2013 – 2020)
2013 2014 2015 2016 2017 2018 2019 2020 CAGR%(2015 –2020)
Market Size (US$ Billion)
Annual Growth Rate (%)
Source: Scalar Market Research Analysis
The global prescription pharmaceuticals for cardiovascular disorders market grew
from US$ XX billion in 2013 to US$ XX billion in 2015. This market is expected to
grow at an annual growth rate of between XX% and XX% in the forecast period. It is
expected to have a CAGR of XX% between 2015 and 2020.
4.2.2 Global Prescription Pharmaceuticals for Cardiovascular DisordersMarket Size & Forecast (US$ billion), By Regions (2015 vs. 2020)
Figure 4. Global Prescription Pharmaceuticals for Cardiovascular Disorders MarketSize & Forecast (US$ billion), By Regions (2015 vs. 2020)
Source: Scalar Market Research Analysis
Asia is expected to be the fastest-growing regional segment of the prescription
pharmaceuticals for cardiovascular disorders market in the forecast period. This
market segment is estimated to grow at a CAGR of XX% from US$ XX billion in 2015
to US$ XX billion in 2020.
The prevalence of cardiovascular risk factors like high cholesterol, hypertension,
obesity, and diabetes have been on a rise in the rise in Asia, particularly Japan.
53.8
6
32.9
3
26.9
8
15.2
7
64.3
1
38.0
2
36.3
6
19.2
1
3.612.92
6.15
4.69
North America Europe Asia RoW
CAGR
% (2
015
–20
20)
Mar
ket S
ize (U
SD B
illio
n)
2015 2020 CAGR% (2015 – 2020)
SAMPLE
37
According to the American Heart Association, in Asia, around 21.0% have
hypertension, 3.7% have CHD, 6.1% have heart disease, and 1.9% has had a
stroke. According to WHO, over 80% of all deaths occur due to cardiovascular
disorders in developing countries.
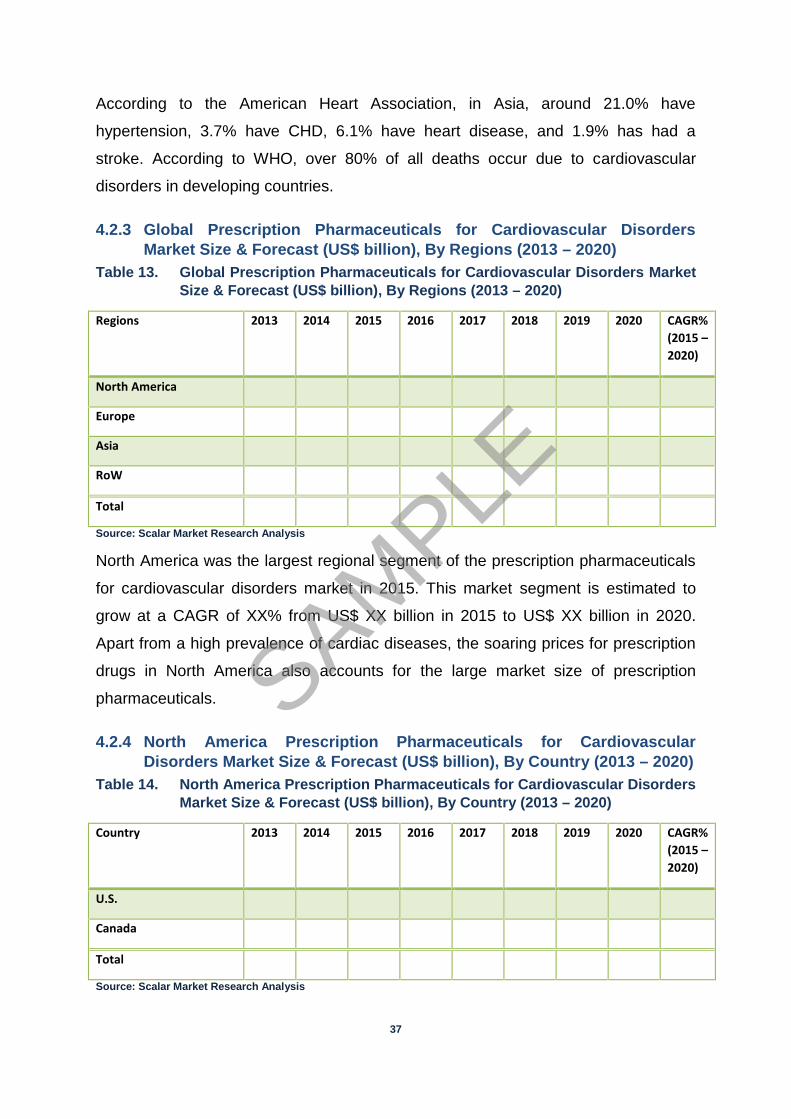
4.2.3 Global Prescription Pharmaceuticals for Cardiovascular DisordersMarket Size & Forecast (US$ billion), By Regions (2013 – 2020)
Table 13. Global Prescription Pharmaceuticals for Cardiovascular Disorders MarketSize & Forecast (US$ billion), By Regions (2013 – 2020)
Regions 2013 2014 2015 2016 2017 2018 2019 2020 CAGR%(2015 –2020)
North America
Europe
Asia
RoW
Total
Source: Scalar Market Research Analysis
North America was the largest regional segment of the prescription pharmaceuticals
for cardiovascular disorders market in 2015. This market segment is estimated to
grow at a CAGR of XX% from US$ XX billion in 2015 to US$ XX billion in 2020.
Apart from a high prevalence of cardiac diseases, the soaring prices for prescription
drugs in North America also accounts for the large market size of prescription
pharmaceuticals.
4.2.4 North America Prescription Pharmaceuticals for CardiovascularDisorders Market Size & Forecast (US$ billion), By Country (2013 – 2020)
Table 14. North America Prescription Pharmaceuticals for Cardiovascular DisordersMarket Size & Forecast (US$ billion), By Country (2013 – 2020)
Country 2013 2014 2015 2016 2017 2018 2019 2020 CAGR%(2015 –2020)
U.S.
Canada
Total
Source: Scalar Market Research Analysis
SAMPLE

38
4.2.5 Europe Prescription Pharmaceuticals for Cardiovascular DisordersMarket Size & Forecast (US$ billion), By Country (2013 – 2020)
Table 15. Europe Prescription Pharmaceuticals for Cardiovascular DisordersMarket Size & Forecast (US$ billion), By Country (2013 – 2020)
Country 2013 2014 2015 2016 2017 2018 2019 2020 CAGR%(2015 –2020)
France
Germany
U.K.
Rest of Europe
Total
Source: Scalar Market Research Analysis
4.2.6 Asia Prescription Pharmaceuticals for Cardiovascular Disorders MarketSize (US$ Billion) & Forecast (US$ billion), By Country (2013 – 2020)
Table 16. Asia Prescription Pharmaceuticals for Cardiovascular Disorders MarketSize (US$ Billion) for Asia, By Country (2013 – 2020)
Country 2013 2014 2015 2016 2017 2018 2019 2020 CAGR%(2015 –2020)
China
Japan
India
Rest of Asia
Total
Source: Scalar Market Research Analysis
4.2.7 Rest of the World (RoW) Prescription Pharmaceuticals forCardiovascular Disorders Market Size & Forecast (US$ billion), ByCountry (2013 – 2020)
Table 17. Rest of the World (RoW) Prescription Pharmaceuticals for CardiovascularDisorders Market Size & Forecast (US$ billion), By Country (2013 – 2020)
Country 2013 2014 2015 2016 2017 2018 2019 2020 CAGR%(2015 –2020)
Latin America
Middle East and Africa
SAMPLE

39
Total
Source: Scalar Market Research Analysis
4.3 OncologyAccording to National Cancer Institute (U.S.), about 1.6 million new cases of cancer
will be diagnosed, and about 0.6 million people will die from the disease in the year
2016. According to a study carried out by the National Cancer Institute (U.S.)
between 2008 and 2012, the incidence of cancer cases was 454.8 per 100,000
people per year. Furthermore, the number of deaths due to cancer death was 171.2
per 100,000 individuals per year. Cancer mortality was observed to be higher among
men than women (207.9 per 100,000 men and 145.4 per 100,000 for women).
Approximately 39.6 % of men & women will be diagnosed with cancer at some point
during their lifetimes. The national expenditure on cancer in the U.S. was US$ 125
billion in 2010 and could reach US$ 156 billion by 2020.
4.3.1 Global Prescription Pharmaceuticals Market Size & Forecast (US$billion), By Oncology (2013 – 2020)
Table 18. Global Prescription Pharmaceuticals Market Size & Forecast (US$ billion),By Oncology (2013 – 2020)
2013 2014 2015 2016 2017 2018 2019 2020 CAGR%(2015 –2020)
Market Size (US$ Billion)
Annual Growth Rate (%)
Source: Scalar Market Research Analysis
The global prescription pharmaceuticals for oncology market grew from US$ XX
billion in 2013 to US$ XX billion in 2015. This market is expected to grow at an
annual growth rate of between XX% and XX% in the forecast period. It is expected to
have a CAGR of XX% between 2015 and 2020.
SAMPLE
59
5 Prescription Pharmaceuticals Markets, by Formulations
5.1 IntroductionThe formulation segments of the prescription pharmaceuticals market included in this
report are capsules, tablets, inhalants and liquids, parenteral, and topicals.
Capsules were the largest formulation segment in 2015, and it is also expected to be
the fastest-growing formulation segment in the forecast period. The rise in the
geriatric population, the upsurge in the consumer preferences for capsules and
proliferation of pharmaceutical industries globally are factors responsible for the
growth of this formulation segment.
5.1.1 Global Prescription Pharmaceuticals Market Size & Forecast (US$billion), By Formulations (2015)
Figure 10. Global Prescription Pharmaceuticals Market Size & Forecast (US$ billion),By Formulations (2015)
Source: Scalar Market Research Analysis
Capsules, tablets, and inhalants and liquids were the three largest formulation
segments of the prescription pharmaceuticals market in 2015. The combined share
of these three formulation segments was XX% in 2015.
5.1.2 Global Prescription Pharmaceuticals Market Size & Forecast (US$billion), By Formulations (2013 – 2020)
Table 55. Global Prescription Pharmaceuticals Market Size & Forecast (US$ billion),By Formulations (2013 – 2020)
Formulations 2013 2014 2015 2016 2017 2018 2019 2020CAGR%(2015 –2020)
Capsules
USD726.89Billion
Capsules | USD 269.45 Billion
Tablets | USD 247.42 Billion
Inhalants and Liquids | USD 103.69 Billion
Parenterals | USD 71.34 Billion
Topicals | USD 34.99 BillionSAMPLE

60
Tablets
Inhalants and Liquids
Parenterals
Topicals
Total
Source: Scalar Market Research Analysis
Capsules were the largest formulation segment of the prescription pharmaceuticals
market in 2015. This market segment is expected to grow at a CAGR of XX% from
US$ XX billion in 2015 to US$ XX billion in 2020.
Technological advancements are resulting in capsule dosing for dry powder inhalers,
vegetarian capsules or non-gelatin capsules, solid lipid pellet capsules and capsule-
in-capsule for sustained release effect, is expected to result in the growth of this
market.
5.2 CapsulesCapsules are solid dosage form and the drugs that are enclosed in a hard or soft
soluble container. The container is usually of a derivative of gelatine. This dosage
form is used by manufacturers when the drug cannot be compacted into a solid
tablet. Drugs administered in capsules forms are used for the treatment of
gastrointestinal diseases, neurological diseases, oncology, infectious diseases,
cardiovascular diseases, haematological diseases, and inflammatory diseases.
5.2.1 Global Capsules Market Size & Forecast (US$ billion) (2013 – 2020)Table 56. Global Capsules Market Size & Forecast (US$ billion) (2013 – 2020)
2013 2014 2015 2016 2017 2018 2019 2020 CAGR%(2015 –2020)
Market Size (US$ Billion)
Annual Growth Rate (%)
Source: Scalar Market Research Analysis
The global capsules market grew from US$ XX billion in 2013 to US$ XX billion in
2015. This market is expected to grow at an annual growth rate of between XX% and
XX% in the forecast period. It is expected to have a CAGR of XX% between 2015
and 2020.
SAMPLE

61
5.2.2 Global Capsules Market Size & Forecast (US$ billion), By Regions (2015vs. 2020)
Figure 11. Global Capsules Market Size & Forecast (US$ billion), By Regions (2015vs. 2020)
Source: Scalar Market Research Analysis
Asia is expected to be the fastest-growing regional segment of the capsules market
in the forecast period. This market segment is expected to grow at a CAGR of XX%
from US$ XX billion in 2015 to US$ XX billion in 2020. Owing to rise in health
awareness, affordability of healthcare services, and the growing number of
pharmaceutical industries, the Asia capsules market is expected to grow at a high
CAGR during the forecast period.
5.2.3 Global Capsules Market Size & Forecast (US$ billion), By Regions (2013– 2020)
Table 57. Global Capsules Market Size & Forecast (US$ billion), By Regions (2013 –2020)
Regions 2013 2014 2015 2016 2017 2018 2019 2020 CAGR%(2015 –2020)
North America
Europe
Asia
RoW
Total
Source: Scalar Market Research Analysis
103.
82
68.0
5
62.3
4
35.2
4
133.
71
84.6
1
90.2
8
47.5
7
5.194.45
7.69
6.18
North America Europe Asia RoW
CAGR
% (2
015
–20
20)
Mar
ket S
ize (U
SD B
illio
n)
2015 2020 CAGR% (2015 – 2020)
SAMPLE

69
6 Geographic Analysis
6.1 IntroductionThe regional segments of the prescription pharmaceuticals market included in this report are NorthAmerica, Europe, Asia, and Rest of the World (RoW). North America was the largest regionalsegment in 2015, while Asia is expected to be the fastest-growing regional segment in the forecastperiod.
6.1.1 Global Prescription Pharmaceuticals Market Size vs. CAGR% (2015 –2020), By Regions
Figure 16. Global Prescription Pharmaceuticals Market Size vs. CAGR% (2015 – 2020),By Regions
Source: Scalar Market Research Analysis
North America was the largest regional segments of the prescription
pharmaceuticals market in 2015. The market had a XX% share of the global market
in 2015.
6.1.2 Global Prescription Pharmaceuticals Market Size & Forecast (US$billion), By Regions (2013 – 2020)
Table 66. Global Prescription Pharmaceuticals Market Size & Forecast (US$ billion),By Regions (2013 – 2020)
Regions 2013 2014 2015 2016 2017 2018 2019 2020 CAGR%(2015 –2020)
North America
Europe
North America(2015)
Europe(2015)
Asia(2015)
RoW(2015) North America
(2020)
Europe(2020)
Asia(2020)
RoW(2020)
3
4
5
6
7
8
0 50 100 150 200 250 300 350 400
CAGR
% (2
015
–20
20)
Market Size (USD Billion)
SAMPLE

70
Asia
RoW
Total
Source: Scalar Market Research Analysis
North America was the largest regional segment of the prescription pharmaceuticals
market in 2015. This market segment is expected to increase at a CAGR of XX%
from US$ XX billion in 2015 to US$ XX billion in 2020.
6.2 North AmericaNorth America accounted for the largest share of the global prescription
pharmaceuticals market with US$ XX billion in 2015. Factors such as technological
advancements, rising incidences of chronic diseases, and positive government
initiatives are considered as the major driving factor for the growth of prescription
pharmaceuticals market in North America.
6.2.1 North America Prescription Pharmaceuticals Market Size & Forecast(US$ billion), By Country (2013 – 2020)
Table 67. North America Prescription Pharmaceuticals Market Size & Forecast (US$billion), By Country (2013 – 2020)
Country 2013 2014 2015 2016 2017 2018 2019 2020 CAGR%(2015 –2020)
U.S.
Canada
Total
Source: Scalar Market Research Analysis
6.2.2 North America Prescription Pharmaceuticals Market Size & Forecast(US$ billion), (2013 – 2020)
Table 68. North America Prescription Pharmaceuticals Market Size & Forecast (US$billion), (2013 – 2020)
2013 2014 2015 2016 2017 2018 2019 2020 CAGR%(2015 –2020)
Market Size (US$ Billion)
Annual Growth Rate (%)
Source: Scalar Market Research Analysis
SAMPLE
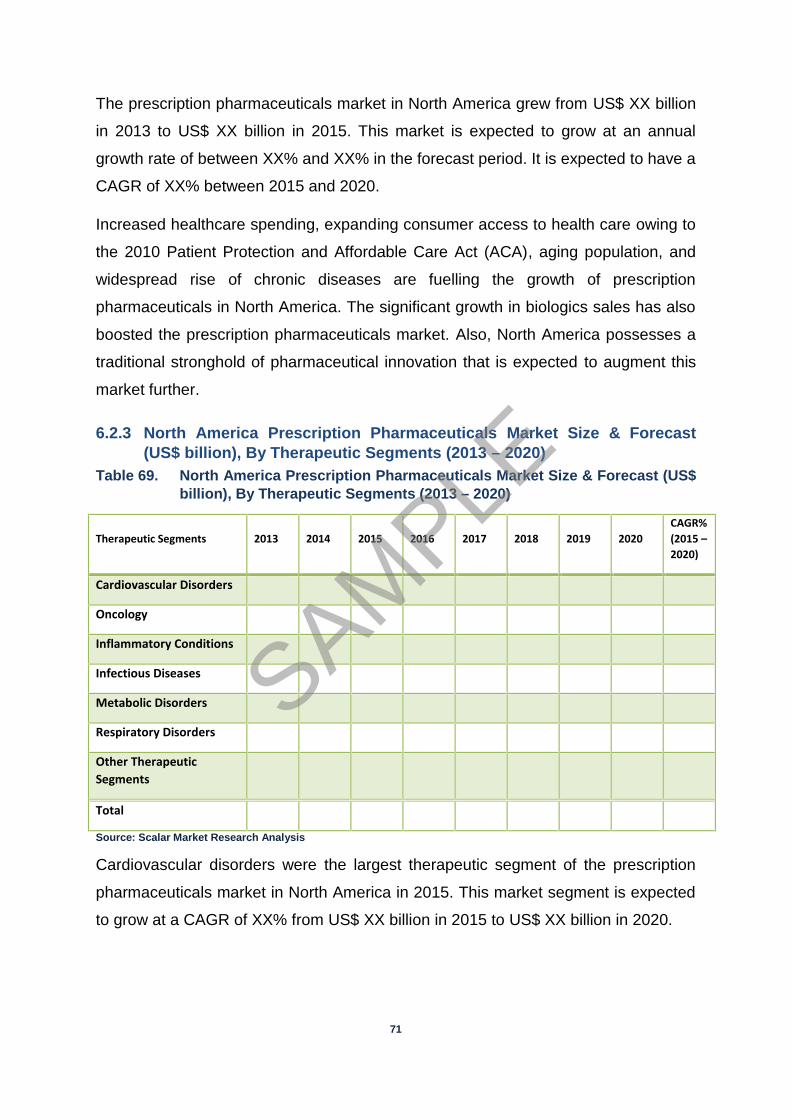
71
The prescription pharmaceuticals market in North America grew from US$ XX billion
in 2013 to US$ XX billion in 2015. This market is expected to grow at an annual
growth rate of between XX% and XX% in the forecast period. It is expected to have a
CAGR of XX% between 2015 and 2020.
Increased healthcare spending, expanding consumer access to health care owing to
the 2010 Patient Protection and Affordable Care Act (ACA), aging population, and
widespread rise of chronic diseases are fuelling the growth of prescription
pharmaceuticals in North America. The significant growth in biologics sales has also
boosted the prescription pharmaceuticals market. Also, North America possesses a
traditional stronghold of pharmaceutical innovation that is expected to augment this
market further.
6.2.3 North America Prescription Pharmaceuticals Market Size & Forecast(US$ billion), By Therapeutic Segments (2013 – 2020)
Table 69. North America Prescription Pharmaceuticals Market Size & Forecast (US$billion), By Therapeutic Segments (2013 – 2020)
Therapeutic Segments 2013 2014 2015 2016 2017 2018 2019 2020CAGR%(2015 –2020)
Cardiovascular Disorders
Oncology
Inflammatory Conditions
Infectious Diseases
Metabolic Disorders
Respiratory Disorders
Other TherapeuticSegments
Total
Source: Scalar Market Research Analysis
Cardiovascular disorders were the largest therapeutic segment of the prescription
pharmaceuticals market in North America in 2015. This market segment is expected
to grow at a CAGR of XX% from US$ XX billion in 2015 to US$ XX billion in 2020.
SAMPLE

72
6.2.4 North America Prescription Pharmaceuticals Market Size & Forecast(US$ billion), By Formulations (2013 – 2020)
Table 70. North America Prescription Pharmaceuticals Market Size & Forecast (US$billion), By Formulations (2013 – 2020)
Formulations 2013 2014 2015 2016 2017 2018 2019 2020CAGR%(2015 –2020)
Capsules
Tablets
Inhalants and Liquids
Parenterals
Topicals
Total
Source: Scalar Market Research Analysis
Capsules were the largest formulation segment of the prescription pharmaceuticals
market in North America in 2015. This market segment is expected to grow at a
CAGR of XX% from US$ XX billion in 2015 to US$ 133.71 billion in 2020.
SAMPLE

80
7 Competitive Landscape
7.1 Market Share AnalysisThe market share analysis studies the market share of the leading players operating in theprescription pharmaceuticals market. This market share analysis exclusively focused on prescriptionpharmaceuticals products and is estimated based on considering the global pharmaceutical productsmarket revenue for the year 2015. The value percentage for each company is based on the analysisof company’s investor presentations, annual reports, press releases, product offering particular toprescription pharmaceuticals segment and opinion of primary respondents. The below market sharediagram represents the revenue regarding value percentage for 2015 for each leading playersoperating in this market.
Figure 17. Market Share Analysis
Source: Scalar Market Research Analysis
7.2 Market Positioning of Key PlayersThe figure below represents the top-10 companies based on the criteria's: annual revenue,
combined total revenue of top-3 drug products, annual growth, and R&D investment.
Figure 18. Market Positioning of Key Players
4.1%5.2%5.0%
6.0%2.0%4.8%
3.8%
4.7%3.2%
3.0%
58.2%
Johnson & Johnson
Roche
Pfizer
Novartis AG
Bayer AG
Merck & Co., Inc.
GlaxoSmithKline Plc
Sanofi
Gilead Sciences
Astrazeneca
Others
SAMPLE

96
9 SCALAR 360 DEGREE MARKET REVIEWThe usage of prescription drugs over the years is set to increase across the globe. Nearly half of thisvolume growth is expected to occur in emerging markets, with India, China, Brazil and Indonesiadriving the spike in demand. In the developed markets, the volume of medicine use will remainstable. However, there will be an inclination towards the use of branded products as the use ofbiologics, or specialty medicines become more prevalent. The generic drugs, over the counter (OTC)products and imitative branded products, will fare better in the pharmerging markets and accountfor around 88% of total medicine use by 2020. The innovative specialty medicines have low adoptionrates in these countries.
Over the forecast period, a large number of innovative medicines is set to emerge from R&Dpipelines with products being focused on cancer, hepatitis C, autoimmune disorders, heart diseaseand some rare diseases. Owing to the presence of unparalleled treatment options, availability ofcheap drugs and increased use of evidence for decision making, stakeholders across the globe areset to obtain a higher return for their medicine investment than before.
The rapid development of technology will lead to changes in the treatment protocols, increase thepatient accountability and engagement, and accelerate the rate of adoption of behavioral changesthereby improving patient adherence to treatments. Patients suffering from multiple chronicdisorders can use wearables, mobile apps and other technologies to interact with providers andmanage their health.
The healthcare spending levels in developed markets will increase owing to branded drugs whereasgenerics will drive the spending levels in pharmerging markets. However, owing to the patentexpiries, around $150 billion would be saved on branded products, while over $30-40 billion wouldbe saved on biologics as biosimilars become widely adopted. Also, a large number of drugs focusedon chronic, rare or genetic diseases are expected to be launched thereby rendering significantclinical value.
Thus, the market is undergoing an evolution with traditional bigwigs, such as U.S and Europe,flipping over, and emerging markets giving rise to new potential markets. The healthcare investorsalso require rethinking a strategy by keeping an eagle eye on the emerging markets. They need tomake sure that they are not left behind owing to their low understanding of the true engines forgrowth.
10 Appendix
10.1 AcronymsTable 103. Acronyms
OTC Over the Counter
U.S. United States
GIP Global Innovative Pharma
GEP Global Established Pharma
VOC Vaccines, Oncology and Consumer Healthcare
R&D Research and Development
SAMPLE
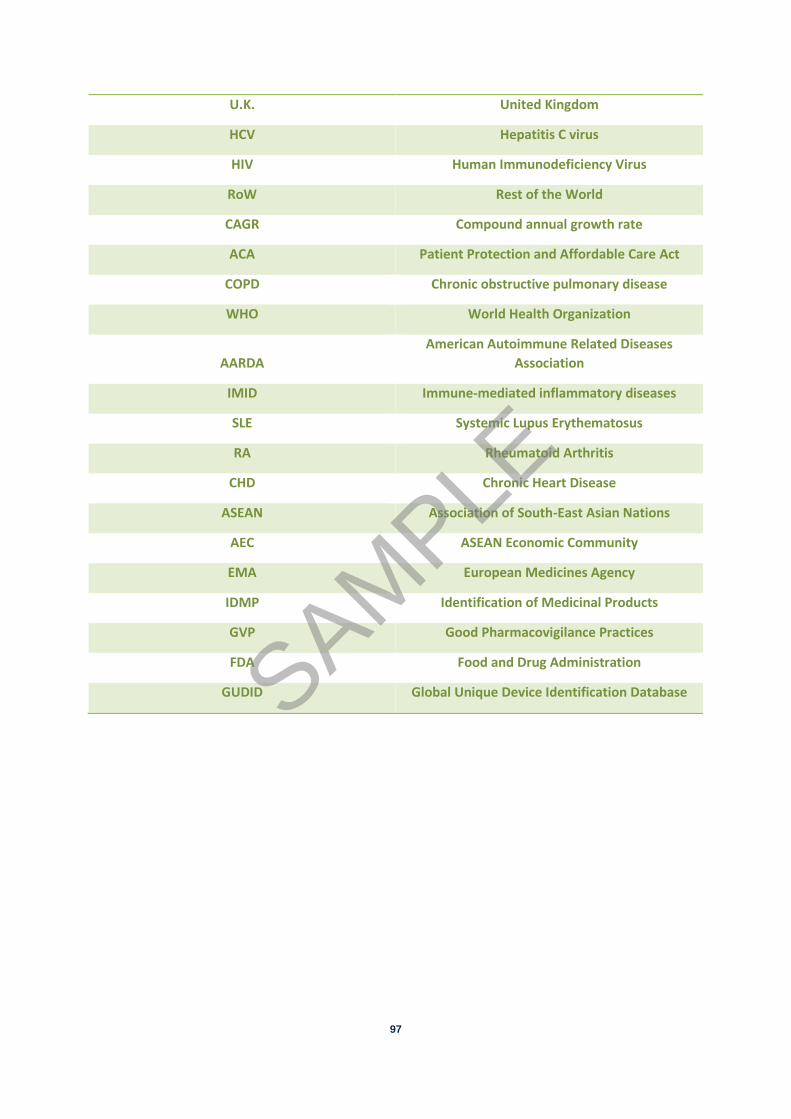
97
U.K. United Kingdom
HCV Hepatitis C virus
HIV Human Immunodeficiency Virus
RoW Rest of the World
CAGR Compound annual growth rate
ACA Patient Protection and Affordable Care Act
COPD Chronic obstructive pulmonary disease
WHO World Health Organization
AARDAAmerican Autoimmune Related Diseases
Association
IMID Immune-mediated inflammatory diseases
SLE Systemic Lupus Erythematosus
RA Rheumatoid Arthritis
CHD Chronic Heart Disease
ASEAN Association of South-East Asian Nations
AEC ASEAN Economic Community
EMA European Medicines Agency
IDMP Identification of Medicinal Products
GVP Good Pharmacovigilance Practices
FDA Food and Drug Administration
GUDID Global Unique Device Identification DatabaseSAMPLE