Prescription For Anaemic Conditions
164
S i n g a p o r e S t r a t e g y January 2014 Prescription For Anaemic Conditions M a l a y s i a S t r a t e g y July 2018 PP14218/11/2012(031278) Refer to last page for important disclosures. July 2018 E&E
Transcript of Prescription For Anaemic Conditions

S i n g a p o r e S t r a t e g y January 2014
Prescription For Anaemic Conditions
M a l a y s i a S t r a t e g y July 2018
PP14218 /11 / 2012(031278 )
Refer to last page for important disclosures.
Ju ly 2018
E&E

M a l a y s i a S t r a t e g y July 2018
Contents Executive Summary .......................................................................................................................... 1
Prescription For Anaemic Conditions
- 1H18 Review .................................................................................................................................... 2
- 2H18 Outlook ................................................................................................................................... 4
Earnings Outlook............................................................................................................................... 9
Strategy ............................................................................................................................................ 11
Investment Themes ......................................................................................................................... 13
Top Picks.......................................................................................................................................... 16
Sector Review
- Automobile : MARKET WEIGHT.................................................................................................... 18
- Banking : MARKET WEIGHT........................................................................................................ .25
- Building Materials : MARKET WEIGHT ........................................................................................ .41
- Construction : MARKET WEIGHT.................................................................................................. 48
- Consumer : MARKET WEIGHT ..................................................................................................... 53
- Gaming : OVERWEIGHT ............................................................................................................... 62
- Glove Manufacturing : UNDERWEIGHT........................................................................................ 72
- Media : MARKET WEIGHT ............................................................................................................ 79
- Oil & Gas : MARKET WEIGHT ...................................................................................................... 85
- Plantation : MARKET WEIGHT ..................................................................................................... 91
- Property – Developers & REITs : MARKET WEIGHT ................................................................... 99
- Technology : OVERWEIGHT ...................................................................................................... 107
- Telecommunications : MARKET WEIGHT .................................................................................. 117
- Utilities : OVERWEIGHT .............................................................................................................. 123
Top Stocks
- Bumi Armada (BUY/RM0.71/Target: RM1.06)............................................................................ 130
- Genting Malaysia (BUY/RM4.85/Target: RM6.28)...................................................................... 132
- Inari Amertron (BUY/RM2.25/Target: RM2.68) .......................................................................... 134
- Public Bank (BUY/RM22.90/Target: RM25.20)........................................................................... 136
- Tenaga Nasional (BUY/RM14.30/Target: RM17.70) .................................................................. 138
- Cahya Mata Sarawak (BUY/RM2.42/Target: RM4.00) ............................................................... 140
- Gabungan AQRS (BUY/RM1.19/Target: RM1.86)...................................................................... 142
- Scientex (BUY/RM7.16/Target: RM8.20) .................................................................................... 144
- Serba Dinamik (BUY/RM3.34/Target: RM4.30) .......................................................................... 146
- VS Industry (BUY/RM1.68/Target: RM1.85) ............................................................................... 148
- Yong Tai (BUY/RM1.47/Target: RM2.10) ................................................................................... 150
Corporate Statistics .................................................................................................................... 152
Appendix 1: GE14 Results............................................................................................................ 156
Appendix 2: 2018 Malaysia Cabinet Members............................................................................ 157
Appendix 3: Key Economic Indicators........................................................................................ 159
Appendix 4: Foreign Shareholding ............................................................................................. 160
Disclosures/Disclaimers ............................................................................................................... 161
Ju ly 2018
1
M a l a y s i a S t r a t e g y
Executive Summary
Remain defensive in 2H18 as global liquidity contracts, catching some of 1H18’s contagion effects of high market volatility and foreign equity outflow. Nevertheless, there should be interim trading opportunities, amid easing domestic political risk and as earnings recover in 2Q18. While we generally advocate a defensive and large cap-centric strategy, with thematic focus on deep values, E&E and tourism, we also advocate a trading-oriented strategy that tactically focuses on selected overly sold down large and mid caps.
Sticking to a defensive prescription. US-led external shocks and Pakatan Harapan’s (PH) surprising general election win caused several unexpected market seizures in 1H18. While we brace for further contagion effects of US-led global liquidity contraction (rising interest rates and reverse Quantitative Easing) in 2H18, the interim sentiment has turned overly bearish. Domestically, while policy changes remain a concern, we foresee ebbing political risk premium and earnings recovery in 2Q18, which suggest near-term upside.
End-18 FBMKLCI at 1,750 level. Our index target represents our second downgrade for the year, post 1Q18’s disappointing reporting season and after factoring in side effect concerns of PH’s manifestoes business-unfriendly regulatory shifts after the government followed up to pressure Telekom Malaysia (TM) to reduce broadband access fees. This pegs the market at 14.9x 2019F earnings, at mean PE, the first time in many years.
Strategy and investment themes. Thematically, deep values and asset monetisation, electrical and electronics (E&E) trend riders, and tourism plays should outperform in 2H18. OVERWEIGHT the E&E-related, gaming and utility sectors, while the plantation sector offers refuge. While gaming duties may be revised up, we expect only a moderate earnings impact on the sector which trades well below mean valuations. Tactically for portfolio boosters, focus on opportunities in heavily sold-down BUY-rated stocks: a) construction-related stocks including Gamuda, IJM Corporation and Malaysian Resources Corporation (MRCB); b) high yielders including Astro Malaysia (Astro); and c) selected mid caps eg Cahya Mata Sarawak, My E.G. Services (MyEG) and Scientex.
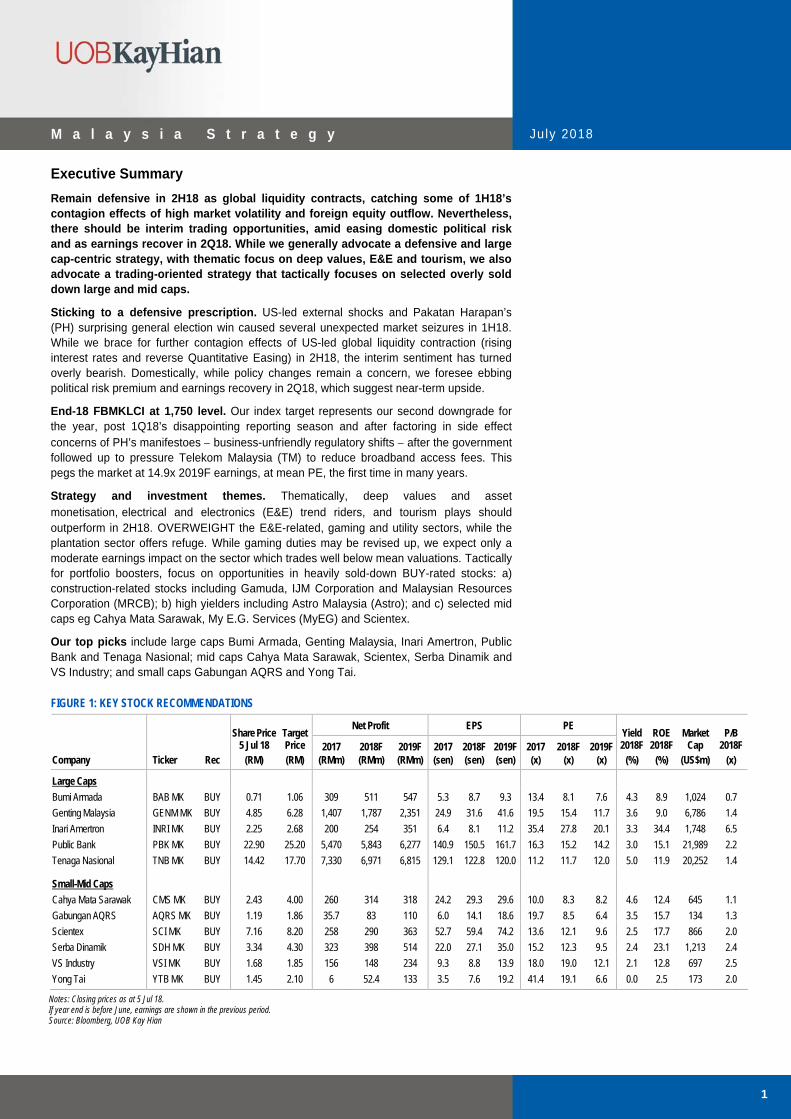
Our top picks include large caps Bumi Armada, Genting Malaysia, Inari Amertron, Public Bank and Tenaga Nasional; mid caps Cahya Mata Sarawak, Scientex, Serba Dinamik and VS Industry; and small caps Gabungan AQRS and Yong Tai.
FIGURE 1: KEY STOCK RECOMMENDATIONS
Net Profit EPS PE
Share Price
5 Jul 18 Target Price 2017 2018F 2019F 2017 2018F 2019F 2017 2018F 2019F
Yield 2018F
ROE 2018F
Market Cap
P/B 2018F
Company Ticker Rec (RM) (RM) (RMm) (RMm) (RMm) (sen) (sen) (sen) (x) (x) (x) (%) (%) (US$m) (x)
Large Caps
Bumi Armada BAB MK BUY 0.71 1.06 309 511 547 5.3 8.7 9.3 13.4 8.1 7.6 4.3 8.9 1,024 0.7
Genting Malaysia GENM MK BUY 4.85 6.28 1,407 1,787 2,351 24.9 31.6 41.6 19.5 15.4 11.7 3.6 9.0 6,786 1.4
Inari Amertron INRI MK BUY 2.25 2.68 200 254 351 6.4 8.1 11.2 35.4 27.8 20.1 3.3 34.4 1,748 6.5
Public Bank PBK MK BUY 22.90 25.20 5,470 5,843 6,277 140.9 150.5 161.7 16.3 15.2 14.2 3.0 15.1 21,989 2.2
Tenaga Nasional TNB MK BUY 14.42 17.70 7,330 6,971 6,815 129.1 122.8 120.0 11.2 11.7 12.0 5.0 11.9 20,252 1.4
Small-Mid Caps
Cahya Mata Sarawak CMS MK BUY 2.43 4.00 260 314 318 24.2 29.3 29.6 10.0 8.3 8.2 4.6 12.4 645 1.1
Gabungan AQRS AQRS MK BUY 1.19 1.86 35.7 83 110 6.0 14.1 18.6 19.7 8.5 6.4 3.5 15.7 134 1.3
Scientex SCI MK BUY 7.16 8.20 258 290 363 52.7 59.4 74.2 13.6 12.1 9.6 2.5 17.7 866 2.0
Serba Dinamik SDH MK BUY 3.34 4.30 323 398 514 22.0 27.1 35.0 15.2 12.3 9.5 2.4 23.1 1,213 2.4
VS Industry VSI MK BUY 1.68 1.85 156 148 234 9.3 8.8 13.9 18.0 19.0 12.1 2.1 12.8 697 2.5
Yong Tai YTB MK BUY 1.45 2.10 6 52.4 133 3.5 7.6 19.2 41.4 19.1 6.6 0.0 2.5 173 2.0
Notes: Closing prices as at 5 Jul 18. If year end is before June, earnings are shown in the previous period. Source: Bloomberg, UOB Kay Hian
Ju ly 2018
2
M a l a y s i a S t r a t e g y
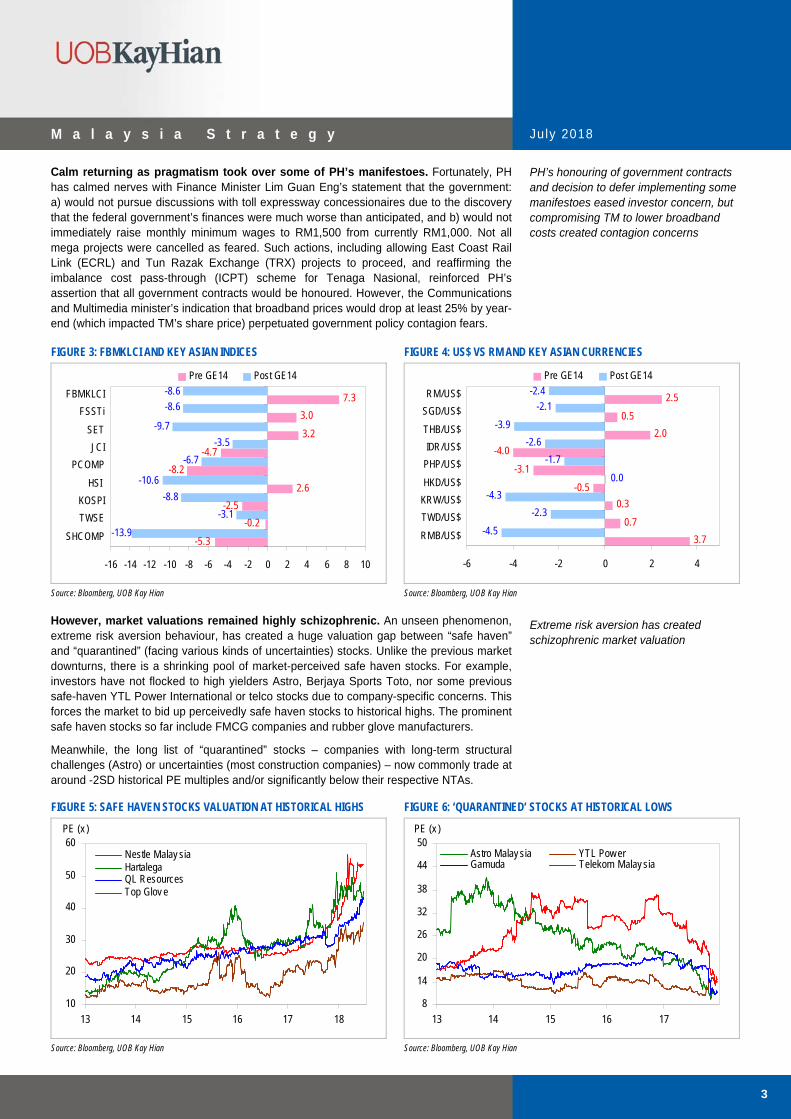
Review Of 1H18: Episodes Of Panic Attacks Market seizures... Although we had expected 2018 to be a challenging year, the broad market downturn came quicker than expected, after reaching an euphoric year-high in end-Jan 18, when surveys by political experts showed that Barisan Nasional (BN) would retain power in the 14th general election (GE14). The FBMKLCI, FBM70 and FBM Small Cap (FBMSC) indices were up 5.5%, 4.4% and 6.1% at their respective year highs. However, the market euphoria was short-lived and steep profit-taking started to set in for small/mid caps in Mar 18, followed by the FBMKLCI in early May (which had been held up by only a handful of stocks), as a series of external and domestic events took shape. As at 5 Jul 18, the FBMKLCI, FBM70 and FBMSC had fallen 5.9%, 8.6% and 18.0%. Subsequently, the FBMKLCI became a prominent regional underperformer post GE14 (Figure 3). Interestingly, many small/mid-cap stocks were already being sold down well before GE14 fears gripped the market.
…roiled by external and domestic events. Market sentiment was initially roiled by the 10-year US treasury breaching the 3% psychological threshold and later, US President Donald Trump’s threat to wage a trade war against China, which worsened the then fragile outlook for technology stocks (tied to poor mobile sales outlook for Apple). These events spiked up global trading volatility – in the US, the CBOE Volatility Index (VIX) rose to a three-year high of 37.3 from exceptionally low levels (below 9.2). Then came PH coalition’s shocking GE14 victory on 9 May, winning 113 out of the 222 parliamentary seats and 8 states.
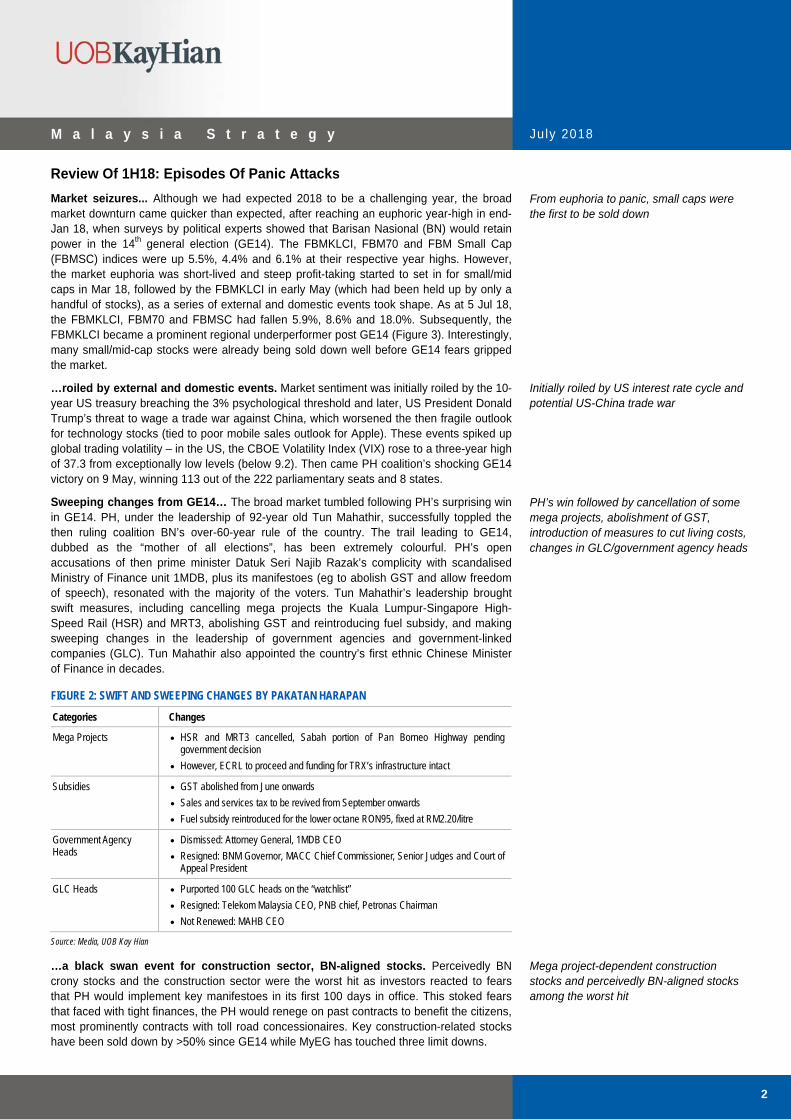
Sweeping changes from GE14… The broad market tumbled following PH’s surprising win in GE14. PH, under the leadership of 92-year old Tun Mahathir, successfully toppled the then ruling coalition BN’s over-60-year rule of the country. The trail leading to GE14, dubbed as the “mother of all elections”, has been extremely colourful. PH’s open accusations of then prime minister Datuk Seri Najib Razak’s complicity with scandalised Ministry of Finance unit 1MDB, plus its manifestoes (eg to abolish GST and allow freedom of speech), resonated with the majority of the voters. Tun Mahathir’s leadership brought swift measures, including cancelling mega projects the Kuala Lumpur-Singapore High-Speed Rail (HSR) and MRT3, abolishing GST and reintroducing fuel subsidy, and making sweeping changes in the leadership of government agencies and government-linked companies (GLC). Tun Mahathir also appointed the country’s first ethnic Chinese Minister of Finance in decades.
FIGURE 2: SWIFT AND SWEEPING CHANGES BY PAKATAN HARAPAN
Categories Changes
Mega Projects HSR and MRT3 cancelled, Sabah portion of Pan Borneo Highway pending government decision
However, ECRL to proceed and funding for TRX’s infrastructure intact
Subsidies GST abolished from June onwards
Sales and services tax to be revived from September onwards
Fuel subsidy reintroduced for the lower octane RON95, fixed at RM2.20/litre
Government Agency Heads
Dismissed: Attorney General, 1MDB CEO
Resigned: BNM Governor, MACC Chief Commissioner, Senior Judges and Court of Appeal President
GLC Heads Purported 100 GLC heads on the “watchlist”
Resigned: Telekom Malaysia CEO, PNB chief, Petronas Chairman
Not Renewed: MAHB CEO Source: Media, UOB Kay Hian
…a black swan event for construction sector, BN-aligned stocks. Perceivedly BN crony stocks and the construction sector were the worst hit as investors reacted to fears that PH would implement key manifestoes in its first 100 days in office. This stoked fears that faced with tight finances, the PH would renege on past contracts to benefit the citizens, most prominently contracts with toll road concessionaires. Key construction-related stocks have been sold down by >50% since GE14 while MyEG has touched three limit downs.
From euphoria to panic, small caps were the first to be sold down
Initially roiled by US interest rate cycle and potential US-China trade war
PH’s win followed by cancellation of some mega projects, abolishment of GST, introduction of measures to cut living costs, changes in GLC/government agency heads
Mega project-dependent construction stocks and perceivedly BN-aligned stocks among the worst hit
Ju ly 2018
3
M a l a y s i a S t r a t e g y
Calm returning as pragmatism took over some of PH’s manifestoes. Fortunately, PH has calmed nerves with Finance Minister Lim Guan Eng’s statement that the government: a) would not pursue discussions with toll expressway concessionaires due to the discovery that the federal government’s finances were much worse than anticipated, and b) would not immediately raise monthly minimum wages to RM1,500 from currently RM1,000. Not all mega projects were cancelled as feared. Such actions, including allowing East Coast Rail Link (ECRL) and Tun Razak Exchange (TRX) projects to proceed, and reaffirming the imbalance cost pass-through (ICPT) scheme for Tenaga Nasional, reinforced PH’s assertion that all government contracts would be honoured. However, the Communications and Multimedia minister’s indication that broadband prices would drop at least 25% by year-end (which impacted TM’s share price) perpetuated government policy contagion fears.
FIGURE 3: FBMKLCI AND KEY ASIAN INDICES FIGURE 4: US$ VS RM AND KEY ASIAN CURRENCIES
-5.3
-0.2
-2.5
2.6
-8.2
-4.7
3.2
3.0
7.3
-13.9
-3.1
-8.8
-10.6
-6.7
-3.5
-9.7
-8.6
-8.6
-16 -14 -12 -10 -8 -6 -4 -2 0 2 4 6 8 10
SHCOMP
TWSE
KOSPI
HSI
PCOMP
JCI
SET
FSSTi
FBMKLCI
Pre GE14 Post GE14
3.7
0.7
0.3
-3.1
-4.0
0.5
2.5
-4.5
-4.3
-1.7
-2.6
-3.9
-2.1
-0.5
2.0
0.0
-2.3
-2.4
-6 -4 -2 0 2 4
RMB/US$
TWD/US$
KRW/US$
HKD/US$
PHP/US$
IDR/US$
THB/US$
SGD/US$
RM/US$
Pre GE14 Post GE14
Source: Bloomberg, UOB Kay Hian Source: Bloomberg, UOB Kay Hian However, market valuations remained highly schizophrenic. An unseen phenomenon, extreme risk aversion behaviour, has created a huge valuation gap between “safe haven” and “quarantined” (facing various kinds of uncertainties) stocks. Unlike the previous market downturns, there is a shrinking pool of market-perceived safe haven stocks. For example, investors have not flocked to high yielders Astro, Berjaya Sports Toto, nor some previous safe-haven YTL Power International or telco stocks due to company-specific concerns. This forces the market to bid up perceivedly safe haven stocks to historical highs. The prominent safe haven stocks so far include FMCG companies and rubber glove manufacturers.
Meanwhile, the long list of “quarantined” stocks – companies with long-term structural challenges (Astro) or uncertainties (most construction companies) – now commonly trade at around -2SD historical PE multiples and/or significantly below their respective NTAs.
FIGURE 5: SAFE HAVEN STOCKS VALUATION AT HISTORICAL HIGHS FIGURE 6: ‘QUARANTINED’ STOCKS AT HISTORICAL LOWS
10
20
30
40
50
60
13 14 15 16 17 18
Nestle Malay siaHartalegaQL ResourcesTop Glov e
PE (x )
8
14
20
26
32
38
44
50
13 14 15 16 17
Astro Malay sia YTL Pow erGamuda Telekom Malay sia
PE (x )
Source: Bloomberg, UOB Kay Hian Source: Bloomberg, UOB Kay Hian
PH’s honouring of government contracts and decision to defer implementing some manifestoes eased investor concern, but compromising TM to lower broadband costs created contagion concerns
Extreme risk aversion has created schizophrenic market valuation

Ju ly 2018
4
M a l a y s i a S t r a t e g y
2H18 Outlook
End-18 FBMKLCI at 1,750 level. Post 1Q18 reporting season in May, and policy spillover concerns exacerbated by the Ministry of Communications and Multimedia’s comments, we cut our end-18 FBMKLCI forecast to 1,750 from 1,830. This pegs the market at a mean PE of 14.9x, the first time in 4 years when the FBMKLCI did not end the year at above-mean valuation. Nevertheless, our assessment still takes into account easing political risk premium and still-ample domestic liquidity that would allow the FBMKLCI to close the year higher above the current level.
Our key macro predictions are tabulated below:
FIGURE 7: KEY ECONOMIC/MARKET PROJECTIONS AND ASSESSMENTS
Indicator Prediction/Assessment for 2018
GDP Growth 5.0% in 2018 (2017: 5.9%)
Improvement in net export growth
Moderate improvement in domestic consumption trends from 2H17
Current Account End-18: 3.0% of GDP
Interest Rate End-18 OPR: 3.25%
MGS yield should rise moderately, driven by US interest rate hikes
Inflation 2.5%
Currency 3Q18: RM3.90/US$; 4Q18: RM3.85/US$; 1Q19: RM3.80/US$
FBMKLCI 1,750 (14.9x 2019F PE)
FBMKLCI Earnings c.2.9% core earnings growth in 2018
ROE remain stagnant at 10.7% in 2018 (Bloomberg data)
Liquidity Foreign ownership of Malaysian equities expected to slide modestly in 2H18, following post-GE14 outflows (ytd 24.2%)
External Factors US: 10-year treasury breaching 3% and reversal of QE
Source: UOB Global Economics & Market Research, UOB Kay Hian
FIGURE 8: FBMKLCI AND PE FIGURE 9: FBMKLCI AND P/B
500
700
900
1,100
1,300
1,500
1,700
1,900
02 03 04 05 06 07 08 09 10 11 12 13 14 15 16 17 18
10
12
14
16
18
20
22
mean = 14.9x
1sd = 16.4x
2sd = 18.0x
-1sd = 13.4x
(Index ) (x )
FBMKLCI (LHS)
1-y ear PE (RHS) -2sd = 11.9x
500
700
900
1,100
1,300
1,500
1,700
1,900
02 03 04 05 06 07 08 09 10 11 12 13 14 15 16 17 18
1.0
1.2
1.4
1.6
1.8
2.0
2.2
2.4
2.6
mean = 1.9x
1sd = 2.2x
2sd = 2.5x
-1sd = 1.6x
(Index ) (x)
FBMKLCI (LHS)
1-y ear P/B (RHS)-2sd = 1.3x
Source: Bloomberg, UOB Kay Hian Source: Bloomberg, UOB Kay Hian
A moderately lower FBMKLCI target of 1,750 post 1Q18 results season

Ju ly 2018
5
M a l a y s i a S t r a t e g y
Bracing for global liquidity contraction. Global markets are still bracing for rising global interest rates and the reverse Quantitative Easing (QE) effect, as the respective central banks in the US, EU and Japan are unlikely to stray significantly from their respective schedules of reversing (US) or reducing (EU and Japan) QE activities. Since the Global Financial Crisis (GFC) a decade ago, these countries’ federal budgets have been indirectly supported by their respective central banks via QE, resulting in the central banks having exceptionally swollen balance sheets. The reversal or reduction of QE activities raises interest rate expectations and elevates risk aversion, which implies lower equity valuation and aversion to the perceivedly riskier emerging markets.
FIGURE 10: UPDATES ON QE SCHEDULES IN US, EU AND JAPAN FIGURE 11: CENTRAL BANK ASSETS – CURRENT VS PRE-GFC
Central 2018F QE as a 2017 QE as a Bank % to Govt Deficit % to Govt Deficit QE Policies Projections
US Fed (52.2) 0.54 Total assets reduced by US$0.14t (end 17-Jun 18). BSR programme to increase to US$40b in July 18. Annual cuts to increase to US$420b in 2018 and US$600b in 2019 (US$30b in 4Q17).
ECB 219.2 520.5 Total assets expanded by €0.81t (end 16-end 17). Monthly net asset purchases of €30b until Sep 18 and later decreased to €15b in 4Q18.
BoJ 94.8 162 Total assets expanded by ¥15.6t (end 17-Jun 18). Bond buying has moderated to an annualised ¥33.8t (as of 1H18), way below its official target of ¥80t.
Pre GFC Current Central Bank (2007) (2017)
US Fed US$0.9t US$4.4t
ECB EUR1.5t EUR4.5t
BoJ JPY111.3t JPY521.4.0t
Note: All values are expressed in US$ unless stated otherwise Source: BOJ, ECB, FOMC, Media, UOB Global Economics & Market Research, UOB Kay Hian
Source: BOJ, ECB, FOMC, Media, UOB Kay Hian
Rising interest rate expectations. While we expect Malaysia’s policy rate to be held steady at 3.25% in 2H18, the Malaysian Government Securities (MGS) rate is bound to rise, in tandem with the expected rise in US treasury rate. We also note that the interest rate spread between the 10-year MGS and US treasury of around 1.32ppt (vs 10-year average of 1.38ppt) may be too benign in the current environment.
FIGURE 12: 10-YEAR MGS AND 10-YEAR US TREASURY RATE DIFFERENTIAL
0
10
20
30
40
50
60
06 07 08 09 10 11 12 13 14 15 16 17 18
-2
-1
0
1
2
3Foreign Holdings of MGS (%) (LHS)MGS-US Treasury Differential (RHS)
(%) (%)
Source: Bloomberg, UOB Kay Hian
Nevertheless, easing risk premium on domestic factors could lead to near-term market recovery. Despite lingering policy uncertainties (eg fate of some mega projects and heads of GLCs/government agencies) and the prime minister’s curious wish to have a new national car company (since a significant stake in Proton was sold to China’s Geely), PH’s commitment to maintaining the sanctity of contracts and honouring all government debts/contracts, plus earnings recovery from a widely disappointing 1Q18 season, should lead to further recoveries in many heavily sold-down stocks. In addition, 2Q-3Q18 domestic consumption trends should be positive, following the abolishment of the 6% GST in June, and the delayed reinstatement of the old sales and services tax (SST) in Sep 18.
Tighter global liquidity a negative for emerging markets
Rising interest rate expectation for MGS also reflects a too benign rate spread to US treasury
Modest market recovery despite some lingering issues relating to…
Ju ly 2018
6
M a l a y s i a S t r a t e g y
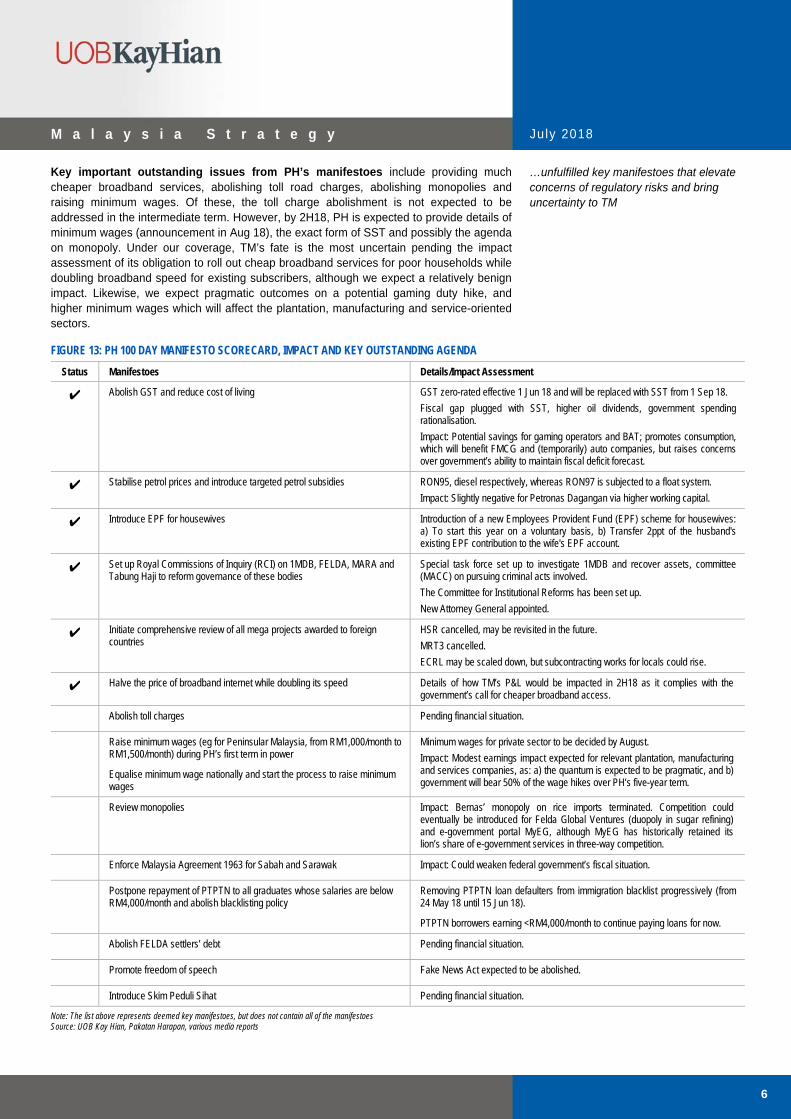
Key important outstanding issues from PH’s manifestoes include providing much cheaper broadband services, abolishing toll road charges, abolishing monopolies and raising minimum wages. Of these, the toll charge abolishment is not expected to be addressed in the intermediate term. However, by 2H18, PH is expected to provide details of minimum wages (announcement in Aug 18), the exact form of SST and possibly the agenda on monopoly. Under our coverage, TM’s fate is the most uncertain pending the impact assessment of its obligation to roll out cheap broadband services for poor households while doubling broadband speed for existing subscribers, although we expect a relatively benign impact. Likewise, we expect pragmatic outcomes on a potential gaming duty hike, and higher minimum wages which will affect the plantation, manufacturing and service-oriented sectors.
FIGURE 13: PH 100 DAY MANIFESTO SCORECARD, IMPACT AND KEY OUTSTANDING AGENDA
Status Manifestoes Details/Impact Assessment
✔ Abolish GST and reduce cost of living GST zero-rated effective 1 Jun 18 and will be replaced with SST from 1 Sep 18.
Fiscal gap plugged with SST, higher oil dividends, government spending rationalisation.
Impact: Potential savings for gaming operators and BAT; promotes consumption, which will benefit FMCG and (temporarily) auto companies, but raises concerns over government’s ability to maintain fiscal deficit forecast.
✔ Stabilise petrol prices and introduce targeted petrol subsidies RON95, diesel respectively, whereas RON97 is subjected to a float system.
Impact: Slightly negative for Petronas Dagangan via higher working capital.
✔ Introduce EPF for housewives Introduction of a new Employees Provident Fund (EPF) scheme for housewives: a) To start this year on a voluntary basis, b) Transfer 2ppt of the husband's existing EPF contribution to the wife's EPF account.
✔ Set up Royal Commissions of Inquiry (RCI) on 1MDB, FELDA, MARA and Tabung Haji to reform governance of these bodies
Special task force set up to investigate 1MDB and recover assets, committee (MACC) on pursuing criminal acts involved.
The Committee for Institutional Reforms has been set up.
New Attorney General appointed.
✔ Initiate comprehensive review of all mega projects awarded to foreign countries
HSR cancelled, may be revisited in the future.
MRT3 cancelled.
ECRL may be scaled down, but subcontracting works for locals could rise.
✔ Halve the price of broadband internet while doubling its speed Details of how TM’s P&L would be impacted in 2H18 as it complies with the government’s call for cheaper broadband access.
Abolish toll charges Pending financial situation.
Raise minimum wages (eg for Peninsular Malaysia, from RM1,000/month to RM1,500/month) during PH’s first term in power
Equalise minimum wage nationally and start the process to raise minimum wages
Minimum wages for private sector to be decided by August.
Impact: Modest earnings impact expected for relevant plantation, manufacturing and services companies, as: a) the quantum is expected to be pragmatic, and b) government will bear 50% of the wage hikes over PH’s five-year term.
Review monopolies Impact: Bernas’ monopoly on rice imports terminated. Competition could eventually be introduced for Felda Global Ventures (duopoly in sugar refining) and e-government portal MyEG, although MyEG has historically retained its lion’s share of e-government services in three-way competition.
Enforce Malaysia Agreement 1963 for Sabah and Sarawak Impact: Could weaken federal government’s fiscal situation.
Postpone repayment of PTPTN to all graduates whose salaries are below RM4,000/month and abolish blacklisting policy
Removing PTPTN loan defaulters from immigration blacklist progressively (from 24 May 18 until 15 Jun 18).
PTPTN borrowers earning <RM4,000/month to continue paying loans for now.
Abolish FELDA settlers’ debt Pending financial situation.
Promote freedom of speech Fake News Act expected to be abolished.
Introduce Skim Peduli Sihat Pending financial situation.
Note: The list above represents deemed key manifestoes, but does not contain all of the manifestoes Source: UOB Kay Hian, Pakatan Harapan, various media reports
…unfulfilled key manifestoes that elevate concerns of regulatory risks and bring uncertainty to TM

Ju ly 2018
7
M a l a y s i a S t r a t e g y
Malaysia’s economic fundamentals are generally intact. Supporting our view are: a) real GDP growth which remains strong at >5% (although the newly-installed prime minister suspected that the officially released 1Q18 GDP growth of 5.4% may be too high); and b) improving current account which is currently at a surplus of RM15b, or 4.5% of GNI (2017: 3.1% of GNI). Our channel checks have already detected a discernible consumption pick-up post CNY, and we expect the three-month reprieve from the abolishment of GST (Jun-Sep 18) to at least temporarily spur domestic consumption (eg long booking queues for cars).
FIGURE 14: ANECDOTES AND CHANNEL CHECKS
Sector Channel Checks
Automobile Vehicle sales should spike up during the three-month tax-free period from 1 Jun until end-Aug 18, and tank thereafter following the introduction of the SST on 1 Sep 18.
Cumulative 4M18 TIV dipped 0.7% yoy to 182,229 units. We forecast 2017 TIV of 595,000 units (+2.5% yoy), while MAA’s 2017 TIV forecast stands at 590,000 units (+1.7% yoy).
Building Materials Demand for steel and cement should improve in 2H18 with ECRL proceeding but not as strong as originally hoped.
Banking & Insurance 4M18 loans growth remained modest at 4.8% while residential approval rate by value remained a relatively low 42% vs five-year average of 47%.
General insurance net premium growth was sluggish at 0.71% in 2017 and is likely to have remained weak in 1H18 as motor insurance, which is a major segment, will continue to remain lacklustre given the flattish 4M18 auto sales trend.
Life insurance business grew 3.9% in 2017, in line with 10-year historical average.
Consumer - F&B,
Brewery and Food Retail
F&B: Sales volumes of low-ticket staple products remained resilient, although demand for carbonated soft drinks still contracted.
Brewery: Mid-single-digit sales volume growth in 1Q18 driven by hefty CNY promotions.
Food Retail: Positive SSSG was charted by Starbucks operations and momentum should continue in 2H18.
Consumer - Retail Retail Group Malaysia projects a 5.3% growth in retail sales for 2018. This is driven by: a) boost in consumer confidence on the three-month tax break, and b) surge in discounts and promotions offered by retailers during this once-in-a-lifetime opportunity.
Consumer - Tobacco Demand stabilising with lower (low single digit) yoy volume decline in 1Q18.
Gaming - NFO NFOs’ ticket sales per draw stable to improving.
High-single-digit gaming volume growth (both VIP and mass market) ytd, led by capacity expansion.
Healthcare Signs of improvement in demand seeing the pickup in inpatient traffic (+3% yoy) in 1Q18.
Media Print media still impacted by weak ad spending.
Weaker contribution from subscription segment (-4.0% yoy).
Property 1Q18 sales meeting modest annual targets, but demand outlook remains sluggish, requiring developers to offer steep discounts.
REITs Tenant sales remain sluggish at general retail and have moderated at prime retail malls.
Rental reversion at low single digits for high-end retail malls but flat/lower rentals for mass retail.
Telecommunications The Big 3 celcos (ie Celcom, DiGi.Com and Maxis) experienced a 1% decline in service revenue in 1Q18 high prepaid customer churn.
Source: UOB Kay Hian
A relatively benign outlook for the ringgit. Surprisingly the ringgit has softened by only 1.4% against the greenback (as at 5 July) since GE14, despite massive foreign selloffs, particularly in the bond market. While Bank Negara Malaysia’s (BNM) foreign reserves eased by only US$1b in May to US$108.5b, BNM’s net short position in forex swaps widened to US$9.7b (8.8% of total foreign reserves) in May vs US$6.9b net short in April. Supporting a relatively benign worst-case scenario for only a moderate drop (consensus: RM4.00/US$) is the view that the federal government’s debt (50.8% of 2018F GDP, 36.1% including all contingent liabilities) remains manageable, especially with a much more financially prudent government in place.
The market, however, would need to be convinced that the PH government can maintain the 2.8% fiscal deficit target for 2018, given the balancing act of cutting money politics from the federal budget to fund public goods (eg abolishing GST, reinstating fuel subsidy). Adding to such an uncertainty, Daim Zainuddin, the country’s former Finance Minister and currently a member of the Council of Elders that serves as an advisory role to the government, said there were other “mini 1MDBs” in the government. There is also the overhanging issue of Sabah’s and Sarawak’s demands for a much higher oil revenue royalty from 5% currently.
Benign outlook for hitherto resilient ringgit despite massive foreign selloffs in capital market
Much depends on fiscal deficit assessment
Generally healthy economic vital signs

Ju ly 2018
8
M a l a y s i a S t r a t e g y
FIGURE 15: TWEAKINGS IN 2018 FEDERAL BUDGET
Budget 2018 Revised Difference (RMb) (RMb) (RMb) Change vs Budget 2018
Total Federal Government Revenue (A) 239.9 233.3 (6.6) RM6.6b net decrease in revenue
Direct Tax 127.7 133.1 +5.4
of which PITA 11.4 16.8 +5.4 Increase in taxes due to rise in global oil prices
Indirect Tax 63.9 46.9 (17)
of which GST 43.8 22.8 (21) Income loss from zero-rated GST
SST n.a. 4 +4 New proceeds from SST (effective 1 Sep 18)
Non-tax Revenue 48.3 53.3 +5
of which Investment Income 24.6 29.6 +5 Higher dividend from GLCs
Operating Expenditure (B) 234.3 228.0 (6.3) RM6.3b net decrease in opex
0.7 Additional spending for Hari Raya special assistance
3.0 Additional spending for petrol stabilisation programme
(10.0) Savings from expenditure rationalisation programme
Net Development Expenditure (C) 45.4 45.4 Unchanged Development expenditure less RM600m loan recovery
Overall Balance (A) - (B) - (C) (39.8) (40.1) (0.3) RM300m net increase in expenditure
Fiscal/Budget Deficit (as a % of GDP) 2.80% 2.82%
Source: The Edge Weekly, UOB Kay Hian
Modest foreign equity outflows anticipated. Foreign investors continued to be net sellers after selling RM5.6b in equities in May, resulting in a year-to-May net outflow of RM3.6b. Nevertheless, we expect foreign outflow to slow down given the moderate estimated foreign portfolio ownership of only 16% (the overall foreign equity shareholding improved by 0.8ppt in Jan-Mar 18 to 24.2%).
The bond market experienced a heavy selldown in May, with foreign investors selling RM12.9b in May (Apr: -RM4.7b), reducing their collective ownership of government bonds to 14.2% (mainly represented by the 41.9% ownership of MGS). Nevertheless, going forward, mitigation factors include a relatively resilient ringgit outlook and the lower amount of MGS maturing in 2018 vs 2017.
FIGURE 16: MGS MONTHLY MATURITY AND NET FOREIGN FUND FLOWS IN MALAYSIAN BOND MARKET
MGS Monthly Maturity Net Foreign Fund Flows in the Malaysian Bond Market
2018 2019 2018 Month (RMb) (RMb) (RMb)
Jan 2.0 0.0 4.47
Feb 14.1 0.0 (3.94)
Mar 8.8 7.2 2.88
Apr 0.0 0.0 (4.69)
May 0.0 0.0 (12.91)
Jun 0.0 0.0 n.a.
Jul 0.0 7.3 n.a.
Aug 0.0 0.0 n.a.
Sep 11.4 0.0 n.a.
Oct 2.0 11.8 n.a.
Nov 0.0 17.1 n.a.
Dec 0.0 0.0 n.a.
Source: Bloomberg, CEIC, UOB Kay Hian
Foreign net selling of equities to abate in 2H18, given the already low portfolio ownership
Bond selloff should also moderate in 2H18

Ju ly 2018
9
M a l a y s i a S t r a t e g y
Earnings Outlook
2018-19 earnings forecasts cut. Following the dismal 1Q18 results, we cut our 2018 and 2019 earnings forecasts by 2.6% and 2.4% for the FBMKLCI, and 3.3% and 2.1% for our coverage universe. We now expect the FBMKLCI’s and our universe’s earnings to grow 2.5% and 3.9% in 2018, and 7.5% and 9.3% in 2019. By sector, 12 suffered significant downward earnings revisions (particularly aviation, O&G offshore contractors and plantation, shipping segments, technology, telecommunications and utility), while only two sectors (automobile and gaming) had notable upgrades (Figure 17).
1Q18 was especially rocky for government-reliant companies. For 1Q18, only 8.5% of the companies in our universe beat expectations while 26.4% disappointed, making it one of the worst quarters (Figure 20). While disappointments were seen across the board, some prominent earnings disappointments were presumably linked to GE14 (particularly in the telecommunications sector) and weak US dollar losers (E&E and furniture). Among the large caps, Axiata Group and TM significantly disappointed but banks mildly beat expectations. Prominent beaters are a handful of banks and automobile companies.
FIGURE 17: CORPORATE EARNINGS GROWTH BY SECTOR
Earnings Growth (%)
Sector Weight (%) 2017 2018F 2019F
Automobile 0.9 (0.6) 41.0 16.0
Aviation 1.8 2.8 (20.5) 14.0
Banking 39.8 14.3 9.5 7.1
Building Material 1.1 27.8 14.7 43.8
Conglomerate 2.0 1.5 (1.5) 9.9
Construction 2.6 (3.9) 32.2 7.9
Consumer 3.2 (8.8) 3.5 8.9
Exchange 0.3 15.2 4.2 (4.7)
Gaming 7.0 8.1 28.3 15.4
Glove Manufacturing 1.6 7.4 28.8 15.7
Healthcare 0.3 11.9 3.4 5.1
Insurance 0.4 (0.5) 9.0 8.1
Manufacturing 1.0 30.8 8.6 33.2
Media 0.9 3.5 (0.4) 3.5
O&G - Heavy Engineering 1.2 23.4 22.9 24.0
O&G - Asset Owners 2.5 75.5 1.7 6.7
O&G - Offshore Contractors (0.1) (166.3) n.m. n.m.
O&G - Shipping 2.3 7.5 (27.2) 17.2
Plantation 5.5 33.5 (3.3) 2.3
Port 0.7 (1.4) (20.3) 17.3
Property 3.1 (1.5) (19.8) 13.4
REITs 2.6 (2.0) 5.4 6.5
Technology 0.7 44.6 25.3 30.5
Telecommunications 7.4 (3.3) (8.3) 12.3
Utility 11.4 (4.9) (4.8) (0.3)
UOBKH Coverage 6.8 3.9 9.3
FBMKLCI 6.9 2.5 7.5
Source: Bloomberg, UOB Kay Hian
2018-19 FBMKLCI earnings expected to grow 2.5% and 7.5% in 2018-19…
…as 1Q18 reporting season turned out to be one of the worst in recent reporting seasons

Ju ly 2018
10
M a l a y s i a S t r a t e g y
FIGURE 18: FBMKLCI – EARNINGS BY SECTOR FIGURE 19: BLOOMBERG – FBMKLCI EPS ESTIMATES
Gaming
8%
Plantation
7%
Others
6%
O&G
9%
Consumer
1% Bank
43%
Utility
19%
Telco
7%
97
99
101
103
105
107
109
111
113
115
11 12 13 14 15 16 17 18
(Index )
Bloomberg Estimated EPS
Source: Bloomberg, UOB Kay Hian Source: Bloomberg, UOB Kay Hian
FIGURE 20: QUARTERLY RESULTS FIGURE 21: UOB KAY HIAN – NOTABLE EPS DOWNGRADES
7 9 1326
10 11 1427
17 11 16 198
62 57 51
51
58 5260
5157 62 59 56
65
32 33 3623
32 3726 23 26 27 25 25 26
0
20
40
60
80
100
1Q15 3Q15 1Q16 3Q16 1Q17 3Q17 1Q18
Abov e In line Below(%)
Quarter Sector With Earnings Downgrades
2Q16 Automobile, Banking, Gaming, Oil & Gas, Plantation, Technology, Telecommunications
3Q16 Automobile, Oil & Gas, Telecommunications
4Q16 Banking, Plantation
1Q17 Aviation, Consumer, Insurance, Ports, Telecommunications
2Q17 Automobile, Conglomerate, Oil & Gas, Small/mid Caps
3Q17 Automobile, Exchange, Healthcare, Oil & Gas
4Q17 Building Material, Insurance
1Q18 Oil & Gas, Manufacturing, Plantation, Technology, Telecommunications, Aviation
Source: UOB Kay Hian Source: UOB Kay Hian Nevertheless, corporate earnings should improve from 2Q18 onwards. We regard the 1Q18 reporting season as an anomaly and linked to GE14, eg TM’s annualised 1Q18 earnings represented merely under 50% of the pre-1Q18 consensus core profit forecast. We understand that TM’s earnings underperformance could be partially explained by higher variable wage costs. In addition, some other companies could have exercised more prudent revenue recognition post GE14.
2Q18’s core corporate earnings should recover from 1Q18’s anomalous earnings

Ju ly 2018
11
M a l a y s i a S t r a t e g y
Strategy
Maintaining a defensive stance in 2H18. We continue to expect a cautious investment environment in 2H18 to mainly reflect external concerns, noting as well that global risk-taking may moderate with the impact of cumulative interest rate hikes and the Fed’s deleveraging in the US. Stick to lower-beta, larger-cap stocks.
Nevertheless, we foresee near-term trading opportunities as many stocks have not sufficiently recovered from the post-GE14 shock selldown. Market valuations have turned too schizophrenic – bidding up many perceivedly safe haven and dependable growth stocks to stratospheric heights, while trampling down perceivedly vulnerable stocks to well under -1SD mean valuations.
We continue to expect selected mid caps in our universe to outperform the market, as economic conditions continue to support these companies to deliver relatively attractive two-year (2017-19) earnings CAGR of 13.5% vs the FBMKLCI’s 5.0%.
FIGURE 22: FBMKLCI , FBM70 & FBMSC – PERFORMANCE AND EARNINGS GROWTH
85
90
95
100
105
110
115
120
125
130
15 16 17 18
FBMKLCIFBM70FBMSC
Index = 100 (2015)
2016 2017 Year-to-5 Jul 18
(%) Index Perf
Earnings Growth
Index Perf
Earnings Growth
Index Perf
Earnings Growth
FBMKLCI (3.0) 5.4 9.5 5.4* (5.9) (7.2)*
FBM70 (0.8) (32.9) 23.4 77.1 (8.6) 5.8
FBMSC (7.7) 0.7 15.9 (73.0) (18.0) n.m.
Source: Bloomberg * UOBKH forecast differs Source: Bloomberg
Our calls are not unduly influenced by level of foreign shareholdings. Specifically, we do not expect stock performances to be dampened just because of high foreign portfolio ownership. We assess that the foreign investors who are currently invested in Malaysian equities are mostly driven by the fundamentals of their investee companies, are comfortable with the country’s macroeconomic situation, and at worst have only a modest negative bias on the ringgit’s outlook. Supporting this view that many foreign funds did not take the wholesale knee-jerk approach of selling out post GE14, we observed that many of the heavily sold-down stocks post GE14 which were well owned by foreign portfolio funds, had at worst modestly lower foreign shareholdings (eg MyEG, Cahya Mata Sarawak).
OVERWEIGHT E&E, gaming and utilities. We expect dependable growth stocks (particularly E&E stocks) and tourism-related beneficiaries (eg casino stocks) to outperform the market. While gaming duties could be raised to beef up government revenues, we expect at worst moderate earnings impact on an already cheap sector (see our gaming sector report). Defensive sectors like utilities and selected plantation stocks should also appeal. Market conditions are also favourable to selected O&G segments (FPSO).
However, UNDERWEIGHT overly expensive sectors, most prominently the glove manufacturing sector, which has risen >104% since 2017, resulting in unhealthy valuations (sector’s 2017-19 PEG ratio at 1.6x). This sector’s earnings growth may continue to disappoint, particularly when more of China’s glove manufacturers reactivate their plants after complying with the government’s environmental regulation to run natural gas-operated plants. At some point in time, mean reversion trade would deflate the overly-expensive sectors and stocks (eg Nestle which sports a 2019F PE of 44x). Among the large-cap sectors, banks may also underperform in the interim period, should foreign investors continue to exit, as banks were primary recipients of foreign equity inflows in 2017.
Stay defensive amid global liquidity contraction
Position for trading opportunities in overly-sold GE14 losers
Expect some mid caps to remain robust
High foreign ownership not an undue concern for fundamentally strong companies
Plantation is a notable defensive sector
UNDERWEIGHT overstretched sectors and stocks, in view of eventual mean reversion trade; banks may mildly underperform should foreign investors continue to exit

Ju ly 2018
12
M a l a y s i a S t r a t e g y
We maintain MARKET WEIGHT on battered down construction-related sectors. Although the sector now lacks optimism on orderbook sustainability beyond 2021, trading opportunities abound as most construction stocks sport historically cheap valuations and fat orderbooks that will sustain earnings through 2020. We expect valuations to eventually reincorporate some option values for the government to reactivate selected mega projects on the longer horizon, which lifts earnings prospects beyond 2020.
FIGURE 23: 2017 SECTOR PERFORMANCES
-38
-15
-31
29
-7 -9 -11
-25 -26-19
-23
-34
-22
2317
13 127 7
4 2 0 -2
-7 -7
-50
-40
-30
-20
-10
0
10
20
30
40
Con
sum
er
Glo
ve M
anuf
actu
ring
O&G
- H
eavy
Eng
Auto
mob
ile
Exch
ange
Avia
tion
Hea
lthca
re
Con
glom
erat
e
O&G
- As
set
Insu
ranc
e
Bank
ing
Plan
tatio
n
Port
Util
ity
Gam
ing
REI
Ts
O&G
- O
ffsho
re
O&G
- Sh
ippi
ng
Tele
com
mun
icat
ions
Prop
erty
Man
ufac
turin
g
Build
ing
Mat
eria
l
Tech
nolo
gy
Con
stru
ctio
n
Med
ia
KLCI: -5.9%
(Ytd %)
Source: Bloomberg, UOB Kay Hian
FIGURE 24: SECTOR PE VALUATION VS HISTORICAL MEAN
PE (x) Historical (x)
Sector 2017 2018F 2019F -1SD Mean +1SD
Automobile 19.8 14.0 12.1 10.9 13.9 16.9
Aviation 15.5 19.5 17.1 11.5 16.0 20.6
Banking 13.4 12.2 11.4 11.1 13.4 15.6
Construction 14.7 11.1 10.3 9.4 16.1 22.8
Consumer 36.3 35.1 32.3 19.0 22.3 25.6
Exchange 27.3 26.2 27.5 21.0 26.0 31.0
Gaming 16.8 13.1 11.4 11.7 13.9 16.1
Glove Manufacturing 44.7 34.7 30.0 13.8 17.7 21.6
Healthcare 25.1 24.2 23.1 16.0 23.3 30.6
Manufacturing* 16.0 14.8 11.1 9.5 13.0 16.5
Media 12.5 12.6 12.2 19.4 24.3 29.1
Oil & Gas 21.0 22.1 18.1 13.2 16.7 19.5
Plantation 23.0 24.0 22.0 20.0 26.0 31.0
Port 18.2 22.8 19.4 18.1 21.3 24.0
Property 11.7 14.6 12.9 8.4 13.7 19.0
Technology 34.1 25.2 18.6 11.8 17.6 23.4
Telecommunications 21.8 23.8 21.2 14.4 16.3 18.2
Utility 11.4 12.0 12.1 11.6 13.9 16.3
Overall 17.0 16.4 15.0 13.4 14.9 16.4
Indicates sectors trading below mean PE
Indicates sectors trading over +1SD vs mean PE
* Based on calenderisation Source: UOB Kay Hian
MARKET WEIGHT the battered down construction sector, which provides good interim trading opportunities

Ju ly 2018
13
M a l a y s i a S t r a t e g y
Investment Themes
Key investment themes prescribed for 2H18 include: a) multi-year running E&E trend riders, b) tourism-related plays, c) M&A and asset monetisation, and d) deep value stocks. The first two themes relate to expected catalytic events in 2H18, eg selected E&E stocks are big beneficiaries of new contract manufacturing products, and the tourism-related theme is enlivened by the planned openings of Yong Tai’s iconic Encore Melaka theatre (July 18) and Genting Malaysia’s 20th Century Fox theme park (4Q18). Peering into 2019, celcos in advanced nations could be starting to adopt 5G technology, which should lift the outlook for semiconductor-related companies.
FIGURE 25: KEY EXTERNAL EVENTS AND ANTICIPATED EVENTS
Events that create potential flashes of good returns Source: Various sources, UOB Kay Hian
The clear beneficiaries of the first two investment themes include Globetronics Technology, Inari Amertron and VS Industry (E&E); Yong Tai and Genting Malaysia (tourism); as well as Magnum and MRCB (M&A/asset monetisation).
FIGURE 26: MULTI-YEAR INVESTMENT THEMES
Market Share Price Target PE P/B Div Yield Cap 5 Jul 18 Price 2018F 2018F 2018F Company Ticker Rec (US$m) (RM) (RM) (x) (x) (x) Catalyst
(A) E&E TREND RIDERS
Globetronics Technology
GTB MK BUY 370 2.24 2.52 17.7 5.0 4.5 Ramping up in sensor and laser headlamp production volume in 2H18-2019
Inari Amertron INRI MK BUY 1,748 2.25 2.68 20.5 6.5 3.3 Securing new businesses from existing clients, particularly OSRAM
VS Industry* VSI MK BUY 697 1.68 1.85 21.4 2.5 2.1 Backed by recent acquisition of an existing plant, and completion of a new plant in mid-18; to focus on securing new contracts from existing key customers and new customers
(B) TOURISM-RELATED
Genting Malaysia
GENM MK BUY 6,786 4.85 6.28 15.4 1.4 3.6 Opening of internationally iconic 20th Century Fox theme park by 4Q18 should lift visitorship by >20%
Yong Tai YTB MK BUY 173 1.45 2.10 19.1 2.0 0.0 Opening of Encore Melaka theatre in Jul 18 a key catalyst to multi-year earnings growth
(C) ASSET MONETISATION
Magnum MAG MK BUY 736 2.09 2.50 12.6 1.2 5.6 Potential listing or trade sale of 6.3%-owned U-Mobile allows restoration of generous dividend payout
MRCB MRC MK BUY 297 0.605 1.01 18.0 0.5 3.3 Stake sale of Bukit Jail property development to EPF lowers net debt to equity to 11%; still hopes to sell EDL (2H18) and Menara Celcom (in 2019)
* FY already expired; data reflects actual reported number. Source: Bloomberg, UOB Kay Hian
Key 2H18 investment themes include E&E trend riders, tourism-related plays, M&A/asset monetisation and deep value stocks
Globetronics Technology, Inari Amertron and VS Industry (E&E), Yong Tai and Genting Malaysia (tourism) to benefit
Others
4Q181Q18
Construction
Macro
2Q18 3Q18
CorporateYong Tai’s Impression Melaka
HSR, MRT3 Projects Cancelled
GE-14
GENM: Opening of 20th Century Fox
New Products ramp-up by E&E companies
PH’s win
Mega projects ECRL & TRX to proceed
GST AbolishedSST implementationUS-China
Trade War broke out
US 10 Yr Treasury
breached 3%
PH’s 1st Budget AnnouncementNew min wage to
be announced
Expected to proceed: Pan Borneo Sabah
MCMC: Fixed broadband prices to drop by ≥25%Others
4Q181Q18
Construction
Macro
2Q18 3Q18
CorporateYong Tai’s Impression Melaka
HSR, MRT3 Projects Cancelled
GE-14
GENM: Opening of 20th Century Fox
New Products ramp-up by E&E companies
PH’s win
Mega projects ECRL & TRX to proceed
GST AbolishedSST implementationUS-China
Trade War broke out
US 10 Yr Treasury
breached 3%
PH’s 1st Budget AnnouncementNew min wage to
be announced
Expected to proceed: Pan Borneo Sabah
MCMC: Fixed broadband prices to drop by ≥25%
Ju ly 2018
14
M a l a y s i a S t r a t e g y
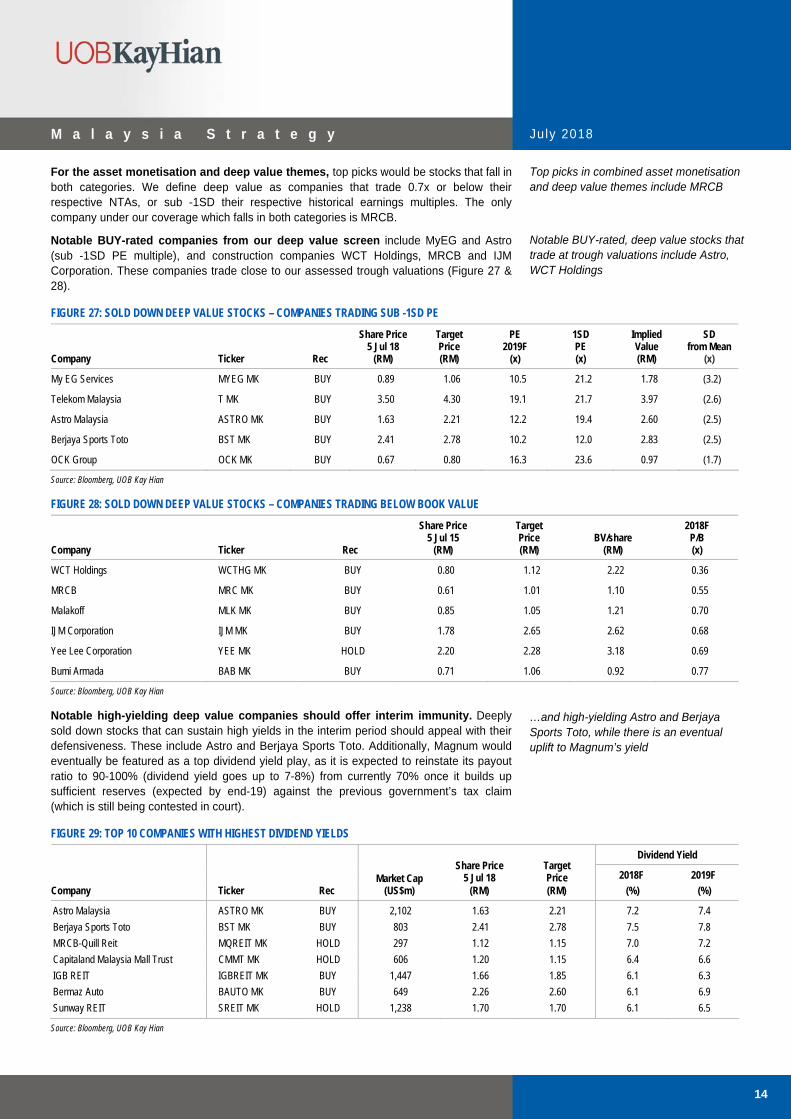
For the asset monetisation and deep value themes, top picks would be stocks that fall in both categories. We define deep value as companies that trade 0.7x or below their respective NTAs, or sub -1SD their respective historical earnings multiples. The only company under our coverage which falls in both categories is MRCB.
Notable BUY-rated companies from our deep value screen include MyEG and Astro (sub -1SD PE multiple), and construction companies WCT Holdings, MRCB and IJM Corporation. These companies trade close to our assessed trough valuations (Figure 27 & 28).
FIGURE 27: SOLD DOWN DEEP VALUE STOCKS – COMPANIES TRADING SUB -1SD PE
Share Price Target PE 1SD Implied SD 5 Jul 18 Price 2019F PE Value from Mean Company Ticker Rec (RM) (RM) (x) (x) (RM) (x)
My EG Services MYEG MK BUY 0.89 1.06 10.5 21.2 1.78 (3.2)
Telekom Malaysia T MK BUY 3.50 4.30 19.1 21.7 3.97 (2.6)
Astro Malaysia ASTRO MK BUY 1.63 2.21 12.2 19.4 2.60 (2.5)
Berjaya Sports Toto BST MK BUY 2.41 2.78 10.2 12.0 2.83 (2.5)
OCK Group OCK MK BUY 0.67 0.80 16.3 23.6 0.97 (1.7)
Source: Bloomberg, UOB Kay Hian
FIGURE 28: SOLD DOWN DEEP VALUE STOCKS – COMPANIES TRADING BELOW BOOK VALUE
Share Price Target 2018F 5 Jul 15 Price BV/share P/B Company Ticker Rec (RM) (RM) (RM) (x)
WCT Holdings WCTHG MK BUY 0.80 1.12 2.22 0.36
MRCB MRC MK BUY 0.61 1.01 1.10 0.55
Malakoff MLK MK BUY 0.85 1.05 1.21 0.70
IJM Corporation IJM MK BUY 1.78 2.65 2.62 0.68
Yee Lee Corporation YEE MK HOLD 2.20 2.28 3.18 0.69
Bumi Armada BAB MK BUY 0.71 1.06 0.92 0.77
Source: Bloomberg, UOB Kay Hian
Notable high-yielding deep value companies should offer interim immunity. Deeply sold down stocks that can sustain high yields in the interim period should appeal with their defensiveness. These include Astro and Berjaya Sports Toto. Additionally, Magnum would eventually be featured as a top dividend yield play, as it is expected to reinstate its payout ratio to 90-100% (dividend yield goes up to 7-8%) from currently 70% once it builds up sufficient reserves (expected by end-19) against the previous government’s tax claim (which is still being contested in court).
FIGURE 29: TOP 10 COMPANIES WITH HIGHEST DIVIDEND YIELDS Dividend Yield
Market Cap
Share Price 5 Jul 18
Target Price 2018F 2019F
Company Ticker Rec (US$m) (RM) (RM) (%) (%)
Astro Malaysia ASTRO MK BUY 2,102 1.63 2.21 7.2 7.4
Berjaya Sports Toto BST MK BUY 803 2.41 2.78 7.5 7.8
MRCB-Quill Reit MQREIT MK HOLD 297 1.12 1.15 7.0 7.2
Capitaland Malaysia Mall Trust CMMT MK HOLD 606 1.20 1.15 6.4 6.6
IGB REIT IGBREIT MK BUY 1,447 1.66 1.85 6.1 6.3
Bermaz Auto BAUTO MK BUY 649 2.26 2.60 6.1 6.9
Sunway REIT SREIT MK HOLD 1,238 1.70 1.70 6.1 6.5
Source: Bloomberg, UOB Kay Hian
Top picks in combined asset monetisation and deep value themes include MRCB
Notable BUY-rated, deep value stocks that trade at trough valuations include Astro, WCT Holdings
…and high-yielding Astro and Berjaya Sports Toto, while there is an eventual uplift to Magnum’s yield

Ju ly 2018
15
M a l a y s i a S t r a t e g y
FIGURE 30: FUNDAMENTAL TROUGH VALUATIONS FOR SELECTED COMPANIES
Share Price Target PE Trough Upside From 5 Jul 18 Price 2019F Value Trough Company Ticker Rec (RM) (RM) (x) (RM) (%)
WCT Holdings WCTHG MK BUY 0.80 1.12 6.8 1.24 55.0
IJM Corporation IJM MK BUY 1.78 2.65 11.3 2.33 30.9
Astro Malaysia ASTRO MK BUY 1.63 2.21 12.2 2.06 26.4
Gabungan AQRS AQRS MK BUY 1.19 1.86 10.0 1.48 24.4
Malaysian Resources Corporation MRC MK BUY 0.61 1.01 14.6 0.75 24.0
Ann Joo Resources AJR MK BUY 1.75 3.05 7.9 2.04 16.5
Gamuda GAM MK BUY 3.47 4.49 10.9 3.93 13.3
LBS Bina Group LBS MK HOLD 0.87 0.90 13.7 0.98 13.2
Eco World Development Group ECW MK HOLD 1.21 1.18 13.2 1.35 11.6
Scientex SCI MK BUY 7.16 8.20 9.5 7.92 10.6
Malakoff Corporation MLK MK BUY 0.85 1.05 13.5 0.93 10.1
Sarawak Oil Palms SOP MK BUY 2.98 4.15 13.0 3.20 7.4
Protasco PRTA MK HOLD 0.46 0.64 10.7 0.49 6.5
Cahya Mata Sarawak CMS MK BUY 2.43 4.00 13.7 2.59 6.5
Maxis MAXIS MK HOLD 5.39 6.40 21.0 5.48 1.7
DiGi.Com DIGI MK BUY 4.17 5.40 20.0 4.19 0.5
Source: Bloomberg, UOB Kay Hian

Ju ly 2018
16
M a l a y s i a S t r a t e g y
Top Picks
Our top stock picks include large caps Bumi Armada, Genting Malaysia, Inari Amertron, Public Bank and Tenaga Nasional, and small/mid caps Cahya Mata Sarawak, Gabuangan AQRS, Globetronics Technology, Scientex, Serba Dinamik, VS Industry and Yong Tai. We expect event catalysts to emerge in 2H18 for these companies, with the exception of Public Bank and Scientex (Figure 31 & 32).
Other noteworthy BUY-rated stocks include Yinson, while trading-oriented investors with above-average risk appetite should consider interim rebound plays eg construction companies Gamuda, IJM Corporation and MRCB, and mid cap MyEG.
FIGURE 31: TOP LARGE-CAP PICKS
Share Price Target PE P/B Div Yield 5 Jul 18 Price 2018F 2018F 2018F Company Ticker Rec (RM) (RM) (x) (x) (x) Catalyst
Bumi Armada BAB MK BUY 0.71 1.06 8.1 0.7 4.3 Kraken expected to receive full charter rate by 2H18
Genting Malaysia GENM MK BUY 4.85 6.28 15.4 1.4 3.6 Planned opening of iconic Fox theme park by end-18
Inari Amertron INRI MK BUY 2.25 2.68 20.5 6.5 3.3 Well poised to win new significant manufacturing contracts
Public Bank PBK MK BUY 22.90 25.20 15.2 2.2 3.0 Continued improvement in provisions and sustained non-interest income growth momentum
Tenaga Nasional TNB MK BUY 14.42 17.70 11.7 1.4 5.0 Good earnings visibility under IBR framework and undemanding valuation
Source: Bloomberg, UOB Kay Hian
FIGURE 32: TOP SMALL/MID-CAP PICKS
Share Price Target PE P/B Div Yield 5 Jul 18 Price 2018F 2018F 2018F Company Ticker Rec (RM) (RM) (x) (x) (x) Catalyst
Cahya Mata Sarawak CMS MK BUY 2.43 4.00 8.3 1.1 4.6 Earnings momentum at OM Sarawak
Groundbreaking for mega phosphate manufacturing project MPA
Gabungan AQRS AQRS MK BUY 1.19 1.86 8.5 1.3 3.5 Potential contract wins in mega projects which may still proceed (ECRL, Sabah portion of Pan Borneo Highway)
Expected successful launch of E island development
Globetronics Technology
GTB MK BUY 2.24 2.52 17.7 5.0 4.5 Earnings doubling in 2018
Further upside on potential commercialisation of sensors under development
Scientex SCI MK BUY 7.16 8.20 11.9 2.0 2.5 Expecting a stronger 4QFY18 core net profit from maiden contribution from Klang Hock Plastic Industries and normalised property segment performance post GE
Serba Dinamik SDH MK BUY 3.34 4.30 12.3 2.4 2.4 More upside to earnings expectations - high orderbook renewal rate and momentum of new orderbook wins
Yong Tai YTB MK BUY 1.45 2.10 19.1 2.0 0.0 Strong reception expected for Impression theatre (opening Mar 18); may explore opening more theatres in the region
VS Industry VSI MK BUY 1.68 1.85 21.4 2.5 2.1 High growth visibility, potential major contract wins
Source: Bloomberg, UOB Kay Hian
Top picks with expected catalysts in 2H18 include large caps Bumi Armada, Genting Malaysia and Inari Amertron, and small/mid caps Cahya Mata Sarawak, Gabungan AQRS, Globetronics Technology, Scientex, VS Industry and Yong Tai

Ju ly 2018
17
M a l a y s i a S t r a t e g y
SELL calls continue to be the pricey Hartalega Holdings and Nestle Malaysia which are priced to perfection and hence, vulnerable to negative developments or would significantly underperform when market risk aversion eases. Hartalega's valuation appears unsustainably stretched, given that some of China’s vinyl glove manufacturing plants would eventually come back on stream (after meeting the China government’s requirement to convert plants for natural gas feedstock). The potential vulnerability to bad news is aptly demonstrated by Top Glove's single-day 30% plunge (at the lowest point) after its shocking announcement to sue the vendors of recently acquired Apsion for at least over half of the RM1.4b acquisition price tag.
FIGURE 33: SELL CALLS
Share Price Target PE P/B Div Yield 5 Jul 18 Price 2018F 2018F 2018F Company Ticker Rec (RM) (RM) (x) (x) (x) Catalyst
Hartalega Holdings HART MK SELL 5.95 4.02 38.7 9.0 1.6 Subject to risk of valuation derating due to structural downtrend in nitrile glove margins over the longer term
Source: Bloomberg, UOB Kay Hian
Vincent Khoo, CFA +603 2147 1998
Malaysia Research Team +603 2147 1988

M a l a y s i a S t r a t e g y July 2018
18
Automobile MARKET WEIGHT
WHY WE ARE MARKET WEIGHT
Many automobile stocks are trading at mid-teens PE valuations from being in the red on better outlook driven by strengthening of the ringgit.
Stocks like Bermaz Auto with huge cash pile and zero long-term borrowing offer attractive yields.
WHAT TO WATCH OUT FOR IN 2H18
The quantum of the SST which is slated to be introduced on 1 Sep 18 after a three-month tax break.
Proton’s first SUV launch, which will be based on Geely’s Boyue in 4Q18.
Outlook
FIGURE 34: AUTOMOBILE INDEX OUTPERFORMS FBMKLCI
90
95
100
105
110
115
120
125
Jan Feb Mar Apr May Jun Jul
Automobile
FBMKLCI
End Dec 17=100
Source: Bloomberg, UOB Kay Hian
Outperforms FBMKLCI ytd. The sector’s stellar performance is led by UMW Holdings (UMW) which has outperformed the FBMKLCI by 18.5%. Most listed automobile stocks have recovered from their ytd lows driven by improving results on a stronger ringgit and higher sales volume, as well as a corporate deal between UMW and MBM Resources (MBMR). UMW plans to increase its stake in Perodua by acquiring a 10% stake in Perodua from PNB Equity Resources Corporation (PNB), and a 50.1% stake in MBMR from Med-Bumikar Mara (49.5%) and Central Shore (0.57%) at RM2.56/share, with a mandatory takeover to follow.
TIV to spike up during three-month tax break… On the back of a three-month tax break effective 1 Jun 18, we expect sales volume to spike up as consumers take advantage of the tax-free window. In addition, we note that carmakers have not scaled down their promotions and in fact have intensified their promotions, notably during the Hari Raya period.
…tank in 4Q18 and normalise thereafter. Sales volume should experience a rather significant drop in 4Q18 on the back of frontloading by consumers due to the three-month tax break and also in anticipation of higher car prices following the reintroduction of the Sales and Services Tax (SST). We maintain our 2018 total industry volume (TIV) growth forecast of 2-4% at 607,000-619,000 units.
Sector outperformance driven by better results on stronger ringgit, higher sales volume and UMW-MBMR deal
Sales volume to spike up during the three-month tax break, tank in 4Q18 and normalise thereafter

M a l a y s i a S t r a t e g y July 2018
19
Car prices could go up following reintroduction of SST. Before the implementation of the Goods and Services Tax (GST), SST for cars was 10%. In the case that the quantum of the SST for cars is back at the 10% rate, car prices are expected to be 1-3% higher than the GST-inclusive prices.
FIGURE 35: SALES & SERVICES TAX (SST) VS GOODS AND SERVICES TAX (GST)
SST GST
Government Approved Selling Price +
10% Sales Tax +
Margins
Government Approved Selling Price +
Margins
Net Selling Price Net Selling Price +
Inspection Fees, Accessories, etc. +
Inspection Fees, Accessories, etc. Retail Price Without Insurance Retail Price Without Insurance
+ Road Tax
+ Insurance
+ 6% GST
+ Road Tax (no GST)
+ Insurance (own 6% applied)
Final Price Final Price
Source: Paultan.org
Minimal to modest impact from reduction of excise duty on imported cars below 1,600cc for first-time buyers. The manifesto of Pakatan Harapan stated the reduction of excise duty on imported cars below 1,600cc for first-time buyers and limited to only one purchase for each family with household income below RM8,000/month. There are no further details yet on the timeline of the implementation and the quantum of the reduction of excise duty. We see minimal to modest impact to the automobile sector given that the reduction of excise duty is only applicable to first-time car buyers and limited to only one purchase for each family with household income below RM8,000/month. Furthermore, imported cars below 1,600cc account for only a small fraction of consumers.
A third national car project in the making? Speaking at the 24th Nikkei Conference in Tokyo last month, Prime Minister Tun Dr Mahathir Mohamad expressed his desire to form Malaysia’s third national car project with other countries in the region as Proton is no longer a national car brand after it was sold to China’s Geely last year. To recap, Geely acquired a 49.9% stake in Proton from DRB-Hicom in Sep 17. Given that the government is focusing on reducing its debt, the plan is not feasible if there is no strong partner that can offer solid financial support, modern technology and production capabilities. Moreover, the local automobile market is too small to accommodate another national car project.
Should SST for cars go back to 10%, car prices are expected to be 1-3% higher than GST-inclusive prices
Minimal to modest impact as reduction is only applicable to first-time buyers and limited to one purchase per family with household income <RM8,000/month
Third national car project not feasible given new government’s focus on debt reduction and small local automobile market

M a l a y s i a S t r a t e g y July 2018
20
FIGURE 36: MARKET SHARE (2017) FIGURE 37: MARKET SHARE (5M18)
Perodua
36%
Proton
12%Toy ota
17%
Honda
19%
Nissan
5%
Mazda
2%
EURO
5%
Others
4%
Perodua
43%
Others
9%EURO
5%
Nissan
4%
Mazda
2%
Honda
18%
Toy ota
9%Proton
9%
Source: Malaysian Automotive Association (MAA) Source: MAA
FIGURE 38: MONTHLY TIV BREAKDOWN
May 18 mom yoy 5M18 5M17 yoy (unit) % chg % chg (unit) (unit) % chg
Industry
Passenger 40,221 (4.2) (10.9) 203,299 210,402 (3.4)
Commercial 2,762 (45.9) (49.4) 21,913 23,778 (7.8)
Total 42,983 (8.7) (15.0) 225,212 234,180 (3.8) National
Passenger 26,452 8.5 6.4 120,627 116,868 3.2
Commercial 17 (73.8) (26.1) 144 139 3.6
Total 26,469 8.3 6.4 120,771 117,007 3.2 Non-National
Passenger 13,769 (21.8) (32.1) 82,672 93,534 (11.6)
Commercial 2,745 (45.6) (49.5) 21,769 23,639 (7.9)
Total 16,514 (27.1) (35.8) 104,441 117,173 (10.9)
Source: MAA
Perodua: Strong sales volume ytd driven by all-new Myvi. Perodua remains the market leader with its market share growing to 43% ytd (2017: 36%). We attribute this to the favourable reception to its all-new Myvi launched in Nov 17 (the previous model was six years old), and lack of new product offerings from Proton, its closest competitor so far. 5M18 sales volume growth grew 19.1% yoy to 97,487 units, driven by the all-new Myvi. Its highly-anticipated new SUV launch will only take place in 2019, which will be competing with Boyue, Proton’s first SUV, which is slated to be launched in 4Q18. Perodua plans to grow its 2018 sales target by 2% to 206,000 units (2017: 204,887 units).
Proton: To launch a new model each year until 2021, starting with highly-anticipated first SUV in 4Q18. As expected, Proton’s 5M18 sales volume was weak, declining a significant 34.9% yoy to 20,933 units. This was due to a lack of new product offerings so far this year as the carmaker focuses on restructuring following Geely’s acquisition of a 49.9% stake in Proton and a controlling stake in Lotus. However, Proton expects to launch its first SUV in 4Q18. The SUV, based on Geely’s Boyue, will be sold as a complete built-up (CBU) fully imported from China for its launch and then locally assembled at the carmaker’s Tanjung Malim plant in 2019. Boyue is Geely’s best-selling model, accounting for 23% of its 2017 sales volume with 286,885 units sold. Geely sold 1.25m units of cars in 2017, representing a 5% market share in China last year.
Proton’s Boyue to hit the market in 4Q18; Perodua to launch new SUV model in 2019

M a l a y s i a S t r a t e g y July 2018
21
Nissan: Focusing on improving margins instead of being a volume play. Nissan’s sales volume continued to be weak, with 5M18 sales volume declining 17.4% yoy to 8,918 units. The lacklustre performance was due to its lack of new product offerings, and the carmaker’s strategic shift to focus on improving its margin via high-margin car models instead of ramping up sales volume. We note that its strategy has borne fruit given that the 1Q18 results of Tan Chong Motor Holdings, the Nissan distributor in Malaysia, are back in the black after eight quarters in the red. Nissan launched the all-new Serena S-Hybrid in a complete knocked-down (CKD) version in May 18 and the next model to hit the market will be the all-new electric vehicle (EV) Leaf in 4Q18 or 1Q19.
Non-national marques’ market share to come off in 2018. We expect market share of non-national marques to shed from >50% in 2017, in view of: a) lack of attractive new models in 2018 (Figure 39), and b) highly-anticipated launch of the Boyue SUV by Proton in 4Q18. For 5M18, market share of non-national marques stood at 48% (2017: 52%).
FIGURE 39: MONTHLY TIV – NATIONAL VS NON-NATIONAL FIGURE 40: MONTHLY TIV OF BIG 3 NON-NATIONAL MARQUES
16
18
20
22
24
26
28
30
Jan 17 Apr 17 Jul 17 Oct 17 Jan 18 Apr 18
('000 units)
National Non-national
0
2
4
6
8
10
12
Jul 17 Sep 17 Nov 17 Jan 18 Mar 18 May 18
('000 units)
Toy ota Honda Nissan
Source: MAA Source: MAA
FIGURE 41: LAUNCH OF NOTABLE NEW AND FACELIFTED MODELS IN 2H18 AND 2019
Segment Model To be launched in
B-Segment Kia Picanto 2H18
Mazda 6 3Q18 C-Segment
Nissan Leaf 4Q18 or 1Q19
Hyundai Kona 2H18
Hyundai Santa Fe 2H18/2019
Mazda CX-8 (CKD) 2019
Perodua D38L 2019
SUV
Proton Geely Boyue 4Q18
MPV Mitsubishi Xpander 2H18
Pick-up Ford Raptor 2H18
Source: Media reports, Respective companies, UOB Kay Hian
Carmakers’ margins have bottomed out since 4Q17. We have seen a significant improvement in the margins of carmakers since 4Q17 on the back of a strengthening ringgit against major currencies (Figure 42). Provided that the US$/RM rate is maintained at the RM3.95-4.00 level, we expect carmakers’ margins to remain at the 1H18 level.
Nissan’s upcoming launch of all-new high-margin EV Leaf not expected to boost sales volume
Lack of new attractive models from non-national marques in 2H18

M a l a y s i a S t r a t e g y July 2018
22
FIGURE 42: LISTED AUTOMOBILE PLAYERS’ EBIT MARGINS
-4
-2
0
2
4
6
8
10
12
14
1Q16 2Q16 3Q16 4Q16 1Q17 2Q17 3Q17 4Q17 1Q18
(%)
APM Automotiv e Bermaz AutoMBM Resources Tan Chong MotorUMW Holdings
Note: UMW’s margins are PBT margins. DRB-Hicom’s data is removed from the chart as its automobile segment has recorded losses for the past nine quarters. Source: Respective companies

M a l a y s i a S t r a t e g y July 2018
23
Strategy
Maintain MARKET WEIGHT on the sector. Although domestic sales volume growth will be limited in a saturated market, margins have bottomed out on the back of the strengthening of the ringgit against major currencies in 4Q17, and carmakers are ramping up export sales volume given the customised incentives offered by the government to make Malaysia a regional energy efficient vehicle (EEV) hub by 2022. Bermaz Auto (BAuto) is our top pick for the sector.
Bermaz Auto (BAUTO MK/BUY/RM2.26/Target: RM2.60). Given BAuto’s strong 4QFY18 results, we expect the growth momentum to continue on the back of the ramp-up of CX-5 sales volume by its associates, notably its 30%-owned Mazda Malaysia (MMSB) driven by exports. The all-new Mazda 6 is slated for launch in 3Q18 while CX-8 will only hit the market in 2QFY20 in CKD form. Management is still trying to list its 60.4%-owned Bermaz Auto Philippines (BAP) in the Philippines although there is no definite timeline yet. Given BAuto’s net cash position of RM261.5m (or 23 sen/share) and asset-light business model, we estimate a 75% payout for FY19-21, which represents attractive yields of 6.1-7.3%. Our target price is based on a 13x PE pegged to 2019F EPS.
UMW Holdings (UMWH MK/HOLD/RM6.07/Target: RM6.20). UMW reported a strong 1Q18 due to the strong comeback of its automobile segment where PBT rose 44.6% yoy on a stronger ringgit (despite a 14.3% yoy decline in sales). Its plans to increase its stake in Perodua via the acquisition of a 10% stake in Perodua from PNB, as well as a 50.1% stake in MBMR from Med-Bumikar Mara (49.5%) and Central Shore (0.57%), have hit a bump. Media reports indicated that the major impediment is Daihatsu’s objection to having UMW as the single largest shareholder of Perodua. According to The Edge Weekly, Daihatsu is adamant on this and has even threatened to stop all technological transfer to Perodua. Daihatsu has a 20.93% stake in Perodua a direct 20% stake and indirect stake of 0.93% via 18.5%-owned Daihatsu (Malaysia). Both acquisition proposals have been extended for the second time until end-Oct 18. Our target price implies 13.6x 2019F PE, which assumes UMW’s stake in Perodua at 48% post-completion of the 10% stake acquisition in Perodua from PNB. Entry price is RM5.80.
Fong Kah Yan
+603 2147 1993 [email protected]
Bermaz Auto is our top sector pick
Given its net cash position and asset-light business model, BAuto offers attractive yields of 6.1-7.3% based on 75% payout
UMW’s plan to raise its stake in Perodua via MBMR and PNB met with Daihatsu’s objection to having UMW as controlling shareholder of Perodua

M a l a y s i a S t r a t e g y July 2018
24
Sector At A Glance
FIGURE 43: DECADE-LONG AUTOMOBILE SALES CYCLE FIGURE 44: MARKET SHARE (5M18)
450
500
550
600
650
700
07 08 09 10 11 12 13 14 15 16 17
('000 units)
-15
-10
-5
0
5
10
15
20(%)
TIV (LHS) y oy % chg (RHS)
Perodua
43%
EURO
5%
Others
9%Mazda
2%Nissan
4%
Honda
18%
Toy ota
9%Proton
9%
Source: MAA, UOB Kay Hian Source: MAA
FIGURE 45: PERODUA SALES FIGURE 46: PROTON SALES
12
14
16
18
20
22
24
26
28
Jul 16 Jan 17 Jul 17 Jan 18
-30
-20
-10
0
10
20
30
40
50Sales (LHS) y oy % chg (RHS)
(%)('000 units)
\
3
4
5
6
7
8
9
Jul 16 Jan 17 Jul 17 Jan 18
-80
-60
-40
-20
0
20
40
60
80Sales (LHS) y oy % chg (RHS)
(%)('000 units)
Source: MAA Source: MAA
FIGURE 47: TOYOTA SALES FIGURE 48: HONDA SALES
123456789
10
Jul 16 Jan 17 Jul 17 Jan 18
-80-60-40-20020406080100
Sales (LHS)y oy % chg (RHS)
(%)('000 units)
456789
1011121314
Jul 16 Jan 17 Jul 17 Jan 18
-40
-20
0
20
40
60
80Sales (LHS)y oy % chg (RHS)
(%)('000 units)
Source: MAA Source: MAA FIGURE 49: SECTOR STATISTICS
Share Price Last Net Profit EPS PE Market BV Price/
Company Ticker Rec 5 Jul 18 Year 2017 2018F 2019F 2017 2018F 2019F 2017 2018F 2019F ROE Cap ps BV ps (RM) End (RMm) (RMm) (RMm) (sen) (sen) (sen) (x) (x) (x) (%) (RMm) (RM) (x)
Bermaz Auto BAUTO MK BUY 2.26 4/18 142 214 242 12.3 18.5 20.8 18.4 12.2 10.9 30.2 2,626 0.41 5.5
UMW Holdings UMWH MK HOLD 6.07 12/17 349 479 563 29.9 41.0 48.2 20.3 14.8 12.6 9.0 7,092 2.68 2.3
Sector 492 693 804 19.8 14.0 12.1 11.2 9,717 2.7
Note: If year end is before June, earnings are shown in the previous period. Source: Respective companies, Bloomberg, UOB Kay Hian

M a l a y s i a S t r a t e g y July 2018
25
Banking MARKET WEIGHT
WHY WE ARE MARKET WEIGHT
Loans growth to remain modest at 5.0-5.5%. Austerity measures by new government to create slight
downside risks on macro growth. Asset quality holding up better than expected. Healthy CET1 ratios post MFRS9 alleviate risk of equity
capital-raising.
WHAT TO WATCH OUT FOR IN 2H18
Gradual uptrend in provisions as MFRS9 takes effect. Time deposits to reprice upwards, placing a slight
pressure on sequential NIM. Automobile and consumer durable loans growth may
experience a short-term spike in 3Q18 in the absence of both GST and SST from Jun-Aug 18.
Rising bond yields to negatively impact marked-to-market gains with every 10bp change impacting sector earnings by 0.2%.
Outlook
FIGURE 50: BANKING INDEX OUTPERFORMS FBMKLCI
92
94
96
98
100102
104
106
108
110
112
Jan Feb Mar Apr May Jun Jul
Banking
FBMKLCI
End Dec 17=100
Source: Bloomberg, UOB Kay Hian
Outperforms FBMKLCI by 3.6% ytd. The banking sector has outperformed the FBMKLCI by 3.6% ytd. However, the sector had underperformed the FBMKLCI after the 14th general election (GE14), declining 9.5% vs the FBMKLCI’s 8.4% fall over the same period. The post GE14 selldown was notably intense for the likes of CIMB Group Holdings (CIMB) (-19.9%) and Malayan Banking (Maybank) (-15.6%) while large-cap non-GLC banks like Public Bank (PBank) and Hong Leong Bank (HLB), which are seen as more defensive (less directly affected by any slowdown in government-related project financing post GE14), registered milder 4.1% and 2.0% share price declines.
Defensiveness and bargain-hunting with cost rationalisation upside. Given this scenario, we advocate a two-pronged strategy to navigate the potentially volatile near-term sector outlook with a focus on banking stocks with defensive qualities and those that have been excessively sold down due to sentiment rather than material changes in fundamentals. In this respect, we like PBank for its defensive qualities and status as a proxy to the consumer and SME segments. We favour CIMB as we view its selldown as excessive given that its earnings growth is still expected to chart a double-digit recovery in FY18 on lower provisions, and it boasts attractive valuations. We also like BIMB Holdings (BIMB) for its attractive valuation and status as a proxy to stronger consumer purchasing power with 70% of its loans skewed to the consumer segment.
Sector underperforms broader market post GE14 due to downside risk in overall growth
Top picks: PBank, CIMB and BIMB

M a l a y s i a S t r a t e g y July 2018
26
Maintain MARKET WEIGHT. Post GE14 macro policy uncertainty could slightly dampen overall sector growth. Thus, the sector is unlikely to chart the same degree of outperformance as that prior to GE14. However, earnings downside risk is partly mitigated by strong cost discipline (+2% to +3%) and manageable credit cost growth. Given this scenario, the sector could mirror the FBMKLCI’s performance in 2H18 with a slight downside bias. Upside risk to our call could be an additional overnight policy rate (OPR) hike in 2H18 that would boost NIM.
CIMB’s selldown partly driven by misperception. We note that CIMB’s sharp selldown could be partly attributed to the perception that the group’s prospects may now be affected as Dato Seri Nazir Razak’s (Chairman of CIMB) brother (Dato Seri Najib Razak) is no longer the PM. This could be a misperception as: a) the group has been diversifying itself out of Malaysia which contributes only to 69% of PBT, b) its greater focus on consumer and commercial banking has resulted in investment and corporate banking PBT contributions declining to 28% of group PBT vs consumer banking’s 49%, and c) its major shareholders include major government sovereign wealth funds – Khazanah Nasional (26%), Employees Provident Fund (13%) and asset manager Permodalan Nasional (10%).
Current sector valuation is fair. Overall sector valuations have declined 9.5% post GE14 to 1.20x 2018F PBV which is fair against a forecasted ROE of 10.6%. Although P/B is at -1.0SD below 10-year historical mean of 1.60x, structurally ROE has compressed significantly from a high of 16.0%. PBank and CIMB remain our top picks, PBank for its defensive nature and CIMB as it has been excessively sold down driven largely by sentiment rather than a drastic change in fundamentals. The stock is now trading at -1SD on a PBV and PE basis. As for Maybank, we believe the Hyflux-related potential provision which could impact its FY18 earnings by up to 22% remains an overhang for the stock.
FIGURE 51: BANKS ROE VS P/B FIGURE 52: SECTOR EARNINGS GROWTH TREND
0.4
0.6
0.8
1.0
1.2
1.4
1.6
1.8
2.0
2.2
6 7 8 9 10 11 12 13 14 15 CY18F ROE (%)
BIMB
CY18F P/B (x )
Public Bank
Hong Leong Bank
CIMB
May bank Alliance
RHB
AMMB
Affin
Sector
4,800
5,000
5,200
5,400
5,600
5,800
6,000
6,200
6,400
6,600
6,800
1Q14 1Q15 1Q16 1Q17 1Q18
(RMb)
-15
-10
-5
0
5
10
15
20(%)
Net Profit (LHS)Grow th (RHS)
Source: Bloomberg, UOB Kay Hian Source: UOB Kay Hian
Near-term macro uncertainty could have a slight dampening effect on overall sector performance in 2H18
Misperception that prospects could be hurt with former PM, Dato Seri Najib Razak, stepping down
Sector valuation of 1.20x 2018F PBV is fair given prevailing ROE of 10.6%; PBank and CIMB remain our top picks and Maybank continues to show upside risk in provisions

M a l a y s i a S t r a t e g y July 2018
27
EARNINGS OUTLOOK AND TREND
Moderating earnings growth ahead. We expect sector earnings growth to moderate from 14.3% in 2017 to 9.7% in 2018 with sector ROE expected to register a marginal 4bp improvement to 10.6%. Our earnings growth assumption is driven by prevailing positive operating JAW, underpinned by well-controlled opex growth of only 3% vs revenue growth of 5% but partially offset by a mild rise in net credit cost to 35bp in 2018 vs 32bp in 2017.
Lower provisions, cost discipline and strong trading gains underpinned earnings. 1Q18 sector earnings expanded 12% yoy, driven largely by lower provisions (-10%), strong forex income growth which helped to underpin 11% yoy growth in non-interest income, and strong cost discipline (-0.1% yoy), partly driven by the deconsolidation of CIMB Securities’ international stock brokerage business (ex-CIMB, sector cost: +2.0% yoy).
Key revenue drivers were lacklustre with fee income expanding by a modest 1.4% yoy while net interest income contracted 1.0% yoy and 0.7% qoq despite the benefits of a 25bp OPR hike in 1Q18 due to stiffer-than-expected deposit competition.
Potential downside risk in earnings forecast. Assuming 1Q18’s strong forex and trading related non-interest income reverses, this could place downside risk on our 2018 non-interest income growth forecast of 7.6%, judging from 1Q18’s lacklustre net fee income growth of 1.0% yoy. Every 1ppt shortfall in non-interest income growth would impact our 2018 earnings growth forecast by 0.6ppt. Assuming the current lacklustre non-interest income trends persists for the rest of 2018, our current earnings growth forecast could decline from 9.7% to 5.7%.
FIGURE 53: KEY EARNINGS ASSUMPTION INDICATORS
2016 2017 2018F 2019F 2018F 2019F (RMm) (RMm) (RMm) (RMm) (% chg) (% chg)
Net Interest Income 38,842 41,177 43,271 45,620 5.1% 5.4%
Non-interest Income 18,613 19,891 21,401 22,854 7.6% 6.8%
Total Income 67,110 72,322 75,897 79,933 4.9% 5.3%
Operating Cost -32,748 -35,016 -36,122 -37,898 3.2% 4.9%
Pre-provision Operating Profit 34,361 37,306 40,775 43,636 9.3% 7.0%
Net Profit 21,332 24,454 26,824 28,724 9.7% 7.1%
Cost-to-Income Ratio 48.8% 48.4% 47.6% 47.4% -80bp -20bp
Credit Cost 38.9bp 31.2bp 34.5bp 35.2bp 3bp 1bp
Gross Impaired Loans Ratio 1.61% 1.53% 1.60% 1.62% 7bp 2bp
Loans Loss Coverage Ratio 90.2% 82.9% 102.1% 105.2% 192bp 31bp
ROE 9.5% 10.2% 10.6% 10.7% +40bp +10bp
Source: UOB Kay Hian
2018 earnings growth expected to moderate downwards to 9.7% from 14.3% in 2017
1Q18 earnings growth driven largely by lumpy forex gains and cost discipline
Core revenue indicators in the form of net interest income and fee income remained subdued
We see downside risk in fee income judging from 1Q18’s weak start and post GE14 market volatility and growth risk

M a l a y s i a S t r a t e g y July 2018
28
POTENTIALLY SOFTER NEAR-TERM GROWTH POST GE14
Short-term uncertainty to prevail. Potentially large spending cuts by the government to help plug the revenue gap arising from the abolishment of the Goods and Services Tax (GST), introduction of targeted fuel subsidies and reduction of overall government debts may have a near-term negative implication for the multiplier effect on GDP growth. As an example, after President Aquino of the Philippines won the 2010 general elections on an anti-corruption platform, GDP growth fell sharply to 3.6% in 2011 from 7.6% in 2010.
As the banking sector is veiwed as a proxy to overall GDP growth, any risk in a sharper-than-expected slowdown in our current GDP growth forecast of 5.0% for 2018 may have a negative spillover effect on the overall sentiment for the sector. Private investments may also suffer a temporary setback as businesses may choose to take a wait and see approach during the transition phase. We note that the mild recovery in overall loans growth from 4.1% in 2017 to the current growth rate of 4.5-4.8% was largely attributed to strong growth traction in construction-related loans which grew from 4.5% in 2017 to 11.0% yoy currently. Given the deferment of a number of mega infrastructure projects, we are expecting a sharp slowdown in construction-related loans growth which will offset the potential positive effect from stronger consumer spending on consumer-related loans growth (consumer durables and automobile).
Banks guiding for only a mild recovery in loans growth in 2018. It is too early to gauge the impact of loans growth post GE14 as potentially stronger automobile and consumer durable loans growth from the new government’s mandate to raise disposable income will be partially offset by slower construction- and government-related corporate loans growth and its multiplier effect on SME loans in the construction value chain. As such, most banks have continued to set a modest average domestic loans growth target of 5.0% yoy for 2018 (2017: +4.1%). Automobile loans (10% of total loans base) could experience a temporary uplift in growth in 3Q18 driven by the three-month “tax holiday” period before the implementation of the Sales and Services Tax (SST) which should result in higher car prices and hence downward normalisation of demand after the “tax holiday” period. This could provide a temporary 20bp uplift in overall loans growth, assuming a +2% growth in automobile loans vs the current -1%. However, this positive uplift will be partially offset by slower construction loans (3% of total loans base) growth (currently: +11%).
FIGURE 54: LOANS GROWTH TO GDP MULTIPLE TREND FIGURE 55: BANKS CONSUMER LOANS COMPOSITION
0.9
1.31.6
1.62.2
1.8
2.6
1.7
0.71.4
2.6
-5.2600
800
1,000
1,200
1,400
1,600
1,800
07 08 09 10 11 12 13 14 15 16 17 1Q18
(RMb)
-6
-4
-2
0
2
4
6(x )
Total Loan (LHS)Loan Grow th to GDP Grow th (RHS)
46.5
75.9
51.3
66.363.8
54.7
49.1 48.845.0
40
45
50
55
60
65
70
75
80
BIMB HLB PBB AMMB ABM CIMB RHB MAY AFFIN
(%)
Source: UOB Kay Hian AFFIN = Affin Bank, ABM = Alliance Bank Malaysia, AMMB = AMMB Holdings,
BIMB = BIMB Holdings, CIMB = CIMB Group Holdings, HLB = Hong Leong Bank, MAY = Malayan Banking, PBB = Public Bank, RHB = RHB Bank Source: UOB Kay Hian
Government spending cuts and market caution could pose near-term downside risks to macro growth and lead to softer-than-expected loans growth
Sharper than expected decline in GDP growth could impact loans growth and sentiment on the sector
Despite expectations of stronger purchasing power, we retain our modest loans growth recovery target for 2018 from a low 2017 base effect

M a l a y s i a S t r a t e g y July 2018
29
FIGURE 56: SECTOR LOANS GROWTH TREND FIGURE 57: SECTOR LOANS GROWTH BY KEY SEGMENTS REMAINS SUBDUED DESPITE LOW BASE
2
4
6
8
10
12
14
16
18
07 08 09 10 11 12 13 14 15 16 17 5M18
Total LoansBusiness LoansHousehold Loans
(%)
-5
0
5
10
15
20
25
30
07 08 09 10 11 12 13 14 15 16 17 5M18
Working Capital Non-residential PropertyResidential Property Hire Purchase
(%)
Source: UOB Kay Hian Source: UOB Kay Hian Forecasting modest recovery in 2018 loans growth to 5.0%. We are retaining our full-year industry loans growth of 5.0% in 2018 as slower construction-related loans growth is likely to be offset by stronger automobile and other consumer durable growth, especially in Jun-Aug 18 when goods will not be subjected to both GST and SST. Given the near record high household debts, persistent housing affordability issues and oversupply of commercial properties, we believe the new government’s mandate to improve consumer purchasing power is unlikely to provide a strong positive uplift to overall property demand in the near to medium term.
Loans approval growth staging a recovery on low base effect. The sector’s 4M18 loans application and approval growth were commendable at 9.4% and 7.7% respectively. However, overall loans approval rate by value remained low at 42% vs five-year average of 46% and 2017’s 45%. Approval rate for residential property loans by value remained largely unchanged at 42% vs 2017’s average of 41% and a mild improvement from the low of 40% in mid-16.
Potential relaxation of housing loans approval criteria from first-time homebuyers. The new Pakatan Harapan (PH) government has suggested that banks should relax lending guidelines for first-time homebuyers. This could come in the form of: a) a more relaxed debt service ratio (DSR) (currently three-quarters of borrowers with new loans approved in 2017 have DSR of less than 60% and Bank Negara Malaysia (BNM) only stipulates that borrowers in the more vulnerable RM3,000/month income bracket comply with a 60% DSR cap), and b) potential extension of the maximum tenure for housing loans from 35 years to 40. However, based on BNM’s financial prudence assesment, the majority of borrowers with negative financing margin (net income + liquid financial assets < cumulative debt obligation + basic expenditure) are typically borrowers with DSR of above 60% and/or individuals with income levels below RM5,000/month. Given that first-time homebuyers, notably those in the younger age group, would fall into the lower-income bracket, we think banks are unlikely to significantly relax DSR assesment on this segment of borrowers. That said, we do not discount the possibility of BNM raising the maximum tenure for housing loans back to 40 years, especially if a later official retirement age is introduced in the future.
Raising supply of affordable housing a more effective solution. However, this is not expected to significantly improve the affordability of housing, with an ample supply of affordable housing cited as the more effective solution to the problem. Currently, only 25% of new housing units launched by private developers are priced below RM250,000, which is inadequate to meet the demand from about one-third of buyers that can only afford houses below RM250,000.
Modest loans growth recovery of 5.0% in 2018 as construction-related loans growth is partly offset by stronger consumer loans
Loans approval rate by value remains low at 42%
Majority of borrowers with negative net financing margins has DSR of above 60%
Only 25% of new housing units launched by private developers are priced below RM250,000

M a l a y s i a S t r a t e g y July 2018
30
Loans approval growth emanating from potentially volatile loan segments. The 7.7% yoy growth in overall loans approval in 4M18 was driven by: a) loans for purchase of securities (+39% yoy), b) personal loans (+36% yoy), c) construction loans (+12.1% yoy), and d) loans for non-residential properties (+20% yoy) which may reverse post GE14 developments. Loans approvals from loans segments that are a better reflection of the overall economic and consumer sentiments like residential property, working capital and automobile loans were subdued, coming in at +4.0% yoy, -10.5% yoy and +2.6% yoy respectively.
FIGURE 58: KEY LOAN SEGMENT APPROVAL YOY GROWTH TRENDS – RESIDENTIAL PROPERTY DROVE RECOVERY IN 2017
FIGURE 59: LOANS APPROVAL RATE BY VALUE OF KEY LOAN SEGMENT TREND – 8M17 vs 2016
-50-40-30-20-10
0102030405060
Jan
16
Apr 16 Jul 16 Oct 16 Jan
17
Apr 17 Jul 17 Oct 17 Jan
18
Apr 18
Hire Purchase Residential PropertyNon-residential Property Working Capital
(%)
28
43
53
28
40
48
45
40
55
31
43
43
36
42
0 5 10 15 20 25 30 35 40 45 50 55 60
Hire Purchase
Residential Property
Non-residential Property
Personal Loan
Credit Cards
Working Capital
Total Banking Sector
20174M18
(%)
Source: BNM Source: BNM
Loans approval growth in 4M18 driven largely by loans for construction and purchase of securities

M a l a y s i a S t r a t e g y July 2018
31
LONGER-TERM UPSIDE IF NEW GOVERNMENT’S POLICIES EXECUTED WELL
Private sector’s upcoming role as major growth engine could benefit the likes of PBank and Alliance Bank Malaysia (Alliance Bank). The new government’s mandate is to instil greater transparency and reduce the cost of doing business. This should help fuel longer-term business confidence and hence private investment growth. Business loans growth has been lacklustre, growing at a modest 3.6% growth in 4M18 and 2.8% in 2017 (vs overall industry loans growth of 4.8% and 4.1% respectively). As the new government’s intention is to have the private sector act as a key growth engine while gradually de-emphasising its collaboration with the private sector, this should have positive implications for banks with strong SME franchises, like PBank, Alliance Bank and to a smaller extent HLB. However, this would take time to play out while the likes of PBank and HLB are already trading at relatively rich valuations, which implies that the market could have already partially priced in this longer-term upside potential.
FIGURE 60: SME LOANS COMPOSITION OF BANKS FIGURE 61: BUSINESS LOANS GROWTH REMAINS WEAK
198.5
270.9
337.1
225.9
394.5
149.5
230.0
180.9
139.1
100
150
200
250
300
350
400
450
PBB HLB MAY ABM CIMB RHB BIMB AMMB AFFIN
(RM000)
200
300
400
500
600
700
800
09 10 11 12 13 14 15 16 17 18
0
2
4
6
8
10
12
14
16
18Business Loans (LHS)Business Loans Grow th (RHS)
(RMb) (%)
Source: BNM Source: BNM Stronger all-round macro fundamentals driven by FDI. The ability of the new government to boost productive FDI will be key in allowing it to cut fiscal spending as required to reduce its heavy debt burden without hampering growth, while maintaining a vibrant employment market. This, coupled with improved labour productivity, provides an excellent platform to sustain solid macroeconomic fundamentals which will be positive for the overall banking sector as it will help drive strong consumer purchasing power and hence consumer demand for larger-ticket items (eg housing and automobile) and business loans from an increase in investments rather than pure working capital requirements.
Improvement in purchasing power to benefit consumer-centric banks. The new government’s mandate to raise the disposable income of the masses should translate into stronger purchasing power in the longer term. This bodes well for consumer-centric banks like PBank, HLB and BIMB. We like PBank as it is in the right segments with its loans composition heavily skewed to the consumer and SME segments (86% of domestic loans books). We believe automobile loans (15.6% of PBank’s loans base vs industry’s 10.0%) and SME loans in the wholesale and retail trade segments (8.4% of PBank’s loans base vs industry’s 7.2%) could see a more immediate uplift in growth while improvement in the affordability of residential property would require a longer period as affordability remains a structural issue that can only be solved through more supply of affordable housing units.
Stronger longer-term private investment growth should benefit banks with strong SME franchises, eg PBank, Alliance Bank
Potential for stronger long-term FDI growth from more transparent government policies positive for sector growth
Structural improvement in purchasing power to benefit the likes of PBank, HLBK and BIMB
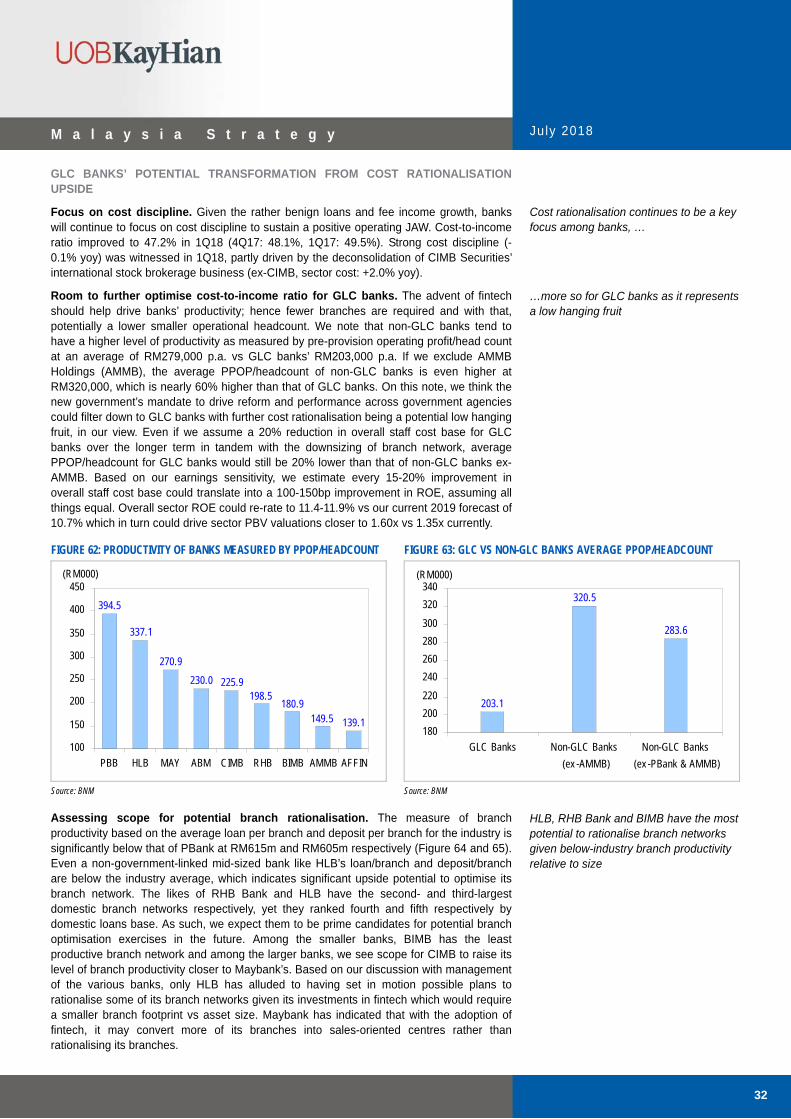
M a l a y s i a S t r a t e g y July 2018
32
GLC BANKS’ POTENTIAL TRANSFORMATION FROM COST RATIONALISATION UPSIDE
Focus on cost discipline. Given the rather benign loans and fee income growth, banks will continue to focus on cost discipline to sustain a positive operating JAW. Cost-to-income ratio improved to 47.2% in 1Q18 (4Q17: 48.1%, 1Q17: 49.5%). Strong cost discipline (-0.1% yoy) was witnessed in 1Q18, partly driven by the deconsolidation of CIMB Securities’ international stock brokerage business (ex-CIMB, sector cost: +2.0% yoy).
Room to further optimise cost-to-income ratio for GLC banks. The advent of fintech should help drive banks’ productivity; hence fewer branches are required and with that, potentially a lower smaller operational headcount. We note that non-GLC banks tend to have a higher level of productivity as measured by pre-provision operating profit/head count at an average of RM279,000 p.a. vs GLC banks’ RM203,000 p.a. If we exclude AMMB Holdings (AMMB), the average PPOP/headcount of non-GLC banks is even higher at RM320,000, which is nearly 60% higher than that of GLC banks. On this note, we think the new government’s mandate to drive reform and performance across government agencies could filter down to GLC banks with further cost rationalisation being a potential low hanging fruit, in our view. Even if we assume a 20% reduction in overall staff cost base for GLC banks over the longer term in tandem with the downsizing of branch network, average PPOP/headcount for GLC banks would still be 20% lower than that of non-GLC banks ex-AMMB. Based on our earnings sensitivity, we estimate every 15-20% improvement in overall staff cost base could translate into a 100-150bp improvement in ROE, assuming all things equal. Overall sector ROE could re-rate to 11.4-11.9% vs our current 2019 forecast of 10.7% which in turn could drive sector PBV valuations closer to 1.60x vs 1.35x currently.
FIGURE 62: PRODUCTIVITY OF BANKS MEASURED BY PPOP/HEADCOUNT FIGURE 63: GLC VS NON-GLC BANKS AVERAGE PPOP/HEADCOUNT
198.5
270.9
337.1
225.9
394.5
149.5
230.0
180.9
139.1
100
150
200
250
300
350
400
450
PBB HLB MAY ABM CIMB RHB BIMB AMMB AFFIN
(RM000)
203.1
320.5
283.6
180
200
220
240
260
280
300
320
340
GLC Banks Non-GLC Banks
(ex -AMMB)
Non-GLC Banks
(ex -PBank & AMMB)
(RM000)
Source: BNM Source: BNM Assessing scope for potential branch rationalisation. The measure of branch productivity based on the average loan per branch and deposit per branch for the industry is significantly below that of PBank at RM615m and RM605m respectively (Figure 64 and 65). Even a non-government-linked mid-sized bank like HLB’s loan/branch and deposit/branch are below the industry average, which indicates significant upside potential to optimise its branch network. The likes of RHB Bank and HLB have the second- and third-largest domestic branch networks respectively, yet they ranked fourth and fifth respectively by domestic loans base. As such, we expect them to be prime candidates for potential branch optimisation exercises in the future. Among the smaller banks, BIMB has the least productive branch network and among the larger banks, we see scope for CIMB to raise its level of branch productivity closer to Maybank’s. Based on our discussion with management of the various banks, only HLB has alluded to having set in motion possible plans to rationalise some of its branch networks given its investments in fintech which would require a smaller branch footprint vs asset size. Maybank has indicated that with the adoption of fintech, it may convert more of its branches into sales-oriented centres rather than rationalising its branches.
Cost rationalisation continues to be a key focus among banks, …
…more so for GLC banks as it represents a low hanging fruit
HLB, RHB Bank and BIMB have the most potential to rationalise branch networks given below-industry branch productivity relative to size

M a l a y s i a S t r a t e g y July 2018
33
FIGURE 64: LOANS PER BRANCH FIGURE 65: DEPOSITS PER BRANCH
275
430443
548555576
685
796
1,090
200
300
400
500
600
700
800
900
1000
1100
1200
PBB MAY CIMB RHB ABM AMMB HLB AFFIN BIMB
(RMm)
Av erage ex -PB Bank: RM615m
314
476547572
1,233
928855
598 583
200
400
600
800
1000
1200
1400
PBB MAY CIMB RHB AMMB ABM HLB AFFIN BIMB
(RMm)
Av erage ex -PB Bank: RM605m
Source: BNM Source: BNM
FIGURE 66: BANKS NUMBER OF DOMESTIC BRANCHES FIGURE 67: BANKS DOMESTIC LOANS BASE
259
363
284 278 276
175145
10794
50
100
150
200
250
300
350
400
MAY HLB RHB CIMB PBB AMMB BIMB AFFIN ABM
No. of Domestic Branches
189
289 282
160
12696
52 46 40
0
50
100
150
200
250
300
350
MAY PBB CIMB RHB HLB AMMB ABM AFFIN BIMB
(RMb)
Source: BNM Source: BNM
CIMB has started the ball rolling. Among GLC banks, CIMB has executed the most aggressive cost rationalisation exercise over the past three years (staff voluntary separation scheme, 50% stake sale of CIMB Securities, closure of some regional investment banking units acquired from RBS). This has led to a fall in its cost-to-income ratio from the peak of 60% to 51% currently, reflecting the sharpest improvement among GLC banks. Despite the sharp improvement in cost-to-income ratio, we see further scope for improvement given management’s: a) recent cost rationalisation execution track record, and b) target to reduce cost-to-income ratio closer to the industry average of 48% without discounting the possibility of more aggressive future cost rationalisation should revenue growth fall behind targets.

M a l a y s i a S t r a t e g y July 2018
34
FIGURE 68: GLC BANKS COST-TO-INCOME RATIO TRENDS FIGURE 69: INDUSTRY COST-TO-INCOME RATIO TREND
45
50
55
60
65
70
75
1Q16 2Q16 3Q16 4Q16 1Q17 2Q17 3Q17 4Q17 1Q18
May bank RHBCIMB BIMBAMMB Affin
(%)
48.0
48.5
49.0
49.5
50.0
50.5
51.0
1Q16 2Q16 3Q16 4Q16 1Q17 2Q17 3Q17 4Q17 1Q18
(%)
Source: UOB Kay Hian Source: UOB Kay Hian
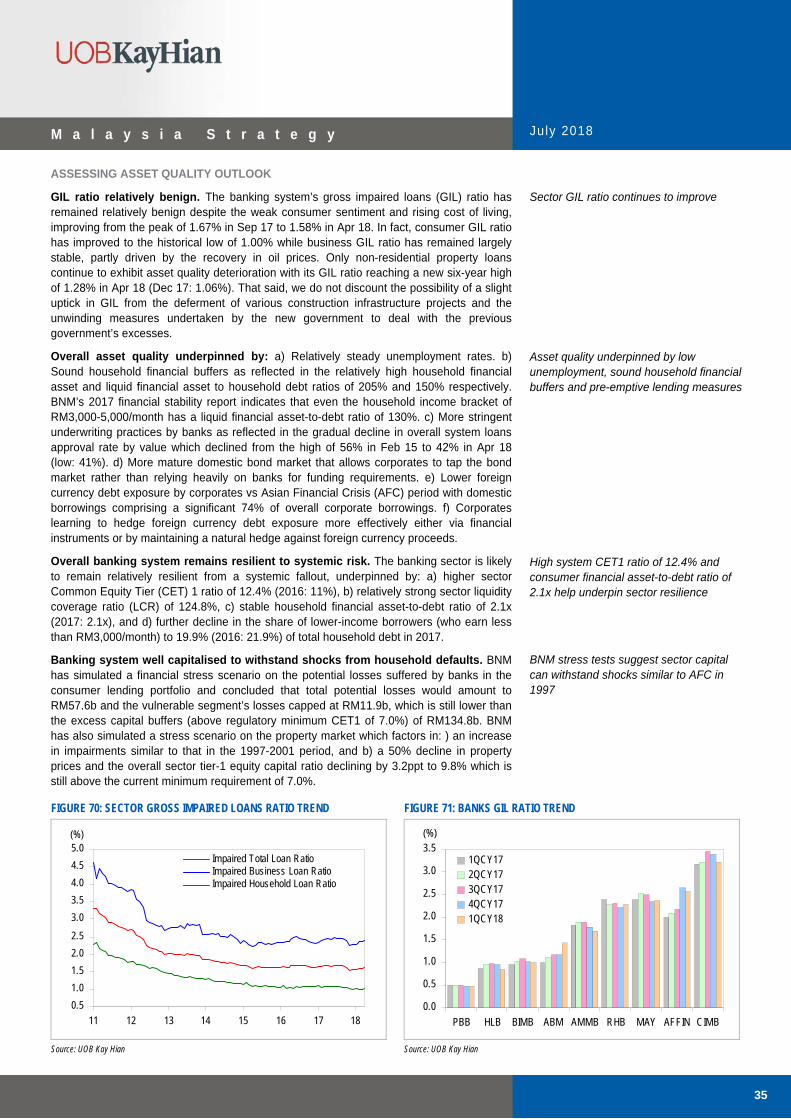
M a l a y s i a S t r a t e g y July 2018
35
ASSESSING ASSET QUALITY OUTLOOK
GIL ratio relatively benign. The banking system’s gross impaired loans (GIL) ratio has remained relatively benign despite the weak consumer sentiment and rising cost of living, improving from the peak of 1.67% in Sep 17 to 1.58% in Apr 18. In fact, consumer GIL ratio has improved to the historical low of 1.00% while business GIL ratio has remained largely stable, partly driven by the recovery in oil prices. Only non-residential property loans continue to exhibit asset quality deterioration with its GIL ratio reaching a new six-year high of 1.28% in Apr 18 (Dec 17: 1.06%). That said, we do not discount the possibility of a slight uptick in GIL from the deferment of various construction infrastructure projects and the unwinding measures undertaken by the new government to deal with the previous government’s excesses.
Overall asset quality underpinned by: a) Relatively steady unemployment rates. b) Sound household financial buffers as reflected in the relatively high household financial asset and liquid financial asset to household debt ratios of 205% and 150% respectively. BNM’s 2017 financial stability report indicates that even the household income bracket of RM3,000-5,000/month has a liquid financial asset-to-debt ratio of 130%. c) More stringent underwriting practices by banks as reflected in the gradual decline in overall system loans approval rate by value which declined from the high of 56% in Feb 15 to 42% in Apr 18 (low: 41%). d) More mature domestic bond market that allows corporates to tap the bond market rather than relying heavily on banks for funding requirements. e) Lower foreign currency debt exposure by corporates vs Asian Financial Crisis (AFC) period with domestic borrowings comprising a significant 74% of overall corporate borrowings. f) Corporates learning to hedge foreign currency debt exposure more effectively either via financial instruments or by maintaining a natural hedge against foreign currency proceeds.
Overall banking system remains resilient to systemic risk. The banking sector is likely to remain relatively resilient from a systemic fallout, underpinned by: a) higher sector Common Equity Tier (CET) 1 ratio of 12.4% (2016: 11%), b) relatively strong sector liquidity coverage ratio (LCR) of 124.8%, c) stable household financial asset-to-debt ratio of 2.1x (2017: 2.1x), and d) further decline in the share of lower-income borrowers (who earn less than RM3,000/month) to 19.9% (2016: 21.9%) of total household debt in 2017.
Banking system well capitalised to withstand shocks from household defaults. BNM has simulated a financial stress scenario on the potential losses suffered by banks in the consumer lending portfolio and concluded that total potential losses would amount to RM57.6b and the vulnerable segment’s losses capped at RM11.9b, which is still lower than the excess capital buffers (above regulatory minimum CET1 of 7.0%) of RM134.8b. BNM has also simulated a stress scenario on the property market which factors in: ) an increase in impairments similar to that in the 1997-2001 period, and b) a 50% decline in property prices and the overall sector tier-1 equity capital ratio declining by 3.2ppt to 9.8% which is still above the current minimum requirement of 7.0%.
FIGURE 70: SECTOR GROSS IMPAIRED LOANS RATIO TREND FIGURE 71: BANKS GIL RATIO TREND
0.5
1.0
1.5
2.0
2.5
3.0
3.5
4.0
4.5
5.0
11 12 13 14 15 16 17 18
(%)
Impaired Total Loan RatioImpaired Business Loan RatioImpaired Household Loan Ratio
0.0
0.5
1.0
1.5
2.0
2.5
3.0
3.5
PBB HLB BIMB ABM AMMB RHB MAY AFFIN CIMB
1QCY172QCY173QCY174QCY171QCY18
(%)
Source: UOB Kay Hian Source: UOB Kay Hian
Sector GIL ratio continues to improve
Asset quality underpinned by low unemployment, sound household financial buffers and pre-emptive lending measures
High system CET1 ratio of 12.4% and consumer financial asset-to-debt ratio of 2.1x help underpin sector resilience
BNM stress tests suggest sector capital can withstand shocks similar to AFC in 1997
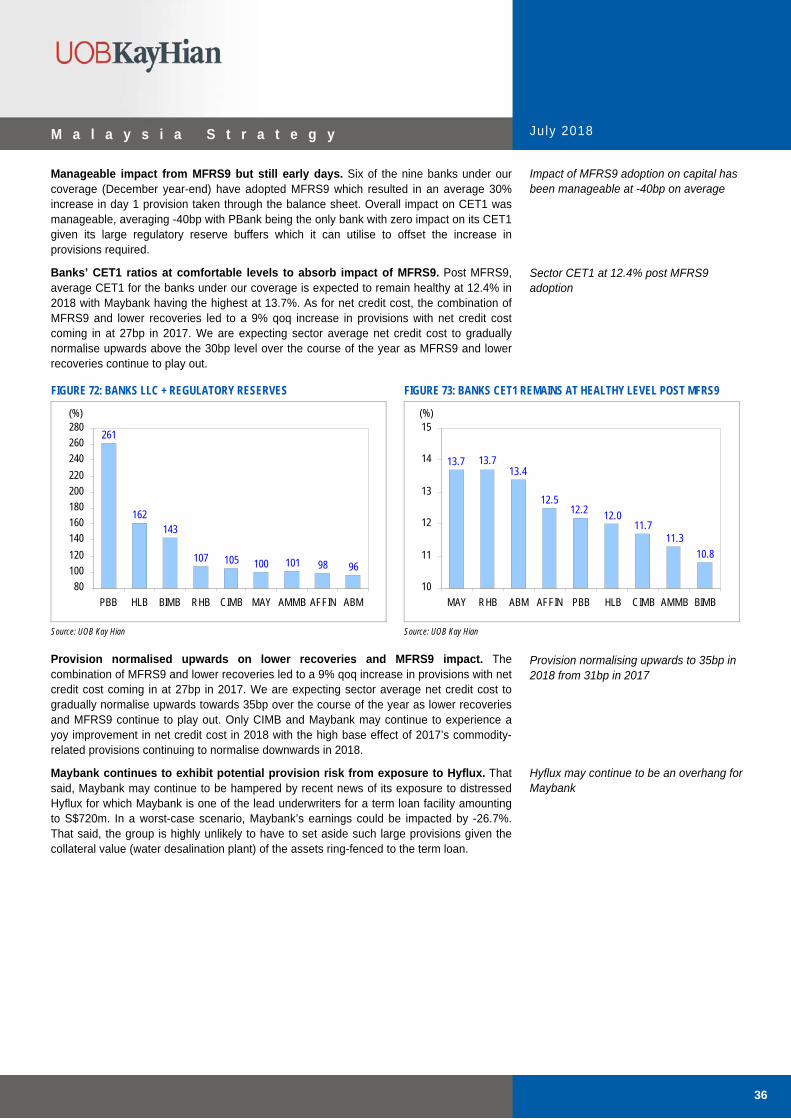
M a l a y s i a S t r a t e g y July 2018
36
Manageable impact from MFRS9 but still early days. Six of the nine banks under our coverage (December year-end) have adopted MFRS9 which resulted in an average 30% increase in day 1 provision taken through the balance sheet. Overall impact on CET1 was manageable, averaging -40bp with PBank being the only bank with zero impact on its CET1 given its large regulatory reserve buffers which it can utilise to offset the increase in provisions required.
Banks’ CET1 ratios at comfortable levels to absorb impact of MFRS9. Post MFRS9, average CET1 for the banks under our coverage is expected to remain healthy at 12.4% in 2018 with Maybank having the highest at 13.7%. As for net credit cost, the combination of MFRS9 and lower recoveries led to a 9% qoq increase in provisions with net credit cost coming in at 27bp in 2017. We are expecting sector average net credit cost to gradually normalise upwards above the 30bp level over the course of the year as MFRS9 and lower recoveries continue to play out.
FIGURE 72: BANKS LLC + REGULATORY RESERVES FIGURE 73: BANKS CET1 REMAINS AT HEALTHY LEVEL POST MFRS9
9698101100105107
143162
261
80
100
120
140
160
180
200
220
240
260
280
PBB HLB BIMB RHB CIMB MAY AMMB AFFIN ABM
(%)
13.7 13.713.4
12.512.2 12.0
11.711.3
10.8
10
11
12
13
14
15
MAY RHB ABM AFFIN PBB HLB CIMB AMMB BIMB
(%)
Source: UOB Kay Hian Source: UOB Kay Hian Provision normalised upwards on lower recoveries and MFRS9 impact. The combination of MFRS9 and lower recoveries led to a 9% qoq increase in provisions with net credit cost coming in at 27bp in 2017. We are expecting sector average net credit cost to gradually normalise upwards towards 35bp over the course of the year as lower recoveries and MFRS9 continue to play out. Only CIMB and Maybank may continue to experience a yoy improvement in net credit cost in 2018 with the high base effect of 2017’s commodity-related provisions continuing to normalise downwards in 2018.
Maybank continues to exhibit potential provision risk from exposure to Hyflux. That said, Maybank may continue to be hampered by recent news of its exposure to distressed Hyflux for which Maybank is one of the lead underwriters for a term loan facility amounting to S$720m. In a worst-case scenario, Maybank’s earnings could be impacted by -26.7%. That said, the group is highly unlikely to have to set aside such large provisions given the collateral value (water desalination plant) of the assets ring-fenced to the term loan.
Impact of MFRS9 adoption on capital has been manageable at -40bp on average
Sector CET1 at 12.4% post MFRS9 adoption
Provision normalising upwards to 35bp in 2018 from 31bp in 2017
Hyflux may continue to be an overhang for Maybank

M a l a y s i a S t r a t e g y July 2018
37
FIGURE 74: AGGREGATE SYSTEM NET CREDIT COST STABILISED BUT EXPECTED TO NORMALISE UPWARDS WITH MFRS9 IMPLEMENTATION FIGURE 75: BANKS THAT HAVE ADOPTED MFRS9 SAW LLC RISE IN 1Q18
16.8
16.7
29.3
28.6
33.1
33.6
39.3
43.3
17.2
31.825.6
41.0
30.6
41.0
27.0
25.0
32.0
10
15
20
25
30
35
40
45
50
1Q14 1Q15 1Q16 1Q17 1Q18
(bp)
20
40
60
80
100
120
140
160
180
200
AFFIN AMMB ABM RHB MAY CIMB HLB PBB BIMB
1QCY172QCY173QCY174QCY171QCY18
(%)
Source: UOB Kay Hian Source: UOB Kay Hian
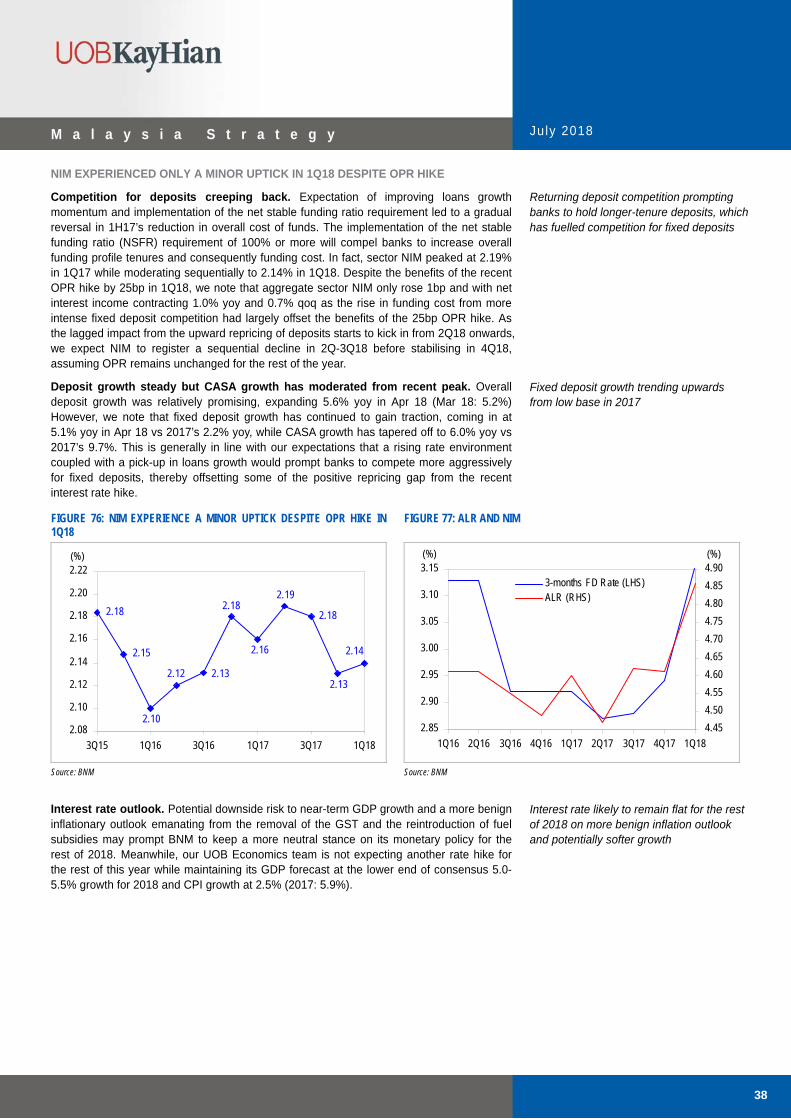
M a l a y s i a S t r a t e g y July 2018
38
NIM EXPERIENCED ONLY A MINOR UPTICK IN 1Q18 DESPITE OPR HIKE
Competition for deposits creeping back. Expectation of improving loans growth momentum and implementation of the net stable funding ratio requirement led to a gradual reversal in 1H17’s reduction in overall cost of funds. The implementation of the net stable funding ratio (NSFR) requirement of 100% or more will compel banks to increase overall funding profile tenures and consequently funding cost. In fact, sector NIM peaked at 2.19% in 1Q17 while moderating sequentially to 2.14% in 1Q18. Despite the benefits of the recent OPR hike by 25bp in 1Q18, we note that aggregate sector NIM only rose 1bp and with net interest income contracting 1.0% yoy and 0.7% qoq as the rise in funding cost from more intense fixed deposit competition had largely offset the benefits of the 25bp OPR hike. As the lagged impact from the upward repricing of deposits starts to kick in from 2Q18 onwards, we expect NIM to register a sequential decline in 2Q-3Q18 before stabilising in 4Q18, assuming OPR remains unchanged for the rest of the year.
Deposit growth steady but CASA growth has moderated from recent peak. Overall deposit growth was relatively promising, expanding 5.6% yoy in Apr 18 (Mar 18: 5.2%) However, we note that fixed deposit growth has continued to gain traction, coming in at 5.1% yoy in Apr 18 vs 2017’s 2.2% yoy, while CASA growth has tapered off to 6.0% yoy vs 2017’s 9.7%. This is generally in line with our expectations that a rising rate environment coupled with a pick-up in loans growth would prompt banks to compete more aggressively for fixed deposits, thereby offsetting some of the positive repricing gap from the recent interest rate hike.
FIGURE 76: NIM EXPERIENCE A MINOR UPTICK DESPITE OPR HIKE IN1Q18
FIGURE 77: ALR AND NIM
2.12
2.14
2.10
2.13
2.18
2.19
2.16
2.18
2.13
2.15
2.18
2.08
2.10
2.12
2.14
2.16
2.18
2.20
2.22
3Q15 1Q16 3Q16 1Q17 3Q17 1Q18
(%)
2.85
2.90
2.95
3.00
3.05
3.10
3.15
1Q16 2Q16 3Q16 4Q16 1Q17 2Q17 3Q17 4Q17 1Q18
4.45
4.50
4.55
4.60
4.65
4.70
4.75
4.80
4.85
4.903-months FD Rate (LHS)ALR (RHS)
(%) (%)
Source: BNM Source: BNM
Interest rate outlook. Potential downside risk to near-term GDP growth and a more benign inflationary outlook emanating from the removal of the GST and the reintroduction of fuel subsidies may prompt BNM to keep a more neutral stance on its monetary policy for the rest of 2018. Meanwhile, our UOB Economics team is not expecting another rate hike for the rest of this year while maintaining its GDP forecast at the lower end of consensus 5.0-5.5% growth for 2018 and CPI growth at 2.5% (2017: 5.9%).
Returning deposit competition prompting banks to hold longer-tenure deposits, which has fuelled competition for fixed deposits
Fixed deposit growth trending upwards from low base in 2017
Interest rate likely to remain flat for the rest of 2018 on more benign inflation outlook and potentially softer growth

M a l a y s i a S t r a t e g y July 2018
39
Strategy
Maintain MARKET WEIGHT. Post GE14 macro policy uncertainty could have a slight dampening effect on overall sector growth. As such, the sector is unlikely to chart the same degree of outperformance seen prior to GE14. However, earnings downside risk is partly mitigated by strong cost discipline (+2% to +3%) and manageable credit cost growth. Overall sector valuations have declined 11% post GE14 to 1.20x 2018F PBV which is fair against a forecasted ROE of 10.6%. Although P/B is at -1.0SD below 10-year historical mean of 1.60x, structurally ROE has compressed significantly from a high of 16.0%.
Defensiveness and bargain-hunting with cost rationalisation upside. Given this scenario, we advocate a two-pronged strategy to navigate the potentially volatile near-term sector outlook with a focus on banking stocks with defensive qualities and those that have been excessively sold down due to sentiment rather than material changes in fundamentals. In this respect, we like PBank for its defensive qualities and status as a proxy to the consumer and SME segments. We also favour CIMB as we believe its selldown has been excessive with the group still expected to chart a double-digit earnings growth recovery in FY18 on the back of lower provisions, and it boasts appealing valuations. We also like BIMB given its attractive valuations and status as a proxy to stronger consumer purchasing power with 70% of its loans skewed to the consumer segment.
Top picks:
Public Bank (PBK MK/BUY/RM/Target: RM25.20) should be a prime beneficiary of the new government’s policies in raising disposable income and private sector growth over the longer term given its consumer- and SME-centric loans base. Current valuations have also declined to -1SD below its long-term mean PE while greater earnings resilience in the current period of uncertainty should warrant a larger valuation premium to peers. Although foreign shareholding remained high at 39.0% as at end May 18, we believe stability in share price will eventually be anchored by the group’s more resilient earnings outlook in the light of the new government’s fiscal spending cuts. PBank’s construction- and government-related loans constitute 2.0% and 0.4% of its total loans base respectively vs sector average of 4% and 2% respectively. This will also place the group in a better position to contain any potential lumpy NPL risk emanating from the review/cancellation of various infrastructure projects
CIMB Group Holdings (CIMB MK/BUY/RM/Target: RM7.40). Despite the potential risk of a slower domestic corporate loans growth trend and weaker near-term investment banking income outlook, given the heightened capital market volatility, we think current valuations at below -1SD to its long-term mean PE and PBV have priced in the abovementioned earnings risks. We continue to project an above-industry earnings growth of 16% for FY18 driven by a downward normalisation in credit cost to 56bp vs FY17’s 76bp. The stock continues to trade at an attractive 10.1x FY18F PE (five-year historical mean of 13.3x) and 0.97x FY18F P/B (historical mean of 1.20x).
BIMB Holdings (BIMB MK/BUY/RM/Target: RM4.85). BIMB should also be a beneficiary of stronger consumer purchasing power as 70% of its portfolio is skewed to consumer loans. 1QFY18 net profit was above our estimates due to broad-based revenue growth drivers from net interest income to fee income. As such, revenue growth was commendable, expanding 5.3% qoq and 9.0% yoy. Maintain BUY and target price of RM4.85 (13.2% FY18 ROE, 1.64x FY18F PBV). The stock is trading at an attractive 1.33x FY18F PBV vs 13.2% ROE.
Keith Wee +603 2147 1981
Focus on banks with strong defensive qualities and above-sector growth
Top picks: PBank, CIMB and BIMB PBank: Strong defensive qualities, proxy to potentially stronger consumer and SME growth in line with government focus
CIMB: Strong earnings growth from lower provisions coupled with appealing valuations at 0.97x FY18 PBV)
BIMB: Attractive valuations, proxy to potential for stronger consumer purchasing power with government mandate to increase masses’ disposable income

M a l a y s i a S t r a t e g y July 2018
40
Sector At A Glance
FIGURE 78: SOFTER LOANS GROWTH FIGURE 79: LOANS APPROVAL
456789
1011121314
06 07 08 09 10 11 12 13 14 15 16 17 18
-8
-6
-4
-2
0
2
4
6
8(y oy % chg)
Loan Grow th (LHS)
(%)
Malay sia Economic
Leading Index (RHS)
5
10
15
20
25
30
06 07 08 09 10 11 12 13 14 15 16 17 18
(RMb)
HouseholdBusiness
Source: BNM Source: BNM
FIGURE 80: IMPAIRED LOAN RATIO OF KEY SEGMENTS FIGURE 81: BENIGN IMPAIRED LOAN TRENDS
0
1
2
3
4
5
6
7
09 10 11 12 13 14 15 16 17 18
Residential PropertyNon-residential PropertyHire PurchasePersonal UsesWorking Capital
(%)
0
1
2
3
4
5
6
09 10 11 12 13 14 15 16 17 18
TotalHouseholdBusiness
(%)
Source: BNM Source: BNM
FIGURE 82: NIM UNDER PRESSURE FIGURE 83: RISING LDR TREND TO PRESSURE NIM
2.0
2.2
2.4
2.6
2.8
3.0
3.2
3.4
3.6
00 02 04 06 08 10 12 14 16
4.0
4.5
5.0
5.5
6.0
6.5
7.0
7.5
8.0(%) (%)
ALR (RHS)
NIM (LHS)
600
800
1,000
1,200
1,400
1,600
1,800
2,000
07 08 09 10 11 12 13 14 15 16 17 5M18
(RMb)
73757779818385878991(%)
Deposit (LHS)Loan (LHS)LDR (RHS)
Source: BNM, UOB Kay Hian Source: BNM
FIGURE 84: SECTOR STATISTICS
Share Price Last Net Profit EPS PE ROE Market BV ps Price/ Company Ticker Rec 5 Jul 18 Year 2017 2018F 2019F 2017 2018F 2019F 2017 2018F 2019F 2018F Cap 2018F BV ps (RM) End (RMm) (RMm) (RMm) (sen) (sen) (sen) (x) (x) (x) (%) (RMm) (RM) (x)
Affin ABANK MK HOLD 2.56 12/17 566 537 548 29.1 27.6 28.2 8.8 9.3 9.1 6.1 4,974 4.39 0.6 Alliance Financial ABMB MK HOLD 4.21 3/18 493 558 605 31.9 36.0 39.1 13.2 11.7 10.8 10.1 6,518 3.58 1.2 AMMB AMM MK HOLD 3.78 3/18 1,278 1,318 1,412 42.4 43.7 46.9 8.9 8.6 8.1 7.8 11,394 5.73 0.7 BIMB BIMB MK BUY 3.78 12/17 620 641 674 36.6 37.9 39.8 10.3 10.0 9.5 13.7 6,402 2.96 1.3 CIMB Group CIMB MK BUY 5.53 12/17 4,475 5,217 5,736 47.8 55.7 61.2 11.6 9.9 9.0 10.5 51,793 5.59 1.0 Hong Leong Bank HLBK MK HOLD 18.24 6/17 2,248 2,544 2,670 109.9 124.4 130.5 16.6 14.7 14.0 10.8 37,312 12.20 1.5 Hong Leong Financial HLFG MK BUY 17.78 6/17 1,507 1,776 1,919 131.6 155.1 167.6 13.5 11.5 10.6 11.0 20,362 15.86 1.1 Maybank MAY MK HOLD 9.03 12/17 7,336 7,754 8,243 67.1 70.9 75.4 13.5 12.7 12.0 10.3 98,705 7.20 1.3 Public Bank PBK MK BUY 22.90 12/17 5,470 5,843 6,277 140.9 150.5 161.7 16.3 15.2 14.2 15.1 88,901 10.26 2.2 RHB Bank RHBBANK MK HOLD 5.35 12/17 1,950 2,219 2,350 48.6 55.3 58.6 11.0 9.7 9.1 9.2 21,454 6.21 0.9 Sector 25,943 28,408 30,435 13.4 12.2 11.4 10.5 347,813 1.2
Source: Respective companies, Bloomberg, UOB Kay Hian

M a l a y s i a S t r a t e g y July 2018
41
Building Materials MARKET WEIGHT
WHY WE ARE MARKET WEIGHT
Recovery in cement and steel expected to be slower. Incoming supply of steel may exceed demand. Limited upside from steel industry consolidation in China.
WHAT TO WATCH OUT FOR IN 2H18
Risk of deferment or cancellation of various mega projects.
Commencement of Alliance Steel’s plant and resumption of Lion Industries Corporation’s plants.
Outlook
FIGURE 85: BUILDING MATERIALS INDEX UNDERPERFORMS FBMKLCI
40
50
60
70
80
90
100
110
Jan Feb Mar Apr May Jun Jul
CementFBMKLCIAluminiumSteel
End Dec 17=100
Source: Bloomberg, UOB Kay Hian
Underperforms FBMKLCI ytd. The sector has underperformed the FBMKLCI ytd given the derating of the construction sector following the 14th general election (GE14). Ytd share prices for steel companies are under pressure with Ann Joo Resources (Ann Joo) sliding down 52% and Choo Bee Metal Industries (Choo Bee) down 12.8% given the sluggish domestic and overseas outlook. Meanwhile, the cement segment is still struggling with depressed earnings due to industry overcapacity and weak demand. Key players in the industry, such as Hume Industries, Lafarge Malaysia and Tasek Corporation have seen share prices contract by 50.9%, 50.5% and 42.5% ytd respectively.
Gloomy outlook post GE14. The historic GE14 saw a sudden change in direction for construction companies, and building material players were not spared. One of the new Pakatan Harapan (PH) government’s manifestos is to review mega and infrastructure projects that are not beneficial to the country. A decision has been made to postpone the Kuala Lumpur-Singapore High Speed Rail (HSR) and scrap Mass Rapid Transit Line 3 (MRT 3). The government is also reviewing other projects such as East Coast Rail Way (ECRL) and Pan Borneo Highway (PBH). The government’s move will cause a major hiccup in steel and cement demand for which we had earlier expected to pick up by 2H18.
Export markets as substitution. We gather that local steel players are looking abroad in order to partially mitigate the impact of soft steel demand in the local market. Some local steel players are eyeing Thailand and Indonesia where demand is high and prices are competitive. We note that although international prices remain strong, local steel players may face stiff competition regionally amid strong supply from other regions, which may affect export margins.
Derating of building materials sector following cancellation of mega and infrastructure projects
Slower-than-expected recovery in steel demand from delayed construction activities
Export markets could provide an alternative but competition is also stiff
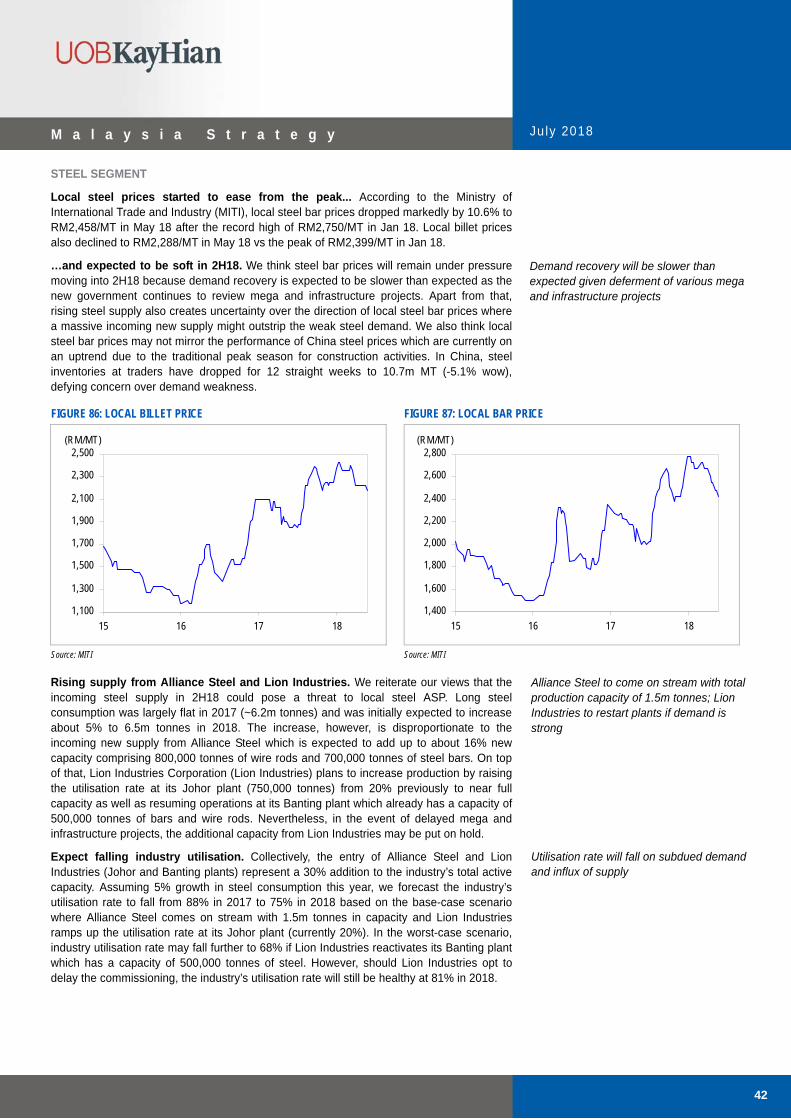
M a l a y s i a S t r a t e g y July 2018
42
STEEL SEGMENT
Local steel prices started to ease from the peak... According to the Ministry of International Trade and Industry (MITI), local steel bar prices dropped markedly by 10.6% to RM2,458/MT in May 18 after the record high of RM2,750/MT in Jan 18. Local billet prices also declined to RM2,288/MT in May 18 vs the peak of RM2,399/MT in Jan 18.
…and expected to be soft in 2H18. We think steel bar prices will remain under pressure moving into 2H18 because demand recovery is expected to be slower than expected as the new government continues to review mega and infrastructure projects. Apart from that, rising steel supply also creates uncertainty over the direction of local steel bar prices where a massive incoming new supply might outstrip the weak steel demand. We also think local steel bar prices may not mirror the performance of China steel prices which are currently on an uptrend due to the traditional peak season for construction activities. In China, steel inventories at traders have dropped for 12 straight weeks to 10.7m MT (-5.1% wow), defying concern over demand weakness.
FIGURE 86: LOCAL BILLET PRICE FIGURE 87: LOCAL BAR PRICE
1,100
1,300
1,500
1,700
1,900
2,100
2,300
2,500
15 16 17 18
(RM/MT)
1,400
1,600
1,800
2,000
2,200
2,400
2,600
2,800
15 16 17 18
(RM/MT)
Source: MITI Source: MITI Rising supply from Alliance Steel and Lion Industries. We reiterate our views that the incoming steel supply in 2H18 could pose a threat to local steel ASP. Long steel consumption was largely flat in 2017 (~6.2m tonnes) and was initially expected to increase about 5% to 6.5m tonnes in 2018. The increase, however, is disproportionate to the incoming new supply from Alliance Steel which is expected to add up to about 16% new capacity comprising 800,000 tonnes of wire rods and 700,000 tonnes of steel bars. On top of that, Lion Industries Corporation (Lion Industries) plans to increase production by raising the utilisation rate at its Johor plant (750,000 tonnes) from 20% previously to near full capacity as well as resuming operations at its Banting plant which already has a capacity of 500,000 tonnes of bars and wire rods. Nevertheless, in the event of delayed mega and infrastructure projects, the additional capacity from Lion Industries may be put on hold.
Expect falling industry utilisation. Collectively, the entry of Alliance Steel and Lion Industries (Johor and Banting plants) represent a 30% addition to the industry’s total active capacity. Assuming 5% growth in steel consumption this year, we forecast the industry’s utilisation rate to fall from 88% in 2017 to 75% in 2018 based on the base-case scenario where Alliance Steel comes on stream with 1.5m tonnes in capacity and Lion Industries ramps up the utilisation rate at its Johor plant (currently 20%). In the worst-case scenario, industry utilisation rate may fall further to 68% if Lion Industries reactivates its Banting plant which has a capacity of 500,000 tonnes of steel. However, should Lion Industries opt to delay the commissioning, the industry’s utilisation rate will still be healthy at 81% in 2018.
Alliance Steel to come on stream with total production capacity of 1.5m tonnes; Lion Industries to restart plants if demand is strong
Utilisation rate will fall on subdued demand and influx of supply
Demand recovery will be slower than expected given deferment of various mega and infrastructure projects

M a l a y s i a S t r a t e g y July 2018
43
FIGURE 88: STEEL INDUSTRY MILESTONES
Source: Various, UOB Kay Hian
Flat steel producers may get spillover impact. We think demand for flat steel products will also take a hit, albeit to a lesser extent, following the slower pick-up in demand for long steel products. Based on our channel checks, contractors have put orders for flat steel products on hold after GE14 in anticipation of a slowdown in construction activities.
Limited upside from structural changes in China. We are of the view that China’s steel prices are capped as the five-year plan for steel capacity cuts comes to its tail end. In 2016, the Chinese government set a target to cut 100m-150m tonnes of steel production capacity. As at 2017, Chinese officials had already slashed 115m tonnes of steel production capacity and are targeting another 30m tonnes in 2018. Assuming the capacity cut of 30m tonnes is achieved in 2018, the Chinese government would be left with capacity cuts of only 5m tonnes in 2019, and would have achieved the five-year target way ahead of time.
Replacement of defunct Chinese mills starting 2018. We also gathered that the Ministry of Industry and Information Technology in China approved new electric arc furnaces (EAF) with a capacity of 48.4m tonnes in 2017 to replace the closed capacity. The new approved capacity, which is planned to come on stream between 2018 and 2023, is said to be more environmentally friendly as it uses electricity rather than coal. Most of the plants for new approved capacity are located in southern China, where induction furnaces (IF) were previously most prevalent.
Gross margin likely to contract in 2Q18 and beyond. Based on our generic model, gross margin may contract to RM674/tonne in 2Q18 from RM711/tonne in 1Q18 based on available ytd spot data. Prices of steel bars and billets are down 6.8% and 5.7% qoq qtd to RM2,523/tonne and RM2,225/tonne respectively. In addition, Ann Joo guided that 2Q18 could be seasonally weak because of Ramadhan and Hari Raya. Separately, we do not expect local steel ASP to rise further due to the incoming supply from Alliance Steel and the resumption of Lion Industries’ plants, which collectively will increase the industry’s active capacity by 30%.
Flat steel demand could be impacted too, albeit to a lesser extent
China’s five-year plan to cut steel capacity coming to tail end
New approved capacity to replace defunct Chinese mills will resume operation gradually in 2018-23
Gross margin of steel expected to contract on weak demand and easing ASP
Dec 15
Global
Domestic
Chinese govtannounced 5-year plan to cut 100m-150m MT of steel
capacity
Provisional safeguard duty on bars and wire rods
Rmb100b financial aid provided for
layoffs from Chinese govt
65m MT steel cuts in China in 2016 Major industry
consolidation announced in
China (Baosteel + Wuhan)
China closed induction furnace
(IF) millers by Jun 17; target to cut capacity by
50m-60m MT
Definitive safeguard duty on bars and wire rods
Provisional anti-dumping duties on cold-rolled
stainless steel
Kobe Steel scandal in Japan
Megasteel’s plant ceased operation
Mar 16 Oct 17Apr 17Jul 16May 16 Sep 16 Feb 17
Another round of big surges in local steel ASP due to: a) IF closure, and
b) control over local deliveries
Jul 17
US slapped tariff on imported steel
Mar 18 May 18
KL-Singapore high speed rail and MRT 3 scrapped

M a l a y s i a S t r a t e g y July 2018
44
Normalising input cost. International scrap was traded at high prices starting early-18 and peaked at US$385/MT in Jan 18. We largely attribute this to the approved new EAF with a capacity of 48.4m tonnes in 2017 to replace the closed capacity. The EAF, which consumes more scrap rather than iron ore, is said to be more environmental friendly. The Chinese government has been actively trying to control production of iron ore for environmental reasons. We think moving into 2H18, international scrap prices will not see a sudden jump as millers have already reserved their scrap requirements for the traditional peak season.
Switch from iron ore and coal to more environmentally-friendly alternatives. Meanwhile, iron ore prices will also weaken given the surge in iron ore supply, coupled with subdued demand in China as Chinese steel mills switch to the readily available and cheaper scrap metal. Finally, coking coal prices, which peaked at US$250/tonne in Jan 18, should be less volatile as supply normalises and demand weakens.
Electrode prices still high. We also understand that the manifold surge in electrode prices is still intact and will greatly impact input costs for millers that are operating EAF facilities by as much as US$40-50/MT. This will give Ann Joo which is operating a hybrid blast furnace-electric arc furnace (BF-EAF) facility a competitive advantage as it is less reliant on electrodes. In addition, Ann Joo is sourcing electrodes under long-term contracts with its suppliers, which allows it to place orders at much more competitive prices. It is also worth noting that Ann Joo has locked in its electrode requirement for 2018 below market prices.
FIGURE 89: INTERNATIONAL SCRAP PRICE FIGURE 90: IRON ORE PRICE
150
200
250
300
350
400
450
15 16 17 18
(US$/MT)
35
45
55
65
75
85
95
15 16 17 18
(US$/DMTU)
Source: MITI Source: MITI
Input cost possibly less volatile in 2H18
Lower iron ore prices on supply surge Lower input cost expected in 2H18 except for electrodes

M a l a y s i a S t r a t e g y July 2018
45
CEMENT SEGMENT
Cement ASP remained under pressure. The cement industry is still struggling from overcapacity and weak demand which have heightened an industry price war. The industry’s few attempts to raise cement prices since mid-17 have been unsustainable, eg cement bag ASP rose about 10% to RM240/MT as at mid-17 from the low of RM220/MT in early-17 but has since softened to RM210-220/MT. We also understand that the prices have weakened further below RM200/MT between end-17 and early-18 given persistently subdued demand.
Cement demand fell for two consecutive years. Cement demand is still sluggish, falling 6-7% yoy in 2017. This is the second consecutive year where demand has fallen. To recap, cement demand also declined by a similar quantum (6-7% yoy) in 2016. With the gloomy outlook, we think cement demand will continue to fall in 2018, making it a third consecutive year of negative growth.
Further delay in cement recovery. We opine the recovery in the cement segment will take more time given the uncertainty in mega and infrastructure projects. Initially, industry players were expecting a significant recovery in cement demand this year on the back of the commencement of mega projects, resulting in a significant pick-up in the industry’s utilisation rate from 65-70% in 2017 (a multi-year low) to about 74% in 2018. However, with the deferment of various mega and infrastructure projects, we think industry utilisation may only improve from 2019 onwards. The delays in the construction of mega and infrastructure projects may also have a spillover impact on the property market which is expected to take a longer time to recover.
FIGURE 91: CEMENT INDUSTRY UTILISATION RATE FIGURE 92: CEMENT CAPACITY AND GROWTH RATE
81
74
60
65
55
60
65
70
75
80
85
17 18F 19F 20F
(%)
0
5
10
15
20
25
30
35
40
12 13 14 15 16 17
(m tonne)
0
1
2
3
4
5
6
7
8
9(%)
Capacity (LHS)Grow th (RHS)
Source: UOB Kay Hian Source: UOB Kay Hian
Industry still dragged down by overcapacity which has swelled rebates
Demand to decline 6% yoy in 2017
Recovery may be slower than expected

M a l a y s i a S t r a t e g y July 2018
46
Strategy
Maintain MARKET WEIGHT on the building materials sector as we think demand for steel and cement will continue to be subdued in 2H18. Unlike cement, the steel segment is expected to be hit by rising incoming supply from Alliance Steel and Lion Industries. Furthermore, we think the upside from the steel industry’s consolidation in China is limited with the plan for capacity cuts coming to the tail end coupled with replacement mills coming on stream between 2018 and 2023. Top pick – Ann Joo.
Ann Joo Resources (AJR MK/BUY/RM1.75/Target: RM3.05). Maintain BUY following the sharp 32% fall in share price ytd. Our target price of RM3.05 is based on 7.0x 2019F PE. We think Ann Joo will remain a prime beneficiary of ongoing mega and infrastructure projects. Its attractive dividend policy of up to 60% payout ratio (subject to future capital requirements) should limit share price downside. Our conservative assumption of a 45% payout ratio represents an attractive dividend yield of 11% for 2018. Our trough valuation for Ann Joo is RM1.90 based on historical mean PE of 5.0x.
Choo Bee Metal Industries (CBEE MK/HOLD/RM2.18/Target: RM2.55). Maintain HOLD and target price of RM2.55 based on 6.0x 2019F EPS. This implies 6.1x ex-cash PE and a 13% discount to that of Ann Joo. Choo Bee is also trading at a compelling 0.6x 2018F P/B vs Ann Joo’s 1.7x and Southern Steel’s 1.3x. Choo Bee has secured an extension of import duty exemption to Oct 18 which enables it to enjoy 10-15% savings on imported raw materials. Our trough valuation for Choo Bee is RM1.90 based on -1SD below historical mean PE of 4.5x. Entry price: RM1.90.
Hume Industries (HUME MK/HOLD/RM1.06/Target: RM1.50). Our target price of RM1.50 is based on 19x 2018F PE, derived from the five-year average PE of Lafarge Malaysia and Tasek Corporation. Outlook for Hume Industries remains challenging and a recovery may come later than expected. Entry price: RM0.95.
Abdul Hadi Manaf +603 2147 1971
Maintain MARKET WEIGHT as upside is capped by weak demand and soft ASP
Top pick – Ann Joo following sharp drop in share price; dividend yield of 7.7%
Maintain HOLD on Choo Bee…
…and Hume Industries

M a l a y s i a S t r a t e g y July 2018
47
Sector At A Glance
FIGURE 93: STEEL GENERIC GROSS MARGIN PER TONNE FIGURE 94: STEEL CONSUMPTION AND SUPPLY
100
200
300
400
500
600
700
800
1Q16 2Q16 3Q16 4Q16 1Q17 2Q17 3Q17 4Q17 1Q18 2Q18
(RM/tonne)
4
5
6
7
8
9
10
12 13 14 15 16 17 18F
(m tonnes) Consumption Supply
Series3
Alliance
Alliance + Lion
Source: UOB Kay Hian Source: UOB Kay Hian
FIGURE 95: CEMENT PEERS EBITDA MARGIN FIGURE 96: MORTAGE APPROVAL RATE (RESIDENTIAL) – YOY CHANGES
-10
0
10
20
30
40
3Q15 4Q15 1Q16 2Q16 3Q16 4Q16 1Q17 2Q17 3Q17 4Q17 1Q18
(%)
Hume IndustriesLafarge Malay siaTasek Corporation
-40
-30
-20
-10
0
10
20
30
15 16 17 18
(%)
Source: UOB Kay Hian Source: UOB Kay Hian FIGURE 97: SECTOR STATISTICS
Share Price Last Net Profit EPS PE Market BV Price/
Company Ticker Rec 5 Jul 18 Year 2017 2018F 2019F 2017 2018F 2019F 2017 2018F 2019F ROE Cap ps BV ps (RM) End (RMm) (RMm) (RMm) (sen) (sen) (sen) (x) (x) (x) (%) (RMm) (RM) (x)
Steel Subsector
Ann Joo Resources AJR MK BUY 1.75 12/17 206 215 240 33.0 34.4 38.4 5.3 5.1 4.6 16.8 937 2.49 0.7
Choo Bee Metal Industries CBEE MK HOLD 2.18 12/17 43 44 46 39.4 40.6 42.2 5.5 5.4 5.2 8.9 237 4.53 0.5
Cement Subsector Hume Industries HUME MK HOLD 1.06 6/17 19 (39) 18 3.9 (8.1) 3.7 27.1 n.m 28.8 4.2 508 0.88 1.2
Source: Respective companies, Bloomberg, UOB Kay Hian
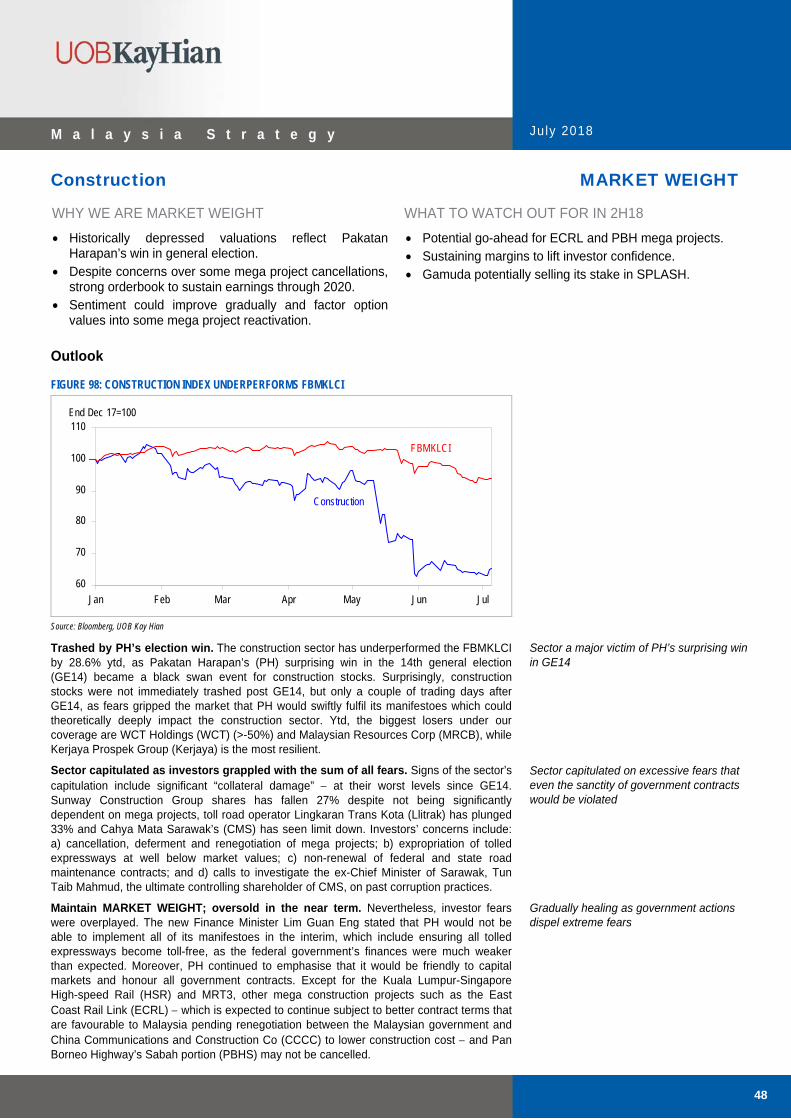
M a l a y s i a S t r a t e g y July 2018
48
Construction MARKET WEIGHT
WHY WE ARE MARKET WEIGHT
Historically depressed valuations reflect Pakatan Harapan’s win in general election.
Despite concerns over some mega project cancellations, strong orderbook to sustain earnings through 2020.
Sentiment could improve gradually and factor option values into some mega project reactivation.
WHAT TO WATCH OUT FOR IN 2H18
Potential go-ahead for ECRL and PBH mega projects. Sustaining margins to lift investor confidence. Gamuda potentially selling its stake in SPLASH.
Outlook
FIGURE 98: CONSTRUCTION INDEX UNDERPERFORMS FBMKLCI
60
70
80
90
100
110
Jan Feb Mar Apr May Jun Jul
Construction
FBMKLCI
End Dec 17=100
Source: Bloomberg, UOB Kay Hian
Trashed by PH’s election win. The construction sector has underperformed the FBMKLCI by 28.6% ytd, as Pakatan Harapan’s (PH) surprising win in the 14th general election (GE14) became a black swan event for construction stocks. Surprisingly, construction stocks were not immediately trashed post GE14, but only a couple of trading days after GE14, as fears gripped the market that PH would swiftly fulfil its manifestoes which could theoretically deeply impact the construction sector. Ytd, the biggest losers under our coverage are WCT Holdings (WCT) (>-50%) and Malaysian Resources Corp (MRCB), while Kerjaya Prospek Group (Kerjaya) is the most resilient.
Sector capitulated as investors grappled with the sum of all fears. Signs of the sector’s capitulation include significant “collateral damage” at their worst levels since GE14. Sunway Construction Group shares has fallen 27% despite not being significantly dependent on mega projects, toll road operator Lingkaran Trans Kota (Llitrak) has plunged 33% and Cahya Mata Sarawak’s (CMS) has seen limit down. Investors’ concerns include: a) cancellation, deferment and renegotiation of mega projects; b) expropriation of tolled expressways at well below market values; c) non-renewal of federal and state road maintenance contracts; and d) calls to investigate the ex-Chief Minister of Sarawak, Tun Taib Mahmud, the ultimate controlling shareholder of CMS, on past corruption practices.
Maintain MARKET WEIGHT; oversold in the near term. Nevertheless, investor fears were overplayed. The new Finance Minister Lim Guan Eng stated that PH would not be able to implement all of its manifestoes in the interim, which include ensuring all tolled expressways become toll-free, as the federal government’s finances were much weaker than expected. Moreover, PH continued to emphasise that it would be friendly to capital markets and honour all government contracts. Except for the Kuala Lumpur-Singapore High-speed Rail (HSR) and MRT3, other mega construction projects such as the East Coast Rail Link (ECRL) which is expected to continue subject to better contract terms that are favourable to Malaysia pending renegotiation between the Malaysian government and China Communications and Construction Co (CCCC) to lower construction cost and Pan Borneo Highway’s Sabah portion (PBHS) may not be cancelled.
Sector a major victim of PH’s surprising win in GE14
Sector capitulated on excessive fears that even the sanctity of government contracts would be violated
Gradually healing as government actions dispel extreme fears
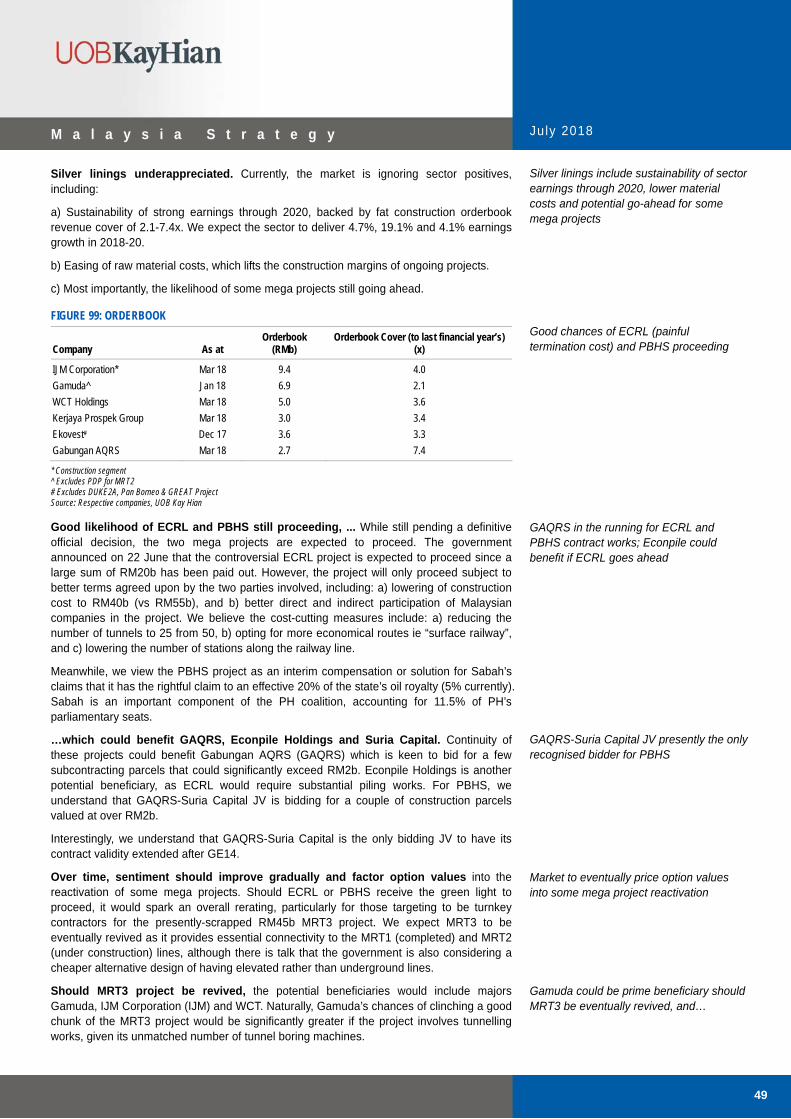
M a l a y s i a S t r a t e g y July 2018
49
Silver linings underappreciated. Currently, the market is ignoring sector positives, including:
a) Sustainability of strong earnings through 2020, backed by fat construction orderbook revenue cover of 2.1-7.4x. We expect the sector to deliver 4.7%, 19.1% and 4.1% earnings growth in 2018-20.
b) Easing of raw material costs, which lifts the construction margins of ongoing projects.
c) Most importantly, the likelihood of some mega projects still going ahead.
FIGURE 99: ORDERBOOK
Orderbook Orderbook Cover (to last financial year’s) Company As at (RMb) (x)
IJM Corporation* Mar 18 9.4 4.0
Gamuda^ Jan 18 6.9 2.1
WCT Holdings Mar 18 5.0 3.6
Kerjaya Prospek Group Mar 18 3.0 3.4
Ekovest# Dec 17 3.6 3.3
Gabungan AQRS Mar 18 2.7 7.4
* Construction segment ^ Excludes PDP for MRT2 # Excludes DUKE2A, Pan Borneo & GREAT Project Source: Respective companies, UOB Kay Hian
Good likelihood of ECRL and PBHS still proceeding, ... While still pending a definitive official decision, the two mega projects are expected to proceed. The government announced on 22 June that the controversial ECRL project is expected to proceed since a large sum of RM20b has been paid out. However, the project will only proceed subject to better terms agreed upon by the two parties involved, including: a) lowering of construction cost to RM40b (vs RM55b), and b) better direct and indirect participation of Malaysian companies in the project. We believe the cost-cutting measures include: a) reducing the number of tunnels to 25 from 50, b) opting for more economical routes ie “surface railway”, and c) lowering the number of stations along the railway line.
Meanwhile, we view the PBHS project as an interim compensation or solution for Sabah’s claims that it has the rightful claim to an effective 20% of the state’s oil royalty (5% currently). Sabah is an important component of the PH coalition, accounting for 11.5% of PH’s parliamentary seats.
…which could benefit GAQRS, Econpile Holdings and Suria Capital. Continuity of these projects could benefit Gabungan AQRS (GAQRS) which is keen to bid for a few subcontracting parcels that could significantly exceed RM2b. Econpile Holdings is another potential beneficiary, as ECRL would require substantial piling works. For PBHS, we understand that GAQRS-Suria Capital JV is bidding for a couple of construction parcels valued at over RM2b.
Interestingly, we understand that GAQRS-Suria Capital is the only bidding JV to have its contract validity extended after GE14.
Over time, sentiment should improve gradually and factor option values into the reactivation of some mega projects. Should ECRL or PBHS receive the green light to proceed, it would spark an overall rerating, particularly for those targeting to be turnkey contractors for the presently-scrapped RM45b MRT3 project. We expect MRT3 to be eventually revived as it provides essential connectivity to the MRT1 (completed) and MRT2 (under construction) lines, although there is talk that the government is also considering a cheaper alternative design of having elevated rather than underground lines.
Should MRT3 project be revived, the potential beneficiaries would include majors Gamuda, IJM Corporation (IJM) and WCT. Naturally, Gamuda’s chances of clinching a good chunk of the MRT3 project would be significantly greater if the project involves tunnelling works, given its unmatched number of tunnel boring machines.
Silver linings include sustainability of sector earnings through 2020, lower material costs and potential go-ahead for some mega projects
Good chances of ECRL (painful termination cost) and PBHS proceeding GAQRS in the running for ECRL and PBHS contract works; Econpile could benefit if ECRL goes ahead
GAQRS-Suria Capital JV presently the only recognised bidder for PBHS Market to eventually price option values into some mega project reactivation
Gamuda could be prime beneficiary should MRT3 be eventually revived, and…
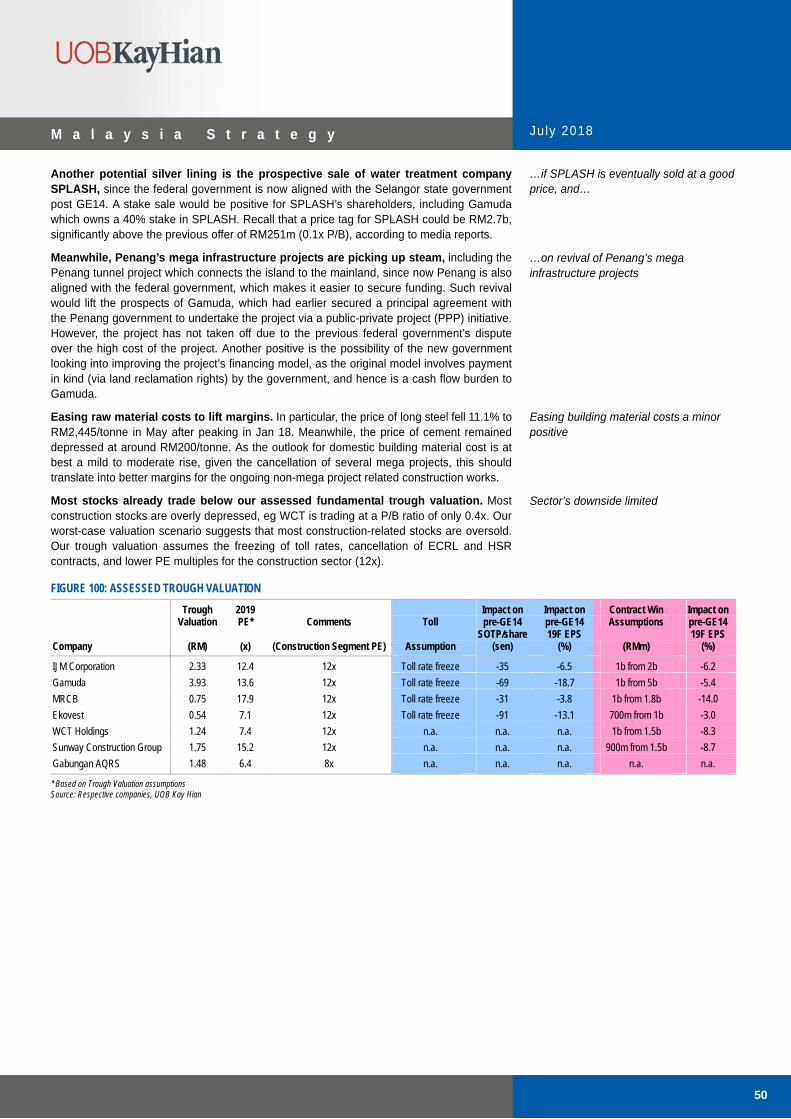
M a l a y s i a S t r a t e g y July 2018
50
Another potential silver lining is the prospective sale of water treatment company SPLASH, since the federal government is now aligned with the Selangor state government post GE14. A stake sale would be positive for SPLASH’s shareholders, including Gamuda which owns a 40% stake in SPLASH. Recall that a price tag for SPLASH could be RM2.7b, significantly above the previous offer of RM251m (0.1x P/B), according to media reports.
Meanwhile, Penang’s mega infrastructure projects are picking up steam, including the Penang tunnel project which connects the island to the mainland, since now Penang is also aligned with the federal government, which makes it easier to secure funding. Such revival would lift the prospects of Gamuda, which had earlier secured a principal agreement with the Penang government to undertake the project via a public-private project (PPP) initiative. However, the project has not taken off due to the previous federal government’s dispute over the high cost of the project. Another positive is the possibility of the new government looking into improving the project’s financing model, as the original model involves payment in kind (via land reclamation rights) by the government, and hence is a cash flow burden to Gamuda.
Easing raw material costs to lift margins. In particular, the price of long steel fell 11.1% to RM2,445/tonne in May after peaking in Jan 18. Meanwhile, the price of cement remained depressed at around RM200/tonne. As the outlook for domestic building material cost is at best a mild to moderate rise, given the cancellation of several mega projects, this should translate into better margins for the ongoing non-mega project related construction works.
Most stocks already trade below our assessed fundamental trough valuation. Most construction stocks are overly depressed, eg WCT is trading at a P/B ratio of only 0.4x. Our worst-case valuation scenario suggests that most construction-related stocks are oversold. Our trough valuation assumes the freezing of toll rates, cancellation of ECRL and HSR contracts, and lower PE multiples for the construction sector (12x).
FIGURE 100: ASSESSED TROUGH VALUATION
Trough 2019 Impact on Impact on Contract Win Impact on Valuation PE* Comments Toll pre-GE14
SOTP/share pre-GE14 19F EPS
Assumptions pre-GE14 19F EPS
Company (RM) (x) (Construction Segment PE) Assumption (sen) (%) (RMm) (%)
IJM Corporation 2.33 12.4 12x Toll rate freeze -35 -6.5 1b from 2b -6.2
Gamuda 3.93 13.6 12x Toll rate freeze -69 -18.7 1b from 5b -5.4
MRCB 0.75 17.9 12x Toll rate freeze -31 -3.8 1b from 1.8b -14.0
Ekovest 0.54 7.1 12x Toll rate freeze -91 -13.1 700m from 1b -3.0
WCT Holdings 1.24 7.4 12x n.a. n.a. n.a. 1b from 1.5b -8.3
Sunway Construction Group 1.75 15.2 12x n.a. n.a. n.a. 900m from 1.5b -8.7
Gabungan AQRS 1.48 6.4 8x n.a. n.a. n.a. n.a. n.a.
* Based on Trough Valuation assumptions Source: Respective companies, UOB Kay Hian
…if SPLASH is eventually sold at a good price, and…
…on revival of Penang’s mega infrastructure projects
Easing building material costs a minor positive
Sector’s downside limited

M a l a y s i a S t r a t e g y July 2018
51
Strategy
Maintain MARKET WEIGHT. We prefer contractors with clearer catalysts, such as GAQRS. Among the large caps, we prefer Gamuda.
Gabungan AQRS (AQRS MK/BUY/RM1.19/Target: RM1.86). Maintain BUY with a target price of RM1.86, based on 10x its fully-diluted 2019F EPS of 18.6 sen. We project GAQRS to deliver a three-year earnings CAGR of 36% for 2017-20. A key earnings driver is 4Q18’s launch of E’Island, a RM491m GDV condominium project that offers compelling values in the mid-priced segment. GAQRS is well positioned to secure more high-profile infrastructure jobs, including ECRL and PBHS.
Gamuda (GAM MK/BUY/RM3.47/Target: RM4.49). Maintain BUY and SOTP-based target price of RM4.49, or 14.1x FY19F PE. Current valuation ignores a few potential catalysts, including securing an amicable disposal price for SPLASH (Gamuda’s 40% stake accounts for 9% of SOTP based on book value), and the potential for Penang’s mega infrastructure project to be expedited. Meanwhile, present valuations remain too pessimistic in valuing toll concessionaires and with no embedded option value for some mega projects to eventually proceed (eg MRT3). The government has deferred discussing with tolled expressway concessionaires until federal finances improve. This allays undue concerns that subsidiary Litrak’s toll concession (11% of SOTP) would be compromised.
IJM Corporation (IJM MK/BUY/RM1.78/Target: RM2.65). Maintain BUY and SOTP-based target price of RM2.65. The major share price rout after GE14 has made IJM a deep value stock, trading at only 0.6x FY19F P/B and 11.5x FY19F PE. IJM should sustain its core earnings, backed by a construction orderbook of RM9.4b (equivalent to four years of construction revenue cover). Recognition of losses at associate Scomi may also fall drastically from FY18’s level as its investment value has mostly been written down. In addition, the government will defer discussing with tolled expressway concessionaires until federal finances improve, which should allay undue concerns over the sanctity of IJM’s toll concession (19% of SOTP). We believe its multi-year construction projects (West Coast Expressway and Kuantan Port Extension) coupled with its strategic property landbanks and concession assets will continue to grow shareholders’ value in the long run. Our target price implies 16.9x FY20F PE.
FIGURE 101: PEER COMPARISON PE (x)
Share Price
5 Jul 18 Target Price
Market Cap 2017 2018F 2019F
P/B 2017
ROE 2018F
Company Ticker Rec (RM) (RM) (US$m) (x) (x) (x) (x) (%)
Gamuda GAM MK BUY 3.47 4.49 2,118.2 12.2 10.1 9.7 1.3 11.4
IJM Corporation* IJM MK BUY 1.78 2.65 1,598.6 21.1 13.3 11.5 0.7 5.0
Kerjaya Prospek Group KPG MK BUY 1.49 1.82 457.7 14.6 11.7 10.1 1.0 16.9
Sunway Construction Group SCGB MK HOLD 1.85 2.17 591.3 23.8 14.1 13.6 4.3 27.8
WCT Holdings WCTHG MK BUY 0.80 1.12 274.6 7.2 6.4 6.1 0.4 5.4
Ekovest EKO MK HOLD 0.63 0.73 332.9 18.5 9.1 6.0 1.3 8.3
Gabungan AQRS AQRS MK BUY 1.19 1.86 133.7 19.7 8.5 6.4 1.5 15.7
* Year end has ended, earnings reflects actual numbers Source: Bloomberg, UOB Kay Hian
Vincent Khoo, CFA
+603 2147 1998 [email protected]
Top picks: GAQRS, Gamuda and IJM
Launch of E’Island project in 4Q18 expected to drive GAQRS’ property earnings moving forward
Gamuda set to benefit from revival of Penang Transport Master Plan which is expected to kick off soon pending approval from federal government
IJM should sustain core earnings on strong construction orderbook (4x orderbook cover) as well as strategic property landbanks and concession assets
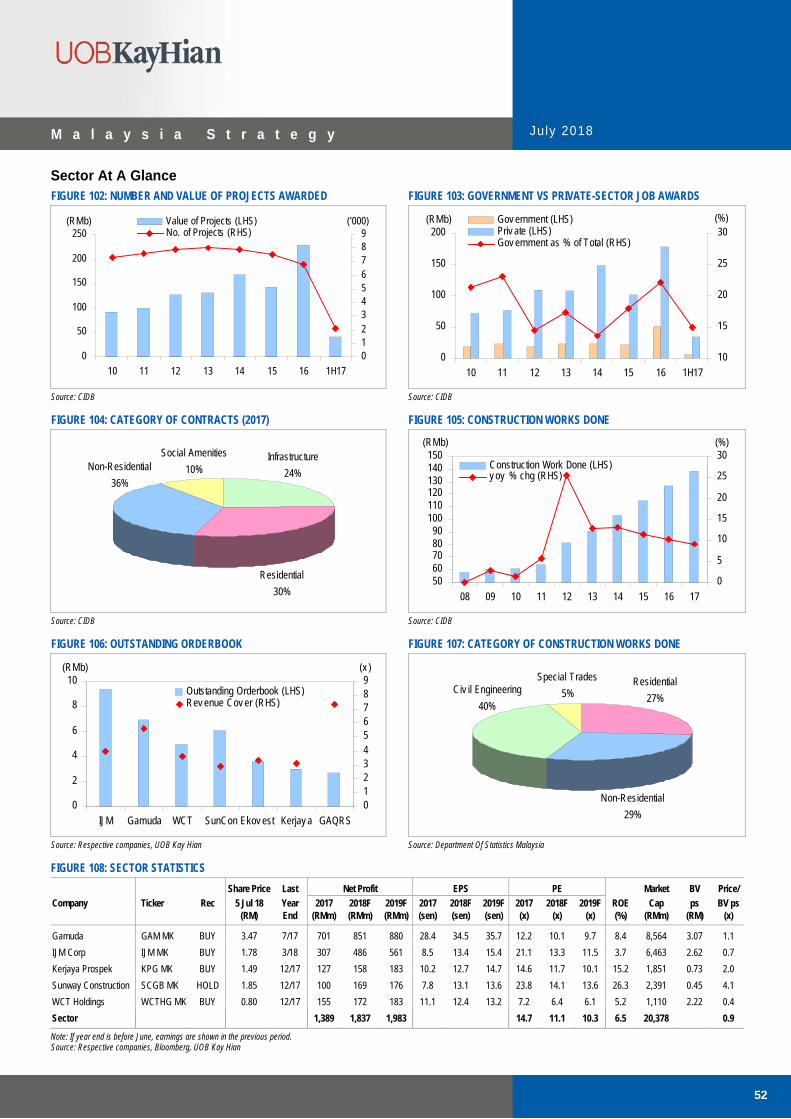
M a l a y s i a S t r a t e g y July 2018
52
Sector At A Glance
FIGURE 102: NUMBER AND VALUE OF PROJECTS AWARDED FIGURE 103: GOVERNMENT VS PRIVATE-SECTOR JOB AWARDS
0
50
100
150
200
250
10 11 12 13 14 15 16 1H17
(RMb)
0123456789
('000)Value of Projects (LHS)No. of Projects (RHS)
0
50
100
150
200
10 11 12 13 14 15 16 1H17
10
15
20
25
30Gov ernment (LHS)Priv ate (LHS)Gov ernment as % of Total (RHS)
(RMb) (%)
Source: CIDB Source: CIDB FIGURE 104: CATEGORY OF CONTRACTS (2017) FIGURE 105: CONSTRUCTION WORKS DONE
Infrastructure
24%
Residential
30%
Social Amenities
10%Non-Residential
36%
5060708090
100110120130140150
08 09 10 11 12 13 14 15 16 17
0
5
10
15
20
25
30Construction Work Done (LHS)y oy % chg (RHS)
(RMb) (%)
Source: CIDB Source: CIDB FIGURE 106: OUTSTANDING ORDERBOOK FIGURE 107: CATEGORY OF CONSTRUCTION WORKS DONE
0
2
4
6
8
10
IJM Gamuda WCT SunCon Ekov est Kerjay a GAQRS
0123456789
Outstanding Orderbook (LHS)Rev enue Cov er (RHS)
(RMb) (x )
Residential
27%
Special Trades
5%Civ il Engineering
40%
Non-Residential
29%
Source: Respective companies, UOB Kay Hian Source: Department Of Statistics Malaysia FIGURE 108: SECTOR STATISTICS
Share Price Last Net Profit EPS PE Market BV Price/
Company Ticker Rec 5 Jul 18 Year 2017 2018F 2019F 2017 2018F 2019F 2017 2018F 2019F ROE Cap ps BV ps (RM) End (RMm) (RMm) (RMm) (sen) (sen) (sen) (x) (x) (x) (%) (RMm) (RM) (x)
Gamuda GAM MK BUY 3.47 7/17 701 851 880 28.4 34.5 35.7 12.2 10.1 9.7 8.4 8,564 3.07 1.1
IJM Corp IJM MK BUY 1.78 3/18 307 486 561 8.5 13.4 15.4 21.1 13.3 11.5 3.7 6,463 2.62 0.7
Kerjaya Prospek KPG MK BUY 1.49 12/17 127 158 183 10.2 12.7 14.7 14.6 11.7 10.1 15.2 1,851 0.73 2.0
Sunway Construction SCGB MK HOLD 1.85 12/17 100 169 176 7.8 13.1 13.6 23.8 14.1 13.6 26.3 2,391 0.45 4.1
WCT Holdings WCTHG MK BUY 0.80 12/17 155 172 183 11.1 12.4 13.2 7.2 6.4 6.1 5.2 1,110 2.22 0.4
Sector 1,389 1,837 1,983 14.7 11.1 10.3 6.5 20,378 0.9
Note: If year end is before June, earnings are shown in the previous period. Source: Respective companies, Bloomberg, UOB Kay Hian

M a l a y s i a S t r a t e g y July 2018
53
Consumer MARKET WEIGHT
WHY WE ARE MARKET WEIGHT
Strong recovery in consumer sentiment on increase in disposable income, which can spur consumption.
While a key safe haven, most consumer stocks are trading well above mean valuations.
WHAT TO WATCH OUT FOR IN 2H18
Quantum of SST which is slated to be introduced on 1 Sep 18 after a three-month tax break.
Rise in prices of raw materials (cocoa and skimmed milk) since early-18.
Lower sugar prices. Minimum wage hike in Aug 18.
Outlook
FIGURE 109: CONSUMER INDEX OUTPERFORMED FBMKLCI
90
95
100
105
110
115
120
125
130
Jan Feb Mar Apr May Jun Jul
Consumer
FBMKLCI
End Dec 17=100
Source: Bloomberg, UOB Kay Hian
Has outperformed FBMKLCI. The consumer sector has outperformed the FBMKLCI, rising 29% ytd (vs FBMKLCI’s -5.9%). Sector heavyweight British American Tobacco’s (BAT) share price has staged a strong recovery, rising 51.2% from its ytd low of RM22.70 following Pakatan Harapan’s shock win in the general election. Other consumer blue chips, notably Nestle Malaysia (Nestle), Fraser & Neave Holdings (F&N), Heineken Malaysia (Heineken) and Carlsberg Brewery Malaysia (Carlsberg) have had a good run-up as well, which may be due to an expected boost in consumer sentiment on the back of the new government’s populist pledge and the defensive nature of the sector amid market uncertainty.
Maintain MARKET WEIGHT on the sector. Consumption outlook is rosy for 2H18, driven by a three-month break on the back of the zero-rated Goods and Services Tax (GST) effective 1 Jun 18, and the downtrend in commodity prices since 2H17 that will benefit F&B companies in 2018. However, we see limited upside for consumer stocks given the significant run-up in their share prices ytd. Consumer blue chips like Nestle, F&N, Heineken and Carlsberg are trading well above their historical mean PEs with uncompelling yields.
Outperformance may be due to boost in consumer sentiment on government’s populist pledge and defensive nature of sector amid market uncertainty
Rosy consumption outlook for 2H18, but limited upside for consumer stocks as they are trading above their historical mean PEs
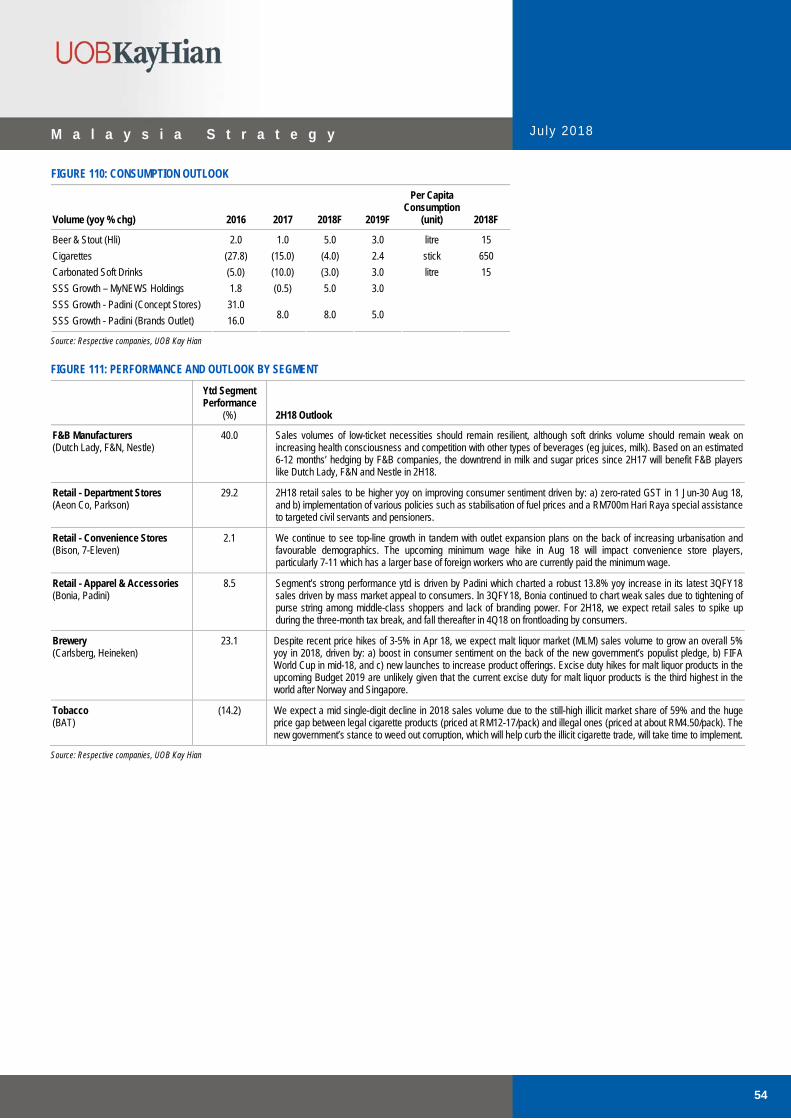
M a l a y s i a S t r a t e g y July 2018
54
FIGURE 110: CONSUMPTION OUTLOOK
Per Capita Consumption Volume (yoy % chg) 2016 2017 2018F 2019F (unit) 2018F
Beer & Stout (Hli) 2.0 1.0 5.0 3.0 litre 15
Cigarettes (27.8) (15.0) (4.0) 2.4 stick 650
Carbonated Soft Drinks (5.0) (10.0) (3.0) 3.0 litre 15
SSS Growth – MyNEWS Holdings 1.8 (0.5) 5.0 3.0
SSS Growth - Padini (Concept Stores) 31.0
SSS Growth - Padini (Brands Outlet) 16.0 8.0 8.0 5.0
Source: Respective companies, UOB Kay Hian
FIGURE 111: PERFORMANCE AND OUTLOOK BY SEGMENT
Ytd Segment Performance
(%) 2H18 Outlook
F&B Manufacturers (Dutch Lady, F&N, Nestle)
40.0 Sales volumes of low-ticket necessities should remain resilient, although soft drinks volume should remain weak on increasing health consciousness and competition with other types of beverages (eg juices, milk). Based on an estimated 6-12 months’ hedging by F&B companies, the downtrend in milk and sugar prices since 2H17 will benefit F&B players like Dutch Lady, F&N and Nestle in 2H18.
Retail - Department Stores (Aeon Co, Parkson)
29.2 2H18 retail sales to be higher yoy on improving consumer sentiment driven by: a) zero-rated GST in 1 Jun-30 Aug 18, and b) implementation of various policies such as stabilisation of fuel prices and a RM700m Hari Raya special assistance to targeted civil servants and pensioners.
Retail - Convenience Stores (Bison, 7-Eleven)
2.1 We continue to see top-line growth in tandem with outlet expansion plans on the back of increasing urbanisation and favourable demographics. The upcoming minimum wage hike in Aug 18 will impact convenience store players, particularly 7-11 which has a larger base of foreign workers who are currently paid the minimum wage.
Retail - Apparel & Accessories (Bonia, Padini)
8.5 Segment’s strong performance ytd is driven by Padini which charted a robust 13.8% yoy increase in its latest 3QFY18 sales driven by mass market appeal to consumers. In 3QFY18, Bonia continued to chart weak sales due to tightening of purse string among middle-class shoppers and lack of branding power. For 2H18, we expect retail sales to spike up during the three-month tax break, and fall thereafter in 4Q18 on frontloading by consumers.
Brewery (Carlsberg, Heineken)
23.1 Despite recent price hikes of 3-5% in Apr 18, we expect malt liquor market (MLM) sales volume to grow an overall 5% yoy in 2018, driven by: a) boost in consumer sentiment on the back of the new government’s populist pledge, b) FIFA World Cup in mid-18, and c) new launches to increase product offerings. Excise duty hikes for malt liquor products in the upcoming Budget 2019 are unlikely given that the current excise duty for malt liquor products is the third highest in the world after Norway and Singapore.
Tobacco (BAT)
(14.2) We expect a mid single-digit decline in 2018 sales volume due to the still-high illicit market share of 59% and the huge price gap between legal cigarette products (priced at RM12-17/pack) and illegal ones (priced at about RM4.50/pack). The new government’s stance to weed out corruption, which will help curb the illicit cigarette trade, will take time to implement.
Source: Respective companies, UOB Kay Hian

M a l a y s i a S t r a t e g y July 2018
55
F&B SEGMENT
Sales volume of low-ticket necessities to remain resilient, soft drinks volume to remain weak. Sales of low-ticket necessities should remain resilient in 2H18 driven by the implementation of zero-rated GST, which will lower prices of food items which were previously slapped with a 6% GST. However, we expect soft drinks sales volume to remain weak on increasing health consciousness, coupled with competition from other types of beverage (eg juices, milk). For 1H18, F&N’s soft drinks segment posted a 5% drop in sales.
Rising skimmed milk and cocoa prices since early-18… We expect 2H18 gross margins of F&B companies to rise yoy on lower prices of raw materials hedged during the downtrend in raw material prices in 2H17 – skimmed milk, cocoa and crude palm oil. As for 2019, we expect gross margins to be impacted by the uptrend in skimmed milk and cocoa prices. Skimmed milk power price has risen to US$2,050/tonne from 2017’s low of US$1,675/tonne, while cocoa price stands at US$2,500/tonne, up from 2017’s low of US$1,800/tonne.
…and higher packaging costs may hit 2019 gross margins. The recent surge in oil prices will lift the price of resin, a key raw material of plastic packaging, while aluminium price increase of 8% from 2017’s average of US$1,968/tonne will raise can packaging costs.
However, low sugar prices in 2H18 will benefit F&B players with sizeable COGS exposure to sugar. Sugar prices have declined 25% to US$11.8ct/lb currently from 2017’s average of US$15.8ct/lb. All large F&B players buy sugar from MSM Malaysia (MSM) based on a pricing formula that depends on MSM’s locked-in prices for raw sugar and the US$/RM rate. Given the estimated 6-12 months’ hedging done by MSM and the yoy strengthening of the US$/RM to RM4.05 currently, we expect to see lower sugar prices from 2Q18 onwards. This will benefit F&B players with sizeable COGS exposure to sugar, such as F&N and Power Root.
Soft drinks sales volume will be weak on increasing health consciousness and competition from other types of beverages
Rising skimmed milk and cocoa prices coupled with higher packaging costs may hit F&B players’ gross margins in 2019, … …but players with sizeable COGS exposure to sugar should be partially shielded
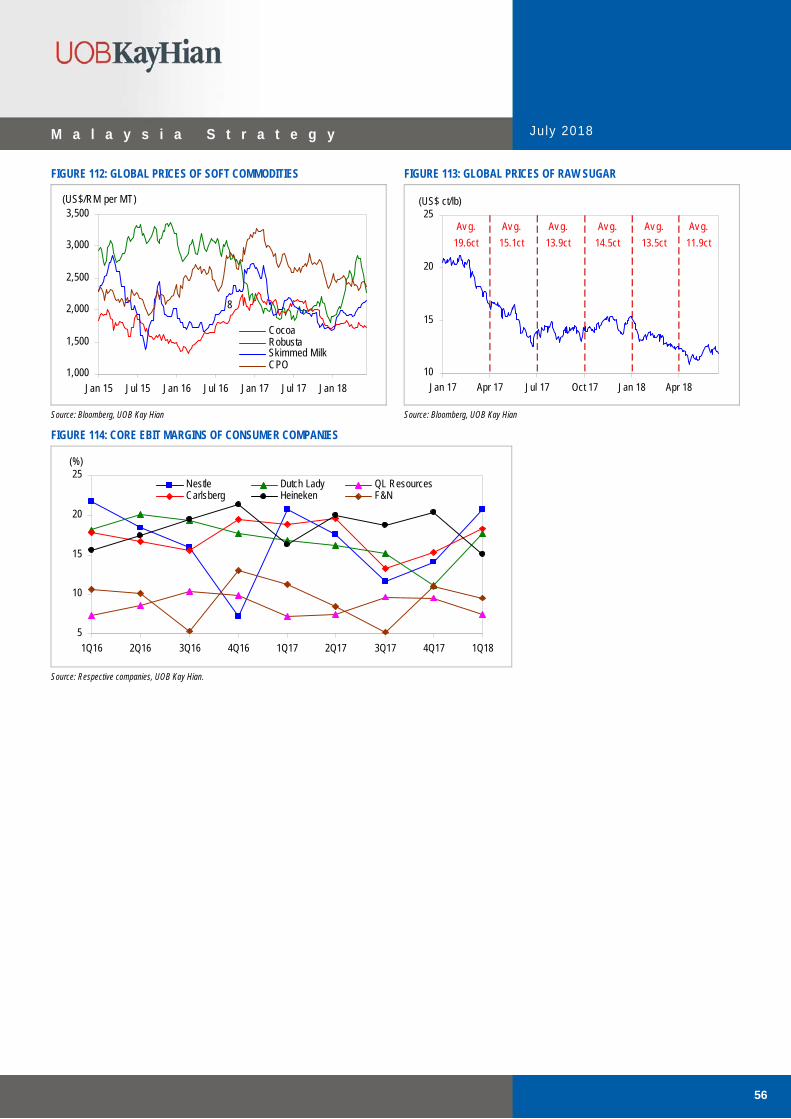
M a l a y s i a S t r a t e g y July 2018
56
FIGURE 112: GLOBAL PRICES OF SOFT COMMODITIES FIGURE 113: GLOBAL PRICES OF RAW SUGAR
1,000
1,500
2,000
2,500
3,000
3,500
Jan 15 Jul 15 Jan 16 Jul 16 Jan 17 Jul 17 Jan 18
CocoaRobustaSkimmed MilkCPO
(US$/RM per MT)
8
10
15
20
25
Jan 17 Apr 17 Jul 17 Oct 17 Jan 18 Apr 18
(US$ ct/lb)
Av g.
19.6ct
Av g.
15.1ct
Av g.
13.9ct
Av g.
14.5ct
Av g.
13.5ct
Av g.
11.9ct
Source: Bloomberg, UOB Kay Hian Source: Bloomberg, UOB Kay Hian
FIGURE 114: CORE EBIT MARGINS OF CONSUMER COMPANIES
5
10
15
20
25
1Q16 2Q16 3Q16 4Q16 1Q17 2Q17 3Q17 4Q17 1Q18
(%)
Nestle Dutch Lady QL ResourcesCarlsberg Heineken F&N
Source: Respective companies, UOB Kay Hian.

M a l a y s i a S t r a t e g y July 2018
57
RETAIL SEGMENT
Recovery on the way for retailers. Given the three-month tax-break effective 1 Jun 18, we expect to see a significant surge in retail sales in 3Q18 on the back of frontloading in purchases before the reintroduction of the Sales and Services Tax (SST) on 1 Sep 18. Retail Group Malaysia (RGM) recently revised upwards its 2018 retail sales growth forecast to 5.3% from 4.7%. This is driven by: a) a boost in consumer confidence on the three-month tax break, and b) a surge in discounts and promotions offered by retailers during this once-in-a-lifetime opportunity.
Estimated 10% hike in minimum wage to RM1,100 in Aug 18. The new government is due to make an announcement on the new minimum wage for the private sector in Aug 18. Although the government has pledged to raise the national minimum wage to RM1,500 by its first term from RM1,000 currently in Peninsular Malaysia and RM920 in East Malaysia, whereby half of the hike will be borne by the government, we gather that the contribution from the government will be postponed due to fiscal constraints. As the minimum wage hike could be at employers’ expense, we estimate a moderate 10% hike to RM1,100.
Convenience store players the biggest losers in upcoming minimum wage hike. In the consumer sector, we expect convenience store players such as 7-Eleven to suffer an impact of about RM8m (based on a RM100 hike in minimum wage for an estimated 75% of 9,000 outlet staff). For MyNEWS Holdings, the impact will be minimal at less than RM1m (based on a RM100 hike in minimum wage for about 600 foreign workers).
TOBACCO SEGMENT
New government’s pledge to weed out corruption will help curb illicit trade… The legal tobacco industry’s sales volume declined 7.7% yoy in 1Q18 as consumers had yet to stomach the steep 23-26% excise-led hikes in cigarette prices on 4 Nov 15 (an increase of more than 40% in excise duty) and illicit market share was still high at 59%. Pakatan Harapan’s manifestos stated intensifying efforts by enforcement agencies to stop the smuggling of alcohol and cigarettes across the border, including tighter controls along the borders and heavier punishments for those convicted.
…but implementation may take time. The illicit market share is high, currently hovering at 59%. Given the widespread nature and sophistication of the illicit cigarette trade (eg frequent relocation of distribution hubs and thousands of distribution points), enforcement agencies will need to make concerted efforts to significantly curb the illicit cigarette trade. Hence, implementation will take time.
FIGURE 115: TOBACCO – % CHANGE IN EXCISE DUTY VS TIV FIGURE 116: ILLICIT CIGARETTE TRADE VS TIV
13.3 13.612.8 12.2
10.5
8.07.3
1.7
0
2
4
6
8
10
12
14
16
11 12 13 14 15 16 17 1Q18
0
10
20
30
40
50TIV (LHS) Ex cise (RHS) (b sticks) (%)
13.3 13.612.8 12.2
10.5
8.07.3
1.736.1
34.5
38.9
32.3
45.6
58.059.0 59.0
0
2
4
6
8
10
12
14
16
11 12 13 14 15 16 17 1Q18
(b sticks)
30
35
40
45
50
55
60
65(%)TIV (LHS) Illicit Market Share (RHS)
Source: BAT, UOB Kay Hian Source: AC Nielsen. BAT, UOB Kay Hian
RGM recently raised its 2018 retail sales growth forecast to 5.3% from 4.7%
Minimum wage hike could be at employers’ expense as government’s contribution could be deferred due to fiscal constraints
Convenience store players will be hit by minimum wage hike in Aug 18, estimated at 10% to RM1,100 Illicit cigarette trade’s market share currently hovers around 59%

M a l a y s i a S t r a t e g y July 2018
58
Cigarette prices to be maintained despite three-month tax break effective 1 Jun 18... Despite zero-rated GST from 1 Jun 18 until 31 Aug 18, the Health Ministry has decided to maintain cigarette prices as prohibitive prices are one of the ways to discourage smoking.
…with further clarity needed on this issue. Health Minister Dr Dzulkefly Ahmad further added that excise duty may have to be raised to maintain cigarette prices at the levels prior to the zero-rating of GST. In the case that excise duty is not raised, tobacco players and their retailers will benefit from zero-rated GST, with an estimated earnings accretion of RM30m-40m for BAT (7-9% of 2018 earnings). We have not factored this into our 2018 earnings forecasts as our 2018 earnings of RM444m are on the optimistic side given 1Q18 net profit of RM96.2m. In the likely case of a rise in excise duty to maintain cigarette prices, we believe the higher excise duty will be maintained after the period of zero-rated GST.
Will there be higher excise duty to maintain cigarette prices post zero-rating of GST, or will tobacco players benefit from zero-rated GST in 3Q18?
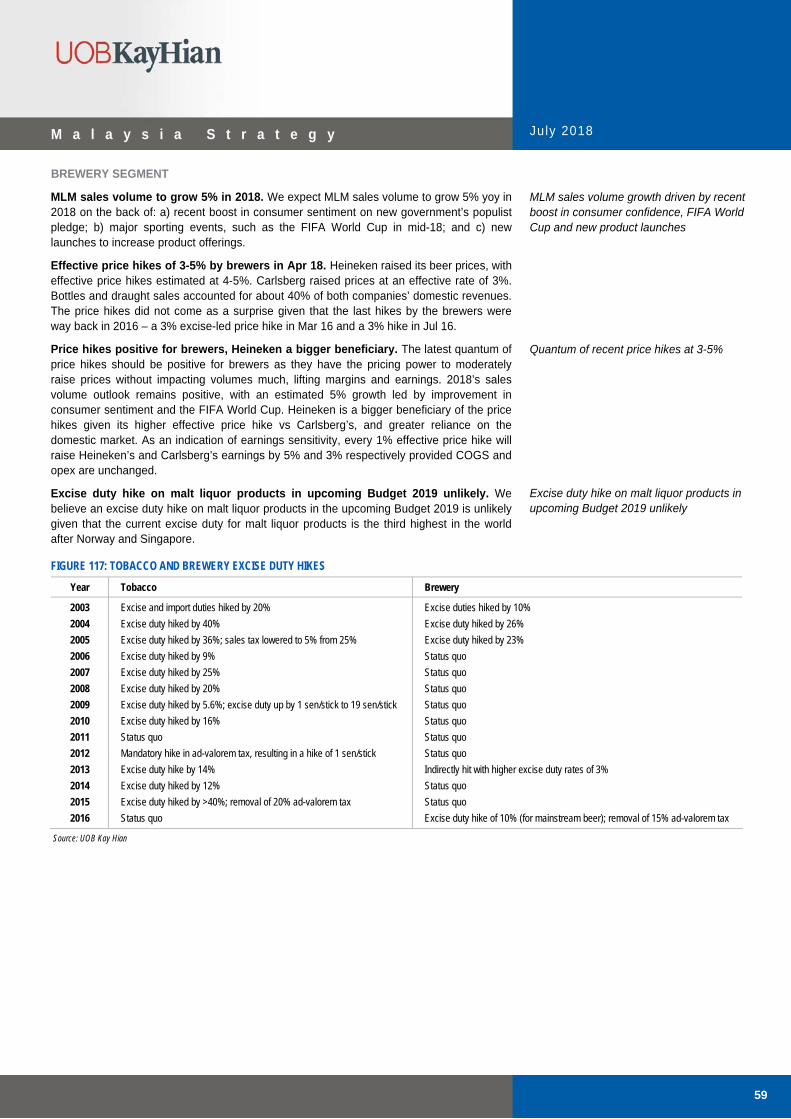
M a l a y s i a S t r a t e g y July 2018
59
BREWERY SEGMENT
MLM sales volume to grow 5% in 2018. We expect MLM sales volume to grow 5% yoy in 2018 on the back of: a) recent boost in consumer sentiment on new government’s populist pledge; b) major sporting events, such as the FIFA World Cup in mid-18; and c) new launches to increase product offerings.
Effective price hikes of 3-5% by brewers in Apr 18. Heineken raised its beer prices, with effective price hikes estimated at 4-5%. Carlsberg raised prices at an effective rate of 3%. Bottles and draught sales accounted for about 40% of both companies’ domestic revenues. The price hikes did not come as a surprise given that the last hikes by the brewers were way back in 2016 – a 3% excise-led price hike in Mar 16 and a 3% hike in Jul 16.
Price hikes positive for brewers, Heineken a bigger beneficiary. The latest quantum of price hikes should be positive for brewers as they have the pricing power to moderately raise prices without impacting volumes much, lifting margins and earnings. 2018’s sales volume outlook remains positive, with an estimated 5% growth led by improvement in consumer sentiment and the FIFA World Cup. Heineken is a bigger beneficiary of the price hikes given its higher effective price hike vs Carlsberg’s, and greater reliance on the domestic market. As an indication of earnings sensitivity, every 1% effective price hike will raise Heineken’s and Carlsberg’s earnings by 5% and 3% respectively provided COGS and opex are unchanged.
Excise duty hike on malt liquor products in upcoming Budget 2019 unlikely. We believe an excise duty hike on malt liquor products in the upcoming Budget 2019 is unlikely given that the current excise duty for malt liquor products is the third highest in the world after Norway and Singapore.
FIGURE 117: TOBACCO AND BREWERY EXCISE DUTY HIKES
Year Tobacco Brewery
2003 Excise and import duties hiked by 20% Excise duties hiked by 10%
2004 Excise duty hiked by 40% Excise duty hiked by 26%
2005 Excise duty hiked by 36%; sales tax lowered to 5% from 25% Excise duty hiked by 23%
2006 Excise duty hiked by 9% Status quo
2007 Excise duty hiked by 25% Status quo
2008 Excise duty hiked by 20% Status quo
2009 Excise duty hiked by 5.6%; excise duty up by 1 sen/stick to 19 sen/stick Status quo
2010 Excise duty hiked by 16% Status quo
2011 Status quo Status quo
2012 Mandatory hike in ad-valorem tax, resulting in a hike of 1 sen/stick Status quo
2013 Excise duty hike by 14% Indirectly hit with higher excise duty rates of 3%
2014 Excise duty hiked by 12% Status quo
2015 Excise duty hiked by >40%; removal of 20% ad-valorem tax Status quo
2016 Status quo Excise duty hike of 10% (for mainstream beer); removal of 15% ad-valorem tax
Source: UOB Kay Hian
MLM sales volume growth driven by recent boost in consumer confidence, FIFA World Cup and new product launches Quantum of recent price hikes at 3-5%
Excise duty hike on malt liquor products in upcoming Budget 2019 unlikely

M a l a y s i a S t r a t e g y July 2018
60
Strategy
Maintain MARKET WEIGHT on the sector as lofty valuations will be supported during period of risk aversion. Notwithstanding the rosy consumption outlook after the general election and the downtrend in commodity prices since 2H17 which will benefit F&B companies in 2H18, we see limited upside for the sector. This is due to the significant run-up in share prices ytd, whereby all consumer companies under our coverage are trading well above their historical mean valuations with uncompelling yields.
Nestle Malaysia (NESZ MK/SELL/RM147.80/Target: RM120.00). Although we expect Nestle to chart a double-digit 11.1% yoy earnings growth for 2018 driven by: a) a 5.3% yoy growth in top-line, and b) improvement in margins from lower raw material prices, we note that its valuations are stretched at 45.8x 2019F PE, way above its five-year historical mean PE of 30x. We attribute the significant surge in its valuations to its inclusion in the FBMKLCI and MSCI index in end-17 amid the share’s low liquidity.
QL Resources (QLG MK/SELL/RM5.98/Target: RM4.90). Despite a prospective strong recovery of +25% in its FY19 PBT after a lacklustre three-year PBT growth CAGR of 1.3% in FY15-18, the recent run-up in share price does not justify its lofty valuations at 33.2x FY20F PE, which is way above its five-year historical mean PE of 26x. On its latest venture into the convenience store business via the FamilyMart franchise, the company has 49 FamilyMart stores and it targets to grow store counts to 300 by 2021. Conservatively, management expects the business to be profitable in the sixth year of operation, which will be in 2022.
Prefer Heineken Malaysia (HEIM MK/HOLD/RM22.42/Target: RM20.00) in the brewery segment for defensive yield play. We expect Heineken to chart a 7.2% earnings growth in 2018, in tandem with its 6.6% top-line growth. Heineken is the bigger beneficiary of the industry’s recent price hikes, having raised product prices by 4-5% vs Carlsberg’s 3%. However, upside is modest given the ytd run-up in share price in tandem with other consumer blue chips on valuation rerating, rendering 2018-20 yields less appealing at 4.1-4.5% based on a 96% payout. Our DCF-based target price of RM20.00 implies a 2019F PE of 20x, slightly above its five-year historical mean of 19.5x. Entry price is RM18.50.
Vincent Khoo, CFA
+603 2147 1998 [email protected]
Fong Kah Yan +603 2147 1993
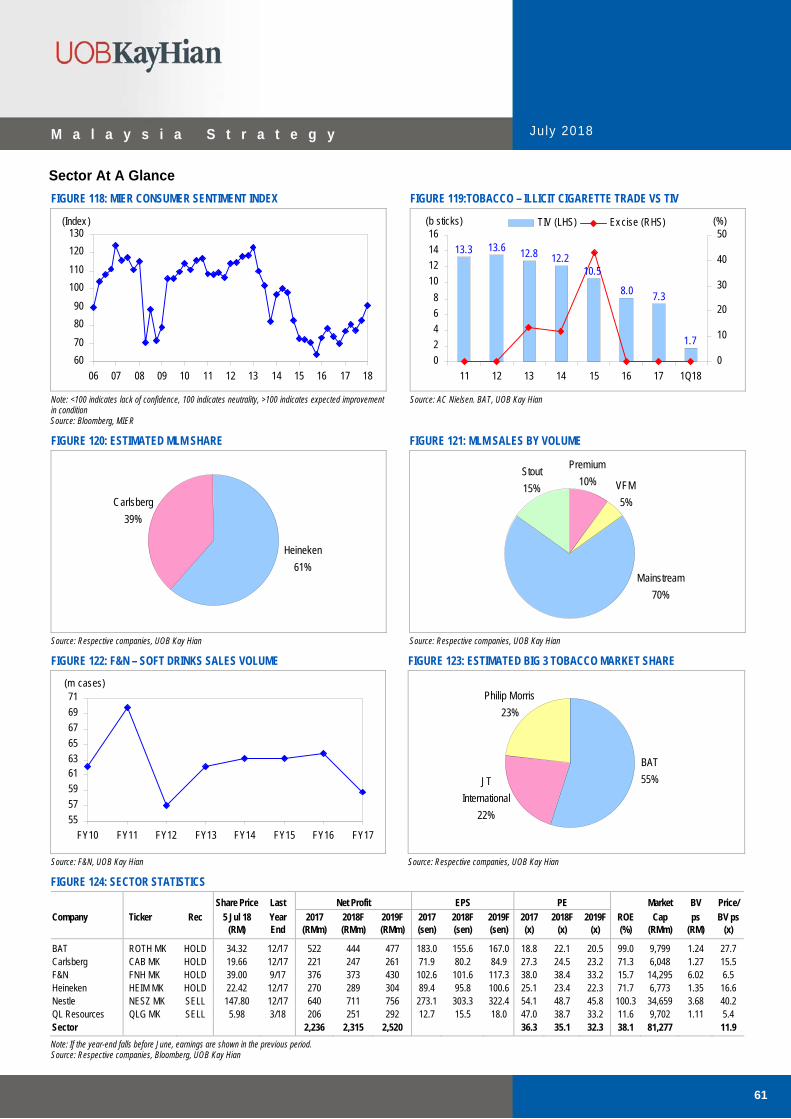
M a l a y s i a S t r a t e g y July 2018
61
Sector At A Glance
FIGURE 118: MIER CONSUMER SENTIMENT INDEX FIGURE 119:TOBACCO – ILLICIT CIGARETTE TRADE VS TIV
60
70
80
90
100
110
120
130
06 07 08 09 10 11 12 13 14 15 16 17 18
(Index )
1.7
7.3
13.3 13.6 12.8 12.210.5
8.0
0
2
4
6
8
10
12
14
16
11 12 13 14 15 16 17 1Q18
0
10
20
30
40
50TIV (LHS) Ex cise (RHS) (b sticks) (%)
Note: <100 indicates lack of confidence, 100 indicates neutrality, >100 indicates expected improvement in condition Source: Bloomberg, MIER
Source: AC Nielsen. BAT, UOB Kay Hian
FIGURE 120: ESTIMATED MLM SHARE FIGURE 121: MLM SALES BY VOLUME
Carlsberg
39%
Heineken
61%
Premium
10% VFM
5%
Mainstream
70%
Stout
15%
Source: Respective companies, UOB Kay Hian Source: Respective companies, UOB Kay Hian
FIGURE 122: F&N – SOFT DRINKS SALES VOLUME FIGURE 123: ESTIMATED BIG 3 TOBACCO MARKET SHARE
55
57
59
6163
65
67
69
71
FY10 FY11 FY12 FY13 FY14 FY15 FY16 FY17
(m cases)
BAT
55%JT
International
22%
Philip Morris
23%
Source: F&N, UOB Kay Hian Source: Respective companies, UOB Kay Hian
FIGURE 124: SECTOR STATISTICS
Share Price Last Net Profit EPS PE Market BV Price/
Company Ticker Rec 5 Jul 18 Year 2017 2018F 2019F 2017 2018F 2019F 2017 2018F 2019F ROE Cap ps BV ps (RM) End (RMm) (RMm) (RMm) (sen) (sen) (sen) (x) (x) (x) (%) (RMm) (RM) (x)
BAT ROTH MK HOLD 34.32 12/17 522 444 477 183.0 155.6 167.0 18.8 22.1 20.5 99.0 9,799 1.24 27.7 Carlsberg CAB MK HOLD 19.66 12/17 221 247 261 71.9 80.2 84.9 27.3 24.5 23.2 71.3 6,048 1.27 15.5 F&N FNH MK HOLD 39.00 9/17 376 373 430 102.6 101.6 117.3 38.0 38.4 33.2 15.7 14,295 6.02 6.5 Heineken HEIM MK HOLD 22.42 12/17 270 289 304 89.4 95.8 100.6 25.1 23.4 22.3 71.7 6,773 1.35 16.6 Nestle NESZ MK SELL 147.80 12/17 640 711 756 273.1 303.3 322.4 54.1 48.7 45.8 100.3 34,659 3.68 40.2 QL Resources QLG MK SELL 5.98 3/18 206 251 292 12.7 15.5 18.0 47.0 38.7 33.2 11.6 9,702 1.11 5.4 Sector 2,236 2,315 2,520 36.3 35.1 32.3 38.1 81,277 11.9
Note: If the year-end falls before June, earnings are shown in the previous period. Source: Respective companies, Bloomberg, UOB Kay Hian

M a l a y s i a S t r a t e g y July 2018
62
Gaming OVERWEIGHT
WHY WE ARE OVERWEIGHT
Stronger consumer sentiment amid zero-rated GST and casino segment’s capacity expansion.
Valuations <1 SD, backed by decent dividend yields of >5% for NFOs and 4% for GENM.
Unique company catalysts, including Magnum’s potential listing of 6.3%-owned U-Mobile.
WHAT TO WATCH OUT FOR IN 2H18
GENM’s opening of 20th Century Fox World Theme Park by end-18, after numerous delays.
Newsflow on Japan IR concession bidding. Gaming duties likely to be raised.
Outlook
FIGURE 125: GAMING UNDERPERFORMS FBMKLCI
85
90
95
100
105
110
Jan Feb Mar Apr May Jun Jul
Gaming
FBMKLCI
End Dec 17=100
Source: Bloomberg, UOB Kay Hian
Gaming sector has underperformed FMBKLCI ytd… Despite having a good start in the early part of the year, gaming stocks have underperformed the FBMKLCI ytd (-9.1% ytd vs the FBMKLCI’s -5.9% ytd loss), dragged by heavyweight casino companies post 14th general election (GE14). While the overall environment post GE14 should benefit the gaming sector (earnings uplift with the abolishment of the Goods and Services Tax (GST), and stronger consumer sentiment), concern over high foreign shareholdings in casinos (38-45%) have dampened share prices, in view of the ringgit softening amid uncertainties posed by new government policies and the country’s high debt level.
…but outperformed FBMKLCI post GE14. Nevertheless, the gaming sector has outperformed FBMKLCI post GE14 (-1.2% vs FBMKLCI’s -8.4% from 9 May to to-date) as investors flock to a dwindling pool of defensive stocks. Specifically, the long-depressed number forecasting operators (NFO) segment has spiked 15% post GE14 to outshine the casino segment which has fallen 3% for the same period.
Maintain OVERWEIGHT; prefer casinos over NFOs. Stronger consumer sentiment amid zero-rated GST and casinos’ capacity expansion point to earnings growth/recovery for the gaming segment. Decent dividend yield coupled with potential positive newsflow support our OVERWEIGHT call although there is still impairment risk for the casino segment and licence renewal risk for Berjaya Sports Toto’s (BST) Philippines operation. We expect the casino segment to shine following the NFO segment’s 1H18 outperformance. Top picks are Genting Malaysia (GENM) and Magnum. Magnum’s upside should be more gradual after May’s spectacular rally but the long-speculated potential listing of its 6%-owned U-Mobile could provide further uplift to the share price.
Sector outperforms FMBKLCI post GE14 as investors flock to defensive plays
OVERWEIGHT gaming sector; prefer casino segment ahead of opening of 20th Century Fox theme park

M a l a y s i a S t r a t e g y July 2018
63
High foreign shareholdings largely unchanged. The casino segment’s relative underperformance in the sector could partly reflect concerns of foreign shareholders exiting the Malaysia bourse. Interestingly, however, we understand that there were little changes in foreign shareholdings post-GE14. GENM’s foreign shareholding was 38.3% as at 29 June (vs 39.2% as at 2 April) while Genting Bhd’s (GENT) was largely unchanged at around 45%. Meanwhile, the foreign shareholdings for BST and Magnum were largely stable at 12% and 26% respectively. This observation led us to conclude that foreign shareholdings in the gaming sector will not be swayed by the new political landscape.
Zero-rated GST could boost sector earnings by 10-12% on a full-year basis… The new government’s zero-rating of the 6% GST effective 1 Jun 18 is estimated to boost NFOs’ net profit by 10-12% and GENM’s adjusted EBITDA by 11% on a full-year basis. Prior to Jun 18, both casinos and NFOs fully absorbed the 6% GST.
...but there could be moderate impact on gaming duty hikes. While gaming companies are a clear beneficiary of zero-rated GST, the government will likely increase the existing gaming taxes to lift its revenue (we estimate the gaming sector’s total tax contribution accounted for about 1.5% of the government’s total revenue in 2017). However, we expect the impact of gaming duty hikes to be moderate at worst. First, quantum of the duty hikes would need to be balanced against further outflow into the illegal market, particularly for the NFO segment, and against regional competitors for the casino segment. In addition, impact to the sector’s bottom line would be mitigated by NFO players’ likely passing on of the duty hikes to punters, which in turn fans the illegal market and dilutes the government’s revenue collection. While the casino segment will likely bear the full brunt of the duty hikes as they are unable to change the card games’ payout, the Genting Group’s earnings stream is geographically diversified (see subsequent segments for earnings sensitivity towards gaming tax hike).
Sector to benefit from strong consumer sentiment and higher disposable income. With the reduction of the GST rate to 0%, reintroduction of the petrol subsidy and promises of a minimum wage increase to address the higher cost of living, the gaming sector is expected to benefit from a recovery in consumer sentiment (particularly in the Jun-Aug 18 period when purchases are exempted from GST and SST).
High foreign shareholdings will not be swayed by new political landscape
Zero-rated GST suggests earnings enhancement for now, but…
…there is still a possibility for gaming duty tax hikes to minimise government’s loss of revenue
Consumer sentiment to improve, particularly in Jun-Aug 18 GST and SST free period

M a l a y s i a S t r a t e g y July 2018
64
CASINO SEGMENT
Event catalysts to emerge in end-18 with good earnings visibility through to 2019. The casino segment should benefit from good earnings visibility through to 2019, led by Genting Highland’s further improvement in visitor arrivals post the opening of the iconic 20th Century Fox World Theme Park (Fox Theme Park), higher gaming volumes and absence of start-up costs related to the Genting Integrated Tourism Plan (GITP) project in 2018. We expect GENM’s share price to react positively nearer to the opening of Fox Theme Park, which will further inflate visitor arrivals to Genting Highlands. Moreover, we expect parent company GENT’s share price to trend up in the lead-up to Genting Singapore’s (GENS) submission of its bid for the Japan integrated resorts (IR) concession, which is expected to be 2019.
Impressive visitor arrivals and… Due to the opening of new attractions (Sky Casino, Sky Avenue retail mall and Theme Park Hotel as well as Genting Premium Outlet at the mid-hill), GENM’s Genting Highlands has recorded impressive 26% yoy visitor arrival growth, having welcomed 6.5m visitors in 1Q18. We estimate visitor arrivals to increase from 23.6m in 2017 to 28.0m in 2019.
…healthy underlying gaming volume growth. Both VIP and mass market gross gaming revenue (GGR) recorded double-digit yoy growth in 1Q18, reflecting the full impact of capacity expansion undertaken since 2Q17. We expect gaming volume, particularly in the mass market segment, to improve further towards end-18 to 2019, thanks to the opening of an indoor theme park (targeting end-3Q18) and Fox Theme Park (still targeting end-18). All in all, we expect GENM to deliver a two-year EBITDA CAGR of 26% through 2019.
Potential gaming tax hike impact would be moderate. Recently, there have been expectations for gaming duties to be raised after the GST was abolished, so as to augment the government’s revenue. We believe such a potential tax hike impact would be moderate, considering that a significant higher tax would reduce Malaysia’s competitiveness to regional peers. The current gaming taxes for the VIP and mass market segments are 10%/ 25%, vs effectively 5%/15% in Singapore. Figure 126 and Figure 127 provide 2019 EBITDA sensitivity towards gaming tax hikes for GENM and GENT respectively.
FIGURE 126: GENM’S 2019 EBITDA GROWTH (%) SENSITIVITY TO VIP AND MASS MARKET GAMING TAX HIKES
VIP Market Gaming Tax (%)
Mass Market Gaming Tax (%) 10 12 15 20
25 0 (2) (5) (10)
28 (4) (6) (9) (14)
30 (7) (9) (12) (17)
35 (14) (16) (19) (24)
Source: UOB Kay Hian
FIGURE 127: GENT’S 2019 EBITDA GROWTH (%) SENSITIVITY TO VIP AND MASS MARKET GAMING TAX HIKES
VIP Market Gaming Tax (%)
Mass Market Gaming Tax (%) 10 12 15 20
25 0 (1) (2) (4)
28 (2) (2) (4) (6)
30 (3) (4) (5) (7)
35 (6) (6) (8) (10)
Source: UOB Kay Hian
Potential slight cost overrun at Fox Theme Park? Our channel checks suggest that GENM has submitted accelerated work orders for the construction of Fox Theme Park, suggesting a cost overrun for the RM2b theme park. While management is sticking to its previous opening timeline guidance of end-18, we believe there is still a possibility of only a partial opening at end-18 or a more complete opening in early-19. Nevertheless, we make no change to our forecasts and assume the theme park will open in 1Q19.
Catalysts: a) opening of indoor and Fox theme parks to inflate visitor arrivals and gaming volume, b) GENS’ Japan IR bid
Visitor arrivals jumped 26% yoy in 1Q18…
…with mass and VIP GGR up by double digits yoy, after opening of new attractions under GITP project
Gaming tax hikes unlikely to be significant as they will hurt Malaysia’s competitiveness to regional casinos.
We expect short-lived share price reaction

M a l a y s i a S t r a t e g y July 2018
65
US: Smaller losses at Bimini and not much excitement at RWNY. Due to cost rationalisation initiatives, GENM’s Bimini operations in the US have finally seen sustainable smaller losses. EBITDA losses shrank to US$7m p.a. in 4Q17 and 1Q18 (4Q16: -US$41m, 1Q17: -US$17m) but we remain sceptical that Bimini could turn profitable by 2H18-1H19. For Resorts World Casino New York City (RWNY), revenue growth was tepid and EBITDA fell in 4Q17-1Q18 due to higher advertising and payroll costs. However, management expects margins to recover in subsequent quarters.
Japan: IR bidding a major catalyst for GENT. GENT is expected to react positively on GENS’ new progress in the Japan IR bidding, particularly towards the request for proposal (RFP) stage, expected in 2019. Thus far, the establishment of the casino industry in Japan is on track. Legislators in Japan’s lower house passed the IR implementation bill on 19 June, then extended the legislative session to 22 July to enable upper house consideration of this final step toward casino legalisation. GENS’ management is optimistic about the progress of the establishment of IRs in Japan and is actively preparing for the ensuing bidding exercises by the government. Separately, monetisation of non-gaming properties (injecting its hotel and theme park properties into a business trust) by GENS could also be a minor catalyst.
Attractive valuations. GENM’s and GENT’s current share prices are attractive, ahead of event catalysts emerging towards year-end. Essentially, GENM trades at 10.4x/8.4x 2018/19 EV/EBITDA (below mean) while parent company GENT trades at 6.4x/6.1x 2018/19 EV/EBITDA (close to -2SD mean), at a significant EV/EBITDA discount to its subsidiaries (GENS’ 2018/19 EV/EBITDA at 8.6x/8.0x). Separately, Malaysian casinos’ valuations remain undemanding from a regional perspective.
Impairment risks remain. However, there are impairment risks for GENM’s RM1.6b interest-bearing promissory notes investment in the US Mashpee Wampanoag Tribe’s (Tribe) IR and GENT’s investment in pharmaceutical R&D company TauRx. Recall that in 4Q17, GENT recognised a US50m impairment for an unspecified life science investment which was never revealed to the investment community. Meanwhile, GENM recently carried out an impairment assessment of the recovery of the notes based on the probable outcome of the pending legal case. Based on its review of the projected operational cash flows of the casino, the promissory notes are expected to be fully recovered and as such, no impairment is required for the notes for now. However, there is still longer-term impairment risk, in our view.
FIGURE 128: REGIONAL CASINO EV/EBITDA VALUATIONS FIGURE 129: GENM EV/EBITDA
6
8
10
12
14
16
18
Gen
ting
Bhd
Gen
ting
Sing
apor
e
Nag
a C
orp
Star
Ent
erta
inm
ent
Gen
ting
Mal
aysi
a
Cro
wn
Res
orts
MG
M C
hina
Gal
axy
SJM
Wyn
n M
acau
Sand
s C
hina
(x )
6
7
8
9
10
11
12
13
14
15
Jun 11 Jun 12 Jun 13 Jun 14 Jun 15 Jun 16 Jun 17 Jun 18
(x )
+2SD
+1SD
Mean
-1SD
-2SD
Source: Bloomberg, UOB Kay Hian Source: UOB Kay Hian
FIGURE 130: PROSPECTIVE TIMELINE FOR DEVELOPMENT OF IRs IN JAPAN
Bimini’s turnaround still not on the cards despite narrowed losses
GENT could react positively on GENS’ progress in Japan IR bidding, particularly towards RFP stage
Valuations at historical average and undemanding relative to regional peers
Impairment risks on Tribe IR investments (GENM) and TauRx (GENT) persist

M a l a y s i a S t r a t e g y July 2018
66
Source: GMA

M a l a y s i a S t r a t e g y July 2018
67
NFO SEGMENT
Stabilised ticket sales. The NFO industry has seen ticket sales stabilise in the past two quarters after years of decline. We expect the industry to see positive, albeit mild, ticket sales growth in the low single digits this year. With the stronger consumer sentiment and higher disposable income after the implementation of zero-rated GST, the NFO industry’s long-term outlook is more certain now. Hopefully, the new government can curb illegal operators, which will help minimise the government’s loss of revenue. However, sales would be vulnerable should government introduce a significant gaming tax hike, assuming the NFO industry passes on the cost increase to punters.
Short-term impact from 2018 FIFA World Cup. We believe there could be mild negative revenue impact from the 2018 FIFA World Cup, which started on 14 June. Quarterly ticket sales per draw dropped 3.0-3.5% yoy during the 2014 FIFA World Cup.
Operators introduced new games… NFOs have introduced new jackpot games that are difficult to be mimicked by illegal operators in a bid to revive sales. Magnum launched its new non-classic game Magnum Life on 25 April to replace 4D Powerball. Da Ma Cai’s (DMC) non-classic game 3+3D Bonus replaced DMC Jackpot on 28 April. BST introduced Star Toto 6/50 to replace Grand 6/63 on 21 Oct 17 while Sabah’s NFO, Sabah 88, introduced its 4D jackpot game in the state in Nov 17.
…with lower minimum bets to attract punters. Interestingly, all the NFOs’ new games feature a lower minimum bet of RM1 (RM2 minimum for the older jackpot games), which could attract classic-game punters to try their luck with non-classic games, which offer higher margins for NFOs, as well as younger punters.
Newsflow-driven catalysts still on the cards. We expect the next leg of meaningful share price growth to be newsflow-driven, such as legalisation of online betting, more rigorous measures to counter illegal gambling by the new government, and newsflow on Magnum.
NFO players may pass on costs if gaming tax hikes materialise. The NFO industry saw its pool betting duty revised to 8% (from 6%) in 2011, and the industry’s ticket sales growth has been on the downtrend since then. The recently stabilised ticket sales would be vulnerable should the government revise the existing gaming tax (8%) and pool betting duty (8% net of gaming tax). Higher duties may force operators to pass on cost by lowering prize payout, which in turn may force more punters to patronise the illegal market which offers higher attractive prize payout. This ultimately dilutes the government’s revenue drive. The illegal market is thought to be at least twice the size of the legal market. Figure 131 provides 2019 earnings sensitivity towards pool betting duty hike.
FIGURE 131: NFO’S FY19 NET PROFIT GROWTH (%) SENSITIVITY TO GAMING TAX HIKES
Gaming Tax (%)
Pool Betting Duty (%) 8 9 10
8 0 (7) (13)
9 (7) (14) (21)
11 (22) (29) (35)
Source: UOB Kay Hian
Lower chances of paying RM476m IRB penalty now. We believe chances of Magnum paying the full Inland Revenue Board (IRB) penalty are much lower now. Malaysia’s new Prime Minister, Dr Mahathir Mohamad, said the new government will investigate whether the IRB had harassed certain businesses to pay unreasonable taxes. To recap, Magnum was originally served with notices of assessment with a total penalty of RM476m by the IRB in May 17. The notices of assessment were raised pursuant to: a) disallowance for Magnum’s deduction of interest and loan stock interest expenses incurred in 2008-13 for the court-sanctioned selective capital repayment exercise and privatisation of Magnum Corporation in 2008, and b) disallowance of Magnum’s deduction of interest expenses for investments. Recall that before relisting in 2013, Magnum was privatised by a JV between private equity CVC Capital Partners and the present controlling shareholder.
Ticket sales stable for past two quarters after years of decline; expecting low single-digit ticket sales growth in 2018
Quarterly ticket sales per draw down 3.0-3.5% yoy during 2014 FIFA World Cup
Non-classic new games hard for illegal operators to copy
New games’ minimum bet at only RM1
After May’s stellar share price performance, next leg of share price growth would be newsflow-driven
NFOs need to pass through additional gaming tax which could further drive up the illegal market
Cancellation of IRB penalty for Magnum possible as new government disagrees with IRB’s request for taxes

M a l a y s i a S t r a t e g y July 2018
68
Potential monetisation of U-Mobile stake a major catalyst. We understand that U-Mobile has turned EBITDA positive, and the decision to end a networking sharing deal with Maxis is expected to significantly lift U-Mobile’s prospective EBITDA. U-Mobile could be seeking an IPO. This will allow Magnum to cash out from its investment in U-Mobile (book value of RM260m, 8.5% of market cap), which will in turn significantly enhance its well-established capital management practice. Magnum could also cash out to a private equity investor ahead of the IPO. U-Mobile’s other shareholders are Berjaya Group’s Tan Sri Vincent Tan, Singapore Technologies Telemedia and Sultan Ibrahim of Johor.
BST still waiting for final outcome for licence renewal. For the NFO segment, BST’s 88%-owned subsidiary, Berjaya Philippines (BP), is in legal proceedings with the Philippine Charity Sweepstakes Office (PCSO). The Arbitral Tribunal had ruled that BP has no exclusive right to supply lottery systems in the Luzon territory. BP appealed the Arbitral Tribunal’s decision. BP’s licence remains valid through to 21 Aug 18. In fact, in 4QFY18, BST impaired RM11m goodwill relating to its Philippines’ lottery equipment segment due to the risk of its rights to maintain the business indefinitely. Further impairment is possible should the court case drag on. We estimate goodwill from the Philippines’ lottery business at RM70m, post the latest impairment. Should BP fail to renew its licence, we estimate a 10-12% downside risk to BST’s sustainable earnings in FY19-20, beyond further impairment risk (BST recognised an RM11m impairment in its 4QFY18 results). Nevertheless, BST’s dividends will not be impacted should it fail to renew the licence, as its dividend payout has never been dependent on BP's cash flows. BST does not repatriate BP’s retained earnings as that will incur repatriation taxes, but instead, prefers to reinvest BP’s cash.
Liberalisation of online betting for NFO industry later than sooner. The long-awaited amendment of the Gaming Act may still materialise in 2019, but the first amendment only targets to root out illegal online gaming operators. There needs to be another amendment to accord BST and Magnum the same level playing field as DMC to offer online betting.
Compelling dividend yields. NFO’s yields are still compelling at 5.6-7.5%, despite NFOs’ share price rally of >20% in May. For Magnum, we conservatively assume 70% earnings payout (2017: 77%) in 2018-20, pending the final outcome of its IRB penalty court case. Prospective yields would be 7.5-8.5% (current: 5.6%) should payout ratio increase to 90-100% once it builds up sufficient reserves (expected by end-19) against the IRB tax claim. For BST, prospective yield is still decent at 7.5%, based on an 80% payout.
Successful listing of U-Mobile could allow Magnum to cash out from this investment at RM0.18/share
Worst-case scenario of not getting licence renewal will see 10-12% downside to BST’s earnings but yield will not be hurt
All three NFO players could see liberalisation of NFO online betting
NFOs’ yields still compelling at 5.6-7.5% with potential yield upside for Magnum

M a l a y s i a S t r a t e g y July 2018
69
Strategy
Maintain OVERWEIGHT; prefer casinos over NFOs. We prefer casinos over NFOs, as the casino segment will benefit from both earnings growth and newsflow (opening of Fox Theme Park). NFOs’ upside should be more gradual after May’s spectacular rally, although the long-speculated potential listing of Magnum’s 6%-owned U-Mobile could provide further uplift to Magnum.
Key picks are GENM and Magnum. We continue to value exposure to GENM in the Genting Group as it directly benefits from the GITP project. For NFOs, we prefer Magnum for its potential upside from newsflow (listing of U-Mobile and cancellation of IRB penalty) and potential upside for dividend yield.
FIGURE 132: 2018 EV/EBITDA vs ROE FIGURE 133: GENTING GROUP’S EV/EBITDA
5
7
9
11
13
15
17
19
0 5 10 15 20 25 30 35 40 45 50
Genting Malay sia
Genting Singapore
Genting Bhd
Sands China
MGM China
Wy nn Macau
Galax y Entertainment
SJM
EV/EBITDA (x )
ROE (%)
Naga Corp
6
8
10
12
14
16
18
Jun 11 Jun 12 Jun 13 Jun 14 Jun 15 Jun 16 Jun 17 Jun 18
Genting SingaporeGenting BhdGenting Malay sia
(x )
Source: UOB Kay Hian Source: UOB Kay Hian
Genting Malaysia (GENM/BUY/RM5.19/Target: RM6.28). Maintain BUY and target price of RM6.28, which implies target 2019F EV/EBITDA and PE of 10.8x and 15.2x respectively. We expect investors to revisit the bullish sentiment for the stock closer to the opening of Fox Theme Park, price in strong earnings growth through 2019, and brush off concerns of a potential one-off impairment of its RM1.5b investment in the US Tribe project.
Magnum (MAG/BUY/RM2.28/Target: RM2.50). Maintain BUY and target price of RM2.50, which implies 15.1x/14.1x 2018F/19F PE (before considering a potential one-off provision for the settlement with the IRB). In addition to the industry’s stable outlook, event catalysts monetisation of its stake in U-Mobile (RM260m, or RM0.18/share) and cancellation of the IRB penalty could provide the next share price rally. 2018-19 yields are still decent at 5.6-5.9% in despite of our conservative payout assumption of 70% (vs >90% historically, except 2017). We expect Magnum to reinstate its 90-100% dividend payout practice in 2020, once it accumulates sufficient reserves against the IRB’s claims, even if the case should drag on. This would imply a dividend yield of 7.5-8.5%.
Genting Bhd (GENT MK/BUY/RM8.93/Target: RM10.86). Maintain BUY with a SOTP-based target price of RM10.86. GENT is trading at 6.6x/6.1x 2018/19 EV/EBITDA (below -1SD mean), at a significant discount to its subsidiaries (GENS’ and GENM’s 2018/19 EV/EBITDA at 9.2x/8.7x and 11.5x/9.1x respectively). GENT will indirectly benefit from its subsidiaries’ event catalysts, including GENS’ good long-term prospects in clinching an IR concession in Japan. However, this could be offset by the concern over the impairment risks of its various investments in life science companies.
Berjaya Sports Toto (BST/BUY/RM2.61/Target: RM2.78). Maintain BUY and target price of RM2.78, which implies 12.4x FY19F PE. Similar to Magnum, BST could benefit from the industry’s stable outlook. However, BST’s FY19-20 earnings are estimated to drop 10-12%, should its subsidiary, BP, fail to renew its licence (due on 21 Aug 18) due to an unfavourable court outcome. However, this will not impact BST’s yield (FY19F: 7.5%) as BST’s dividends have never been dependent on BP's cash flows.
Stronger consumer sentiment amid zero-rated GST, casinos’ capacity expansion and potential positive newsflow support our OVERWEIGHT call
Prefer GENM to GENT for direct exposure to GITP project; prefer Magnum to BST for potential upside on newsflow and earnings payout
GENM: Expecting bullish sentiment closer to opening of Fox Theme Park
Magnum: Watch out for event catalysts and yield upside
GENT: Indirectly benefitting from subsidiaries’ event catalysts
BST: Philippines licence renewal could be at risk but yield will not be impacted

M a l a y s i a S t r a t e g y July 2018
70
FIGURE 134: REGIONAL PEER COMPARISON – CASINO SEGMENT
EV/EBITDA Div Yield Share Price Market Cap 2018F 2018F Country Ticker Rec 5 Jul 18 Target Price (US$m) (x) (%)
Malaysia (RM) (RM)
Genting Bhd GENT MK BUY 8.44 10.86 7,999 6.5 2.5
Genting Malaysia GENM MK BUY 4.85 6.28 6,786 10.4 3.6 Macau (HK$) (HK$)
Galaxy Entertainment 27 HK BUY 55.95 75.00 30,790 13.0 1.7
SJM 880 HK BUY 8.62 13.50 6,215 17.0 2.6
Wynn Macau 1128 HK HOLD 22.15 26.00 14,669 12.5 5.0
Sands China 1928 HK BUY 38.95 52.00 40,105 13.5 5.8
MGM China 2282 HK HOLD 16.38 19.50 7,932 14.7 3.3 Singapore (S$) (S$)
Genting Singapore GENS SP BUY 1.18 1.38 10,413 8.5 2.5 Philippines
Bloomberry Resorts bloom PM NOT RATED 10.04 n.a. 2,069 7.4 0.9
Travellers Int RWM PM NOT RATED 5.00 n.a. 1,474 18.9 0.7
Melco Crown Phi MRP PM NOT RATED 5.14 n.a. 545 5.0 0.0 Australia (A$) (A$)
Crown Resorts CWN AU NOT RATED 13.49 n.a. 6,850 10.9 4.4
Star Entertainment SGR AU NOT RATED 4.91 n.a. 3,327 9.7 3.7 US (US$) (US$)
MGM Resorts MGM US NOT RATED 28.41 n.a. 15,818 10.7 1.7
Wynn Resorts WYNN US NOT RATED 154.84 n.a. 16,814 11.5 1.9
Las Vegas Sands LVS US NOT RATED 72.22 n.a. 56,995 12.8 4.3
Melco Crown MLCO US NOT RATED 24.97 n.a. 12,343 9.9 2.3
Source: Bloomberg, UOB Kay Hian
Vincent Khoo, CFA +603 2147 1998
Yeoh Bit Kun +603 2147 1988

M a l a y s i a S t r a t e g y July 2018
71
Sector At A Glance
FIGURE 135: GENTING GROUP’S LISTED COMPANIES EV/EBITDA FIGURE 136: GENT EBITDA BREAKDOWN (FY19F)
5
7
9
11
13
15
17
19
Jun 11 Jun 12 Jun 13 Jun 14 Jun 15 Jun 16 Jun 17 Jun 18
Genting SingaporeGenting BhdGenting Malay sia
(x )
Others
8%Plantation
8%
Genting
Singapore
44%
Genting
Malay sia
41%
Source: UOB Kay Hian Source: UOB Kay Hian
FIGURE 137: GENM – GENTING HIGHLANDS’ VISITORS ARRIVAL TREND
FIGURE 138: GENT’S EV/EBITDA
17
19
21
23
25
27
29
11 12 13 14 15 16 17 18F 19F
(m)
6
7
8
9
10
11
12
Jun 11 Jun 12 Jun 13 Jun 14 Jun 15 Jun 16 Jun 17 Jun 18
(x )
2SD
1SD
Mean
-1SD
-2SD
Source: GENM, UOB Kay Hian Source: UOB Kay Hian
FIGURE 139: CURRENT NFO GAMING DUTIES AND TAXES FIGURE 140: ESTIMATED NFO MARKET SHARE
Taxes/Duties/Contributions (%)
Gaming Tax 8% on gross gaming revenue
Pool Betting Duty Normal draws: 8% on net gaming revenue
Special draws: 6% on net gaming revenue
Contribution to National Sports Council (NSC)
10% of PBT
Special Duties to Government on Special Draws
10% on net gaming revenue for special draws only
Berjay a
Sports Toto
40%
Magnum
40%
Pan Malay sia Pool
20%
Source: UOB Kay Hian Source: UOB Kay Hian
FIGURE 141: SECTOR STATISTICS
Share Price Last Net Profit EPS PE Market BV Price/
Company Ticker Rec 5 Jul 18 Year 2017 2018F 2019F 2017 2018F 2019F 2017 2018F 2019F ROE Cap ps BV ps (RM) End (RMm) (RMm) (RMm) (sen) (sen) (sen) (x) (x) (x) (%) (RMm) (RM) (x)
Berjaya Sports Toto BST MK BUY 2.41 4/18 255 304 319 19.0 22.5 23.7 12.7 31.2 32.2 30.7 3,246 0.54 4.5
Genting Bhd GENT MK BUY 8.44 12/17 2,051 2,700 2,879 53.5 70.5 75.1 15.8 12.0 11.2 4.3 32,340 8.72 1.0
Genting Malaysia GENM MK BUY 4.85 12/17 1,407 1,787 2,351 24.9 31.6 41.6 19.5 15.4 11.7 5.9 27,435 3.34 1.5
Magnum MAG MK BUY 2.09 12/17 207 239 255 14.5 16.8 17.9 14.4 12.5 11.7 8.4 2,974 1.74 1.2
Sector 3,921 5,029 5,803 16.8 13.1 11.4 5.4 65,994 1.1
Note: If the year-end falls before June, earnings are shown in the previous period. Source: Respective companies, Bloomberg, UOB Kay Hian
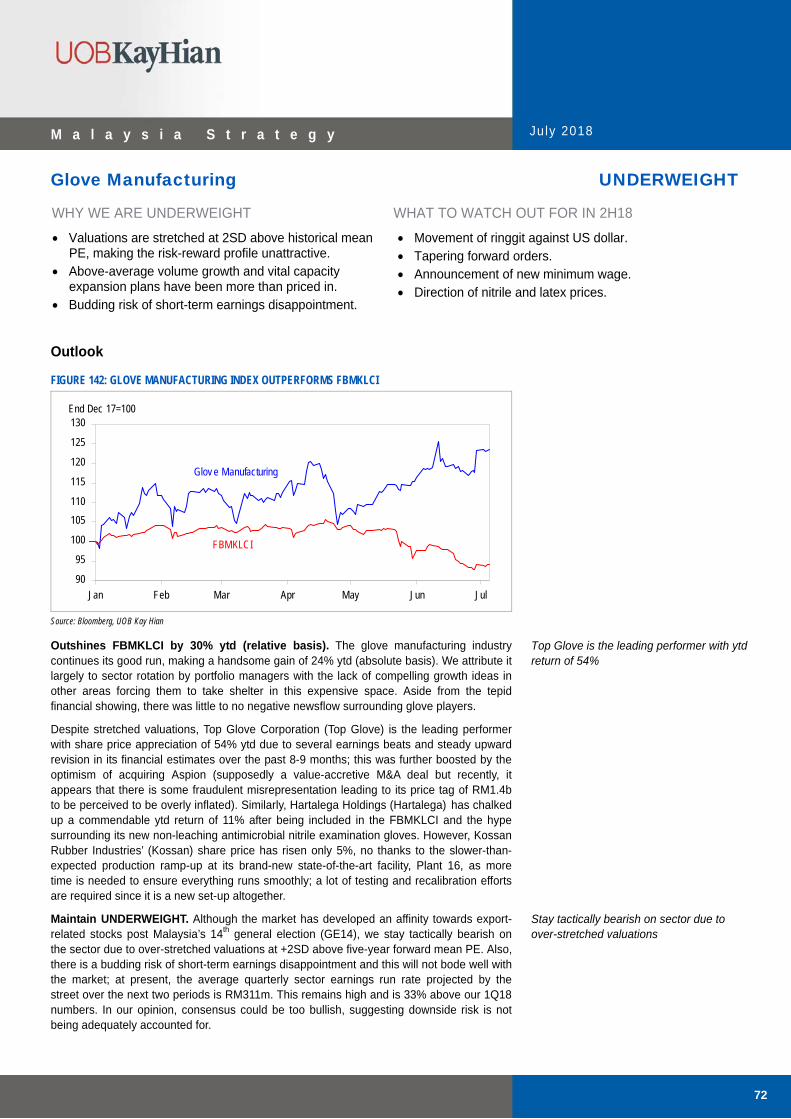
M a l a y s i a S t r a t e g y July 2018
72
Glove Manufacturing UNDERWEIGHT
WHY WE ARE UNDERWEIGHT
Valuations are stretched at 2SD above historical mean PE, making the risk-reward profile unattractive.
Above-average volume growth and vital capacity expansion plans have been more than priced in.
Budding risk of short-term earnings disappointment.
WHAT TO WATCH OUT FOR IN 2H18
Movement of ringgit against US dollar. Tapering forward orders. Announcement of new minimum wage. Direction of nitrile and latex prices.
Outlook
FIGURE 142: GLOVE MANUFACTURING INDEX OUTPERFORMS FBMKLCI
90
95
100
105
110
115
120
125
130
Jan Feb Mar Apr May Jun Jul
Glov e Manufacturing
FBMKLCI
End Dec 17=100
Source: Bloomberg, UOB Kay Hian
Outshines FBMKLCI by 30% ytd (relative basis). The glove manufacturing industry continues its good run, making a handsome gain of 24% ytd (absolute basis). We attribute it largely to sector rotation by portfolio managers with the lack of compelling growth ideas in other areas forcing them to take shelter in this expensive space. Aside from the tepid financial showing, there was little to no negative newsflow surrounding glove players.
Despite stretched valuations, Top Glove Corporation (Top Glove) is the leading performer with share price appreciation of 54% ytd due to several earnings beats and steady upward revision in its financial estimates over the past 8-9 months; this was further boosted by the optimism of acquiring Aspion (supposedly a value-accretive M&A deal but recently, it appears that there is some fraudulent misrepresentation leading to its price tag of RM1.4b to be perceived to be overly inflated). Similarly, Hartalega Holdings (Hartalega) has chalked up a commendable ytd return of 11% after being included in the FBMKLCI and the hype surrounding its new non-leaching antimicrobial nitrile examination gloves. However, Kossan Rubber Industries’ (Kossan) share price has risen only 5%, no thanks to the slower-than-expected production ramp-up at its brand-new state-of-the-art facility, Plant 16, as more time is needed to ensure everything runs smoothly; a lot of testing and recalibration efforts are required since it is a new set-up altogether.
Maintain UNDERWEIGHT. Although the market has developed an affinity towards export-related stocks post Malaysia’s 14th general election (GE14), we stay tactically bearish on the sector due to over-stretched valuations at +2SD above five-year forward mean PE. Also, there is a budding risk of short-term earnings disappointment and this will not bode well with the market; at present, the average quarterly sector earnings run rate projected by the street over the next two periods is RM311m. This remains high and is 33% above our 1Q18 numbers. In our opinion, consensus could be too bullish, suggesting downside risk is not being adequately accounted for.
Top Glove is the leading performer with ytd return of 54% Stay tactically bearish on sector due to over-stretched valuations

M a l a y s i a S t r a t e g y July 2018
73
FIGURE 143: KEY ASSUMPTIONS
2018F 2019F 2020F
Sales Volume Growth (yoy % chg) 14.4 9.2 9.5
Utilisation Rate (%) 85.0 85.0 85.0
Blended ASP (US$/’000 pcs) 21.2 21.8 22.2
Blended EBIT Margin Assumption (%) 15.6 16.0 16.1
Latex Price (RM/kg) 5.46 5.51 5.54
Nitrile Price (US$/kg) 0.99 1.01 1.03
Exchange Rate (RM/US$) 4.08 4.03 3.97
Source: UOB Kay Hian
Good times may not last. Based on industry data, 2017 glove export volume expanded 16% yoy (2016: +6% yoy), driven primarily by stronger demand in the nitrile space (+23% yoy) vs natural rubber gloves (+7% yoy). This was owing to the supply gap created by the temporary closure of some vinyl glove factories in China due to environmental issues. Consequently, it led to product substitution and hence, benefitted international glove players like Top Glove and Hartalega. The market foresees similar volume growth in 2018 (mid to high teens), expecting the shortage in China to become a permanent fixture. However, we think otherwise, seeing some moderation in export volume (moving back towards the mid to high single-digit growth rate).
In the short haul, there is an escalating threat of slower demand as we observe tapering forward orders. Hartalega has about two months of forward orders, lower than Feb 18's level of three months (sold out until Jul-Aug 18). Top Glove is facing the same phenomenon; sales backlog for its nitrile gloves has shortened to 40-50 days from 60 days. Another implication of this could be rising competition where more nitrile glove supply capacity is coming on stream. Also, this could be due to a scenario where the vinyl glove undersupply in China is recovering as capacity restarts after 2017’s environmental clampdown, prompting price-sensitive F&B customers to switch back to more economical glove offerings.
Over the medium to longer term, fundamentals are intact as we believe demand for rubber gloves will remain robust premised on: a) rising affluence, b) ageing population, c) growing healthcare expenditure, and d) greater hygiene awareness. Emerging markets like Asia still offer huge untapped growth potential with their significantly lower annual rubber glove consumption per capita of about 11 pieces vs 100-150 in the US and the EU.
Cheer for nitrile gloves. Given that nitrile gloves have been the preferred choice among users over the past few years, it should remain as a key export growth driver for Malaysia. This has prompted aggressive capacity expansion in the nitrile space by both local and regional glove manufacturers (especially those from Thailand and Indonesia). Domestically, we estimate the industry’s production capacity for nitrile gloves to increase 22% in 2018 (2016-17: up 19-25% yoy). Based on our observation (of the three companies under our coverage), there is no planned capacity expansion dedicated to natural rubber gloves.
Volume growth to taper in 2018
Forward orders slowing in the short term
Asia still offers huge untapped growth potential
Nitrile glove capacity to jump 21-22% in 2018-19
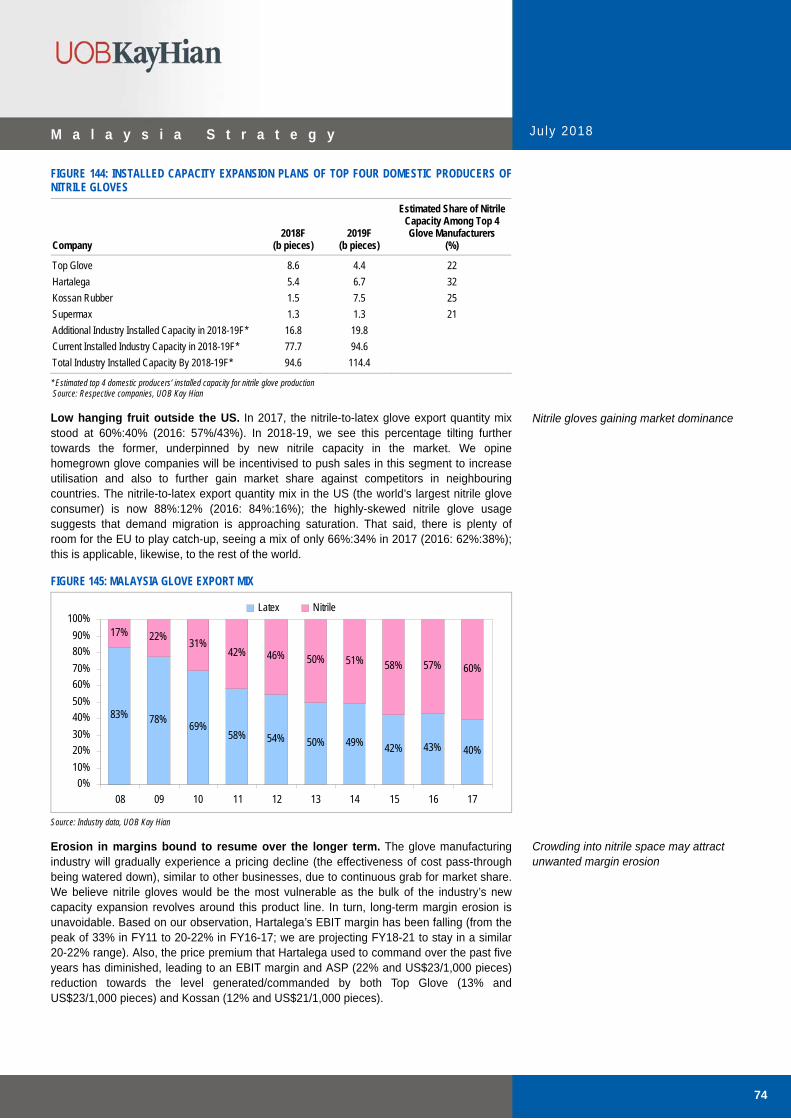
M a l a y s i a S t r a t e g y July 2018
74
FIGURE 144: INSTALLED CAPACITY EXPANSION PLANS OF TOP FOUR DOMESTIC PRODUCERS OF NITRILE GLOVES
Company 2018F
(b pieces) 2019F
(b pieces)
Estimated Share of Nitrile Capacity Among Top 4 Glove Manufacturers
(%)
Top Glove 8.6 4.4 22
Hartalega 5.4 6.7 32
Kossan Rubber 1.5 7.5 25
Supermax 1.3 1.3 21
Additional Industry Installed Capacity in 2018-19F* 16.8 19.8
Current Installed Industry Capacity in 2018-19F* 77.7 94.6
Total Industry Installed Capacity By 2018-19F* 94.6 114.4
* Estimated top 4 domestic producers’ installed capacity for nitrile glove production Source: Respective companies, UOB Kay Hian
Low hanging fruit outside the US. In 2017, the nitrile-to-latex glove export quantity mix stood at 60%:40% (2016: 57%/43%). In 2018-19, we see this percentage tilting further towards the former, underpinned by new nitrile capacity in the market. We opine homegrown glove companies will be incentivised to push sales in this segment to increase utilisation and also to further gain market share against competitors in neighbouring countries. The nitrile-to-latex export quantity mix in the US (the world’s largest nitrile glove consumer) is now 88%:12% (2016: 84%:16%); the highly-skewed nitrile glove usage suggests that demand migration is approaching saturation. That said, there is plenty of room for the EU to play catch-up, seeing a mix of only 66%:34% in 2017 (2016: 62%:38%); this is applicable, likewise, to the rest of the world.
FIGURE 145: MALAYSIA GLOVE EXPORT MIX
83% 78%69%
58% 54% 50% 49% 42% 43% 40%
17% 22%31%
42% 46% 50% 51% 58% 57% 60%
0%
10%
20%
30%
40%
50%
60%
70%
80%
90%
100%
08 09 10 11 12 13 14 15 16 17
Latex Nitrile
Source: Industry data, UOB Kay Hian
Erosion in margins bound to resume over the longer term. The glove manufacturing industry will gradually experience a pricing decline (the effectiveness of cost pass-through being watered down), similar to other businesses, due to continuous grab for market share. We believe nitrile gloves would be the most vulnerable as the bulk of the industry’s new capacity expansion revolves around this product line. In turn, long-term margin erosion is unavoidable. Based on our observation, Hartalega’s EBIT margin has been falling (from the peak of 33% in FY11 to 20-22% in FY16-17; we are projecting FY18-21 to stay in a similar 20-22% range). Also, the price premium that Hartalega used to command over the past five years has diminished, leading to an EBIT margin and ASP (22% and US$23/1,000 pieces) reduction towards the level generated/commanded by both Top Glove (13% and US$23/1,000 pieces) and Kossan (12% and US$21/1,000 pieces).
Nitrile gloves gaining market dominance
Crowding into nitrile space may attract unwanted margin erosion

M a l a y s i a S t r a t e g y July 2018
75
FIGURE 146: GLOVE PLAYERS’ EBIT MARGIN
0
5
10
15
20
25
30
35
FY08 FY09 FY10 FY11 FY12 FY13 FY14 FY15 FY16 FY17 FY18F FY19F FY20F
Hartalega Kossan RubberTop Glov e Supermax
Operating Margin (%)
Source: Respective companies, UOB Kay Hian
Nitrile-latex cost divergence to narrow. Despite the healthy historical price correlation between nitrile and latex (at 75% with a p-value of <5%), the divergence in trend persisted throughout 1H18. We understand the former shot up in pricing amid tight supply conditions along with strong demand (+22% ytd to US$1.31/kg). Also, the rising crude oil prices may have led to this. As for latex, prices held steady in the RM4.50-5.00/kg range even during the wintering period from February to May due to benign supply-demand dynamics.
Moving into 2H18, we expect the divergence to narrow as latex prices may creep up to the RM5.00-5.50/kg level. The natural rubber inventory in Qingdao (main source of raw materials for China’s tire output) has fallen 52% ytd and could prompt some replenishment activities. On the other hand, nitrile prices should settle in the US$1.10-1.20/kg band as substitution for latex may occur, easing the short supply situation.
The biggest beneficiary of the current weak latex prices would be Top Glove as 50% of its production revolves around natural rubber gloves; every 1% drop in raw material cost could increase its earnings by 2%. That said, 70-90% of Hartalega and Kossan’s product mix are skewed towards nitrile gloves. We estimate every 1% rise in raw material cost could reduce their earnings by 1-4%. Our sensitivity analysis assumes the additional savings/costs are not shared with/passed on to customers.
FIGURE 147: RAW MATERIAL PRICES
0.5
1.0
1.5
2.0
2.5
3.0
3.5
4.0
05 06 07 08 09 10 11 12 13 14 15 16 17 18
LatexNitrile
(US$/kg)
Source: Top Glove, UOB Kay Hian
Latex cost to rise while nitrile’s should start to consolidate… …but if latex cost remains soft, Top Glove would be the biggest beneficiary
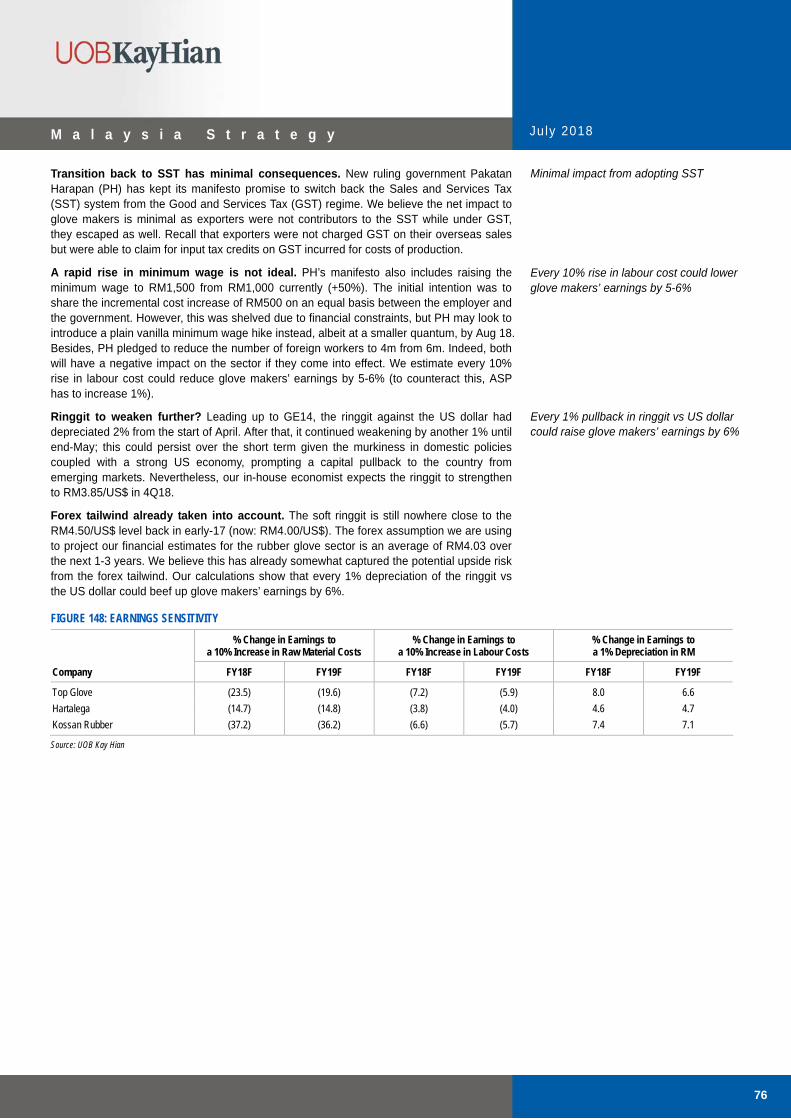
M a l a y s i a S t r a t e g y July 2018
76
Transition back to SST has minimal consequences. New ruling government Pakatan Harapan (PH) has kept its manifesto promise to switch back the Sales and Services Tax (SST) system from the Good and Services Tax (GST) regime. We believe the net impact to glove makers is minimal as exporters were not contributors to the SST while under GST, they escaped as well. Recall that exporters were not charged GST on their overseas sales but were able to claim for input tax credits on GST incurred for costs of production.
A rapid rise in minimum wage is not ideal. PH’s manifesto also includes raising the minimum wage to RM1,500 from RM1,000 currently (+50%). The initial intention was to share the incremental cost increase of RM500 on an equal basis between the employer and the government. However, this was shelved due to financial constraints, but PH may look to introduce a plain vanilla minimum wage hike instead, albeit at a smaller quantum, by Aug 18. Besides, PH pledged to reduce the number of foreign workers to 4m from 6m. Indeed, both will have a negative impact on the sector if they come into effect. We estimate every 10% rise in labour cost could reduce glove makers’ earnings by 5-6% (to counteract this, ASP has to increase 1%).
Ringgit to weaken further? Leading up to GE14, the ringgit against the US dollar had depreciated 2% from the start of April. After that, it continued weakening by another 1% until end-May; this could persist over the short term given the murkiness in domestic policies coupled with a strong US economy, prompting a capital pullback to the country from emerging markets. Nevertheless, our in-house economist expects the ringgit to strengthen to RM3.85/US$ in 4Q18.
Forex tailwind already taken into account. The soft ringgit is still nowhere close to the RM4.50/US$ level back in early-17 (now: RM4.00/US$). The forex assumption we are using to project our financial estimates for the rubber glove sector is an average of RM4.03 over the next 1-3 years. We believe this has already somewhat captured the potential upside risk from the forex tailwind. Our calculations show that every 1% depreciation of the ringgit vs the US dollar could beef up glove makers’ earnings by 6%.
FIGURE 148: EARNINGS SENSITIVITY
% Change in Earnings to a 10% Increase in Raw Material Costs
% Change in Earnings to a 10% Increase in Labour Costs
% Change in Earnings to a 1% Depreciation in RM
Company FY18F FY19F FY18F FY19F FY18F FY19F
Top Glove (23.5) (19.6) (7.2) (5.9) 8.0 6.6
Hartalega (14.7) (14.8) (3.8) (4.0) 4.6 4.7
Kossan Rubber (37.2) (36.2) (6.6) (5.7) 7.4 7.1
Source: UOB Kay Hian
Minimal impact from adopting SST
Every 10% rise in labour cost could lower glove makers’ earnings by 5-6%
Every 1% pullback in ringgit vs US dollar could raise glove makers’ earnings by 6%

M a l a y s i a S t r a t e g y July 2018
77
Strategy
Maintain UNDERWEIGHT. While we understand why fund managers seek refuge in the glove manufacturing sector (seeing the lack of compelling growth ideas and positive outlook for other businesses), we cannot discount the fact that this space is expensive when evaluated on a standalone basis; valuations are overly stretched at +2SD above five-year forward mean PE. More recently, the market has also developed an affinity towards export-related stocks post GE14.
However, we opine there is a budding risk of short-term earnings disappointment and this will not bode well with the market; at present, the sector earnings run rate projected by the street over the next two quarters is RM311m. We find that this remains high and is 33% above 1Q18 numbers. In our opinion, consensus could be too bullish, suggesting downside risk is not being adequately accounted for. Thus, observing that interest in glove makers remains strong, we view it as a fitting opportunity to sell on strength and realise the windfall generated over the past nine months. We are tactically bearish on all three stocks under our coverage.
Top Glove Corporation (TOPG MK/SELL/RM12.30/Target: RM7.80). Our target price is based on 18x FY19F EPS, implying +0.5SD above its five-year forward mean PE of 16x but below the sector’s 28x (ex-Top Glove). The premium is fair as: a) Top Glove has been making steady headway into the generally faster-growing nitrile glove space; and b) despite the new negative development at Aspion, the group is still touted as the no.1 surgical glove player globally. That said, the discount to the glove sector is warranted, considering Top Glove’s stretched balance sheet (net gearing of 0.8x vs peer average of 0.1x). Likewise, our PE-ROE regression analysis suggests pegging the stock to 18-20x forward PE.
Hartalega Holdings (HART MK/SELL/RM5.95/Target: RM4.02). Our target price is based on 24x 2019F EPS. This is largely in line with its five-year forward mean PE of 25x but a tad above the sector's 23x (ex-Hartalega). The premium can be justified by its strong operating efficiency and ability to generate a high ROE of 25% (peer average: 19%). Likewise, our PE-ROE regression analysis suggests pegging the stock close to 25x forward PE. We are wary of the possible overcrowding in the nitrile glove space, noting that the bulk of the industry’s new capacity expansion revolves around this product line; the company being the world’s largest manufacturer in this segment may be the most vulnerable to escalating competition.
Kossan Rubber Industries (KRI MK/SELL/RM8.52/Target: RM6.56). Our target price is based on 18x 2019F EPS, which is below its five-year forward mean PE of 20x and the sector’s 31x (ex-Kossan). We believe the discount is warranted given Kossan’s anaemic ROE generation (18% vs sector’s 23%) and its interests in other rubber-related businesses. Also, our basis for valuing Kossan is the same compared to Top Glove, considering that both share a similar net margin profile of 10-11%; recall that we valued the latter based on 18x forward valuation multiple. Besides, Kossan is the second most susceptible company to rising competition in the nitrile glove segment since 70% of its production revolves around this product.
Chan Jit Hoong, CFA, CPA +603 2147 1980
Tactically bearish on sector due to over-stretched valuations Risk/reward profiles for Top Glove, Hartalega and Kossan are all unfavourable

M a l a y s i a S t r a t e g y July 2018
78
Sector At A Glance
FIGURE 149: LATEX PRICES REMAIN SOFT FIGURE 150: RECENT NITRILE PRICE MOVEMENT NOT TRACKING LATEX
2
4
6
8
10
12
05 06 07 08 09 10 11 12 13 14 15 16 17 18
(RM/kg)
RM10.95
0RM3.28
-70% from peak
0
0.60.81.01.21.41.61.82.02.22.4
05 06 07 08 09 10 11 12 13 14 15 16 17 18
(US$/kg)
US$2.13
US$0.94-56% from peak
Source: Top Glove Source: Top Glove
FIGURE 151: US DOLLAR SOFTENING FIGURE 152: GLOVE SECTOR 5-YEAR AVERAGE FORWARD PE BAND
2.93.13.33.53.73.94.14.34.54.7
12 13 14 15 16 17 18
(RM/US$)
RM4.50/US$
81012141618202224262830
13 14 15 16 17 18
3
4
5
6
7
8
9(RM/kg)PE (x )
Sector PE (LHS)
Latex Price (RHS)2sd = 25.5x
1sd = 21.6x
mean = 17.7x
-2sd = 10.0x
-1sd = 13.9x
Source: Bloomberg Source: Bloomberg, UOB Kay Hian
FIGURE 153: RUBBER GLOVE CONSUMPTION PER CAPITA FIGURE 154: PRODUCTION COST BREAKDOWN
150
100
6 11
0
20
40
60
80
100
120
140
160
USA EU China Asia
Quantity (pcs)
Latex /Nitrile
48%Labour
9%
Chemical
8%
Fuel
12%
Packaging
6%
Ov erhead & Others
16%
Source: MREPC Source: Various Companies
FIGURE 155: SECTOR STATISTICS
Share Price Last Net Profit EPS PE Market BV Price/
Company Ticker Rec 5 Jul 18 Year 2017 2018F 2019F 2017 2018F 2019F 2017 2018F 2019F ROE Cap ps BV ps (RM) End (RMm) (RMm) (RMm) (sen) (sen) (sen) (x) (x) (x) (%) (RMm) (RM) (x)
Hartalega HART MK SELL 5.95 3/18 398 507 569 12.0 15.3 17.2 49.6 38.9 34.7 23.9 19,733 0.60 9.9
Kossan Rubber KRI MK SELL 8.52 12/17 184 202 233 28.8 31.5 36.4 29.6 27.0 23.4 16.7 5,448 1.84 4.6
Top Glove TOPG MK SELL 12.30 8/17 333 470 562 26.0 36.7 44.0 47.2 33.5 28.0 29.4 15,718 1.78 6.9
Sector 915 1,178 1,364 44.7 34.7 30.0 23.5 40,900 7.5
Note: If year end is before June, earnings are shown in the previous period. Source: Respective companies, Bloomberg, UOB Kay Hian

M a l a y s i a S t r a t e g y July 2018
79
Media MARKET WEIGHT
WHY WE ARE MARKET WEIGHT
Structural shift in consumers’ preference from traditional media to digital media.
Smaller pay-TV subscriber base could dampen efforts to raise ARPU.
Valuations already at lower end of historical range.
WHAT TO WATCH OUT FOR IN 2H18
Advertisers continue to hold back on traditional adex. Media Prima: Cost of going digital could be high.
Outlook
FIGURE 156: MEDIA INDEX UNDERPERFORMS FBMKLCI
50
60
70
80
90
100
110
Jan Feb Mar Apr May Jun Jul
Media
FBMKLCI
End Dec 17=100
Note: Media index only includes Astro Source: Bloomberg, UOB Kay Hian
Underperforms FBMKLCI ytd. Ytd, the media sector has underperformed the FBMKLCI by 32.2ppt (-38.1% vs -5.9% respectively) primarily because it is bogged down by structural issues, namely still-weak adex consumption and increasing competition from digital media and over-the-top (OTT) platforms. Astro Malaysia Holdings (Astro), which has plunged 38.5% ytd, is not fully insulated from the structural issues. Sticking points surrounding Astro include: a) potential removal from the FBMKLCI, b) dwindling pay-TV subscriber base, c) ability to significantly upsell and monetise OTT platforms, and d) sustainability of its ARPU rates. Similarly, Media Prima, whose earnings are largely driven by adex consumption, fell 32.9% from early-18 to an all-time low on 15 May 18 before closing at RM0.55 on 5 Jul 18 on the back of the narrowing losses in its latest quarterly results.
Maintain MARKET WEIGHT due to a lack of catalysts in the sector while downside risks have largely been priced in. Although the FIFA World Cup and abolishment of the GST are expected to improve overall consumer sentiment, several sticky issues still linger. Newsprint publishers lack a material turnaround at various new non-traditional businesses while pay-TV providers are likely to experience higher churn rates and sluggish ARPU growth as subscribers are spoilt for choice where OTT platforms are concerned. There has also been a disconnect between consumer sentiment (on an uptrend in the past few quarters) and adex spending (on a downtrend), which we attribute to cannibalisation by digital media. Nevertheless, we are maintaining our MARKET WEIGHT stance as valuations are already at the lower end of the historical range with Astro trading below -2 SD of five-year mean PE and Media Prima at slightly above -2 SD of its five-year mean P/B.
Sector underperforms FBMKLCI by 30.7ppt ytd
MARKET WEIGHT due to lack of sector catalysts and very low valuations

M a l a y s i a S t r a t e g y July 2018
80
5M18 total gross adex contraction persisted at 7.5% yoy. While total gross adex continued to fall 7.5% yoy (Figure 161) to RM2,406m in 5M18 (5M17: RM2,601m), Astro successfully defended its adex market share by registering a 6% yoy adex growth in 1QFY19 (Figure 157). Meanwhile, Media Prima’s adex income still lags behind its peers’ in the competitive adex market. As Media Prima derives about 85% of its revenue from adex, the cannibalisation of its adex revenue stream by competitors, especially its pay-TV counterpart Astro, is clearly reflected in the revenue contributions from traditional media platforms. Essentially, the contracting adex demand reflects: a) still-poor consumer sentiment resulting from the lingering impact of the previous government’s subsidy rationalisation exercises; and b) structural shift from traditional media to digital media, where the correlations of consumer sentiment and adex spending have turned negative (Figure 159).
FIGURE 157: ASTRO SHARE OF RADEX AND TV ADEX
Astro Share of Radex
74%
73%
1QFY18 1QFY19
Astro Share of TV Adex
37%
43%
1QFY18 1QFY19
Source: Astro, UOB Kay Hian
Content cost to remain elevated due to sporting year and weakening ringgit. The ringgit depreciated 4.7% from the recent high of RM3.86 against the US dollar on 28 Mar 18 and may weaken further against the US dollar as global central banks such as the US Federal Reserve and the European Central Bank are raising policy rates and reducing balance sheets. With 65-70% of its content costs denominated in US dollars, Astro has typically hedged its content costs on a one-year rolling-hedge basis. We expect content cost for FY19 to stand at 36% of TV revenue (FY18: 34%). Unlike Astro, Media Prima is less exposed to currency risk as US-dollar content costs form about only 25% of its total operating costs. Furthermore, most of Media Prima’s top-rated content is local vernacular content with costs in ringgit terms.
Malaysia’s total gross adex fell 7.5% yoy to RM2,406m in 5M18
Astro more susceptible to currency fluctuations than Media Prima as US$-denominated content costs account for 65-70% and 25% of respective TV segment operating costs

M a l a y s i a S t r a t e g y July 2018
81
PAY-TV PROVIDER
Sporting year to mitigate effect of smaller pay-TV subscriber base. Astro’s pay-TV subscriber base contracted for the first time in FY17 amid higher churn rates on the back of: a) poor domestic consumer spending, b) price hikes for sport packages on 1 Aug 16, and c) increasing competition from OTT platforms. Subsequently, Astro’s ARPU dropped for the fifth consecutive quarter to RM99.60 in 1QFY19. Despite expecting its pay-TV subscriber base to shrink, we believe Astro’s FY19 ARPU can be maintained at RM99.90 on the rollout of sports-related bundles linked to the World Cup. Furthermore, Astro’s household penetration rate, which stood at 75% as at 4QFY18 with 12,000-13,000 hours of library content, is a boon to the company.
Record-breaking viewership expected for Astro in FY19 due to two major events – GE14 and World Cup. Astro enjoyed record-breaking TV viewership during the 14th general election (GE14) with Astro Awani’s page views and user traffic surging >100% qoq and yoy in May 18. Management is expecting an all-time high viewership for the World Cup, further buoyed by the exuberant mood post GE14 and favourable match timing for Malaysian football fans. Astro’s World Cup package sales have been encouraging with over 3,000 commercial enterprise business packages, 30,000 residential passes and 55,000 sports package upgrades sold prior to the opening of the World Cup.
Not resting on its laurels despite dominance in household penetration. Astro is constantly adding more hours (primarily vernacular content) to its library, indirectly benefitting its OTT platforms such as NJOI, Tribe and Astro Go, to drive subscriber growth. While it may face challenges in the near term to significantly monetise such services which command lower ARPUs, serious cord-cutting should be far-fetched given that Malaysians spend about 77% of daily TV viewing on Astro’s local content. Hence, we are not overly concerned and opine that the street is underestimating the potential of Astro’s strong library content and 75% household penetration rate.
FIGURE 158: ASTRO – ARPU
99.699.9
100.7
99.099.4
99.9
103.3
100.8 100.8
98
99
100
101
102
103
104
1QFY17 2QFY17 3QFY17 4QFY17 1QFY18 2QFY18 3QFY18 4QFY18 1QFY19
(RM)
Source: Astro, UOB Kay Hian
Astro’s pay-TV subscriber base expected to continue contracting in FY19
GE14 and World Cup driving TV viewership
Astro continues to upsell its OTT platforms in hopes of boosting ARPU

M a l a y s i a S t r a t e g y July 2018
82
FTA-TV PROVIDER
Domestic adex competition to intensify? Adex-reliant Media Prima recently acquired 100% of Rev Asia Holdings (RAHSB) for RM105m cash. RAHSB provides advertising, publication and internet social media services. Through its wholly-owned subsidiaries (namely Rev Digital, Rev Lifestyle, Rev Social Malaysia, Rev Social International and Rev Entertainment), RAHSB owns and operates nine online web portals with contents that cater to visitors aged <40 years old. The acquisition is in line with Media Prima’s longer-term goals to grow its non-traditional businesses and will allow the company to immediately capture a larger market share of online advertisements. Post-acquisition, Media Prima will be able to extend its online web portal reach to a younger audience and it aims to grow its digital presence to 9m monthly visitors (up from 5.8m currently), coming in third in terms of digital reach in Malaysia after Google (15.7m) and Facebook (14.0m).
Digitalisation effort starting to bear fruit but contribution remains negligible. Media Prima’s digital revenue improved >100% in 1Q18 amid various rationalisation efforts to digitalise its business. While we remain positive on its various digitalisation efforts in the longer term, we do not expect any meaningful impact on the bottom line over the next few years, given: a) uncertainty in converting its new digital presence into revenue, and b) contributions from newly-acquired businesses to be offset by the steep deterioration in advertising revenue from Media Prima’s traditional print and FTA TV segment (Figure 160).
The print industry remains in limbo against a backdrop of low circulation and print adex revenue. The declining circulation and readership trends in Media Prima’s print segment are seen across all newspapers, primarily due to a structural shift in consumer preference from traditional media to digital media. Media Prima’s focus on Malay-language newspapers has not prevented it from fizzling out in the print adex market over the years. In 1H17, newspaper circulation dropped 8.5% to 539,235.
Post-RAHSB acquisition, Media Prima can extend online web portal reach to younger online visitors and grow its digital presence
2H18 remains a gestation period for Media Prima
Print segment continues to do badly due to a shift in consumer preference from traditional platforms to digital media

M a l a y s i a S t r a t e g y July 2018
83
Strategy
Maintain MARKET WEIGHT due to a lack of catalysts in the sector while downside risks have largely been priced in. The low valuations (Astro and Media Prima are trading below their respective five-year historical mean PEs) fairly reflect our pedestrian earnings forecasts, where we expect Astro to register a three-year earnings CAGR of 1.4% while Media Prima will likely still report losses in the next couple of years.
Astro Malaysia Holdings (ASTRO MK/BUY/RM1.63/Target: RM2.21). Our DCF-based target price implies 17.0x FY19F PE and 7.4x FY18 EV/EBITDA, supported by a prospective dividend yield of 6.4%. While we remain cautious on Astro’s ability to significantly upsell and monetise its OTT platforms on a dwindling pay-TV subscriber base, we believe its strong library content and 75% household penetration rate should provide a relatively stable operating environment as compared with other local listed media players, whose profits have dwindled significantly.
Media Prima (MPR MK/HOLD/RM0.52/Target: RM0.34). We expect Media Prima to continue to be in the red for the next couple of years, primarily due to negative adex demand growth, lower circulation and falling print adex revenue. Although the company is expected to shift its focus to content creation and its digital platforms, we remain cautious on its operating outlook as the lack of a visible turnaround at its new non-traditional business ventures (home shopping segment and digital business) could: a) lead to a persistent earnings derating over the next 1-2 years arising from lower adex revenue, and b) impair the group’s attractive dividend payouts of 60-80%. Entry price: RM0.31.
Malaysia Research Team
+603 2147 1988 [email protected]

M a l a y s i a S t r a t e g y July 2018
84
Sector At A Glance
FIGURE 159: MIER CONSUMER SENTIMENT INDEX FIGURE 160: MEDIA PRIMA – REVENUE STREAM
60
70
80
90
100
110
120
130
06 07 08 09 10 11 12 13 14 15 16 17 18
(Index )
217238
302326350
64.034.0
2.03.04.00
100
200
300
400
1Q14 1Q15 1Q16 1Q17 1Q18
TraditionalConsumer & Digital
(RMm)
Source: Bloomberg, MIER Source: Neilsen, UOB Kay Hian
FIGURE 161: ADEX SHARE BY MEDIUM (5M18) FIGURE 162: RM/US$
(RMm) May 18 qoq % chg yoy % chg 5M18 yoy % chg
Newspapers 201.4 (5.5) (20.4) 1,000.4 (16.2)
Terrestrial TV 270.9 12.0 7.1 1,100.5 1.8
Radio 39.2 (0.8) (14.9) 176.0 (4.5)
Magazines 5.0 (5.2) (35.6) 23.9 (28.7)
In Store Media 7,4 10.3 (44.9) 36.8 (42.2)
Cinema 19.5 55.7 146.7 68.5 52.9
Total 543.4 4.7 (6.5) 2,406.0 (7.5)
3.80
4.00
4.20
4.40
4.60
Apr 17 Jul 17 Oct 17 Jan 18 Apr 18
(US$/RM) QTD
av erage
RM3.95
QTD
av erage
RM3.92
QTD
av erage
RM4.16
QTD
av erage
RM4.26
QTD
av erage
RM4.33
Source: Neilsen Source: Bloomberg, UOB Kay Hian
FIGURE 163: MEDIA PRIMA – ONE-YEAR FORWARD HISTORICAL P/B FIGURE 164: ASTRO – ONE-YEAR FORWARD HISTORICAL PE
0.4
0.9
1.4
1.9
2.4
Jun 13 Jun 14 Jun 15 Jun 16 Jun 17 Jun 18
PB (X)
-1SD
-2SD
Mean
+2SD
+1SD
1
10
15
20
25
30
35
40
Jun 13 Jun 14 Jun 15 Jun 16 Jun 17 Jun 18
PE (X)
-1SD
-2SD
Mean
+1SD
+2SD
Source: Bloomberg, UOB Kay Hian Source: Bloomberg, UOB Kay Hian
FIGURE 165: SECTOR STATISTICS
Share Price Last Net Profit EPS PE Market BV Price/
Company Ticker Rec 5 Jul 17 Year 2017 2018F 2019F 2017 2018F 2019F 2017 2018F 2019F ROE Cap ps BV ps (RM) End (RMm) (RMm) (RMm) (sen) (sen) (sen) (x) (x) (x) (%) (RMm) (RM) (x)
Astro ASTRO MK BUY 1.63 1/18 678 675 698 13.0 12.9 13.4 12.5 12.6 12.2 120.7 8,499 0.13 12.4
Media Prima MPR MK HOLD 0.52 12/17 (153) (61) (40) (13.8) (5.5) (3.6) n.m. n.m. n.m. n.m. 577 0.67 0.8
Sector 525 614 658 17.3 14.8 13.8 9,075
Note: If the year-end falls before June, earnings are shown in the previous period. Source: Respective companies, Bloomberg, UOB Kay Hian

M a l a y s i a S t r a t e g y July 2018
85
Oil & Gas MARKET WEIGHT
WHY WE ARE MARKET WEIGHT
Consensus expectation of Brent crude price in 2018/19 at US$69/bbl may be adjusted upwards.
However, oil price increase did not flow into earnings rerating. Petronas seems to remain conservative.
Advocate selectiveness in internationally-competitive players with low Petronas dependency.
WHAT TO WATCH OUT FOR IN 2H18
Oil prices and Petronas’ direction. Full earnings from new FPSOs (Bumi Armada, Yinson),
storage expansion (Dialog), ramp-up of major projects like MCM (Deleum), crude tanker movements (MISC).
Contract newsflows (Serba Dinamik, Velesto Energy, Sapura Energy, Malaysia Marine And Heavy Engineering (MMHE)).
Progress on Petros’ incorporation from Jul 18.
Outlook
FIGURE 166: OIL AND GAS INDEX DELIVERS MIXED PERFORMANCE RELATIVE TO FBMKLCI
65
75
85
95
105
115
125
135
Jan Feb Mar Apr May Jun Jul
FBMKLCI Oil & Gas - Heav y EngineeringOil & Gas - Shipping Oil & Gas - Offshore Asset Ow nersOil & Gas - Offshore Contractors
End Dec 17=100
Source: Bloomberg, UOB Kay Hian
O&G sector delivers mixed performance, relative to FBMKLCI. The outperformer is the heavy engineering segment (+18% ytd), given Dialog’s valuation rerating and Serba Dinamik’s earnings growth. Asset owners (+4% ytd) have been supported by earnings from new floating projects by Bumi Armada and Yinson Holdings (Yinson). Offshore contractors (-12% ytd) has underperformed relative to the FBMKLCI, due to earnings underperformance at Sapura Energy, Deleum and Barakah, despite the uptrend in Brent crude price (+16% ytd). This is in tandem with our view that sector valuation is correlated with earnings expectation, but the correlation with oil prices has weakened. Shipping has derated (-17% ytd) as MISC’s earnings risk has resurfaced on depressed petroleum earnings, expiring offshore earnings and the risk of rising bunker prices.
Maintain MARKET WEIGHT: Sector theme focuses on earnings rerating. Our sector theme is unchanged: invest in companies with visibility for earnings upgrades and minimal dependence on Petronas’ work orders. We advocate selectiveness in companies that are internationally competitive and do not depend on Petronas for orders, as they will continue to benefit from the recovery in international oil and gas (O&G) capex. Based on this theme, the heavy engineering and asset owner segments are still expected to outperform offshore contractors.
Heavy engineering the outperforming segment due to Dialog and Serba

M a l a y s i a S t r a t e g y July 2018
86
OIL MARKET DYNAMICS BACK IN THE HANDS OF CARTEL
Brent expectations may need to be upgraded. Brent last traded in the US$75-80/bbl range, significantly above consensus Brent forecasts of US$68-69/bbl for 2018-19. Pockets of supply shocks (ie Venezuela’s slump, OPEC’s over-compliance and Iran sanctions) hastened the crude market’s rebalancing and caused OECD oil inventories to drop below the five-year average in 2017. According to the International Energy Agency, global oil supply has come in at an average of 98m bpd ytd, matching global demand which was at a seasonal low in 1Q18. It appears that OPEC and Russia have met their shared goal in the current scenario where there is no longer any supply surplus.
Producers will maintain check and balance on supply-demand. The OPEC meeting in late-Jun 18 was an important event for oil markets. The surge in US shale supply in 2H18, due to the ramp-up of the Permian basin’s production, has been factored in by consensus. Having said that, a supply shortage is still possible as global demand is set to grow in the coming quarters. However, the US snapping back sanctions on Iran could pull 0.5m bpd of Iranian exports out of the supply equation. Hence, there is increasing political pressure for OPEC to cap the rising oil prices as demand-side implications are already being felt. Producers may consider raising production ceilings (or lessening output cuts), which is part of the rebalancing efforts, in our view. The ultimate goal of OPEC and Russia is to ensure that supply and demand will remain closely matched. Russia and Saudi Arabia have spare capacities to increase production given their supply curb compliance to date.
FIGURE 167: SUPPLY SCENARIO COMPARISON BETWEEN LARGE PRODUCERS
Source: JBC Energy, UOB Kay Hian
Oil demand will continue to dominate the world’s energy market at around 30% of the primary energy mix by 2040. This is despite the expected shift in energy mix from oil and coal towards gas and renewable energy. Asia, which comprises 42-44% of world demand despite housing 54% of the global population, will drive the growth in oil consumption. Malaysia’s energy demand is expected to grow 2-3% p.a. depending on policy scenarios. It is transitioning into the role of an energy importer, as O&G production is expected to decline given technically challenging fields.
High Brent prices supported by elimination of supply, may continue to exceed consensus expectations Malaysia’s energy demand expected to grow 2-3% p.a., in line with global demand

M a l a y s i a S t r a t e g y July 2018
87
LOCAL CONTRACT AWARDS RECOVERING, BUT IN MODERATION
Maintenance activities must resume to ensure volume growth. Despite higher oil prices (+24% yoy), Petronas recorded flattish net profit growth and an EBITDA decline in 1Q18. The gains from oil prices were offset by US-dollar factors, a 7% decline in entitled volumes (for upstream) and lower downstream volumes due to statutory turnarounds. While sustainably higher oil prices (above Petronas’ US$52/bbl assumption for 2018) should be positive for cash flow, Petronas has an existing 2018 obligation to increase its dividends (RM19b, 2017: RM16b) and capex (RM55b, 2017: RM45b). With almost all other global oil majors guiding for a sustainable growth in volumes regardless of oil prices, the decline in Petronas’ net volume is a concern. We believe maintenance activities must resume to ensure volume growth, which will in turn sustain Petronas’ cash flow and government obligations.
FIGURE 168: PETRONAS KEY FINANCIALS FIGURE 169: PETRONAS RECORDED DECLINE IN NET VOLUMES
Items 1Q18 1Q17 yoy % chg 2017 2016
Upstream Revenue (RMb) 37.3 34.6 7.8 135.1 113.1
Downstream Revenue (RMb) 27.5 28.1 (2.1) 113.7 95.2
Recurring Net Profit (RMb) 11.9 10.5 1.3 46.6 36.8
Operating Cash Flow Before Working Capital (RMb)
23.2 26.2 (11.5) 95.1 75.4
Capex (RMb) 12.0 11.9 1.0 44.5 50.4
Dividends 3.0 - - 16.0 16.0
Oil Price (US$/bbl) 66.8 53.8 24.1 54.3 43.7
US$/RM (US$/bbl) 3.92 4.45 (11.9) 4.30 4.15 Upstream Net Volumes (kboe/d)
1,728 1,850 (6.6) 1,760 1,794
Source: Petronas, UOB Kay Hian Source: Petronas, UOB Kay Hian
Petronas has implemented systemic changes in contract rollouts by focusing on economies of scale and cost efficiency. The oil major favours more integrated umbrella contracts that combine a suite of offerings spread out across several work packages. Only a few players benefitted from the small rebound in contract awards in 1Q18. We believe this is the oil major’s “silent push” to encourage the consolidation of service contractors in Malaysia. Petronas is expected to roll out the bulk of its integrated contracts by end-18, with smaller contracts coming up. However, the contracts are there to replenish orderbook and the local contractor oversupply will remain intact.
FIGURE 170: SOME OF THE MAJOR UPSTREAM CONTRACTS IN MALAYSIA
Contracts Listed Companies & Beneficiaries Implications
In May 18, Integrated Logistics Control Tower (ILCT) awarded contracts to OSV players. These are 20 work packages for up to five years.
Icon Offshore Alam Maritim Marine & General (Jasa Merin) EA Technique
The awards encompass the service of 100 OSV vessels (about a third of industry supply). This falls short of the vessel requirements guided in the Petronas Activity Outlook and the expectations of industry players (25 packages for 120 OSV vessels), though there may be more ILCT contracts left to be awarded. They are on a call-out basis, designed to replace base-fleet OSV contracts (for brownfield/maintenance projects).
Five contractors are executing the Maintenance, Construction and Modification (MCM) contracts for onshore and offshore platforms across the Peninsula, Sarawak and Sabah.
Carimin Petroleum Deleum Sapura Energy Petra Energy Dayang Enterprise
MCM covers the entire scope of topside facilities maintenance and goes hand-in-hand with hookup and commissioning. These works commenced in end-17 and are expected to be completed by early-22. The contracts are also structured on a call-out basis, with conservative margins, and revenues are expected to be stronger at the tail end.
Petronas has a jackup rig requirement of 6-10 in Malaysia, and is carrying out its Business of Margin project.
Velesto Energy Velesto Energy (7 available jackup rigs) is guiding for improvements in rig utilisation from 60-70% in 1H18 to 90-100% in 2H18, with new short-term rig contracts (few months’ work) expected and commencing from mid-18. Although tenures are fixed, the work orders may vary.
EPCIC is working on the Pegaga project in Block SK320 by Mubadala Petroleum.
Sapura Energy At >RM2b in value, Pegaga is one of the few and among the largest greenfield upstream platforms sanctioned by Petronas. The next large project is likely Kasawari to be awarded by Jan 19.
Source: Various sources, UOB Kay Hian
Petronas’s 1Q18 cash flow unimpressive, with gains from higher oil prices offset by lower US$ and entitled volumes
Petronas favours more integrated umbrella contracts, based on long-term tenures but without fixed work orders

M a l a y s i a S t r a t e g y July 2018
88
Near-term contract flows may face disruption. Several local service contractors that are highly dependent on local work orders reported disappointing 1Q18 results, including Barakah, Dayang, Deleum and Petra Energy. In the near term, there may be political uncertainties on issues surrounding the states’ oil royalty entitlements and regulatory control over O&G assets and contracts. It is reasonable to assume that many service players would have major local orderbook exposure to projects in Sarawak.
FIGURE 171: SOME OF THE MAJOR POLITICAL EVENTS IN MALAYSIA O&G
Events Possible Implications
Petroleum Sarawak (Petros) started to implement state law and take full authority of the upstream and downstream aspects of Sarawak’s O&G industry effective 1 Jul 18.
Contractors are told to reapply for licences and leases through Petros to ensure smooth transition.
The transfer of contractor licences from Petronas to Petros’ governance should be straightforward and existing contracts’ processes should not be affected.
In the long term, this is thought to perhaps favour Sarawak-linked contractors like Dayang, Serba Dinamik, KKB Engineering and Barakah.
Petronas applied to the Federal Court seeking declaration that it is the exclusive owner, custodian and regulator of national petroleum resources. There is a possibility of the federal government and other states (ie Sabah) intervening in Petronas’ suit (against Sarawak).
Although the application was dismissed by the Federal Court, we are still concerned about the ongoing legal uncertainties and its impact on the timing of near-term contract awards by Petronas, Sarawak and potentially other states.
Changes in Petronas’ top directors are expected from the term expiries of Chairman Tan Sri Sidek Hassan. There is talk of whether Tan Sri Hassan Marican will rejoin Petronas as the new Chairman.
Group CEO Datuk Wan Zulkiflee’s term was previously extended until Mar 21.
Marican was responsible for growing Petronas into a top Fortune 500 company and an oil major in the same league as BP, ExxonMobil and Shell (The Seven Sisters). We believe Marican will continue to balance growth with cost, a strategy that will be undertaken by the current management team if he joins the company.
Source: Various sources, UOB Kay Hian
FPSO contract rollouts as project sanctions continue. Year to date, Yinson leads the global floating production, storage and offloading (FPSO) award tally by having secured two mid-sized contracts, which are FPSO Helang (Layang field, Malaysia) and FPSO Anyala/Madu (Nigeria). The industry expects more FPSO contracts (7-9 awards p.a.), as development projects are expected to be sanctioned in view of stable oil prices. Both Yinson and Bumi Armada are bidding for some of the large FPSO projects (capex >US$1b and potential contract value of US$2b-3b for long-term tenures). These include the KG-DWN-98/2 in India (Bumi Armada is a leading bidder), Pecan in Ghana (both Yinson and Bumi Armada are bidding), ZabaZaba in Nigeria (Bumi Armada is reportedly bidding), and several mega FPSOs in Brazil.
FIGURE 172: GLOBAL FPSO CONTRACT WINS IN 2018 FIGURE 173: INDUSTRY EXPECTATIONS OF FPSO AWARDS
FPSO & Location Contractor US$ Capex
Hai Yang (China) CNOOC 400m
Karish (Israel) Energean 905m
Helang/Layang (Malaysia) Yinson ~400 – 450m
Penguins (UK) Shell 500m
Tortue (Mauritania) BP 1,250m
P-71 Atapu 2 (Brazil) Petrobras 1,400m
Anyala/Madu (Nigeria) Yinson ~350-400m
Source: Energy Maritime Associates 3Q18 report, UOB Kay Hian Source: SBM Offshore, UOB Kay Hian
Contract awards may ramp up towards late-18 at current oil prices, but near-term outlook is murky given political events between Petronas and US
Industry expects more rollout of FPSO contracts, including large-capex projects

M a l a y s i a S t r a t e g y July 2018
89
Strategy
Sector theme still depends on earnings. We maintain overall MARKET WEIGHT on the sector. We are bullish on the asset owner and heavy engineering segments. We maintain our advice to invest in companies that are internationally competitive and do not depend on upstream work orders from Petronas. Certain overseas regions and project types will benefit from the capex increase correlated with an oil price recovery. Fundamentally, we like FPSO players (Bumi Armada and Yinson) and certain international contractors (like Serba Dinamik). These companies will have better visibility for earnings upgrades.
FIGURE 174: KEY O&G PLAYERS THAT ARE INTERNATIONALLY COMPETITIVE
Stocks Business Exposure
Serba Dinamik (SDH MK) BUY, TP RM4.30
Serba Dinamik has diversified and transformed into an international O&M player with a large proportion of revenue from maintenance works performed for Middle East downstream customers. It is also expanding into other markets like Africa and Indonesia.
Bumi Armada (BAB MK) BUY, TP RM1.06
The final acceptance and earnings delivery of Armada Kraken and Olombendo from 1H18 will rerate its earnings. As an internationally competitive FPSO player with no outstanding deliveries, Bumi Armada is expected to secure new contracts (most likely from India).
Dialog (DLG MK) HOLD, TP RM3.00
Dialog has an international track record executing EPCC and fabrication services for downstream customers worldwide. It is also a key onshore storage operator in Pengerang and Tanjung Langsat, which it is expanding, to service major customers in the Straits region.
Yinson (YNS MK) BUY, TP RM5.30
Being an internationally competitive FPSO player, Yinson is expected to execute new contracts in Malaysia (FPSO Helang), and is expected to secure a large FPSO project in Vietnam or Africa, leveraging on its strong partnership with Japanese stakeholders
MISC (MISC MK) HOLD, TP RM5.85
MISC has an established global track record in LNG transportation (27 carriers), and two floaters. By 2018, it will have a net operating LNG fleet of 28. Its fleet of ~60 petroleum tankers are currently loss making given the depressed tanker rates.
Sapura Energy (SAPE MK) BUY, TP RM0.70
Sapura Energy has a major presence in international fabrication/offshore services, including Brazil. Sapura Energy is also a global market leader in the tender rigs division, which is now experiencing multi-year low utilisation. Sapura Energy will not have earnings rerating until it secures enough multi-billion contracts.
Source: UOB Kay Hian
Stock picks. a) For the asset owner segment, we like Bumi Armada (BAB MK/BUY/ RM0.71/Target: RM1.06) as its earnings may start to rerate once it completes Armada Kraken and Olombendo after 1H18, pulls off a recovery in OMS utilisation and bids for more projects. We also like Yinson Holdings (YNS MK/BUY/RM4.57/Target: RM5.30) for its execution track record, as well as its delivery of the new FPSO Helang contract for the Layang field in two years’ time. Our target price is conservative as we ignore a potential compensation for the Ca Rong Do charter (which is under contract force majeure) worth about RM0.29/share.
b) For the heavy engineering segment, we like Serba Dinamik Holdings (SDH MK/BUY/RM3.34/Target: RM4.30), as its earnings may outperform expectations once the company reaches its end-18 orderbook target of RM7.5b, coupled by the high renewal rate of its offshore and marine orderbook (largely driven by Middle East downstream customers). Serba Dinamik is our top pick for the overall sector.
Not rated picks with potential earnings turnaround. Velesto Energy is guiding for its jackup rig utilisation to improve substantially from 65-70% in 1H18 to >90% by 2H18, due to the commencement of short-term contracts from Petronas. In 1Q18, the company recorded very close to a core profit breakeven at 65% utilisation. Reach Energy may return to the black at higher oil prices and if production volume can improve to >4,000 bpd. The company guided that it requires US$65/bbl and 4,000 bpd of production to break even.
Kong Ho Meng +603 2147 1987
Maintain MARKET WEIGHT on sector; bullish on asset owners and heavy engineering, bearish on offshore contractors Prefer globally competitive players that will likely see earnings rerating correlated with capex recovery, eg BAB, Serba
Serba is our top sector pick given its diversification

M a l a y s i a S t r a t e g y July 2018
90
Sector At A Glance
FIGURE 175: PETRONAS QUARTERLY CAPEX FIGURE 176: CRUDE DEMAND AND SUPPLY APPEARS TO BE BALANCED
6.2 7.1
15.5
6.6
17.9
9.7 9.4
6.72.8 9.3
6.4
5.5 2.33.0
1.9
2.91.0
1.32.8
2.5 2.6
9.010.9
8.28.110.9
11.68.8
15.0
19.7
10.6
0
5
10
15
20
25
1QFY14 1QFY15 1QFY16 1QFY17 1QFY18
InternationalDomestic
(RMb)
Source: Petronas, UOB Kay Hian Source: IEA
FIGURE 177: GROSS GEARING OF GLOBAL OIL MAJORS FIGURE 178: OPERATING CASH FLOW/CAPEX INCURRED
0
10
20
30
40
50
60
70
80
4Q14 2Q15 4Q15 2Q16 4Q16 2Q17 4Q170
5
10
15
20
Petronas (RHS) ShellBP XOMTotal ChevronENI PTT
(%) (%)
0.40.60.81.01.21.41.61.82.02.22.4
3Q14 1Q15 3Q15 1Q16 3Q16 1Q17 3Q17 1Q18
8 IOCs & NOCsPetronas
(x )
Source: Petronas, UOB Kay Hian Source: BP, UOB Kay Hian
FIGURE 179: SECTOR STATISTICS
Share Price Last Net Profit EPS PE Market BV Price/
Company Ticker Rec 5 Jul 18 Year 2017 2018F 2019F 2017 2018F 2019F 2017 2018F 2019F ROE Cap ps BV ps (RM) End (RMm) (RMm) (RMm) (sen) (sen) (sen) (x) (x) (x) (%) (RMm) (RM) (x)
OIL & GAS - HEAVY ENGINEERING
Dialog Group DLG MK HOLD 3.12 6/17 326 433 494 5.8 7.7 8.8 53.9 40.6 35.6 13.4 17,592 0.62 5.0
MMHE MMHE MK HOLD 0.66 12/17 45 22 51 2.8 1.4 3.2 23.4 47.1 20.7 1.3 1,056 1.57 0.4
Serba Dinamik SDH MK BUY 3.34 12/17 323 398 514 22.0 27.1 35.0 15.2 12.3 9.5 28.2 4,905 1.25 2.7
Segment 694 853 1,058 33.9 27.6 22.3 11.1 23,552 3.0
OIL & GAS - OFFSHORE ASSET OWNERS
Bumi Armada BAB MK BUY 0.71 12/17 309 511 547 5.3 8.7 9.3 13.4 8.1 7.6 6.4 4,139 0.92 0.8
Petronas Dagangan PETD MK HOLD 24.80 12/17 1,095 983 1,053 110.2 98.9 106.0 22.5 25.1 23.4 27.2 24,638 5.76 4.3
Yinson YNS MK BUY 4.57 1/18 342 281 295 31.5 25.9 27.2 14.5 17.6 16.8 14.7 4,960 1.86 2.5
Segment 1,745 1,775 1,895 19.3 19.0 17.8 16.6 33,737 2.6
OIL & GAS - OFFSHORE CONTRACTORS
Barakah Offshore Petroleum BARAKAH MK SELL 0.15 12/17 (103) (46) (30) (12.5) (5.5) (3.6) n.m n.m n.m n.m 124 0.22 0.7
Deleum DLUM MK SELL 0.97 12/17 38 37 41 9.4 9.2 10.1 10.3 10.5 9.6 10.4 389 0.77 1.3
Sapura Energy SAPE MK BUY 0.61 1/18 (294) (185) 104 (4.9) (3.1) 1.7 n.m n.m 34.7 n.m 3,625 1.58 0.4
Uzma UZMA MK HOLD 1.05 12/17 32 47 36 10.1 14.7 11.2 10.4 7.2 9.3 5.6 336 1.44 0.7
Segment (327) (147) 152 n.m. n.m 29.5 n.m 4,474 0.4
OIL & GAS – SHIPPING
MISC MISC MK HOLD 5.99 12/17 2,094 1,524 1,786 46.9 34.1 40.0 12.8 17.5 15.0 5.4 26,738 7.41 0.8
Segment 2,094 1,524 1,786 12.8 17.5 15.0 5.4 26,738 0.8
Note: If year end is before June, earnings are shown in the previous period. Source: Respective companies, Bloomberg, UOB Kay Hian

M a l a y s i a S t r a t e g y July 2018
91
Plantation MARKET WEIGHT
WHY WE ARE MARKET WEIGHT
CPO price downside risks shrank after 26% decline from its one-year peak.
Firm crude oil price above US$70/bbl provides base support to CPO prices.
Malaysian plantation stocks now trading at sector PE of 22x which is close to -1SD below its five-year mean.
WHAT TO WATCH OUT FOR IN 2H18
Momentum of inventory rise in Malaysia and Indonesia. Global biodiesel demand and Indonesia’s biodiesel
takeup rate. Potential minimum wage hike.
Outlook
FIGURE 180: PLANTATION INDEX IN LINE WITH FBMKLCI
92
94
96
98
100
102
104
106
Jan Feb Mar Apr May Jun Jul
Plantation
FBMKLCI
End Dec 17=100
Source: Bloomberg, UOB Kay Hian
In line with FBMKLCI ytd. The plantation index has decreased 6.5% ytd vs the FBMKLCI’s 5.9% decline. The company that has registered the least share price decline ytd is IOI Corporation (IOI). Share price (-1.5% ytd) has been supported by better earnings from its downstream operations and special dividend of 11.5 sen/share (20% of sales proceeds) from the disposal of 70% of its equity interest in Loders. On the flipside, the company that has seen the biggest share price drop ytd is IJM Plantations (IJMP) with share price down 18% ytd, possibly due to dismal results caused by weakening crude palm oil (CPO) prices.
Maintain MARKET WEIGHT. We upgraded the plantation sector to MARKET WEIGHT from UNDERWEIGHT in Jun 18. As we are not expecting significant weakness in CPO prices, we reckon the sector is now trading at its near-term fair value. CPO prices are likely to trade sideways, waiting for stronger re-rating catalysts, eg much stronger biodiesel demand or disappointing production. There is no strong catalyst to trigger an upgrade to OVERWEIGHT, but we see limited downside risk due to better gasoil prices of US$650-700/tonne. We maintain BUY on Kim Loong Resources and Sarawak Oil Palms.
Maintain 2018 CPO price assumption. To date, CPO ASP is RM2,421/tonne (-17.9% yoy). For 2018, we maintain our forecast at RM2,400/tonne as CPO prices could trend as low as RM2,250/tonne when production picks up in 2H18. We also maintain 2019 CPO price assumption at RM2,500/tonne.
CPO prices plunge and could have hit the bottom. CPO prices have plunged 32% from the peak of RM3,348/tonne in Feb 17 and have declined 4.7% ytd. The sharp CPO price correction since Feb 17 could have factored in concerns over the increase in fresh fruit bunch (FFB) production, especially in 2H18, on the back of a yield recovery. CPO prices trended in the range of RM2,350-2,550/tonne in Dec 17-May 18. We understand that there is limited downside risk for CPO prices after the significant decline from the peak in Feb 17, but there is no strong catalyst to push CPO prices up given high palm oil inventory levels.
Plantation index down 6.5% ytd vs FBMKLCI’s 5.9% drop ytd
Not expecting further CPO price weakness
CPO ASP forecasts: 2018 Maintain at RM2,400/tonne 2019 Maintain at RM2,500/tonne
CPO prices could have factored in concerns over increase in FFB production

M a l a y s i a S t r a t e g y July 2018
92
FIGURE 181: DECLINING CPO PRICES
2,200
2,350
2,500
2,650
2,800
2,950
3,100
3,250
3,400
Jan 17 Mar 17 May 17 Jul 17 Sep 17 Nov 17 Jan 18 Mar 18 May 18
(RM/tonne)
CPO FuturesMPOB CPO Price
Low: RM2,248/tonne
Peak: RM3,348/tonne
Source: Bloomberg
CPO prices could trend sideways in near term. CPO prices are negatively correlated with palm oil inventory levels. Historically, positive production growth and higher ending stocks will lead to lower CPO ASP in the following year (Figure 182). As inventory is expected to increase in 2H18, CPO prices are expected to trend in the range of RM2,350-2,500/tonne in 2Q18 and RM2,250-2,600/tonne in 2H18. CPO prices could trend even higher in end-4Q18 due to the low production season.
FIGURE 182: PALM OIL INVENTORY LEVELS VS CPO PRICES
1.4
1.6
1.8
2.0
2.2
2.4
2.6
2.8
3.0
3.2
Jan 14 Jul 14 Jan 15 Jul 15 Jan 16 Jul 16 Jan 17 Jul 17 Jan 18
(m tonnes)
1,600
1,800
2,000
2,200
2,400
2,600
2,800
3,000
3,200
3,400(RM/tonne)
Palm Oil Inv entory (LHS)CPO Price (RHS)
Source: MPOB, Bloomberg
FIGURE 183: CPO GLOBAL SUPPLY VS CHANGE IN CPO PRICES
(m tonnes) 2007 2008 2009 2010 2011 2012 2013 2014 2015 2016 2017 2018F
Production:
Malaysia 15.8 17.7 17.6 17.0 18.9 18.8 19.2 19.7 20.0 17.3 19.9 20.3
Indonesia 17.3 19.4 21.0 22.1 24.3 26.9 28.5 31.4 33.4 31.8 36.9 38.9
Others 5.7 6.4 6.7 6.7 7.6 8.1 8.6 8.6 9.1 10.1 11.1 11.7
Total Production 38.8 43.6 45.3 46.0 50.8 53.7 56.3 59.7 62.5 59.2 67.9 70.9
Ending inventory 6.0 7.2 7.3 7.9 9.5 11.6 10.8 11.1 13.4 10.2 12.4 12.4
Production Growth (%) 4.1 12.2 3.9 1.6 10.4 5.8 4.8 6.0 5.4 (5.9) 14.7 4.4
Change in Ending Stock (%) 8.7 20.5 1.1 7.9 20.3 23.0 (7.4) 3.2 21.1 (24.8) 22.3 1.7
CPO ASP (RM/tonne) 2,517 2,773 2,237 2,701 3,219 2,764 2,371 2,384 2,154 2,653 2,783 2,400-2,500
Change in ASP (%) 67.5 10.2 (19.3) 20.8 19.2 (14.1) (14.2) 0.5 (9.6) 23.2 4.9 (10)-(14)
Note: Historically, positive production growth and higher ending stock (denoted in blue) in prior years will lead to lower CPO ASP (denoted in red) in the following year Source: Oil World
Range-bound at RM2,350-2,500/tonne in 2Q18
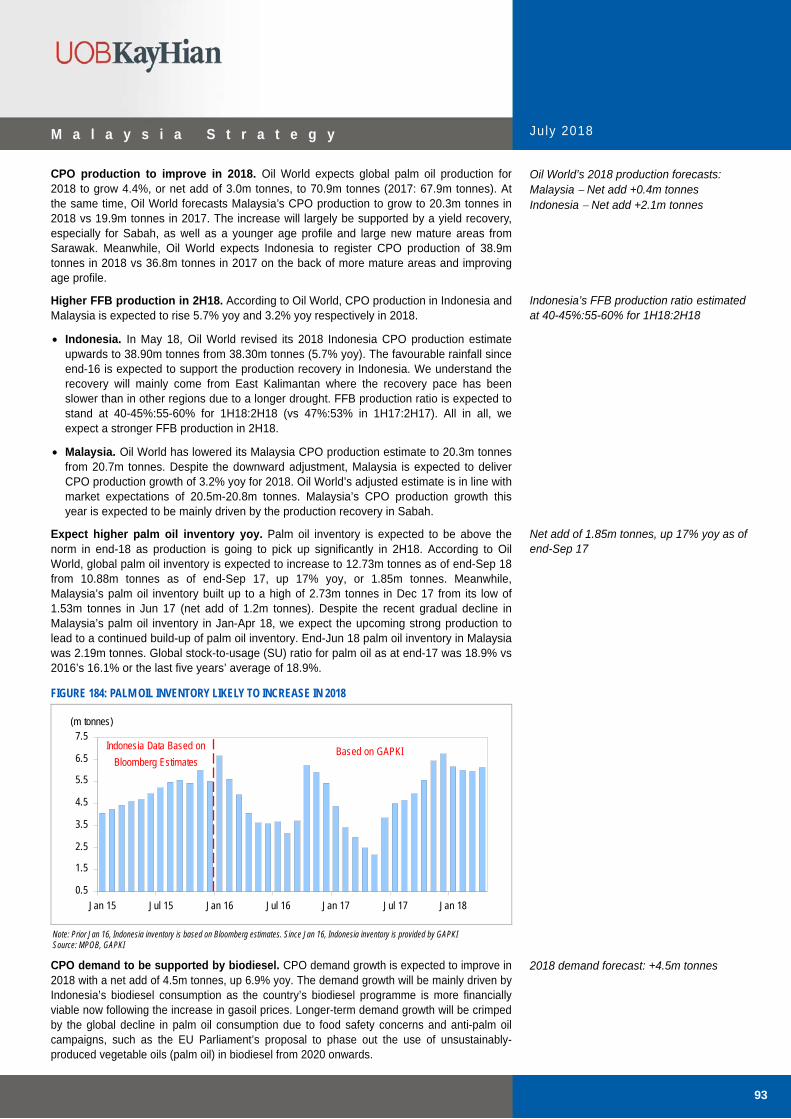
M a l a y s i a S t r a t e g y July 2018
93
CPO production to improve in 2018. Oil World expects global palm oil production for 2018 to grow 4.4%, or net add of 3.0m tonnes, to 70.9m tonnes (2017: 67.9m tonnes). At the same time, Oil World forecasts Malaysia’s CPO production to grow to 20.3m tonnes in 2018 vs 19.9m tonnes in 2017. The increase will largely be supported by a yield recovery, especially for Sabah, as well as a younger age profile and large new mature areas from Sarawak. Meanwhile, Oil World expects Indonesia to register CPO production of 38.9m tonnes in 2018 vs 36.8m tonnes in 2017 on the back of more mature areas and improving age profile.
Higher FFB production in 2H18. According to Oil World, CPO production in Indonesia and Malaysia is expected to rise 5.7% yoy and 3.2% yoy respectively in 2018.
Indonesia. In May 18, Oil World revised its 2018 Indonesia CPO production estimate upwards to 38.90m tonnes from 38.30m tonnes (5.7% yoy). The favourable rainfall since end-16 is expected to support the production recovery in Indonesia. We understand the recovery will mainly come from East Kalimantan where the recovery pace has been slower than in other regions due to a longer drought. FFB production ratio is expected to stand at 40-45%:55-60% for 1H18:2H18 (vs 47%:53% in 1H17:2H17). All in all, we expect a stronger FFB production in 2H18.
Malaysia. Oil World has lowered its Malaysia CPO production estimate to 20.3m tonnes from 20.7m tonnes. Despite the downward adjustment, Malaysia is expected to deliver CPO production growth of 3.2% yoy for 2018. Oil World’s adjusted estimate is in line with market expectations of 20.5m-20.8m tonnes. Malaysia’s CPO production growth this year is expected to be mainly driven by the production recovery in Sabah.
Expect higher palm oil inventory yoy. Palm oil inventory is expected to be above the norm in end-18 as production is going to pick up significantly in 2H18. According to Oil World, global palm oil inventory is expected to increase to 12.73m tonnes as of end-Sep 18 from 10.88m tonnes as of end-Sep 17, up 17% yoy, or 1.85m tonnes. Meanwhile, Malaysia’s palm oil inventory built up to a high of 2.73m tonnes in Dec 17 from its low of 1.53m tonnes in Jun 17 (net add of 1.2m tonnes). Despite the recent gradual decline in Malaysia’s palm oil inventory in Jan-Apr 18, we expect the upcoming strong production to lead to a continued build-up of palm oil inventory. End-Jun 18 palm oil inventory in Malaysia was 2.19m tonnes. Global stock-to-usage (SU) ratio for palm oil as at end-17 was 18.9% vs 2016’s 16.1% or the last five years’ average of 18.9%.
FIGURE 184: PALM OIL INVENTORY LIKELY TO INCREASE IN 2018
0.5
1.5
2.5
3.5
4.5
5.5
6.5
7.5
Jan 15 Jul 15 Jan 16 Jul 16 Jan 17 Jul 17 Jan 18
(m tonnes)
Indonesia Data Based on
Bloomberg EstimatesBased on GAPKI
Note: Prior Jan 16, Indonesia inventory is based on Bloomberg estimates. Since Jan 16, Indonesia inventory is provided by GAPKI Source: MPOB, GAPKI
CPO demand to be supported by biodiesel. CPO demand growth is expected to improve in 2018 with a net add of 4.5m tonnes, up 6.9% yoy. The demand growth will be mainly driven by Indonesia’s biodiesel consumption as the country’s biodiesel programme is more financially viable now following the increase in gasoil prices. Longer-term demand growth will be crimped by the global decline in palm oil consumption due to food safety concerns and anti-palm oil campaigns, such as the EU Parliament’s proposal to phase out the use of unsustainably-produced vegetable oils (palm oil) in biodiesel from 2020 onwards.
Oil World’s 2018 production forecasts: Malaysia Net add +0.4m tonnes Indonesia Net add +2.1m tonnes
Indonesia’s FFB production ratio estimated at 40-45%:55-60% for 1H18:2H18
Net add of 1.85m tonnes, up 17% yoy as of end-Sep 17 2018 demand forecast: +4.5m tonnes

M a l a y s i a S t r a t e g y July 2018
94
FIGURE 185: PALM OIL SUPPLY EXPECTED TO EXCEED DEMAND IN 2018
-3.0
-2.0
-1.0
0.0
1.0
2.0
3.0
4.0
5.0
6.0
93 94 95 96 97 98 99 00 01 02 03 04 05 06 07 08 09 10 11 12 13 14 15 16 17 18F
SupplyDemand
(m tonne)
Source: Oil World
Biodiesel programme more financially viable now. Gasoil prices have increased 172% from the low of US$247/tonne on 20 Jan 16, while CPO prices have merely increased 8% over the same period. The increase in gasoil prices has led to a CPO-gasoil price differential of -US$108/tonne currently, down from the differential of +US$274/tonne on 20 Jan 16. This has made the biodiesel programme more financially viable as minimal subsidy is required. We understand that discretionary demand for biodiesel will increase when the CPO to gasoil price discount widens to US$40-60/tonne.
FIGURE 186: CPO PRICES VS GASOIL PRICES
200
300
400
500
600700
800
900
1000
1100
1200
12 13 14 15 16 17 18
-300
-200
-100
0
100
200
300
400(US$/tonne)(US$/tonne)
Gasoil (LHS)
CPO (LHS)
Discount (RHS)
Premium (RHS)
Source: Bloomberg
Malaysia’s biodiesel exports could double in 2018. Exports of biodiesel from Malaysia rose 30% to 121,174 tonnes in 4M18 vs 93,522 tonnes in 4M17. Channel checks with some biodiesel producers in Malaysia reveal reasonable biodiesel volume in the export pipeline for the next three months. Thus, 2018 total biodiesel export volume is expected to be significantly higher than the 235,291 tonnes in 2017. Although the export volume is not significant (2.1-2.3% of total expected production of 20.8m tonnes), the additional 200,000-250,000 tonnes can keep inventory from surging to a new high.
Indonesia’s PSO biodiesel volume to rise hoh. Indonesia’s biodiesel production in 2018 is likely to be higher than 2017’s output of 2.5m tonnes. The sixth biodiesel procurement contract for 1.43m kilolitres (kl) for the Public Service Obligation (PSO) segment of the diesel market is within market expectations as the market had expected the volume to be higher than the fifth contract’s 1.41m kl. The awarded volume is higher than that for Nov 17-Apr 18 (1.41m kl, +1.4% hoh) and May-Oct 17 (1.35m kl, +5.7% yoy).
Current CPO-gasoil price differential of -US$108/tonne, down from differential of +US$274/tonne on 20 Jan 16 Additional biodiesel demand for 200,000-250,000 tonnes can keep inventory from surging to new high
Awarded volume is higher than that for Nov 17-Apr 18 (1.41m kl, +1.4% hoh) and May-Oct 17 (1.35m kl, +5.7% yoy)

M a l a y s i a S t r a t e g y July 2018
95
Indonesia’s biodiesel demand to come from other segments. The market is expecting non-PSO demand of 320,000kl, demand for 7,384kl from the B5 programme for trains and 400,000kl from the B15 programme for the mining sector in 2018. Total biodiesel demand in Indonesia including PSO is estimated at 3.6m kl, which is 40% higher yoy.
FIGURE 187: EXPECTED BIODIESEL VOLUME FOR 2018
Segment 2017 Volume (kl) Period Volume (kl)
PSO B20 mandate 2,518,400 Jan-Dec 18 2,828,564
Pertamina Non-PSO - May-Dec 18 320,000
B5 for Train (PT KAI) - May-Dec 18 7,348
B15 for Mining - Jun-Dec 18 400,000
Total 2,518,400 2018 Estimates 3,555,948
Source: ESDM, UOB Kay Hian
India: Palm oil gaining market share, overall imports increasing yoy. Palm oil’s market share grew to 66% in Nov 17-Mar 18 vs 63% in Nov 16-Mar 17. Overall palm oil imports increased 3.5% yoy in Nov 17-Apr 18 mainly due to Malaysia’s export tax suspension for Jan-Apr 18. Moreover, the weakness in CPO prices has led to a widening discount between refined, bleached and deodorised (RBD) palm olein prices and soybean/sunflower oil prices. India, being a price-sensitive market, saw demand shift from soybean oil and sunflower oil to palm oil.
FIGURE 188: PALM OIL GAINING MARKET SHARE IN INDIA FIGURE 189: INDIA – OVERALL IMPORTS HIGHER YOY
0%
20%
40%
60%
80%
100%
Nov 16-Mar 17
Palm Oil Soy bean Oil Sunflow er Oil Rapeseed Oil Others
Nov 17-Mar 18
300
400
500
600
700
800
900
1000
1100
13 14 15 16 17 18
('000 tonnes)
-60
-40
-20
0
20
40
60
80
100(y oy % chg)
Palm Oil + RBD Palm Oil Import (LHS)Palm Oil + RBD Palm Oil Import Grow th (RHS)
Source: SEA India Source: SEA India
China: Stable demand of 5.0m-5.5m tonnes p.a. to fulfil basic needs. Palm oil demand from China is not expected to increase significantly due to the slowdown in GDP and population growth. However, we understand that China’s minimum/basic/inelastic demand is about 5.0m tonnes. Current palm oil inventory of 650,000-750,000 tonnes is at 1.3-1.45 months. Thus, we do not expect to see a significant increase in China’s palm oil imports.
Total biodiesel demand of 3.6m kl
Overall palm oil imports up 3.5% yoy in Nov 17-Apr 18
Do not expect a significant increase in China’s palm oil imports on current high inventory

M a l a y s i a S t r a t e g y July 2018
96
FIGURE 190: CHINA BASIC PALM OIL DEMAND AT LEAST 5M TONNES
5.84
6.19
6.05
5.13
6.096.16
6.29
5.83
5.15
5.0
5.2
5.4
5.6
5.8
6.0
6.2
6.4
09 10 11 12 13 14 15 16 17
(m tonnes)
Source: Oil World
Labour is main challenge facing sector. Oil palm cultivation is labour-intensive and mechanisation has its limits. On top of that, the sector is facing two major labour issues:
a) Acute labour shortage. Hiring of foreign labour could get tougher under the new government. In its manifestos, Pakatan Harapan indicated that it would reduce foreign worker supply, which would pose a huge challenge to the plantation sector as it relies heavily on foreign workers. The labour shortage has resulted in wastage of crops that cannot be harvested and are left to rot. Progress has been made in mechanising field operations such as manuring, spraying, and loading of harvested fruit bunches onto vehicles to be transported out of the fields. However, mechanisation of the harvesting process continues to stump even the best minds after several decades.
b) Cost pressure from rising minimum wage. East Malaysian planters face potential cost pressure as there is a plan to synchronise the minimum wages of Sabah and Sarawak (RM920) with that of Peninsular Malaysia (RM1,000). This could increase cost of production by 2-5% for planters with East Malaysia exposure. On top of that, Pakatan Harapan’s manifesto to raise the minimum wage in its first term in office to RM1,500 could add 5-11% to cost of operation. Nevertheless, we understand that the government will subsidise 50% of the minimum wage increase.
Sector facing twin challenges of labour shortage and minimum wage hike
A huge challenge as the sector relies heavily on foreign workers
Increase cost of production by 2-11%

M a l a y s i a S t r a t e g y July 2018
97
Strategy
Maintain MARKET WEIGHT. The correction over the last one year could have factored in the lacklustre CPO price outlook. As we are not expecting further CPO price weakness, we reckon the sector is now trading at fair valuations. Malaysian plantation stocks are now trading at a sector PE of 22x which is close to -1SD below its five-year mean.
CPO prices are likely to trade sideways, and we are waiting for stronger re-rating catalysts such as much stronger biodiesel demand or disappointing production.
The plantation sector is more defensive and less affected by the high market volatility resulting from the change of government. Among big caps, we like Kuala Lumpur Kepong and Genting Plantations where the former is expected to deliver stable earnings growth from its upstream and downstream operations and the latter’s earnings growth is supported by FFB production growth at its Indonesian estates.
BUY calls. We maintain BUY on Kim Loong Resources (KIML MK/BUY/RM1.32/Target: RM1.50) and Sarawak Oil Palms (SOP MK/BUY/RM2.98/Target: RM4.15). The latter’s share price has weakened significantly (-26.3%) since Jan 18 and we believe the expected CPO price weakness for 2018 has been priced in.
FIGURE 191: FORWARD PE BAND
Mean = 26x
1sd = 31x
-1sd = 20x
2sd = 37x
-2sd = 14x
10
15
20
25
30
35
40
45
09 10 11 12 13 14 15 16 17
(x )
1,500
2,000
2,500
3,000
3,500
4,000(RM/tonne)
Forw ard Av g PE (LHS)CPO Price (RHS)
Source: Bloomberg
Leow Huey Chuen [email protected]
+603 2147 1990
Ooi Mong Huey [email protected]
+603 2147 1995
Sector trading at fair valuations
Big caps: we like Kuala Lumpur Kepong and Genting Plantations BUY calls: Kim Loong Resources and Sarawak Oil Palms

M a l a y s i a S t r a t e g y July 2018
98
Sector At A Glance
FIGURE 192: CPO PRICE MOVEMENTS FIGURE 193: MALAYSIA AND INDONESIA INVENTORIES
500
1,000
1,500
2,000
2,500
3,000
3,500
4,000
4,500
00 01 02 03 04 05 06 07 08 09 10 11 12 13 14 15 16 17 18
CPO Spot Prices
100-Day MA
200-Day MA
(RM/tonne)
2.0
3.0
4.0
5.0
6.0
7.0
8.0
15 16 17 18
(m tonnes)
Indonesia data Based on GAPKI based on
Bloomberg Estimates
Source: Bloomberg Source: MPOB, GAPKI
FIGURE 194: MALAYSIA & INDONESIA PRODUCTION & DOMESTICCONSUMPTION
FIGURE 195: MALAYSIA MONTHLY PALM OIL EXPORTS
2
3
4
5
6
7
16 17 18
(m tonnes)
Domestic ConsumptionEx port Production
0.9
1.1
1.3
1.5
1.7
1.9
Jan Feb Mar Apr May Jun Jul Aug Sep Oct Nov Dec
2017 20182016 2015
(m tonnes)
Source: MPOB, GAPKI Source: MPOB
FIGURE 196: CPO PRICES AT A PREMIUM TO GAS OIL PRICES FIGURE 197: NARROWING GAP BETWEEN OLEIN AND SOYBEAN OIL PRICES
2030405060708090
100110120130
14 15 16 17 18
CPO
Crude Oil
(US$/bbl)
450
550
650
750
850
950
1,050
14 15 16 17 18
(US$/tonne)
RBD Palm Olein Soy bean Oil Price
Source: Bloomberg Source: Bloomberg
FIGURE 198: SECTOR STATISTICS
Share Price Last Net Profit EPS PE Market BV Price/
Company Ticker Rec 5 Jul 18 Year 2017 2018F 2019F 2017 2018F 2019F 2017 2018F 2019F ROE Cap ps BV ps (RM) End (RMm) (RMm) (RMm) (sen) (sen) (sen) (x) (x) (x) (%) (RMm) (RM) (x)
Genting Plantations GENP MK HOLD 9.16 12/17 517 344 408 64.3 42.8 50.7 14.3 21.4 18.1 7.8 7,372 5.30 1.7 IJM Plantations IJMP MK HOLD 2.25 3/18 69 82 108 7.9 9.4 12.3 28.6 24.1 18.3 2.7 1,981 1.84 1.2 IOI Corporation IOI MK SELL 4.47 6/17 1,164 1,067 1,281 19.1 17.5 21.0 23.4 25.6 21.3 10.0 27,296 1.45 3.1 Kim Loong Resources KIML MK BUY 1.32 1/18 99 101 111 10.1 10.3 11.3 13.1 12.8 11.7 16.3 1,234 0.83 1.6 Kuala Lumpur Kepong KLK MK HOLD 24.24 9/17 1,298 1,105 1,181 121.9 103.8 110.9 19.9 23.4 21.9 9.1 25,815 10.40 2.3 Sarawak Oil Palms SOP MK BUY 2.98 12/17 261 156 182 45.6 27.4 32 6.5 10.9 9.3 15.2 1,701 3.74 0.8 Sime Darby Plantation SDPL MK SELL 5.35 6/17 1,038 1,352 1,064 15.3 19.9 15.6 35.0 26.9 34.2 9.4 36,384 2.05 2.6 TH Plantations THP MK HOLD 0.65 12/17 51 27 36 5.7 3.0 4.1 11.4 21.7 15.9 2.6 575 1.51 0.4 Sector 4,498 4,235 4,370 22.8 24.2 23.4 102,359 1.7
Note: If year end is before June, earnings are shown in the previous period. Source: Respective companies, Bloomberg, UOB Kay Hian

M a l a y s i a S t r a t e g y July 2018
99
Property – Developers & REITs MARKET WEIGHT
WHY WE ARE MARKET WEIGHT
Developers Trading below mean valuations, fairly reflecting subdued outlook. Affordable projects to remain in focus.
REITs Oversupply of commercial properties still exists, leading to slower rental reversion.
WHAT TO WATCH OUT FOR IN 2H18
Easier lending requirement for first-time home buyers. Restructuring of government affordable housing plan. Other government regulations eg foreign labour. Interest rate hikes locally and globally.
Outlook
DEVELOPERS – OUTLOOK
FIGURE 199: PROPERTY INDEX UNDERPERFORMS FBMKLCI
8486889092949698
100102104106
Jan Feb Mar Apr May Jun Jul
Property
FBMKLCI
End Dec 17=100
Source: Bloomberg, UOB Kay Hian
Underperforms FBMKLCI ytd. The property index has recorded a 17.1% decline ytd vs a 5.9% contraction in the FBMKLCI. Most of the developers under our coverage have experienced declines in share prices ytd with UEM Sunrise plunging the most (-35.5%) followed by Mah Sing (-24.8%) and SP Setia (-10.7%). Some of the selldown could be linked to foreign investors exiting Malaysia. Investor sentiment has been particularly frail post 14th general election (GE14). For example, Sime Darby Property was sold down by 6.7% when PKR’s de facto leader Datuk Seri Anwar Ibrahim said the government may relook the redevelopment of the Battersea Power Station (BPS) project whether or not there were dubious or politically-motivated elements as the project involves national sovereign funds Permodalan Nasional (PNB) and Employees Provident Fund (EPF) which collectively own 67% equity interests in BPS. On the other hand, Sunway Bhd is the least impacted with share price having fallen 0.6%, followed by Yong Tai with a decline of 7.2%.
Maintain MARKET WEIGHT on the sector. In the light of the slowdown in the sector, property stocks are trading below their long-term mean valuations. Most stocks trade at well over 50% discounts to their assessed RNAV.
Sector outlook to remain unexciting in 2H18... Post GE14, we expect the property market to remain subdued, reflecting stringent lending policies, affordability issues, and rising global interest rates. Meanwhile, property developers are monitoring potential changes in government policies to gauge demand, including decision on minimum wage and foreign worker restrictions, although the abolishment of the Goods and Services Tax (GST) should lift sales of commercial properties. Demand remains sluggish, requiring property developers to entice homebuyers with good discounts (at least 10%) and payment terms to close the sale. Overall, our channel checks point to only a modest industry pipeline of property launches in 2H18. The general outlook for 2H18 would not deviate from our full-year outlook (Figure 200).
Sector underperformance driven by subdued outlook as buyers hold back purchases
Below-mean PE multiples and deep >50% discounts to RNAV fairly reflect…
…subdued outlook through 2019, while awaiting fresh government policies
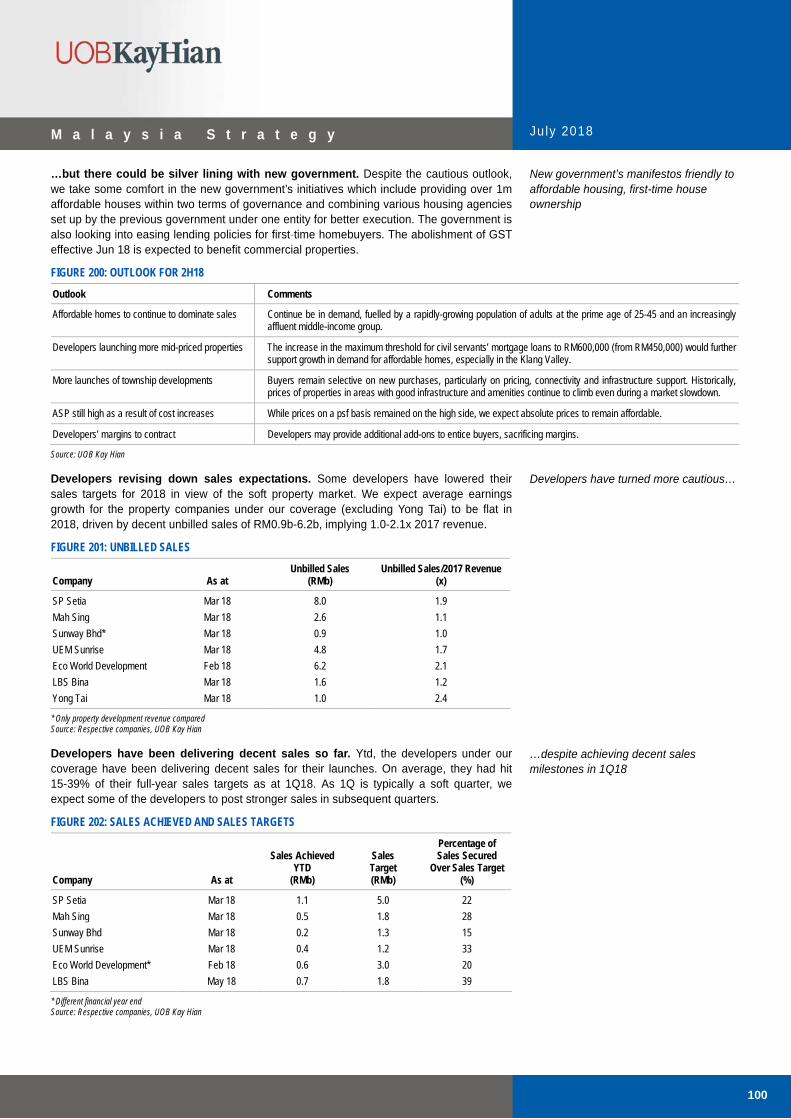
M a l a y s i a S t r a t e g y July 2018
100
…but there could be silver lining with new government. Despite the cautious outlook, we take some comfort in the new government’s initiatives which include providing over 1m affordable houses within two terms of governance and combining various housing agencies set up by the previous government under one entity for better execution. The government is also looking into easing lending policies for first-time homebuyers. The abolishment of GST effective Jun 18 is expected to benefit commercial properties.
FIGURE 200: OUTLOOK FOR 2H18
Outlook Comments
Affordable homes to continue to dominate sales Continue be in demand, fuelled by a rapidly-growing population of adults at the prime age of 25-45 and an increasingly affluent middle-income group.
Developers launching more mid-priced properties The increase in the maximum threshold for civil servants’ mortgage loans to RM600,000 (from RM450,000) would further support growth in demand for affordable homes, especially in the Klang Valley.
More launches of township developments Buyers remain selective on new purchases, particularly on pricing, connectivity and infrastructure support. Historically, prices of properties in areas with good infrastructure and amenities continue to climb even during a market slowdown.
ASP still high as a result of cost increases While prices on a psf basis remained on the high side, we expect absolute prices to remain affordable.
Developers’ margins to contract Developers may provide additional add-ons to entice buyers, sacrificing margins.
Source: UOB Kay Hian
Developers revising down sales expectations. Some developers have lowered their sales targets for 2018 in view of the soft property market. We expect average earnings growth for the property companies under our coverage (excluding Yong Tai) to be flat in 2018, driven by decent unbilled sales of RM0.9b-6.2b, implying 1.0-2.1x 2017 revenue.
FIGURE 201: UNBILLED SALES
Unbilled Sales Unbilled Sales/2017 Revenue Company As at (RMb) (x)
SP Setia Mar 18 8.0 1.9
Mah Sing Mar 18 2.6 1.1
Sunway Bhd* Mar 18 0.9 1.0
UEM Sunrise Mar 18 4.8 1.7
Eco World Development Feb 18 6.2 2.1
LBS Bina Mar 18 1.6 1.2
Yong Tai Mar 18 1.0 2.4
* Only property development revenue compared Source: Respective companies, UOB Kay Hian
Developers have been delivering decent sales so far. Ytd, the developers under our coverage have been delivering decent sales for their launches. On average, they had hit 15-39% of their full-year sales targets as at 1Q18. As 1Q is typically a soft quarter, we expect some of the developers to post stronger sales in subsequent quarters.
FIGURE 202: SALES ACHIEVED AND SALES TARGETS
Percentage of Sales Achieved Sales Sales Secured YTD Target Over Sales Target Company As at (RMb) (RMb) (%)
SP Setia Mar 18 1.1 5.0 22
Mah Sing Mar 18 0.5 1.8 28
Sunway Bhd Mar 18 0.2 1.3 15
UEM Sunrise Mar 18 0.4 1.2 33
Eco World Development* Feb 18 0.6 3.0 20
LBS Bina May 18 0.7 1.8 39
* Different financial year end Source: Respective companies, UOB Kay Hian
Status of some mega property projects in limbo
2H18 launches continue to focus on affordable housing
Developers have turned more cautious…
…despite achieving decent sales milestones in 1Q18
New government’s manifestos friendly to affordable housing, first-time house ownership

M a l a y s i a S t r a t e g y July 2018
101
Spotlight remains on affordable housing. Meanwhile, property developers continue to launch affordable housing targeting the prime age group of 25-45 years old. In addition, a further increase in the maximum threshold for civil servants’ mortgage loans from RM450,000 to RM600,000 is expected to help lift demand for affordable homes, particularly in Klang Valley. Notable launches in 2H18 include SP Setia’s flagship Setia Alam development and its projects in Melbourne and Singapore.
FIGURE 203: HOUSE PRICE INDEX BY LOCATION
80100120140160180200220240260280300320
00 01 02 03 04 05 06 07 08 09 10 11 12 13 14 15 16
SelangorKuala LumpurPenangJohorMalay sia
(Index )
Malaysia Klang Valley Johor Penang
2Q17 qoq change 0.5% 0.5% 2.1% -0.5%
2Q17 yoy change 6.9% 8.0% 9.0% 3.5%
Source: CEIC
Mega property projects under the spotlight. After due consideration, the Ministry of Finance has agreed to inject RM2.8b of new capital into Tun Razak Exchange (TRX), particularly to finance infrastructure works. This was because TRX City does not have sufficient funds for completing infrastructure works and has sought financial aid from the government. Meanwhile, the much bigger ill-fated Bandar Malaysia project remains in limbo.
Generally stable Malaysian prices... According to CEIC, the house price index (HPI) for Malaysia and the key states have remained relatively stable with an average growth of 5.0% yoy from 2Q17. Surprisingly, Johor has seen the strongest yoy price hike of about 9% yoy, which largely reflects a recovery from the negative growth in previous quarters.
…reflect uptrend of construction costs. The rise in property prices is still largely attributable to increased construction costs (eg building materials, labour) as well as regulatory costs. While building material cost hikes have recently eased, especially with the fall in steel prices since their peak in Jan 18, we do not expect housing prices to ease. We reiterate our view that landed properties would continue to see modest price appreciation, especially those in the affordable segment, given the strong urban population growth and modest income growth. Nevertheless, downward pricing pressure would remain for high-end landed properties and high-rise condominiums that are not in highly sought after areas.
Property overhang still on the high side. According to the National Property Information Centre (NAPIC), there were a total of 144,927 unsold residential units under construction or had not started construction as at 1Q18. Of the number of unsold units under construction, 42% (45,037 units) were serviced apartments, 21% (22,572 units) of the units were condominiums while the remaining 21% (22,539 units) were terrace houses. States that recorded the highest number of unsold units under construction were Johor (37,637 units), Selangor (24,345) and Kuala Lumpur (14,074).
Housing prices remain stable despite bleak sector outlook Bandar Malaysia in limbo
Current environment supportive of stable ASP
Rising construction costs also helped hold up property prices
Property overhang still a concern for areas such as Johor, Selangor and Kuala Lumpur

M a l a y s i a S t r a t e g y July 2018
102
REITs – OUTLOOK
FIGURE 204: REITS INDEX UNDERPERFORMS FBMKLCI
78
82
86
90
94
98
102
106
Jan Feb Mar Apr May Jun Jul
REITs
FBMKLCI
End Dec 17=100
Source: Bloomberg, UOB Kay Hian
Underperforms FBMKLCI. UOB Kay Hian’s REIT index has underperformed the FBMKLCI ytd, reflecting spotty growth among REIT operators. The sector has reported a decline in share prices ytd at an average of 11.4% vs the FBMKLCI’s 5.9%. CMMT emerged as top loser in terms of share price decline (-34.4%) followed by KLCC Stapled Security (-11.33%) and Sunway REIT (-10.5%). On the other hand, REITs which were least impacted by share price movements ytd include Pavilion REIT (-3.1%) and Axis REIT (-3.3%).
Lack of near-term catalyst on domestic front... We believe the sector still lacks clarity in terms of earnings visibility with the issue of oversupply of commercial properties being far from over. Earnings are also at risk amid weak corporate earnings growth coupled with continued cautious spending by consumers. To make matters worse, government coffers are also tightened with a smaller number of government agencies, thereby creating vacant office space and impacting REITs such as MRCB-Quill REIT and Sunway REIT, although the contribution from the impacted agencies is marginal at less than 5% of total revenue for the respective REITs. All of the factors mentioned will be a hindrance to REIT operators who seek to demand positive rental reversion from their tenants.
Global economic indicators not encouraging too. On the global front, the sector is weighed down by the US Federal Reserve’s interest rate hikes. Separately, the US 10-year Treasury note’s rise closer to 3% in turn creates uncertainties about 10-Year Malaysian Government Securities’ (MGS) likelihood of inching up further, hence leading to a wider spread between MGS’ and REITs’ average yields. The spread between MGS and average REIT was 1.37ppt in 2017 compared to 2.08ppt ytd 2018.
FIGURE 205: AVERAGE YIELD SPREAD & 10-YEAR MGS
1
2
3
4
13 14 15 16 17 18
(ppt)
3.0
3.2
3.4
3.6
3.8
4.0
4.2
4.4
4.6(%)
Av erage Yield Spread (LHS)10-Year MGS (RHS)
Source: Bloomberg, UOB Kay Hian
Underperformance reflects spotty earnings growth and uninspiring interest rate movement
Unexciting earnings growth as a result of oversupply of commercial properties
Yield spread widening as 10-year MGS rises

M a l a y s i a S t r a t e g y July 2018
103
FIGURE 206: OUTLOOK FOR 2H18
Outlook Comments
Retail - Mass Mall Rental reversion is believed to remain under pressure as supply of retail space continues to exceed demand, compounded by flattish retail sales.
Retail - Premium Mall Expected to maintain decent rental reversion (within mid single digits) driven by commendable retail sales and niche market segment.
Office Oversupply is far from over with upcoming mega projects such as Tun Razak Exchange, Bukit Bintang City Centre and Merdeka PNB 118. Rental reversion is expected to remain depressed regardless of location.
Hotel No rosy outlook as few notable hotels are up for completion (Four Seasons, Royale Pavilion and Hotel Equatorial) amid a decline in business travel and events.
Industrial No rerating catalyst. Demand for industrial space is not expected to surge while warehouse space is widely available.
Source: UOB Kay Hian
5.5m retail space ready in 2018. The retail market expects to see another 5.5m sf of NLA in Kuala Lumpur in 2018, representing a 36.8% yoy increase. Notable names such as Pavilion 2 (2m sf of NLA) and Eko Cheras (1m sf of NLA) are expected to enter the market. WCT Holdings also opened a seven-storey Paradigm Mall in Johor in Nov 17 which offers over 500 retail lots. This does not bode well given the weak retail sales growth recorded by Retail Group Malaysia since 2Q15, suggesting continued weak retail sales.
Rental reversion still weak at mass retail market. Based on our channel checks, rental reversion at mass retail malls during 1H18 remained under pressure in tandem with flattish tenant sales. In some cases, some REIT operators also had to put up with negative rental reversion in order to keep occupancy rate high. We also understand that some REIT operators are still subsidising tenants with a few rent-free months.
FIGURE 207: INCOMING MALL SUPPLY IN 2018 IN KUALA LUMPUR
Shopping Mall Location NLA (sf)
8 Conlay Podium Jalan Conlay 188,000
Pavilion 2 Bukit Jalil 2,000,000
Eko Cheras Cheras 1,000,000
Quartza Mall Desa Melawati 635,000
Paradigm KL Jalan Awan Besar 1,700,000
Total 5,523,000
Source: AREM (Malaysia)
Still decent performance for prime retail malls. Unlike the mass retail market, prime retail malls still managed to achieve decent rental reversion due to strategic locations and good product offerings. We understand that rental reversion at Suria KLCC, Pavilion Mall and The Gardens were still decent in 1H18 at around mid single digits. In 2H18, prime retail malls will continue to deliver a commendable performance compared to mass retail malls.
Additional office space still a concern. Similar to retail space, office oversupply is also a concern, especially with occupancy rate for offices in Kuala Lumpur showing no sign of improvement at 78% in 2017. This year, the office market in Klang Valley is expected to add another 2.6m sf of NLA with notable projects such as The Vertical Corporate Tower (693,000sf), and redevelopment of MAS Building (357,000sf) and Prudential Tower (415,000sf). For 2019 and beyond, the market is expected to add another 4.9m sf of NLA, thus the oversupply is probably far from over. These figures have yet to take into account mega projects such as TRX, PNB’s Warisan Merdeka 118 and Bukit Bintang City Centre.
At best, flat rental rate for office market. With heightened competition among office buildings, we gather that rental reversion for office space will be flat at best. This comes on the back of numerous new office buildings that are near completion, particularly TRX which will offer over 2m sf of NLA. We understand that, save for the office belonging to KLCC Property Holdings, other offices in the city centre are having a tough time negotiating for positive rental reversion. We also remain cautious on rentals for the new office buildings to be completed in the near future.
5.5m of retail NLA to enter market in 2018
Compression of occupancy and rental reversion at mass retail malls
Decent rental reversion at prime retail malls still holding up
Office oversupply far from over
Incoming supply of office space will keep office rentals at depressed levels

M a l a y s i a S t r a t e g y July 2018
104
FIGURE 208: INCOMING OFFICE SUPPLY IN 2018 IN KUALA LUMPUR
Office Location NLA (sf)
The Vertical Corporate Tower Bangsar South 693,000
Redevelopment of MAS Building (PNB Lot 1194) Jalan Sultan Ismail 357,000
Office Tower (former Bombay Palaca) Jalan Tun Razak 331,000
Prudential Tower TRX 415,000
Equatorial Plaza Jalan Sultan Ismail 470,000
Etiqa Insurance Bangsar 390,000
Total 2,656,000
Source: AREM (Malaysia)
FIGURE 209: OCCUPANCY RATE – OFFICES IN KUALA LUMPUR FIGURE 210: OCCUPANCY RATE – SHOPPING MALLS IN MALAYSIA
72
74
76
78
80
82
84
00 01 02 03 04 05 06 07 08 09 10 11 12 13 14 15 16 17
(%)
75
76
77
78
79
80
81
82
83
00 01 02 03 04 05 06 07 08 09 10 11 12 13 14 15 16 17
(%)
Source: NAPIC Source: NAPIC

M a l a y s i a S t r a t e g y Ju ly 2018
105
Strategy
DEVELOPERS
Maintain MARKET WEIGHT. As expected, property stocks are trading below their long-term mean valuations in the light of the slowdown in the sector. We expect 2018 to continue to be challenging, given affordability constraints and banks’ stringent lending policies. Nevertheless, we believe developers with landbanks in selected hotspots would continue to deliver decent sales, thereby enhancing their earnings visibility. Our top pick for the sector is Yong Tai.
Yong Tai (YTB MK/BUY/RM1.40/Target: RM2.10). Yong Tai’s newly-opened Encore Melaka theatre would be a crucial earnings driver as it could contribute about RM60m to EBIT in its full year of operations. Its robust unbilled sales of RM1b would also propel earnings growth for the next 2-3 years. Our target price is based on a 30% discount to our fully-diluted SOTP-based valuation of RM3.00/share. We expect no dividend payout in the first two financial years (FY18-19), but Yong Tai plans to establish a generous dividend policy as cash flow improves.
REITs
Maintain MARKET WEIGHT on the REIT segment amid rising interest rates globally. We still believe the oversupply in the office and retail spaces is far from over. However, niche office buildings and prime retail malls will likely remain resilient in the long term. Our top pick for the segment is IGB REIT.
We like IGB REIT (IGBREIT MK/BUY/RM1.66/Target: RM1.85) as we believe it has the lowest earnings risk (due to solid rental reversion and highest retail sales) and an implied dividend yield of 5.2%. Our target price is based on a dividend discount model (required rate of return: 7.3%, terminal growth: 1.7%). IGB REIT also posted resilient growth in 1H17, solely from organic growth at MidValley MegaMall and The Gardens. The REIT was also able to record a rental reversion of 5% in 1Q18 with tenant sales reported in the high single digits. Its sponsor’s asset – MidValley South Key Megamall – is expected to open on 18 Aug 18, but we gather that its acquisition will not take place in the near term.
Abdul Hadi Manaf +603 2147 1971
MARKET WEIGHT developers; top pick: Yong Tai
Top pick for REITs – IGB REIT given its solid rental reversion

M a l a y s i a S t r a t e g y July 2018
106
Sector At A Glance
FIGURE 211: MALAYSIA RESIDENTIAL SUPPLY FIGURE 212: KUALA LUMPUR RESIDENTIAL SUPPLY
0100200300400500600700800900
07 08 09 10 11 12 13 14 15 16
Completion Incoming SupplyStarts Planned Supply
('000 unit)
0
10
20
30
40
50
60
07 08 09 10 11 12 13 14 15 16
Completion Incoming SupplyStarts Planned Supply
('000 unit)
Source: Property Market Report 2016 Source: Property Market Report 2016
FIGURE 213: KLANG VALLEY RESIDENTIAL SUPPLY FIGURE 214: ISKANDAR RESIDENTIAL SUPPLY
0
50
100
150
200
250
300
07 08 09 10 11 12 13 14 15 16
Completion Incoming SupplyStarts Planned Supply
('000 unit)
0
50
100
150
200
07 08 09 10 11 12 13 14 15 16
Completion Incoming SupplyStarts Planned Supply
('000 unit)
Source: Property Market Report 2016 Source: Property Market Report 2016
FIGURE 215: SECTOR STATISTICS
Share Price Last Net Profit EPS PE Market BV Price/
Company Ticker Rec 5 Jul 18 Year 2017 2018F 2019F 2017 2018F 2019F 2017 2018F 2019F ROE Cap ps BV ps (RM) End (RMm) (RMm) (RMm) (sen) (sen) (sen) (x) (x) (x) (%) (RMm) (RM) (x)
Developers
Eco World Development ECW MK HOLD 1.21 10/17 216 188 272 7.3 6.4 9.2 16.5 19.0 13.1 5.2 3,563 1.46 0.8
LBS Bina LBS MK BUY 0.87 12/17 103 115 122 5.9 6.6 7.0 14.7 13.1 12.4 9.7 1,342 1.66 0.5
Mah Sing MSGB MK HOLD 1.09 12/17 627 366 373 25.8 15.1 15.3 4.2 7.2 7.1 10.7 2,646 1.44 0.8
MRCB MRC MK BUY 0.61 12/17 104 147 182 2.4 3.4 4.2 25.6 18.1 14.6 4.3 2,656 1.10 0.5
SP Setia SPSB MK BUY 3.00 12/17 850 570 695 21.8 14.7 17.9 13.7 20.5 16.8 8.1 11,671 3.07 1.0
Sunsuria SSR MK HOLD 0.97 9/17 131 114 119 16.4 14.2 14.8 5.9 6.8 6.5 12.5 775 1.03 0.9
Sunway Bhd SWB MK HOLD 1.54 12/17 601 592 625 12.3 12.2 12.9 12.5 12.6 12.0 8.4 7,491 1.65 0.9
UEM Sunrise UEMS MK HOLD 0.71 12/17 209 215 219 4.6 4.7 4.8 15.5 15.0 14.7 4.0 3,222 1.52 0.5
Sector 2,838 2,307 2,607 11.7 14.6 12.9 7.0 33,366 0.8
REITs
Retail
CapitalMalls Malaysia Trust CMMT MK HOLD 1.20 12/17 158 157 161 7.7 7.7 7.9 15.5 15.6 15.2 6.0 2,449 1.28 0.9
IGB REIT IGBREIT MK BUY 1.66 12/17 295 306 319 8.4 8.7 9.0 19.8 19.1 18.4 9.3 5,851 1.06 1.6
Pavilion REIT PREIT MK HOLD 1.56 12/17 233 272 306 7.7 8.9 10.1 20.4 17.4 15.4 6.3 4,734 1.28 1.2
Office/Industrial
Axis REIT AXRB MK HOLD 1.45 12/17 91 111 120 7.4 9.0 9.7 19.6 16.1 14.9 8.2 1,787 1.31 1.1
KLCC Property KLCCSS MK HOLD 7.66 12/17 720 745 792 39.9 41.3 43.8 19.2 18.6 17.5 17.8 13,829 7.21 1.1
MRCB-Quill REIT MQREIT MK HOLD 1.12 12/17 88 87 89 8.2 8.2 8.3 13.6 13.7 13.5 5.1 1,200 1.26 0.9
Diversified
Sunway REIT SREIT MK HOLD 1.70 6/17 182 184 196 6.2 6.2 6.7 27.5 27.3 25.6 10.3 5,007 1.41 1.2
Note: If year end is before June, earnings are shown in the previous period. Source: Respective companies, Bloomberg, UOB Kay Hian

M a l a y s i a S t r a t e g y July 2018
107
Technology OVERWEIGHT
WHY WE ARE OVERWEIGHT
Valuation still cheap with 17% 3-year earnings CAGR. Sector leaders continuing to outperform global benchmark in sales growth.
2H18 earnings expected to grow hoh, benefitting from new smartphone cycle and weaker ringgit.
Companies undergoing rapid capacity expansion. OSAT companies and equipment makers more entrenched
in global supply chain.
WHAT TO WATCH OUT FOR IN 2H18
US-China trade talks. Smartphone supply chains’ orders and consumers’
reception to upcoming new smartphone launches. Progress of semicon MNCs’ (such as OSRAM and
Broadcom) expansion of operations in Malaysia.
Outlook
FIGURE 216: TECHNOLOGY SECTOR IN LINE WITH FBMKLCI YTD
65
75
85
95
105
115
Jan Feb Mar Apr May Jun Jul
Technology
FBMKLCI
End Dec 17=100
Source: Bloomberg, UOB Kay Hian
Sector in line with FMBKLCI ytd but outperforms post GE14. 1H18 was a volatile period for the technology sector’s outsourced semiconductor assembly and test (OSAT) companies and equipment makers. Falling 5.4% ytd, the technology sector (refers to stocks under our coverage) is largely in line with the FMBKLCI but outperforms the index after the 14th general election (GE14) held on 9 May. Essentially, post GE14, the technology sector has risen 11% vs the FBMKLCI’s 8% contraction. Starting the year with a peak on 8 January, the highest since 2017, the sector’s performance gradually tapered off and reached its lowest point on 4 April (dropping 7.0% on a single day). On 3 April, the US’ Trump administration announced its proposal to impose tariffs on 1,300 medical, transport-related and industrial technology products deemed to be violating the US’ intellectual property rights and amounting to $50b in value. The announcement triggered a massive selldown across the global market. Despite the still promising outlook, the sector’s sentiment continues to be affected by various factors, including the ongoing US-China trade talks, newsflow on the weaker orders for Apple’s supply chain and the pre- and post-election selloff and rally.
Maintain OVERWEIGHT on the sector. Despite the market noises, Malaysia’s leading OSAT companies and equipment makers are in expansion mode and on track to achieve solid growth over the next two years. In the current uncertain environment, we advise investors to be selective, focusing on solid companies with clear strategies that enable them to be more entrenched in the global supply chain. Our top pick is Inari Amertron (Inari) for OSAT players and we also like non-rated Vitrox Corporation (Vitrox) for equipment makers.
Volatile 1H18; sector outlook still promising but sentiment still affected by various factors, such as US-China trade talks
Maintain OVERWEIGHT and focus on sector leaders; Inari is our top pick but we also like non-rated Vitrox

M a l a y s i a S t r a t e g y July 2018
108
Sector outlook remains positive… After racking up all-time high sales in 2017, global semiconductor sales (excluding memory products) are expected to grow further at 6%/5% in 2018/19 (2017: 10%), according to World Semiconductor Trade Statistics (WSTS). Similarly, global semiconductor equipment sales are expected to see another record year in 2018, with estimated growth of 6% (2017: 37%). On the local front, the OSAT segment’s sales growth is estimated at 8%/10% for 2018/19, outperforming the global benchmark, despite the weakening US dollar (at least in 1H18) that is detrimental to the sector. Meanwhile, local equipment makers’ sales growth could come in at a decent 12%/18% in 2018/19 (2017: 53%).
…but focus on sector leaders. The sector was in an upcycle in 2017, essentially benefitting all industry players. Given the higher sales base in 2017 and stronger ringgit (despite the recent trend of a stronger US dollar, average RM/US$ is only at 4.03 ytd, vs 4.30 in 2017), sector leaders with proven track records and clear strategies for multiple-year growth could continue to see solid growth and high earnings quality, which will sustain their above-mean valuations. We deem that Inari and Vitrox meet these criteria. Inari is on track to secure more businesses (facial recognition, health sensor and mini-LED related) from OSRAM in 3Q-4Q18. In addition, Inari’s new plant under construction in Batu Kawan is set for the next phase of growth in 2019-20, with the new floor space possibly earmarked for OSRAM’s automobile-related products. We estimate Inari’s net profit CAGR at 29% for FY17-20, with potential upside from new businesses. Meanwhile, Vitrox, which has been facing capacity constraints in the past two years, will be ready to take more orders and reduce the lead time for delivery once it moves into its new plant, Campus 2.0, in end-Jul 18. Vitrox’s strong customer base, consistent new product introduction to increase its total addressable market and growing number of sales channel partners underpin earnings growth (net profit CAGR of 20% for 2017-20, according to consensus forecast).
FIGURE 217: MALAYSIA OSAT SALES GROWTH FIGURE 218: MALAYSIA OSAT NET PROFIT AND MARGIN
0
1,000
2,000
3,000
4,000
5,000
6,000
01 03 05 07 09 11 13 15 17 19F
-30
-20
-10
0
10
20
30Malay sia Semicon Sales (LHS)Malay sia y oy Grow th (RHS)
(RMm) (%)
0
100
200
300
400
500
600
700
800
900
01 03 05 07 09 11 13 15 17 19F
0
2
4
6
8
10
12
14
16Malay sia Semicon Net Income (LHS)Sector Margin (RHS)
(RMm) (%)
Source: Bloomberg, UOB Kay Hian Source: Bloomberg, UOB Kay Hian
FIGURE 219: MALAYSIA EQUIPMENT MAKER SALES GROWTH FIGURE 220: MALAYSIA EQUIPMENT MAKER NET PROFIT AND MARGIN
0
200
400
600
800
1000
1200
1400
04 05 06 07 08 09 10 11 12 13 14 15 16 17 18F19F
-40
-20
0
20
40
60
80
100
120Equipment Sales (LHS)Malay sia y oy Grow th (RHS)
(RMm) (%)
-50
0
50
100
150
200
250
300
350
04 05 06 07 08 09 10 11 12 13 14 15 16 17 18F 19F
-10
0
10
20
30Equipment Maker Net Income (LHS)Sector Margin (RHS)
(RMm) (%)
Note: Inclusion of Mi Equipment (listed on 20 Jun 2018) from 2018 onwards Source: Bloomberg, UOB Kay Hian
Source: Bloomberg, UOB Kay Hian
Malaysia’s technology sector sales growth to outperform global benchmark
Sector leaders with good track records and strategies for multiple-year growth boast higher earnings quality and above-mean valuations
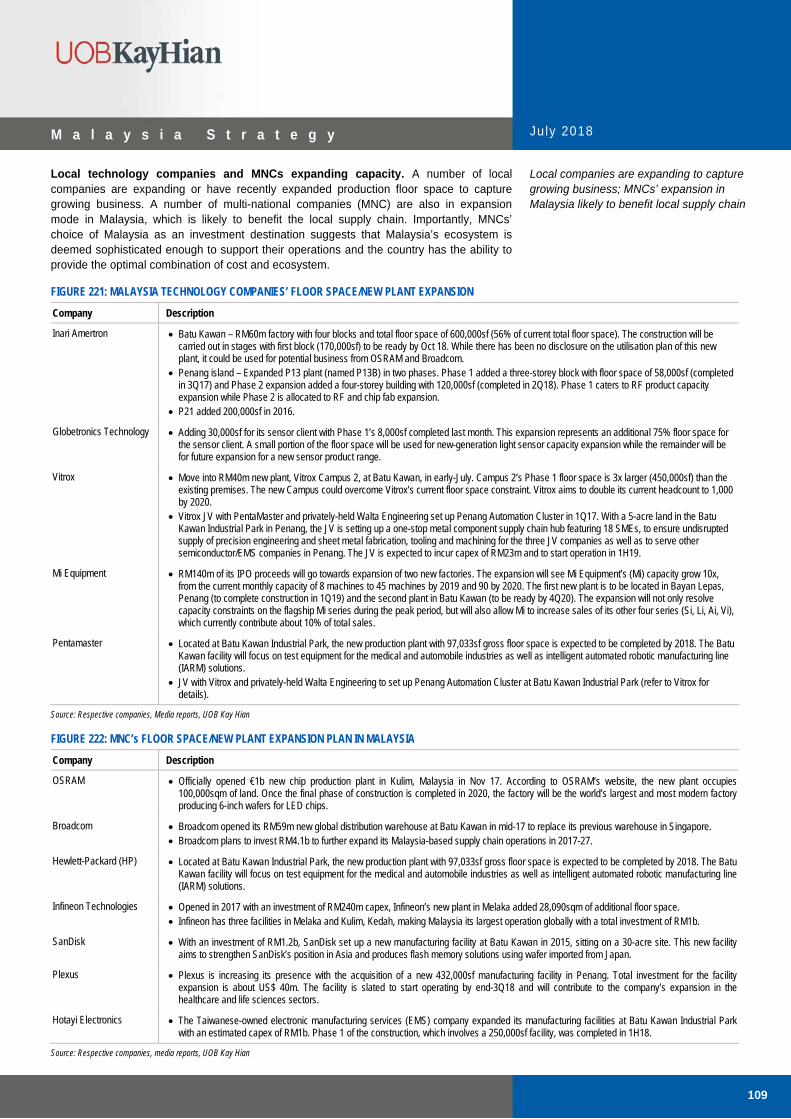
M a l a y s i a S t r a t e g y July 2018
109
Local technology companies and MNCs expanding capacity. A number of local companies are expanding or have recently expanded production floor space to capture growing business. A number of multi-national companies (MNC) are also in expansion mode in Malaysia, which is likely to benefit the local supply chain. Importantly, MNCs’ choice of Malaysia as an investment destination suggests that Malaysia’s ecosystem is deemed sophisticated enough to support their operations and the country has the ability to provide the optimal combination of cost and ecosystem.
FIGURE 221: MALAYSIA TECHNOLOGY COMPANIES’ FLOOR SPACE/NEW PLANT EXPANSION
Company Description
Inari Amertron Batu Kawan – RM60m factory with four blocks and total floor space of 600,000sf (56% of current total floor space). The construction will be carried out in stages with first block (170,000sf) to be ready by Oct 18. While there has been no disclosure on the utilisation plan of this new plant, it could be used for potential business from OSRAM and Broadcom.
Penang island – Expanded P13 plant (named P13B) in two phases. Phase 1 added a three-storey block with floor space of 58,000sf (completed in 3Q17) and Phase 2 expansion added a four-storey building with 120,000sf (completed in 2Q18). Phase 1 caters to RF product capacity expansion while Phase 2 is allocated to RF and chip fab expansion.
P21 added 200,000sf in 2016.
Globetronics Technology Adding 30,000sf for its sensor client with Phase 1’s 8,000sf completed last month. This expansion represents an additional 75% floor space for the sensor client. A small portion of the floor space will be used for new-generation light sensor capacity expansion while the remainder will be for future expansion for a new sensor product range.
Vitrox Move into RM40m new plant, Vitrox Campus 2, at Batu Kawan, in early-July. Campus 2’s Phase 1 floor space is 3x larger (450,000sf) than the existing premises. The new Campus could overcome Vitrox’s current floor space constraint. Vitrox aims to double its current headcount to 1,000 by 2020.
Vitrox JV with PentaMaster and privately-held Walta Engineering set up Penang Automation Cluster in 1Q17. With a 5-acre land in the Batu Kawan Industrial Park in Penang, the JV is setting up a one-stop metal component supply chain hub featuring 18 SMEs, to ensure undisrupted supply of precision engineering and sheet metal fabrication, tooling and machining for the three JV companies as well as to serve other semiconductor/EMS companies in Penang. The JV is expected to incur capex of RM23m and to start operation in 1H19.
Mi Equipment RM140m of its IPO proceeds will go towards expansion of two new factories. The expansion will see Mi Equipment’s (Mi) capacity grow 10x, from the current monthly capacity of 8 machines to 45 machines by 2019 and 90 by 2020. The first new plant is to be located in Bayan Lepas, Penang (to complete construction in 1Q19) and the second plant in Batu Kawan (to be ready by 4Q20). The expansion will not only resolve capacity constraints on the flagship Mi series during the peak period, but will also allow Mi to increase sales of its other four series (Si, Li, Ai, Vi), which currently contribute about 10% of total sales.
Pentamaster Located at Batu Kawan Industrial Park, the new production plant with 97,033sf gross floor space is expected to be completed by 2018. The Batu Kawan facility will focus on test equipment for the medical and automobile industries as well as intelligent automated robotic manufacturing line (IARM) solutions.
JV with Vitrox and privately-held Walta Engineering to set up Penang Automation Cluster at Batu Kawan Industrial Park (refer to Vitrox for details).
Source: Respective companies, Media reports, UOB Kay Hian
FIGURE 222: MNC’s FLOOR SPACE/NEW PLANT EXPANSION PLAN IN MALAYSIA
Company Description
OSRAM Officially opened €1b new chip production plant in Kulim, Malaysia in Nov 17. According to OSRAM’s website, the new plant occupies 100,000sqm of land. Once the final phase of construction is completed in 2020, the factory will be the world’s largest and most modern factory producing 6-inch wafers for LED chips.
Broadcom Broadcom opened its RM59m new global distribution warehouse at Batu Kawan in mid-17 to replace its previous warehouse in Singapore. Broadcom plans to invest RM4.1b to further expand its Malaysia-based supply chain operations in 2017-27.
Hewlett-Packard (HP) Located at Batu Kawan Industrial Park, the new production plant with 97,033sf gross floor space is expected to be completed by 2018. The Batu Kawan facility will focus on test equipment for the medical and automobile industries as well as intelligent automated robotic manufacturing line (IARM) solutions.
Infineon Technologies Opened in 2017 with an investment of RM240m capex, Infineon’s new plant in Melaka added 28,090sqm of additional floor space. Infineon has three facilities in Melaka and Kulim, Kedah, making Malaysia its largest operation globally with a total investment of RM1b.
SanDisk With an investment of RM1.2b, SanDisk set up a new manufacturing facility at Batu Kawan in 2015, sitting on a 30-acre site. This new facility aims to strengthen SanDisk’s position in Asia and produces flash memory solutions using wafer imported from Japan.
Plexus Plexus is increasing its presence with the acquisition of a new 432,000sf manufacturing facility in Penang. Total investment for the facility expansion is about US$ 40m. The facility is slated to start operating by end-3Q18 and will contribute to the company’s expansion in the healthcare and life sciences sectors.
Hotayi Electronics The Taiwanese-owned electronic manufacturing services (EMS) company expanded its manufacturing facilities at Batu Kawan Industrial Park with an estimated capex of RM1b. Phase 1 of the construction, which involves a 250,000sf facility, was completed in 1H18.
Source: Respective companies, media reports, UOB Kay Hian
Local companies are expanding to capture growing business; MNCs’ expansion in Malaysia likely to benefit local supply chain

M a l a y s i a S t r a t e g y July 2018
110
Sector’s sales still depend on mobile devices end segment but diversification is on the way. Malaysia’s technology companies still depend heavily on the mobile devices end segment. Some of them, such as Inari, Globetronics Technology (Globetronics), Mi Equipment and MMS Ventures, derive at least 50% of their total revenue from mobile devices-related businesses. While worldwide smartphone shipment (in units) is tepid (-0.3%/-0.2%/3.0% for 2017A/18F/19F, according to IDC), Malaysia’s smartphone-related players are not badly affected due to their growing content value per smartphone. Despite the weaker 1H18, earnings are expected to improve in 2H18 on production ramp-up in preparation for new smartphone launches. However, as the smartphone market is entering the mature phase, most local companies are diversifying their businesses, especially into automobile-related products.
Earnings to improve hoh in 2H18. The sector experienced a soft 1H18, dampened by a combination of a weak US dollar, consumers’ lukewarm interest in a US premium smartphone brand’s new models and a shortage of wafer which affected production at some companies. Sector earnings are expected to improve in 2H18, in view of a stronger greenback and the industry’s ramp-up of production to support the new smartphone cycle. A few companies such as Inari and Globetronics will also see small-scale mass production of new products, but their earnings contributions will only be prominent in 2019.
Rising trade tensions weigh on sector sentiment… The US-China trade tension is intensifying, with President Trump threatening to impose tariffs on a further $200b worth of Chinese goods (on top of tariffs on US$50b goods which started to take effect on 6 July). Like the global technology market, the local sector’s performance has been bumpy since early April. However, it can be observed that Malaysia’s technology sector is getting less sensitive to the trade war newsflow, even as the tension between the two major world powers exacerbates.
FIGURE 223: KLCI TECHNOLOGY INDEX PERFORMANCE AND TRADE WAR CHRONOLOGY
KLCI Technology Index
26
28
30
32
34
36
38
40
1 Mar 18 1 Apr 18 1 May 18 1 Jun 18
(points)
US proposed tariff on US$50b worh of China products & China propose the same quantum tariff
Presidente Xi showed willingness to negotiate on trade issues. &Trump responded positively
Trumps said to propose25% tariff on certainproduct supported byChina's "unfair industrial policy"
Declared trade war "on hold" after two rounds of negotiations
US said to proceed with 25% tariff on US$50b Chinese imports
China warned it would not honor its pledge to expand US goods purchases if tariff imposde
US announced 25% tariff on US$34b goods import from China & China retaliate with same amount of US imports
Source: White House, US Trade Representative office, China Ministry of Commerce, media reports, Bloomberg, UOB Kay Hian
Most local companies diversifying their businesses, especially into automobile-related products
Sector earnings to grow on stronger US$ and ramp-up in production of new smartphones
Sector’s sentiment affected by US-China trade tension but getting less sensitive to the newsflow

M a l a y s i a S t r a t e g y July 2018
111
…but there is no direct impact or potential long-term benefit. We opine that Malaysia’s technology sector will not be impacted directly by the two countries’ tariff battle (based on the developments thus far) as none of the companies has high exposure to the four scenarios below. In fact, should the tension between the two world powers persist or worsen, Malaysia’s technology sector could benefit as US-headquartered MNCs with operations in China may relocate their production facilities to Malaysia in a bid to avoid geopolitical risk.
Malaysian products that are exported to China with the end destination being the US and are categorised as tariff-eligible goods by the US;
Malaysian products that are exported to the US with the end destination being China and the products are categorised as tariff-eligible goods by China;
Malaysian companies’ China operations export their products to the US and the said products are on the US government’s tariff list; and
Malaysian companies’ US operations export their products to China and the said products are on the China government’s tariff list.
Potential indirect impact could be underlying threat to sector. If the relationship between the US and China exacerbates (for example, Chinese consumers boycott US products), US companies with significant China exposure will be impacted. Under our coverage, Inari’s radio frequency (RF) products and Globetronics’ sensor products will be indirectly impacted as the US’ sole smartphone company, which derived 20% of its total 2017 revenue from China, is their end-client. Assuming this end-client’s sales in China drop 50%, Inari’s and Globetronics’ earnings would decline 5-6% and 7-8% respectively.
Minimum wage hike would not have a prominent impact on the sector. The new Pakatan Harapan government in its election manifestos has pledged to increase the monthly minimum wage to RM1,500 (from the current RM1,000 for Peninsular Malaysia) in its first term in office. The government will bear RM250 and the other RM250 will be borne by employers. Human Resources minister M Kulasegaran recently said the new minimum wage for the private sector is undergoing a review, and if it is approved, it will be announced by the government in August latest. Overall, we opine the minimum wage hike will not have a significant impact on the technology sector as the RM250 increment is likely to be implemented gradually in five years’ time as the new government needs to consider the country's fiscal condition.
Kulasegaran recently mentioned that the government will be cautious in implementing the minimum wage policy to ensure that it does not have a negative impact on businesses. He added the quantum of adjustment will take into account many factors such as productivity, sustainability of the new rate and ways to create a win-win situation for all stakeholders. In any case, only OSAT companies will be impacted by the minimum wage hike policy. We estimate every RM100 hike will reduce Inari’s and Globetronics’ FY19 earnings by 0.5-1.0%.
RM/US$ movement in sector’s favour again. Although the technology sector’s business is growing and quarterly revenue in US$ terms has been rising yoy since 1Q17, the strengthening ringgit is to the disadvantage of the sector, resulting in margin compression. RM/US$ reached a high of 4.50 in early Jan-17 but was on a downtrend to a low of 3.86 in end-Mar 18. However, post GE14 on 9 May, the forex movement saw a trend reversal – after it touched RM4.05/US$ on 9 May, it strengthened slightly to below RM4.00/US$ but broke RM4.00 again on 19 June. The strengthening of the US dollar suggests that the margin of the sector could expand in 2H18. We treat this forex advantage as just a sweetener for the sector as growing the underlying fundamentals is still key to long-term growth.
US-Sino trade tension may benefit Malaysia as US MNCs operating in China may relocate to avoid geopolitical risk… … but Chinese consumers could boycott US products, posing an indirect threat to Malaysia
Minimum wage hike promise likely to be fulfilled gradually in five years’ time to minimise impact on businesses and government’s fiscal health Sector margin could expand in 2H18 on stronger US$
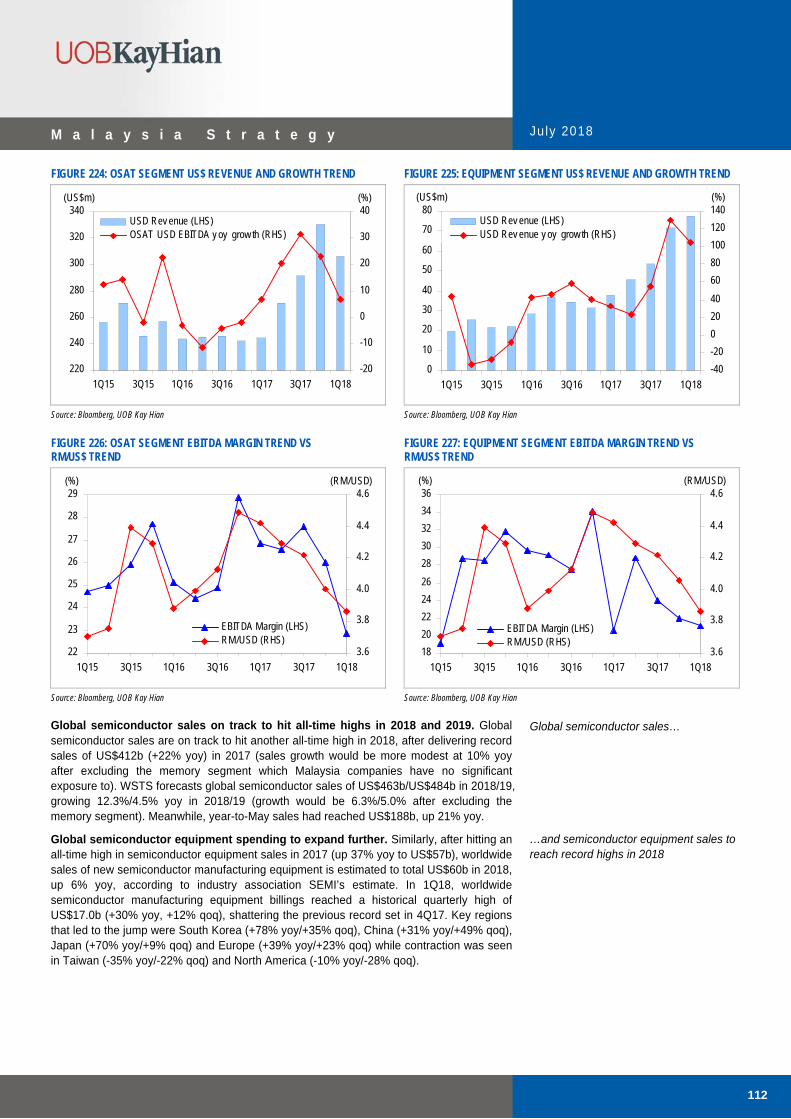
M a l a y s i a S t r a t e g y July 2018
112
FIGURE 224: OSAT SEGMENT US$ REVENUE AND GROWTH TREND FIGURE 225: EQUIPMENT SEGMENT US$ REVENUE AND GROWTH TREND
220
240
260
280
300
320
340
1Q15 3Q15 1Q16 3Q16 1Q17 3Q17 1Q18
-20
-10
0
10
20
30
40USD Rev enue (LHS)OSAT USD EBITDA y oy grow th (RHS)
(US$m) (%)
0
10
20
30
40
50
60
70
80
1Q15 3Q15 1Q16 3Q16 1Q17 3Q17 1Q18
-40
-20
0
20
40
60
80
100
120
140USD Rev enue (LHS)USD Rev enue y oy grow th (RHS)
(US$m) (%)
Source: Bloomberg, UOB Kay Hian Source: Bloomberg, UOB Kay Hian
FIGURE 226: OSAT SEGMENT EBITDA MARGIN TREND VS RM/US$ TREND
FIGURE 227: EQUIPMENT SEGMENT EBITDA MARGIN TREND VS RM/US$ TREND
22
23
24
25
26
27
28
29
1Q15 3Q15 1Q16 3Q16 1Q17 3Q17 1Q18
3.6
3.8
4.0
4.2
4.4
4.6
EBITDA Margin (LHS)RM/USD (RHS)
(%) (RM/USD)
18
20
22
24
26
28
30
32
34
36
1Q15 3Q15 1Q16 3Q16 1Q17 3Q17 1Q18
3.6
3.8
4.0
4.2
4.4
4.6
EBITDA Margin (LHS)RM/USD (RHS)
(%) (RM/USD)
Source: Bloomberg, UOB Kay Hian Source: Bloomberg, UOB Kay Hian
Global semiconductor sales on track to hit all-time highs in 2018 and 2019. Global semiconductor sales are on track to hit another all-time high in 2018, after delivering record sales of US$412b (+22% yoy) in 2017 (sales growth would be more modest at 10% yoy after excluding the memory segment which Malaysia companies have no significant exposure to). WSTS forecasts global semiconductor sales of US$463b/US$484b in 2018/19, growing 12.3%/4.5% yoy in 2018/19 (growth would be 6.3%/5.0% after excluding the memory segment). Meanwhile, year-to-May sales had reached US$188b, up 21% yoy.
Global semiconductor equipment spending to expand further. Similarly, after hitting an all-time high in semiconductor equipment sales in 2017 (up 37% yoy to US$57b), worldwide sales of new semiconductor manufacturing equipment is estimated to total US$60b in 2018, up 6% yoy, according to industry association SEMI’s estimate. In 1Q18, worldwide semiconductor manufacturing equipment billings reached a historical quarterly high of US$17.0b (+30% yoy, +12% qoq), shattering the previous record set in 4Q17. Key regions that led to the jump were South Korea (+78% yoy/+35% qoq), China (+31% yoy/+49% qoq), Japan (+70% yoy/+9% qoq) and Europe (+39% yoy/+23% qoq) while contraction was seen in Taiwan (-35% yoy/-22% qoq) and North America (-10% yoy/-28% qoq).
Global semiconductor sales…
…and semiconductor equipment sales to reach record highs in 2018

M a l a y s i a S t r a t e g y July 2018
113
Expecting less cyclicality in semiconductor industry in era of IoT and AI. The semiconductor industry is expected to be less cyclical than previously, with the emergence of Internet of Things (IoT) and artificial intelligence (AI) that have managed to change almost every aspect of human life. Boundaries between industries are being eroded by the commonisation of fundamental technologies – rising semiconductor content/value in various industrial and consumer electronics products (including automobile) and the rise of data flow as the common lifeblood of the global economy. Hence, semiconductor demand is expected to be on a “step-up” basis rather than a “super-cycle”.
FIGURE 228: GLOBAL SEMICONDUCTOR SALES AND GROWTH FIGURE 229: GLOBAL EQUIPMENT MAKERS SALES AND GROWTH
100
150
200
250
300
350
400
450
500
01 03 05 07 09 11 13 15 17 19F
-40
-30
-20
-10
0
10
20
30
40Global Semicon Sales (LHS)Global y oy Grow th (RHS)
(US$b) (%)
0
10
20
30
40
50
60
70
04 05 06 07 08 09 10 11 12 13 14 15 16 17 18F
-50
0
50
100
150
200Global Equipment Sales (LHS)y oy Grow th (RHS)
(US$b) (%)
Source: WSTS Source: SEMI
Emergence of IoT and AI expected to boost demand for semiconductor on a “step-up” basis
M a l a y s i a S t r a t e g y July 2018
114
Strategy
Maintain OVERWEIGHT on the sector. Despite the market noises, Malaysia’s leading OSAT players and equipment makers are in expansion mode and on track for solid growth over the next two years. Both the OSAT and equipment segments are still trading at the high end of their valuation ranges, despite tapering off recently. Our OVERWEIGHT call on the sector focuses on sector leaders with economies of scale, clear strategies for multiple-year growth and high earnings quality, which enable them to sustain their current above-mean valuations. Our top pick is Inari for OSAT players. We also like vision system inspection manufacturer Vitrox for equipment makers.
Inari Amertron (INRI /BUY/RM2.25/Target: RM2.68). Maintain BUY with unchanged target price of RM2.68, pegged to 22x 2019F PE. We like Inari’s strong revenue prospects (CAGR of 21% in FY17-20) and high earnings quality, with potential upside from new contracts. OSRAM’s sales contribution to Inari is expected to soar in the next three years, given the various projects lined up in the near term. Moreover, there is a possibility Inari’s new plant under construction (first block to be ready in Oct 18) in Batu Kawan is earmarked for OSRAM’s automobile-related products. Meanwhile, we still expect Inari to see solid sales growth from Broadcom, which includes the bread-and-butter RF segment (due to the commercialisation of 5G networks) and potential new jobs.
Vitrox Corporation (VITRO /Not Rated/RM5.56/Target: n.a.). Vitrox has moved into its new plant (floor space 3x larger than existing premises) early this month, which will solve its floor space constraint problem. Despite a strong five-year net profit CAGR of 31% in 2012-17, earnings growth could be sustained on capacity scale-up, a more favourable product mix (demand for advanced 3D inspection systems is on the uptrend due to miniaturisation of semiconductor components and more sophisticated PCBA) and introduction of inspection systems for new segments (such as precision mechanical parts) to increase its total addressable market. By moving into the new plant, Vitrox aims to double its current headcount of 500 to 1,000 by 2020. We note that 2017’s headcount was double 2012’s but sales and net profit grew much stronger at 269% and 282%. Vitrox currently trades at 22.1x 2019F PE and 18.4x 2020F PE with consensus forecast of three-year net profit CAGR of 20% in 2017-20, or 73% net profit growth from 2017 to 2020. Given the scale at which Vitrox is ramping up, consistent new product introduction to the market and the mega trends in the semiconductor sector, there could be upside to consensus’ earnings forecasts which implies PEG ratio of <1x, suggesting undemanding valuation.
Globetronics Technology (GTB /BUY/RM2.24/Target: RM2.52). Maintain BUY and target price of RM2.52, pegged to 15.5x 2019F PE. After an earnings hiccup in 1H18, Globetronics is on track for a much stronger 2H18, led by the recovery in light sensor monthly production volume (30m/40m in Jul/Aug 18 vs 15m/15m/4m in Mar/Apr/May 18) and gradual increase in gesture sensor production volume. Early indications suggest that monthly production volume could maintain at 40m units in Sep-Oct 18. Moreover, mass production of laser headlamps (for one car model) is poised to start in Oct 18 after more than two years’ stringent qualification process. Laser headlamps could be a catalyst in 2019 once volume ramps up and also pave the way for Globetronics to seek growth beyond mobile device-related products.
Top pick: Inari; we also like non-rated Vitrox
Upbeat on Inari’s long-term outlook with potential earnings upside in FY20
Vitrox set to enter another growth phase after moving into new Campus
Globetronics’ earnings set to rise hoh in 2H18 but valuation expansion could be curbed by reliance on single customer and volatile earnings trend

M a l a y s i a S t r a t e g y July 2018
115
FIGURE 230: PEER COMPARISON PE EV/EBITDA
FY17 FY18F FY19F FY18F FY19F Stock Ticker Rec
Share Price 5 Jul 18
(RM)
Target Price (RM)
Market Cap
(US$m) (x) (x) (x) (x) (%)
Div Yield
FY18F (%)
P/B FY18F
(x)
Net Gearing
(%)
3-year Net Profit
CAGR FY17-20F
(%)
OSAT
Inari Amertron* INRI MK BUY 2.25 2.68 1,747 28.3 20.5 16.8 13.8 11.5 3.3 6.7 (47.3) 29.0
Globetronics Technology GTB MK BUY 2.24 2.52 363 28.3 17.4 13.5 9.7 8.3 4.6 4.9 (23.1) 30.8
KESM Industries KESM MK NOT RATED 16.58 n.a. 174 16.0 17.1 13.8 5.0 4.5 0.8 1.9 (20.1) 11.7
Malaysian Pacific Industries* MPI MK NOT RATED 9.82 n.a. 482 13.6 12.4 10.8 4.1 3.9 3.2 1.6 (33.4) (0.8)
Unisem UNI MK NOT RATED 2.55 n.a. 446 11.3 17.3 13.9 5.4 4.9 4.2 1.2 (9.8) (3.5)
Average 19.5 16.9 13.8 7.6 6.6 3.2 3.3 EQUIPMENT MAKER
ViTrox Corporation VITRO MK NOT RATED 5.56 n.a. 649 31.6 27.9 22.1 23.7 19.1 0.9 6.4 (27.9) 20.2
Mi Equipment MI MK NOT RATED 1.85 n.a. 233 15.9 n.a. n.a. n.a. n.a. n.a. n.a. (35.1) n.a.
Elsoft Research ELSR MK NOT RATED 2.65 n.a. 178 24.1 20.0 17.3 17.8 15.6 3.5 n.a. (50.3) 13.1
MMS Ventures MMSV MK NOT RATED 1.34 n.a. 53 10.2 12.2 8.9 10.5 7.9 3.0 n.a. (49.5) 7.6
Aemulus AMLS MK NOT RATED 0.40 n.a. 56 30.1 23.1 23.1 22.8 19.6 n.a. 2.8 (29.4) 16.7
Pentamaster PENT MK NOT RATED 2.39 n.a. 189 21.3 n.a. n.a. n.a. n.a. n.a. n.a. (38.9) n.a.
VisDynamics VHB MK NOT RATED 0.54 n.a. 23 13.6 n.a. n.a. n.a. n.a. n.a. n.a. (21.0) n.a.
Average 21.0 20.8 17.9 18.7 15.6 2.5 4.6
* FY17/18F/19F represent FY18F/FY19F/FY20F respectively Source: Bloomberg, UOB Kay Hian
Yeoh Bit Kun +603 2147 1988

M a l a y s i a S t r a t e g y July 2018
116
Sector At A Glance
FIGURE 231: OSAT FORWARD PE FIGURE 232: EQUIPMENT COMPANIES FORWARD PE
68
1012141618202224
Jun 13 Jun 14 Jun 15 Jun 16 Jun 17 Jun 18
(x )
2SD
1SD
Mean
-1SD
-2SD
0
5
10
15
20
25
30
Jun 13 Jun 14 Jun 15 Jun 16 Jun 17 Jun 18
(x )
2SD
1SD
Mean
-1SD
-2SD
`
Source: UOB Kay Hian Source: UOB Kay Hian
FIGURE 233: KEY TRENDS AND POTENTIAL BENEFICIARIES FIGURE 234: SECTOR AND COMPANY GROWTH
OSAT Equipment Maker
(%) 2017 2018F 2017 2018F
Sector Sales Growth 12 8 53 12 Sector Profit Growth 13 7 35 9
OSAT Equipment Maker Co. Net Profit Growth (%) 2017 2018F
Co. Net Profit Growth (%) 2017 2018F
Globetronics Technology 115 66 Elsoft Research (4) 21 Inari Amertron^ 28 33 MMS Ventures 121 (15) MPI^ (5) (9) Aemulus n.m. 6 Unisem (2) (34) ViTrox Corp 28 15 KESM 19 7 Pentamaster 35 n.a.
VisDynamics 6 n.a. Mi Equipment 269 n.a.
Source: UOB Kay Hian ^ Calendar year earnings growth. Source: Bloomberg, UOB Kay Hian
FIGURE 235: MALAYSIA OSAT SALES GROWTH IFIGURE 236: MALAYSIA EQUIPMENT MAKER SALES GROWTH
0
1000
2000
3000
4000
5000
6000
01 03 05 07 09 11 13 15 17 19F
-40
-20
0
20
40Malaly sia Semicon Sales (LHS)Malay sia y oy grow th (RHS)
(RMm) (%)
0
200
400
600
800
1000
1200
1400
04 05 06 07 08 09 10 11 12 13 14 15 16 17 18F19F
-50
0
50
100
150Equipment sales (LHS)Malay sia y oy grow th (RHS)
(RMm) (%)
Source: Bloomberg, UOB Kay Hian Note: Inclusion of Mi Equipment (listed on 20 Jun 2018) from 2018 onwards
oSource: Bloomberg, UOB Kay Hian
FIGURE 237: SECTOR STATISTICS
Share Price Last Net Profit EPS PE Market BV Price/
Company Ticker Rec 5 Jul 18 Year 2017 2018F 2019F 2017 2018F 2019F 2017 2018F 2019F ROE Cap ps BV ps (RM) End (RMm) (RMm) (RMm) (sen) (sen) (sen) (x) (x) (x) (%) (RMm) (RM) (x)
Globetronics Technology GTB MK BUY 2.24 12/17 51 85 109 7.7 12.7 16.3 29.1 17.7 13.7 18.8 1,494 0.98 2.3
Inari Amertron INRI MK BUY 2.25 6/17 200 254 351 6.4 8.1 11.2 35.4 27.8 20.1 29.2 7,067 0.49 4.6
Sector 251 339 460 34.1 25.2 18.6 26.5 8,561 4.1
Source: Respective companies, Bloomberg, UOB Kay Hian
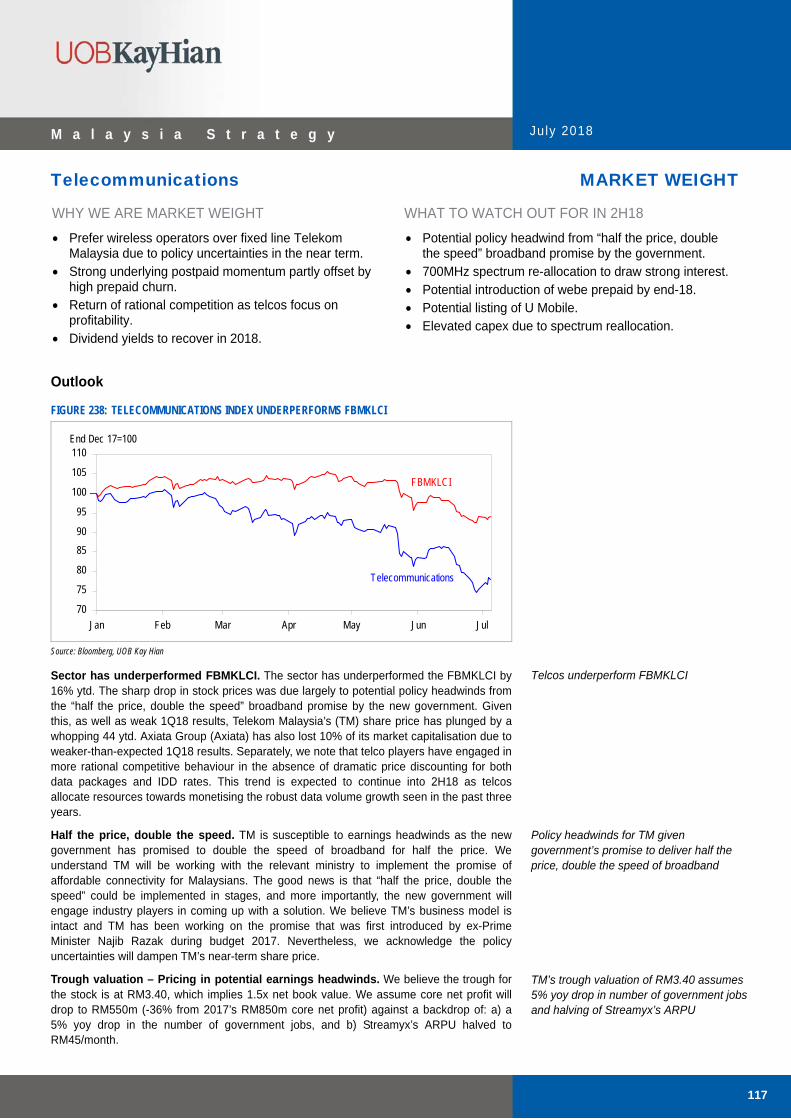
M a l a y s i a S t r a t e g y July 2018
117
Telecommunications MARKET WEIGHT
WHY WE ARE MARKET WEIGHT
Prefer wireless operators over fixed line Telekom Malaysia due to policy uncertainties in the near term.
Strong underlying postpaid momentum partly offset by high prepaid churn.
Return of rational competition as telcos focus on profitability.
Dividend yields to recover in 2018.
WHAT TO WATCH OUT FOR IN 2H18
Potential policy headwind from “half the price, double the speed” broadband promise by the government.
700MHz spectrum re-allocation to draw strong interest. Potential introduction of webe prepaid by end-18. Potential listing of U Mobile. Elevated capex due to spectrum reallocation.
Outlook
FIGURE 238: TELECOMMUNICATIONS INDEX UNDERPERFORMS FBMKLCI
70
75
80
85
90
95
100
105
110
Jan Feb Mar Apr May Jun Jul
Telecommunications
FBMKLCI
End Dec 17=100
Source: Bloomberg, UOB Kay Hian
Sector has underperformed FBMKLCI. The sector has underperformed the FBMKLCI by 16% ytd. The sharp drop in stock prices was due largely to potential policy headwinds from the “half the price, double the speed” broadband promise by the new government. Given this, as well as weak 1Q18 results, Telekom Malaysia’s (TM) share price has plunged by a whopping 44 ytd. Axiata Group (Axiata) has also lost 10% of its market capitalisation due to weaker-than-expected 1Q18 results. Separately, we note that telco players have engaged in more rational competitive behaviour in the absence of dramatic price discounting for both data packages and IDD rates. This trend is expected to continue into 2H18 as telcos allocate resources towards monetising the robust data volume growth seen in the past three years.
Half the price, double the speed. TM is susceptible to earnings headwinds as the new government has promised to double the speed of broadband for half the price. We understand TM will be working with the relevant ministry to implement the promise of affordable connectivity for Malaysians. The good news is that “half the price, double the speed” could be implemented in stages, and more importantly, the new government will engage industry players in coming up with a solution. We believe TM’s business model is intact and TM has been working on the promise that was first introduced by ex-Prime Minister Najib Razak during budget 2017. Nevertheless, we acknowledge the policy uncertainties will dampen TM’s near-term share price.
Trough valuation – Pricing in potential earnings headwinds. We believe the trough for the stock is at RM3.40, which implies 1.5x net book value. We assume core net profit will drop to RM550m (-36% from 2017’s RM850m core net profit) against a backdrop of: a) a 5% yoy drop in the number of government jobs, and b) Streamyx’s ARPU halved to RM45/month.
Telcos underperform FBMKLCI
Policy headwinds for TM given government’s promise to deliver half the price, double the speed of broadband
TM’s trough valuation of RM3.40 assumes 5% yoy drop in number of government jobs and halving of Streamyx’s ARPU

M a l a y s i a S t r a t e g y July 2018
118
Key trends for 2H18 include: a) 1% service revenue growth for 2018 vs declines of 1.5% and 1.6% for 2016 and 2017 respectively, b) focus on cost structure to maintain EBITDA, and c) elevated capex due to spectrum-related upfront cost for 700MHz.
Flattish EBITDA trend for Big 3 telcos. Broadly, we expect 2018 service revenue for the Big 3 telcos Digi.com (Digi), Maxis and Celcom Axiata (Celcom) to grow 1% vs declines of 1.5% and 1.6% for 2016 and 2017 respectively. This is driven largely by higher smartphone penetration rates (aided by a plethora of affordable mass market devices) and the underlying strength of the postpaid market. Postpaid service revenue rose 6% yoy in 1Q18 on the back of stable ARPUs and 154,000 net adds vs 4Q17. We also expect competitive pressure in the IDD segment to abate as telcos focus on growing service revenue in the Malaysian prepaid segment. Telco players will likely focus on cost optimisation to maintain a pedestrian EBITDA trend for 2018. That said, we project a 2% yoy decline in the Big 3’s net profit as capex is likely to stay elevated due to spectrum-related upfront cost for 700MHz.
Sector earnings pulled down by TM’s weaker-than-expected earnings cycle. We project a sharp 8% decline in sector earnings for 2018 vs 2017’s flattish earnings trend. This is due to: a) higher depreciation and finance cost dragging down the Big 3 telcos’ earnings, and importantly, b) fewer government jobs to be awarded to TM in 2018. All in all, we project sector net profit of RM5.3b for 2018 (25.4x 2018F PE).
Cost optimisation across Big 3 telcos. Overall, Digi aims to have achieved a 1-3ppt cost reduction over 2017-18 while Axiata aims to see RM2.3b cost savings in 2017-19. We believe these will have a positive spillover effect into 2018 as we expect the Big 3 telcos to maintain EBITDA of RM10b for 2018.
Return of rational competition. Malaysia had a rational four-player telco market right up to 2016 when U Mobile started to become more aggressive with unlimited data plans while TM’s webe entered as a fifth mobile player. Irrational competition has abated in the past 12 months as players are back to focusing on quality subscribers and sustaining EBITDA (vs growing service revenue at the expense of high subscriber acquisition cost). We also note abating competitive pressure within the IDD migrant segment as Digi has shifted its focus to growing the Malaysian postpaid segment. Additionally, U Mobile and webe appear to be focusing on rolling out networks with stable and competitive product offerings.
Service revenue to grow 1% on higher smartphone penetration rates. We expect higher service revenue in 2H18 to be driven by a rise in smartphone penetration rates (to drive postpaid revenue) and lower prepaid churn (as most of the illegal immigrant crackdown’s impact was felt in 2017). Anecdotally, Maxis saw a 60% yoy rise in data usage in 1Q18 as smartphone penetration reached 86%. To recap, 1H18 service revenue fell 1% yoy to RM5b (Big 3 telcos). This reflects an 8% yoy drop in 1H18 prepaid service revenue on the back of: a) soft IDD revenue, and b) prepaid-to-postpaid conversion as Digi focuses on growing the low- to mid-income postpaid market (ARPU: RM30-50/month). Postpaid service revenue grew 6% yoy as telco players continued to monetise data volume growth.
FIGURE 239: DIGI SMARTPHONE PENETRATION RATE FIGURE 240: MAXIS SMARTPHONE PENETRATION RATE
600
650
700
750
800
850
900
3Q16 4Q16 1Q17 2Q17 3Q17 4Q17 1Q18
60
65
70
75Data Rev enue (LHS)% Smartphone Subscribers (RHS)
(RMm) (%)
3
4
5
6
7
8
9
10
11
3Q16 4Q16 1Q17 2Q17 3Q17 4Q17 1Q18
80
81
82
83
84
85
86
87Data Usage (LHS)% Smartphone Subscribers (RHS)
(GB/mth) (%)
Source: Digi Source: Maxis
Key 2H18 trends: a) driving profitability via good cost discipline, and b) maintaining high capex as telcos increase coverage footprint
We project 2018 sector earnings of RM5.3b, a contraction of 8% vs flat 2017
Focus on preserving EBITDA via cost optimisation efforts

M a l a y s i a S t r a t e g y July 2018
119
Near-term capex remains elevated. We expect capex-to-revenue intensity to remain high as telcos rapidly expand their 4G long-term evolution (LTE) network coverage. 4G LTE leadership is seen as a differentiator for telcos and may help strengthen customer stickiness, especially within the postpaid segment. Also, we expect Maxis, Celcom and Digi to actively share both tower and backhaul fibre infrastructure assets. This will allow the industry to have more efficient use of capex, lowering telcos’ capex spend, improve free cash flow generation ability and consequently provide for sustainable return on investor (ROIC).
700MHz spectrum to be re-allocated this year. The Malaysian Communications and Multimedia Commission (MCMC) announced that it is opening up spectrum blocks for the 700MHz spectrum by way of tender which will be carried out through a beauty contest. The 700MHz spectrum block will be used as coverage band for the deployment of high-speed mobile broadband services using LTE technology. The application will be open from 31 Oct 17 until 2 Jan 18. The MCMC has set the spectrum limit at four spectrum blocks per applicant. Each spectrum block is 2x5MHz.
Potentially more spectrum to be reallocated in 2018-19. The MCMC may also bring forward the reallocation of 2300MHz and 2600MHz spectrum bands. This reallocation exercise is viewed positively as it will help telcos meet customers’ growing data demand.
Fee structure surprisingly lower than for 900MHz spectrum. The regulator said the cost of a 2x5MHz block in the 700MHz band is RM215.54m, based on a lump-sum payment, whereas an instalment payment of up to 15 years would almost double the cost to RM417.12m. The annual fee for each 2x5MHz spectrum block would be RM18.54m with a 15-year time frame for usage of airwaves.
FIGURE 241: SPECTRUM FEE COMPARISON
Upfront Fee (RMm)
2 x 5MHz block of the 700MHz 215.54
2 x 5MHz block of the 900MHz 499.72
2 x 5MHz block of the 1800MHz 217.77
Source: MCMC
Expect many interested bidders. Broadly, this long-awaited 700MHz band will be a boon to industry players as it will offer a wider reach and better indoor penetration. We expect Digi, Maxis, Celcom, Telekom, U Mobile and YES Communications (under YTL Power International) to submit their marketing proposals to the regulator.
We are neutral as telco players have raised funds to undertake the spectrum allocation. The timing of the above announcement is welcomed by the industry. More pertinently, the beauty contest is predicated on telcos’ ability to utilise the spectrum effectively as opposed to bidding for the spectrum itself (monetary beauty contest). The cost of the spectrum is fixed at RM215.5m for a 2x5MHz. Recall that Digi and Maxis had raised funds in the past few months via sukuk and private placement respectively. This will provide the financial muscles to undertake the above spectrum allocation.
FIGURE 242: SPECTRUM FEE STRUCTURE FOR 900MHZ AND 1,800MHZ OFFERED BY MCMCM AS AT 30 AUG 16
Actual Upfront Fee (Offered by MCMC) Annual Spectrum Maintenance Fee Telco (RMm) (RMm) Tenure of Spectrum Assignment
Celcom 816.75 70.25 1 Jul 17 (15 years)
Maxis 816.75 70.25 1 Jul 17 (15 years)
Digi 598.55 51.48 1 Jul 17 (15 years)
U Mobile 503.41 43.31 1 Jul 17 (15 years)
Source: Respective companies, UOB Kay Hian
Capex likely to remain high as telcos aim for 4G LTE leadership 2,300MHz and 2,600MHz spectrum could be allocated in 2018-19 …subject to business proposals by telco players
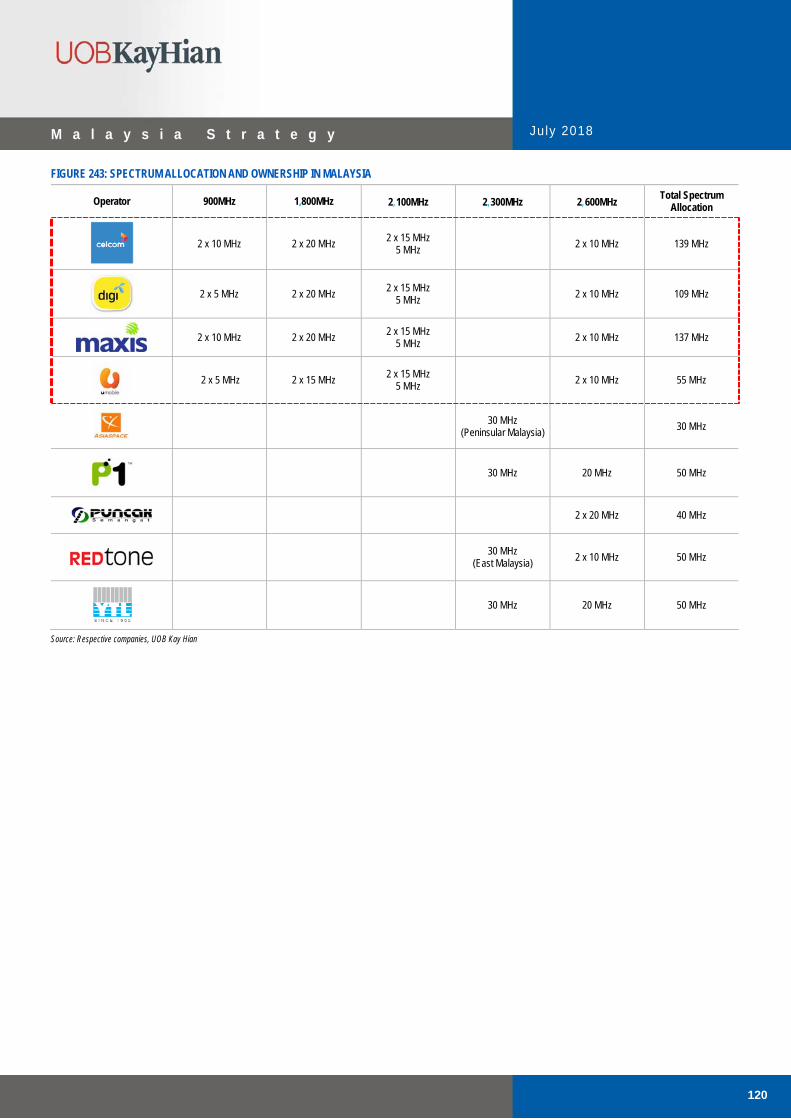
M a l a y s i a S t r a t e g y July 2018
120
FIGURE 243: SPECTRUM ALLOCATION AND OWNERSHIP IN MALAYSIA
Operator 900MHz 1,800MHz 2,100MHz 2,300MHz 2,600MHz Total Spectrum
Allocation
2 x 10 MHz 2 x 20 MHz 2 x 15 MHz
5 MHz 2 x 10 MHz 139 MHz
2 x 5 MHz 2 x 20 MHz 2 x 15 MHz
5 MHz 2 x 10 MHz 109 MHz
2 x 10 MHz 2 x 20 MHz
2 x 15 MHz 5 MHz 2 x 10 MHz 137 MHz
2 x 5 MHz 2 x 15 MHz 2 x 15 MHz 5 MHz
2 x 10 MHz 55 MHz
30 MHz
(Peninsular Malaysia) 30 MHz
30 MHz 20 MHz 50 MHz
2 x 20 MHz 40 MHz
30 MHz
(East Malaysia) 2 x 10 MHz 50 MHz
30 MHz 20 MHz 50 MHz
Source: Respective companies, UOB Kay Hian
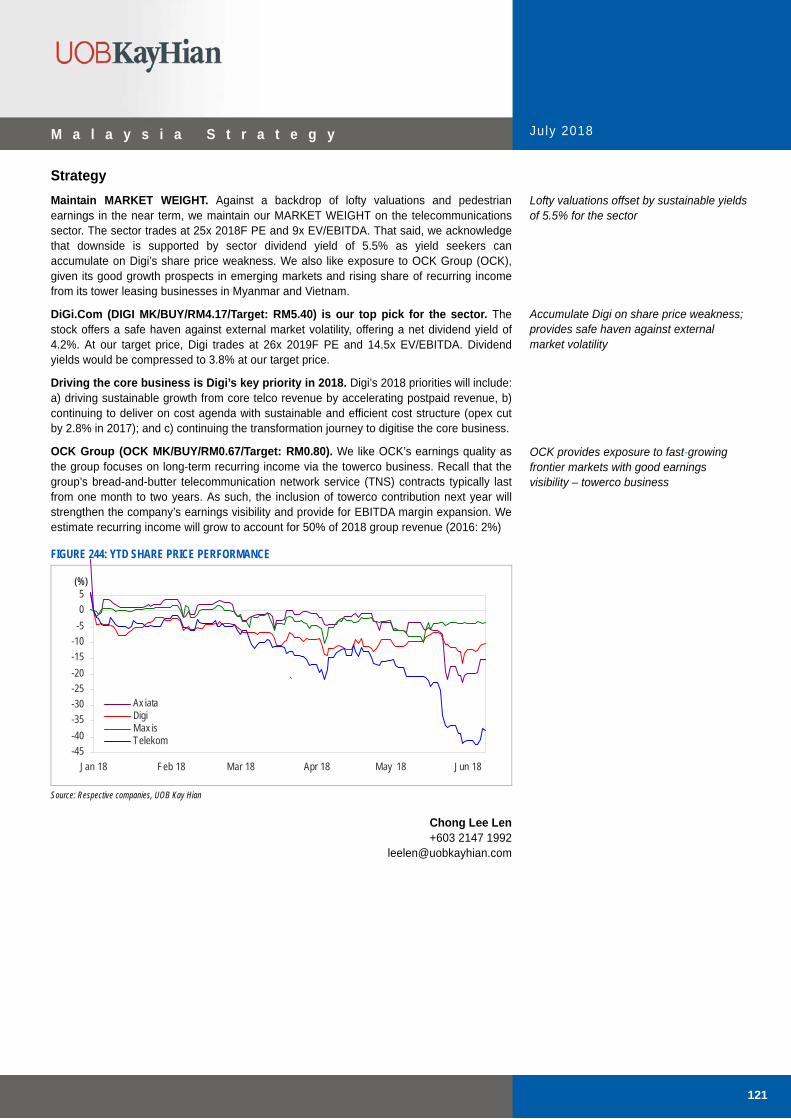
M a l a y s i a S t r a t e g y July 2018
121
Strategy
Maintain MARKET WEIGHT. Against a backdrop of lofty valuations and pedestrian earnings in the near term, we maintain our MARKET WEIGHT on the telecommunications sector. The sector trades at 25x 2018F PE and 9x EV/EBITDA. That said, we acknowledge that downside is supported by sector dividend yield of 5.5% as yield seekers can accumulate on Digi’s share price weakness. We also like exposure to OCK Group (OCK), given its good growth prospects in emerging markets and rising share of recurring income from its tower leasing businesses in Myanmar and Vietnam.
DiGi.Com (DIGI MK/BUY/RM4.17/Target: RM5.40) is our top pick for the sector. The stock offers a safe haven against external market volatility, offering a net dividend yield of 4.2%. At our target price, Digi trades at 26x 2019F PE and 14.5x EV/EBITDA. Dividend yields would be compressed to 3.8% at our target price.
Driving the core business is Digi’s key priority in 2018. Digi’s 2018 priorities will include: a) driving sustainable growth from core telco revenue by accelerating postpaid revenue, b) continuing to deliver on cost agenda with sustainable and efficient cost structure (opex cut by 2.8% in 2017); and c) continuing the transformation journey to digitise the core business.
OCK Group (OCK MK/BUY/RM0.67/Target: RM0.80). We like OCK’s earnings quality as the group focuses on long-term recurring income via the towerco business. Recall that the group’s bread-and-butter telecommunication network service (TNS) contracts typically last from one month to two years. As such, the inclusion of towerco contribution next year will strengthen the company’s earnings visibility and provide for EBITDA margin expansion. We estimate recurring income will grow to account for 50% of 2018 group revenue (2016: 2%)
FIGURE 244: YTD SHARE PRICE PERFORMANCE
-45
-40
-35
-30
-25
-20
-15
-10
-5
0
5
Jan 18 Feb 18 Mar 18 Apr 18 May 18 Jun 18
Ax iataDigiMax isTelekom
(%)
`
Source: Respective companies, UOB Kay Hian
Chong Lee Len +603 2147 1992
Lofty valuations offset by sustainable yields of 5.5% for the sector
Accumulate Digi on share price weakness; provides safe haven against external market volatility OCK provides exposure to fast-growing frontier markets with good earnings visibility – towerco business

M a l a y s i a S t r a t e g y July 2018
122
Sector At A Glance
FIGURE 245: SUBSCRIBER PENETRATION RATE FIGURE 246: QUARTERLY NET ADDS/LOSSES
40
41
42
43
44
3Q16 4Q16 1Q17 2Q17 3Q17 4Q17 1Q18
(m)
131
133
135
137
139
141
143(%)
Subscribers (LHS)Penetration (RHS)
-2000
-1500
-1000
-500
0
500
1000
3Q16 4Q16 1Q17 2Q17 3Q17 4Q17 1Q18
Celcom DiGi Max is
Net Adds ('000)
Source: Respective companies, UOB Kay Hian Source: Respective companies, UOB Kay Hian
FIGURE 247: SERVICE REVENUE MARKET SHARE (MAR 18) FIGURE 248: EBITDA MARKET SHARE (MAR 18)
29.0 29.0 29.3 29.8 29.9 30.0 30.1
30.1 29.7 29.3 29.0 29.0 29.8 29.9
40.9 41.3 41.3 41.2 41.1 40.1 40.0
0
20
40
60
80
100
3Q16 4Q16 1Q17 2Q17 3Q17 4Q17 1Q18
Celcom DiGi Max is(%)
23.0 24.8 25.3 26.8 27.2 29.3 29.1
31.1 28.9 30.6 30.5 28.7 29.0 30.6
45.9 46.3 44.1 42.8 44.2 41.8 40.3
0
20
40
60
80
100
3Q16 4Q16 1Q17 2Q17 3Q17 4Q17 1Q18
Celcom DiGi Max is(%)
Source: Respective companies, UOB Kay Hian Source: Respective companies, UOB Kay Hian
FIGURE 249: BLENDED ARPU FIGURE 250: EBITDA MARGIN
38
43
48
53
58
3Q16 4Q16 1Q17 2Q17 3Q17 4Q17 1Q18
CelcomDiGiMax is
(RM)
35
40
45
50
55
60
3Q16 4Q16 1Q17 2Q17 3Q17 4Q17 1Q18
Big Three Celcom DiGi Max is
(%)
Source: Respective companies, UOB Kay Hian Source: Respective companies, UOB Kay Hian FIGURE 251: SECTOR STATISTICS
Share Price Last Net Profit EPS PE Market BV Price/
Company Ticker Rec 5 Jul 18 Year 2017 2018F 2019F 2017 2018F 2019F 2017 2018F 2019F ROE Cap ps BV ps (RM) End (RMm) (RMm) (RMm) (sen) (sen) (sen) (x) (x) (x) (%) (RMm) (RM) (x)
Axiata Group Axiata MK HOLD 4.11 12/17 1,093 1,088 1,623 12.1 12.0 17.9 34.0 34.2 22.9 3.8 37,194 2.58 1.6
DiGi.Com DIGI MK BUY 4.17 12/17 1,471 1,523 1,618 18.9 19.6 20.8 22.0 21.3 20.0 284.5 32,422 0.09 46.3
Maxis Maxis MK HOLD 5.39 12/17 2,298 1,999 2,002 29.4 25.6 25.6 18.3 21.1 21.0 34.2 42,132 0.90 6.0
OCK OCK MK BUY 0.67 12/17 34 30 36 4.0 3.5 4.1 16.9 19.4 16.3 5.8 584 0.47 1.4
Telekom Malaysia T MK BUY 3.50 12/17 863 642 654 23.0 17.1 17.4 15.2 20.5 20.1 12.0 13,153 2.01 1.7
Sector 5,760 5,282 5,932 21.8 23.8 21.2 13.8 125,484 3.2
Note: If year end is before June, earnings are shown in the previous period. Source: Respective companies, Bloomberg, UOB Kay Hian

M a l a y s i a S t r a t e g y July 2018
123
Utilities OVERWEIGHT
WHY WE ARE OVERWEIGHT
Government remains committed to energy reform. Good earnings visibility as we expect IBR framework to
be honoured. Active capital management. TNB to benefit from higher generation market share.
WHAT TO WATCH OUT FOR IN 2H18
Under-recovery of fuel costs for 2H18 to be announced by government.
Proliferation of large solar power plants under government’s green technology drive.
Implementation of quarterly dividend payout for TNB.
Outlook
FIGURE 252: UTILITIES INDEX IN LINE WITH FBMKLCI
88
90
92
94
96
98
100
102
104
106
Jan Feb Mar Apr May Jun Jul
Utilities
FBMKLCI
End Dec 17=100
Source: Bloomberg, UOB Kay Hian
Sector largely inline with FBMKLCI. The sector performed inline with the overall market as the government remains committed in its energy reform agenda. Notably, Tenaga Nasional’s (TNB) share price has fallen 9% after GE14 (up 5% prior to GE14) as the market was jittery in anticipation of potential unwinding of policies implemented by the previous government under Najib Razak. The recent tariff hike announcement saw TNB’s share price recovering by close to 10%. Separately, Malakoff Corporation’s (Malakoff) earnings continue to disappoint, leading to a 9% ytd share price drop. To recap, Malakoff’s quarterly earnings were affected by continuous unplanned outage at Tanjung Bin Energy (TBE) due to a confluence of factors, including: a) exclusion from MSCI ex-Japan index, and b) delay in securing the power purchase agreement (PPA) for PT Tanjung Jati.
2H18 outlook: Government to remain committed to energy reform agenda. Stepping into 2H18, we expect the sector to continue offering shelter amid market volatility. Our base case assumes that the government is committed to energy reform and this will ensure that TNB will continue to operate within the IBR framework. In essence, the framework will pave the way for good earnings visibility and for both TNB’s and Gas Malaysia’s (GMB) highly cash-generative assets to generate stable earnings and cash flows. Importantly, we expect TNB and GMB to pay out 60% and 70% of their earnings as dividends respectively. All in all, we project sector net profit of RM8,148m (15.1x 2018F PE), driven by Peninsular Malaysia’s electricity demand growth of 2% in 2018.
Sector performed inline with the FBMKLCI given policy clarity last month
Government commitment to energy reform is positive for sector; sector net profit of RM8b to be driven by electricity demand growth of 2%

M a l a y s i a S t r a t e g y July 2018
124
GAS SUBSIDY RATIONALISATION REMAINS RELEVANT
Spirit of IBR remains intact… GMB announced in Jun 18 that the government has given approval, via a letter from Suruhanjaya Tenaga, for GMB to effect the revision of the natural gas (NG) tariff for the non-power sector in Peninsular Malaysia in the 1 Jul-31 Dec 18 period. The government has prescribed the IBR framework which sets the base tariff for a regulatory period of three years from Jan 17 and allows changes in gas costs to be passed through via the gas cost pass-through (GCPT) mechanism every six months.
…as GMB gets government approval to raise tariff and claw back higher gas costs incurred in 1H18. The gas base tariff will be adjusted to RM31.92/MMBtu for 2H18. Also, a surcharge of RM0.77/MMBtu will apply to all tariff categories (under GCPT). This translates to an average effective tariff of RM32.69/MMBtu (0.5% increase to the previous tariff).
FIGURE 253: BASE TARIFF AND EFFECTIVE TARIFF SCHEDULE FOR 1 JUL-31 DEC 18
Effective Tariff Annual Gas Current Base Tariff for (after GCPT) for Consumption Base Tariff 1 Jul -31 Dec 18 1 Jul-31 Dec 18
Category (MMBtu) (RM/MMBtu) (RM/MMBtu) (RM/MMBtu)
A Residential 22.30 23.03 23.80
B 0 - 600 28.78 29.73 30.50
C 601 - 5,000 28.93 29.88 30.65
D 5,001 - 50,000 29.22 30.19 30.96
E 50,001 - 200,000 30.48 31.49 32.26
F 200,001 - 750,000 30.48 31.49 32.26
L Above 750,000 31.50 32.55 33.32
Average 30.90 31.92 32.69
Source: Gas Malaysia
Overall positive as government is seen to subscribe to spirit of IBR. This is a critical move for gas subsidy rationalisation, and there should not be any concern over the government’s commitment to energy reform. Broadly, the government has approved: a) higher base NG prices under the IBR schedule, and importantly b) a 77 sen/MMBtu surcharge for higher actual NG cost against the reference gas cost under the base tariff (more commonly known as the under-recovery of gas cost for GMB in 1H18). The NG tariff hike is earnings-neutral for GMB while gas volume growth is a key earnings driver for the stock.
Government continues to honour IBR framework, lifting policy uncertainty for TNB. As TNB is also experienced under-recovery of fuel cost (arising from higher global coal prices in 1H18 vs reference price of US$75/MT), the government recently announced a 1.35 sen/kwh tariff hike for the commercial and industrial customers (accounting for 75% of TNB’s customer base). The government continue to ‘care’ for its citizens and subsidize domestic tariff by compensating TNB for the under recovery (which amounted to RM700m for all three segments of the market i.e. domestic, commercial and industrial). We view the development positively, lifting policy uncertainties and demonstrates the government’s political will to honor the ICPT and IBR framework.
GMB received approval for GCPT for 2H18 with a marginally higher tariff We are positive on this move which implies the government will honour IBR and ICPT for TNB
Government approved a tariff hike for the commercial and industrial segment in recent ICPT review. Positive for TNB

M a l a y s i a S t r a t e g y July 2018
125
RETURN ON REGULATORY PERIOD 2 AT 7.3%, REGULATORS TO SET KPI
Positive regulatory framework for 2018-20. The government approved 7.3% allowable returns for TNB’s transmission and distribution (T&D) for Regulatory Period 2 (RP2) ie 2018-20. In RP2, the government is pushing for greater transparency and efficiency. Consequently, we expect the regulator to set more stringent operational KPIs for TNB in RP2 – which are still under negotiation and could include transmission losses and System Average Interruption Duration Index (SAIDI). Positively, we believe the current CEO, Dato' Ir. Hj. Azman bin Mohd, is the right man for the job as he was previously the COO of TNB
Focus on cost efficiencies in RP2. Based on a 7.3% ROA, we project pedestrian earnings in 2018-20 for TNB. In the long run, earnings upside will come from potential cost savings as TNB moves towards automation and SMART metering (based on RP2 capex approval of RM18.8b). The move towards greater efficiency is captured in the 4% increase in annual capex in RP2 vs 3% in RP1 (2014-17). For example, automation will help TNB reduce staff, administration, and repair & maintenance costs.
FIGURE 254: IBR ENTITIES UNDER RP2
Source: TNB
FIGURE 255: RP2 BASE TARIFF
Source: TNB
RP2 rate of return is 7.3%, marginally below the 7.5% under RP1

M a l a y s i a S t r a t e g y July 2018
126
FIGURE 256: RATIONALE FOR CHANGES IN AVERAGE BASE TARIFF FOR RP2
RP1: 2015-17 Fuel Prices Assumptions 2014 (Trial)
RP2: 2018-20
Liquefied Natural Gas (RM/mmBTU) 41.68 35.00
Domestic Piped Gas (RM/mmBTU) 15.20
Revised every 6 months by
RM1.50/mmBTU to
RM22.70/mmBTU
24.20
Revised every 6 months by
RM1.50/mmBTU to
RM27.20/mmBTU
Imported Coal (USD/MT) 87.50 (RM271.25/MT)
~RM12.43/mmBTU
75.00 (RM315.90)
~RM14.47/mmBTU
Exchange Rate (RM per 1 USD) 3.10 4.212
Levelised Single Buyer Generation Costs 26.76 sen/kWh 27.05 sen/kWh
Source: Energy Commission
Sustainable dividend payout of 30-60% of core net profit… TNB’s management aims to pay out 30-60% of core net profit (excluding forex gains/losses) as dividends. We have pencilled in a 60% dividend payout ratio over 2018-20 and this translates to a net dividend yield of 4.6%. Importantly, we opine this fundamental change will convince the market that a more sustainable dividend yield for TNB is in the region of 5%.
…on a quarterly basis. Positively, we understand that the company is contemplating paying out quarterly dividends. Investors will appreciate the predictability of quarterly dividend payments in the near term.
Adequate reserve margin in Peninsular Malaysia. TNB recorded peak demand of 17,997MW on 12 Apr 18 largely due to the hot weather. Fortunately, the reserve margin in Peninsular Malaysia remained healthy, above 30%, due to the successful commissioning of Malakoff’s 1,000MW TBE power plant (in Mar 16) and the short-term extension of first-generation power plants.
TNB’s generation market share to rise to 59% by 2020. We expect TNB’s generation market share to rise to 59% by end-20, given: a) the completion of a 3,000MW coal-fired power plant by Dec 19, and b) the delay in the construction of TNB’s Southern Power Generation gas-fired power plant. For a start, TNB completed the construction of a 1x1000MW coal-fired power plant in Manjung (known as Janamanjung 5) on 28 Sep 17. It is currently constructing a 2,000MW coal-fired Jimah East power plant (Track 3B project), which is already 86% completed.
High proportion of coal in generation mix in 2018. Despite coal prices rising 46% yoy, the dispatch of orders favours coal-fired power plants as the cost of generation remains the lowest at 15.1 sen/kwh vs gas generation cost of 17.1 sen/kwh. We expect this trend to continue into 2H18.
Cash flow prowess ensures sustainable dividend yield for TNB…
…as TNB mulls paying out quarterly dividends
Peninsular Malaysia’s reserve margin will remain adequate until 2025
TNB’s generation market share to rise with commissioning of TNB Southern Power Generation plant
Dispatch of orders dictates that coal will continue to exceed 50% of generation mix in 2018
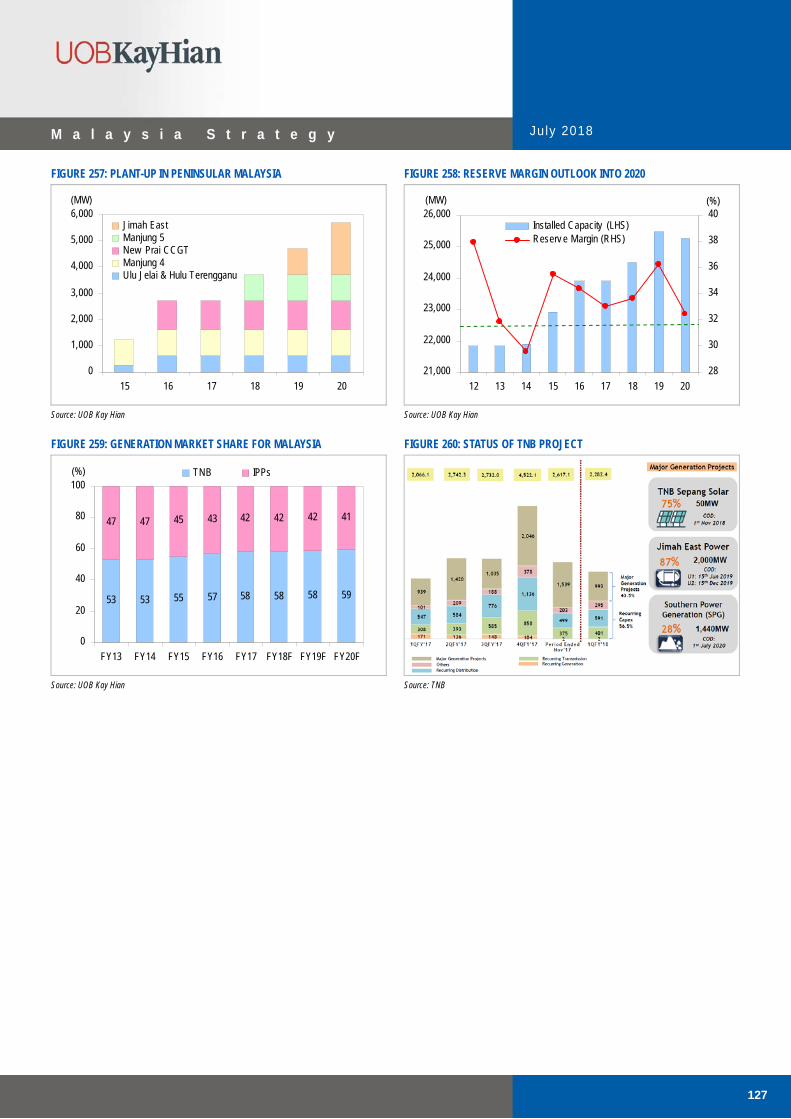
M a l a y s i a S t r a t e g y July 2018
127
FIGURE 257: PLANT-UP IN PENINSULAR MALAYSIA FIGURE 258: RESERVE MARGIN OUTLOOK INTO 2020
0
1,000
2,000
3,000
4,000
5,000
6,000
15 16 17 18 19 20
(MW)
Jimah EastManjung 5New Prai CCGTManjung 4Ulu Jelai & Hulu Terengganu
21,000
22,000
23,000
24,000
25,000
26,000
12 13 14 15 16 17 18 19 20
(MW)
28
30
32
34
36
38
40 (%)
Installed Capacity (LHS)Reserv e Margin (RHS)
Source: UOB Kay Hian Source: UOB Kay Hian
FIGURE 259: GENERATION MARKET SHARE FOR MALAYSIA FIGURE 260: STATUS OF TNB PROJECT
53 53 55 57 58 58 58 59
47 47 45 43 42 42 42 41
0
20
40
60
80
100
FY13 FY14 FY15 FY16 FY17 FY18F FY19F FY20F
TNB IPPs (%)
Source: UOB Kay Hian Source: TNB

M a l a y s i a S t r a t e g y July 2018
128
Strategy
Maintain OVERWEIGHT on the sector. Key rerating catalysts include: a) TNB or independent power producers (IPP) such as Malakoff, YTL Power International or Edra Global Energy winning new power plant contracts from the Energy Commission; b) active capital management; and c) strong economic growth driving better-than-expected demand for electricity.
Our top pick is Tenaga Nasional (TNB MK/BUY/RM14.42/Target: RM17.70) for its good earnings visibility under the IBR framework and undemanding valuation. At our DCF-based target price, the stock would trade at 14.3x 2018F PE and 8.4x EV/EBTIDA. TNB is trading at an attractive 11.5x 2018F PE, below the market’s mid-teens valuation. Given the strong cash flow visibility under the IBR framework, we believe the valuation discount is unwarranted. Active capital management will provide scope for further share price upside.
Downgrade YTL Power International (YTLP MK/HOLD/RM1.05/Target: RM1.05) to HOLD (from BUY) as share price has recovered post GE14 from depressed levels. We note rising earnings headwinds in the near term given the: a) long delay in the signing of 1,320MW PT Tanjung Jati PPA in Indonesia, and b) challenging environment for WessexWater in the upcoming review with the UK regulator, OFWAT, for the next regulatory period 2021-25. The stock trades at 9.7x FY19F PE and 11x EV/EBITDA. We believe further downside will be supported by its attractive net dividend yield of 4.8%. Entry price is RM0.85.
Seeking shelter. Malaysia’s largest IPP, Malakoff Corporation (MLK MK/BUY/RM0.85/ Target: RM1.05) offers sustainable net dividend of 4.8%. We expect quarterly earnings to recover in 2Q18 following the completion of TBE rectification works (fully covered by manufacturer insurance) in Feb 18. The 3,000MW coal-fired TBE power plant accounts for 60% of our RM5.3b SOTP valuation. Key rerating catalysts include: a) brownfield power plant acquisition; and b) greenfield power plant awards in Malaysia, Southeast Asia and the Middle East. Gas Malaysia (GMB MK/HOLD/RM2.83/Target: RM2.90) offers stable operations and a mandate to pay out at least 70% of net profit to shareholders. We project 2018 net dividend yield of 4.9% as the implementation of the IBR (7.5% return on assets) will anchor earnings.
FIGURE 261: YTD SHARE PRICE PERFORMANCE
-50
-40
-30
-20
-10
0
10
Jan 18 Feb 18 Mar 18 Apr 18 May 18 Jun 18
Tenaga NasionalYTL Pow erGas Malay siaMalakoff
(%)
Source: Respective companies, UOB Kay Hian
Chong Lee Len +603 2147 1992
Maintain OVERWEIGHT given active capital management under IBR framework
Top pick: TNB Malakoff expected to enjoy higher plant availability for TBE from here on

M a l a y s i a S t r a t e g y July 2018
129
Sector At A Glance
FIGURE 262: MALAYSIA’S ELECTRICITY GROWTH FIGURE 263: QUARTERLY ELECTRICITY DEMAND GROWTH
80,000
85,000
90,000
95,000
100,000
105,000
110,000
08 09 10 11 12 13 14 15 16 17
-4
-2
0
2
4
6
8
10Electricity Demand (LHS) % Grow th (RHS) (%)(GWh)
-15
-10
-5
0
5
10
15
20
3QFY16 4QFY16 1QFY17 2QFY17 3QFY17 4QFY17 1QFY18
Industrial CommercialResidential Peninsular Msia
(%)
Source: TNB Source: TNB
FIGURE 264: TNB GENERATION UNIT COST (1Q18) FIGURE 265: POWER GENERATION FUEL MIX (1Q18)
245.8
52.117.1 15.1 15.3
0
50
100
150
200
250
300
Distillates Oil Gas Coal Generation
Costs
(sen/kw h)
Gas
41%
Coal
54%
Oil &
Distillate
2%
Hy dro
5%
Source: TNB Source: TNB
FIGURE 266: GENERATION MARKET SHARE IN MALAYSIA FIGURE 267: THERMAL COAL PRICE TREND (FOR POWER SECTOR)
Others
5%
YTLP
2%EDRA
13%
Malakoff
25%
TNB
57%
72.7
55.7
66.075.4
83.6
103.6106.9
40
60
80
100
120
FY11 FY12 FY13 FY14 FY15 FY16 FY17
(US$/MT)
Source: UOB Kay Hian Source: TNB
FIGURE 268: SECTOR STATISTICS
Share Price Last Net Profit EPS PE Market BV Price/
Company Ticker Rec 5 Jul 18 Year 2017 2018F 2019F 2017 2018F 2019F 2017 2018F 2019F ROE Cap ps BV ps (RM) End (RMm) (RMm) (RMm) (sen) (sen) (sen) (x) (x) (x) (%) (RMm) (RM) (x)
Gas Malaysia GMB MK HOLD 2.83 12/17 164 171 178 12.8 13.3 13.8 22.1 21.2 20.5 18.8 3,634 0.78 3.6
Malakoff MLK MK BUY 0.85 12/17 319 266 299 6.5 5.4 6.1 13.0 15.6 13.9 5.3 4,157 1.21 0.7
Tenaga Nasional TNB MK BUY 14.42 8/17 7,330 6,971 6,815 129.1 122.8 120.0 11.2 11.7 12.0 12.6 81,879 10.20 1.4
YTL Power YTLP MK HOLD 1.05 6/17 746 660 751 9.5 9.4 10.6 11.0 11.1 9.9 5.2 8,223 1.60 0.7
Sector 8,560 8,148 8,123 11.4 12.0 12.1 10.8 97,893 1.3
Note: If year end is before June, earnings are shown in the previous period. Source: Respective companies, Bloomberg, UOB Kay Hian
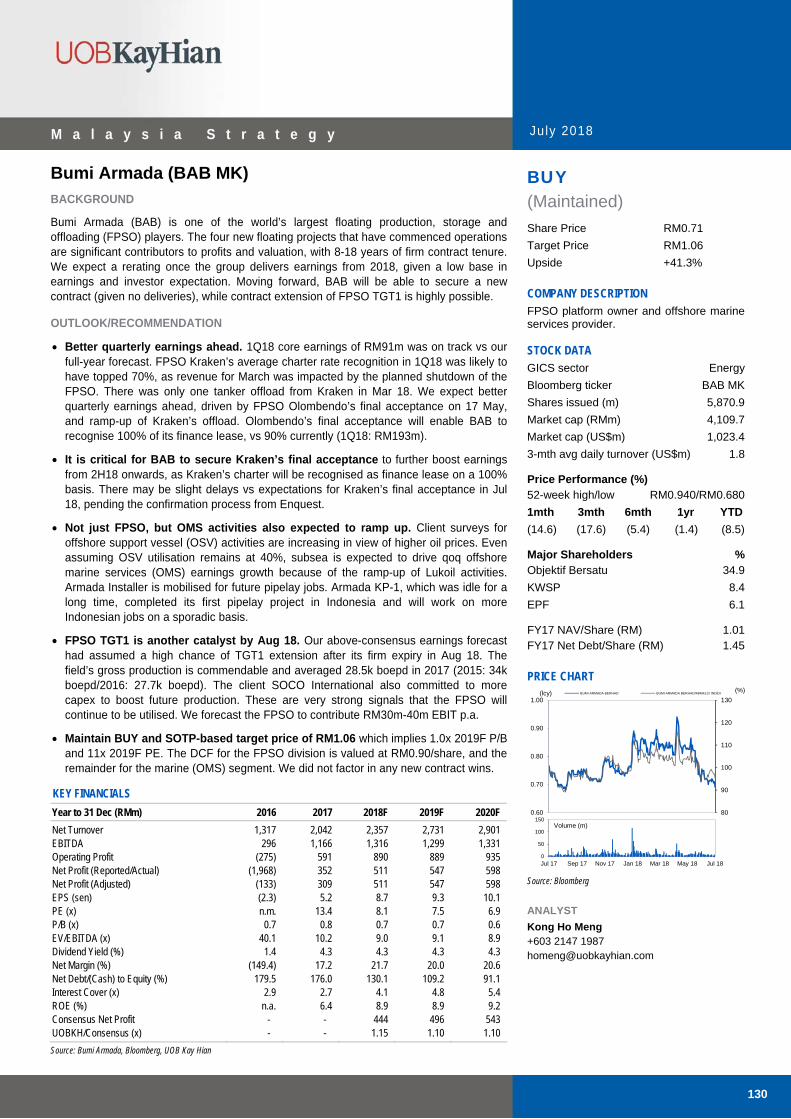
130
M a l a y s i a S t r a t e g y July 2018
Bumi Armada (BAB MK)
BACKGROUND
Bumi Armada (BAB) is one of the world’s largest floating production, storage and offloading (FPSO) players. The four new floating projects that have commenced operations are significant contributors to profits and valuation, with 8-18 years of firm contract tenure. We expect a rerating once the group delivers earnings from 2018, given a low base in earnings and investor expectation. Moving forward, BAB will be able to secure a new contract (given no deliveries), while contract extension of FPSO TGT1 is highly possible.
OUTLOOK/RECOMMENDATION
Better quarterly earnings ahead. 1Q18 core earnings of RM91m was on track vs our full-year forecast. FPSO Kraken’s average charter rate recognition in 1Q18 was likely to have topped 70%, as revenue for March was impacted by the planned shutdown of the FPSO. There was only one tanker offload from Kraken in Mar 18. We expect better quarterly earnings ahead, driven by FPSO Olombendo’s final acceptance on 17 May, and ramp-up of Kraken’s offload. Olombendo’s final acceptance will enable BAB to recognise 100% of its finance lease, vs 90% currently (1Q18: RM193m).
It is critical for BAB to secure Kraken’s final acceptance to further boost earnings from 2H18 onwards, as Kraken’s charter will be recognised as finance lease on a 100% basis. There may be slight delays vs expectations for Kraken’s final acceptance in Jul 18, pending the confirmation process from Enquest.
Not just FPSO, but OMS activities also expected to ramp up. Client surveys for offshore support vessel (OSV) activities are increasing in view of higher oil prices. Even assuming OSV utilisation remains at 40%, subsea is expected to drive qoq offshore marine services (OMS) earnings growth because of the ramp-up of Lukoil activities. Armada Installer is mobilised for future pipelay jobs. Armada KP-1, which was idle for a long time, completed its first pipelay project in Indonesia and will work on more Indonesian jobs on a sporadic basis.
FPSO TGT1 is another catalyst by Aug 18. Our above-consensus earnings forecast had assumed a high chance of TGT1 extension after its firm expiry in Aug 18. The field’s gross production is commendable and averaged 28.5k boepd in 2017 (2015: 34k boepd/2016: 27.7k boepd). The client SOCO International also committed to more capex to boost future production. These are very strong signals that the FPSO will continue to be utilised. We forecast the FPSO to contribute RM30m-40m EBIT p.a.
Maintain BUY and SOTP-based target price of RM1.06 which implies 1.0x 2019F P/B and 11x 2019F PE. The DCF for the FPSO division is valued at RM0.90/share, and the remainder for the marine (OMS) segment. We did not factor in any new contract wins.
KEY FINANCIALS
Year to 31 Dec (RMm) 2016 2017 2018F 2019F 2020F Net Turnover 1,317 2,042 2,357 2,731 2,901 EBITDA 296 1,166 1,316 1,299 1,331 Operating Profit (275) 591 890 889 935 Net Profit (Reported/Actual) (1,968) 352 511 547 598 Net Profit (Adjusted) (133) 309 511 547 598 EPS (sen) (2.3) 5.2 8.7 9.3 10.1 PE (x) n.m. 13.4 8.1 7.5 6.9 P/B (x) 0.7 0.8 0.7 0.7 0.6 EV/EBITDA (x) 40.1 10.2 9.0 9.1 8.9 Dividend Yield (%) 1.4 4.3 4.3 4.3 4.3 Net Margin (%) (149.4) 17.2 21.7 20.0 20.6 Net Debt/(Cash) to Equity (%) 179.5 176.0 130.1 109.2 91.1 Interest Cover (x) 2.9 2.7 4.1 4.8 5.4 ROE (%) n.a. 6.4 8.9 8.9 9.2 Consensus Net Profit - - 444 496 543 UOBKH/Consensus (x) - - 1.15 1.10 1.10 Source: Bumi Armada, Bloomberg, UOB Kay Hian
BUY
(Maintained)
Share Price RM0.71 Target Price RM1.06 Upside +41.3%
COMPANY DESCRIPTION
FPSO platform owner and offshore marine services provider.
STOCK DATA
GICS sector Energy
Bloomberg ticker BAB MK
Shares issued (m) 5,870.9
Market cap (RMm) 4,109.7
Market cap (US$m) 1,023.4
3-mth avg daily turnover (US$m) 1.8
Price Performance (%) 52-week high/low RM0.940/RM0.680
1mth 3mth 6mth 1yr YTD
(14.6) (17.6) (5.4) (1.4) (8.5)
Major Shareholders %Objektif Bersatu 34.9
KWSP 8.4
EPF 6.1
FY17 NAV/Share (RM) 1.01FY17 Net Debt/Share (RM) 1.45
PRICE CHART
Source: Bloomberg ANALYST
Kong Ho Meng +603 2147 1987 [email protected]
80
90
100
110
120
130
0.60
0.70
0.80
0.90
1.00
(%)(lcy) BUMI ARMADA BERHAD BUMI ARMADA BERHAD/FBMKLCI INDEX
0
50
100
150
Jul 17 Sep 17 Nov 17 Jan 18 Mar 18 May 18 Jul 18
Volume (m)

131
M a l a y s i a S t r a t e g y July 2018
PROFIT & LOSS BALANCE SHEET
Year to 31 Dec (RMm) 2017 2018F 2019F 2020F Year to 31 Dec (RMm) 2017 2018F 2019F 2020F
Net Turnover 2,042 2,357 2,731 2,901 Fixed Assets 14,515 13,890 13,414 12,954
EBITDA 1,166 1,316 1,299 1,331 Other LT Assets 943 303 330 360
Depreciation & Amortisation 575 426 410 396 Cash/ST investment 1,846 2,046 1,872 1,593
EBIT 591 890 889 935 Other Current Assets 1,530 1,609 1,697 1,793
Associate Contributions 164 94 87 84 Total Assets 18,835 17,848 17,313 16,700
Net Interest Income/(Expense) (431) (319) (269) (247) ST Debt 5,498 2,500 2,500 2,500
Pre-tax Profit 492 664 708 773 Other Current Liabilities 1,150 1,651 1,868 1,999
Tax (116) (133) (142) (155) LT Debt 6,025 7,265 6,255 5,220
Minorities (24) (20) (20) (20) Other LT Liabilities 641 455 323 173
Net Profit 352 511 547 598 Shareholders' Equity 5,497 5,934 6,304 6,725
Net Profit (Adjusted) 309 511 547 598 Minority Interest 24 44 64 84
Total Liabilities & Equity 18,835 17,848 17,313 16,700
CASH FLOW KEY METRICS
Year to 31 Dec (RMm) 2017 2018F 2019F 2020F Year to 31 Dec (%) 2017 2018F 2019F 2020F
Operating 565 1,360 1,037 956 Profitability
Pre-tax Profit 591 890 889 935 EBITDA Margin 57.1 55.8 47.6 45.9
Tax (116) (133) (142) (155) Pre-tax Margin 24.1 28.2 25.9 26.6
Depreciation & Amortisation 575 426 410 396 Net Margin 17.2 21.7 20.0 20.6
Working Capital Changes (703) 377 79 (20) ROA 1.7 2.8 3.1 3.5
Other Operating Cashflows 217 (200) (200) (200) ROE 6.4 8.9 8.9 9.2
Investing (1,609) (200) (200) (200)
Capex (Growth) 0 0 0 0 Growth
Capex (Maintenance) (1,816) (300) (300) (300) Turnover 55.0 15.4 15.9 6.2
Proceeds from Sale of Assets 0 0 0 0 EBITDA 294.2 12.8 (1.3) 2.5
Others 207 100 100 100 Pre-tax Profit n.a. 34.9 6.6 9.1
Financing (401) (960) (1,010) (1,035) Net Profit n.a. 45.2 6.9 9.4
Dividend Payments 41 0 0 0 Net Profit (Adjusted) n.a. 65.7 6.9 9.4
Issue of Shares 0 0 0 0 EPS n.a. 65.7 6.9 9.4
Proceeds from Borrowings 308 740 740 840
Loan Repayment (750) (1,700) (1,750) (1,875) Leverage
Others/interest Paid 1 0 0 0 Debt to Total Capital 67.6 62.0 57.9 53.1
Net Cash Inflow (Outflow) (1,445) 200 (173) (279) Debt to Equity 209.6 164.6 138.9 114.8
Beginning Cash & Cash Equivalent 3,016 1,846 2,046 1,872 Net Debt/(Cash) to Equity 176.0 130.1 109.2 91.1
Changes Due to Forex Impact 276 0 0 0 Interest Cover (x) 2.7 4.1 4.8 5.4
Ending Cash & Cash Equivalent 1,846 2,046 1,872 1,593

132
M a l a y s i a S t r a t e g y July 2018
Genting Malaysia (GENM MK) BACKGROUND
Genting Malaysia (GENM) has gaming, leisure and hospitality operations in three countries: Malaysia (Resorts World Genting), the UK (Resorts World UK and Resorts World Birmingham) and the US (Resorts World Casino New York City (RWCNY) and Resorts World Bimini). The Malaysian operations accounted for 82% of GENM’s EBITDA in 2017. In Malaysia, GENM’s RM8b Phase 1 Genting Integrated Tourism Plan (GITP) amenities started rolling out in phases from Dec 16 and will culminate with the opening of the iconic 20th Century Fox World theme park (Fox Theme Park) in end-18/early-19.
OUTLOOK/RECOMMENDATION
Event catalysts to emerge in end-18 with good earnings visibility through to 2019. GENM should benefit from good earnings visibility through to 2019 (estimating two-year EBITDA CAGR of 26%), led by Genting Highland’s further improvement in visitor arrivals post the opening of the iconic Fox Theme Park, higher gaming volumes and absence of start-up costs related to the GITP project in 2019.
Impressive visitor arrivals and… Driven by the opening of new attractions (Sky Casino, Sky Avenue retail mall and Theme Park Hotel, as well as Genting Premium Outlet at the mid-hill), Genting Highlands recorded an impressive 26% yoy visitor arrival growth in 1Q18, having welcomed 6.5m visitors in the quarter. We expect visitor arrivals to increase from 23.6m in 2017 to 28.0m in 2019 with the opening of Fox Theme Park.
…healthy underlying gaming volume growth. Both VIP and mass market gross gaming revenue recorded double-digit yoy growth in 1Q18, reflecting the full impact of the capacity expansion undertaken since 2Q17. We expect gaming volumes, particularly in the mass market segment, to improve further towards end-18 to 2019, due to the opening of an indoor theme park (targeting end-3Q18) and Fox Theme Park.
Impairment risk on Tribal casino investment remains. GENM recently carried out an impairment assessment on the recovery of its RM1.6b interest-bearing promissory notes investment in the US Mashpee Wampanoag Tribe’s IR and concluded no impairment is required for the notes for now. However, there is still longer-term impairment risk, in our view.
US operation: Smaller losses at Bimini. GENM’s Bimini operations have finally seen sustainable smaller losses on cost rationalisation initiatives. EBITDA losses narrowed to US$7m p.a. in 4Q17 and 1Q18 (4Q16: -US$41m, 1Q17: -US$17m) but we remain skeptical that it could turn profitable by 2H18-1H19. For RWCNY, revenue growth was tepid and EBITDA fell in 4Q17-1Q18 due to higher advertising and payroll costs, but management expects margins to recover in subsequent quarters.
Maintain BUY and target price of RM6.28, which implies 13.7x 2018F EV/EBITDA and 19.9x 2018F PE. Current share price is attractive, trading at below mean of 10.5x/8.4x 2018/19 EV/EBITDA. We expect GENM to appreciate ahead of the opening of Fox Theme Park, similar to the share price reaction of Macau casinos ahead of significant capacity expansion.
KEY FINANCIALS
Year to 31 Dec (RMm) 2016 2017 2018F 2019F 2020F Net Turnover 8,932 9,329 10,689 12,115 12,963 EBITDA 2,433 2,207 2,996 3,691 4,017 Operating Profit 1,632 1,268 1,999 2,662 3,014 Net Profit (Reported/Actual) 2,880 1,160 1,787 2,351 2,651 Net Profit (Adjusted) 1,562 1,407 1,787 2,351 2,650 EPS (sen) 26.3 24.8 31.5 41.4 46.7 PE (x) 18.4 19.5 15.4 11.7 10.4 P/B (x) 1.4 1.4 1.4 1.3 1.2 EV/EBITDA (x) 12.8 14.1 10.4 8.4 7.7 Dividend Yield (%) 3.4 3.5 3.6 4.3 4.3 Net Margin (%) 32.2 12.4 16.7 19.4 20.5 Net Debt/(Cash) to Equity (%) (1.7) 5.9 19.1 12.1 1.1 Interest Cover (x) n.a. n.a. 4,879.3 6,011.3 6,540.9 ROE (%) 14.8 5.9 9.0 11.2 11.8 Consensus Net Profit - - 1,634 1,970 2,284 UOBKH/Consensus (x) - - 1.09 1.19 1.16 Source: GENM, Bloomberg, UOB Kay Hian
BUY
(Maintained)
Share Price RM4.85
Target Price RM6.28
Upside +29.5%
COMPANY DESCRIPTION
Integrated resort and casino operator.
STOCK DATA
GICS sector Consumer Discretionary
Bloomberg ticker GENM MK
Shares issued (m) 5,656.6
Market cap (RMm) 27,434.6
Market cap (US$m) 6,785.7
3-mth avg daily t'over (US$m) 9.1
Price Performance (%) 52-week high/low RM6.18/RM4.59
1mth 3mth 6mth 1yr YTD
(4.9) (0.8) (15.1) (13.0) (12.5)
Major Shareholders %Genting Bhd 49.3
FY18 NAV/Share (RM) 3.58
FY18 Net Debt/Share (RM) 0.68
PRICE CHART
Source: Bloomberg ANALYSTS Vincent Khoo, CFA +603 2147 1998 [email protected] Yeoh Bit Kun +60 2147 1988 [email protected]
70
80
90
100
110
4.00
4.50
5.00
5.50
6.00
6.50
(%)(lcy) GENTING MALAYSIA BHD GENTING MALAYSIA BHD/FBMKLCI INDEX
0
10
20
30
Jul 17 Sep 17 Nov 17 Jan 18 Mar 18 May 18 Jul 18
Volume (m)

133
M a l a y s i a S t r a t e g y July 2018
PROFIT & LOSS BALANCE SHEET
Year to 31 Dec (RMm) 2017 2018F 2019F 2020F Year to 31 Dec (RMm) 2017 2018F 2019F 2020F
Net Turnover 9,329 10,689 12,115 12,963 Fixed Assets 13,835 14,838 15,308 14,906
EBITDA 2,207 2,996 3,691 4,017 Other LT Assets 9,074 9,586 9,586 9,586
Depreciation & Amortisation 940 998 1,029 1,002 Cash/ST Investment 5,997 3,267 4,516 6,892
EBIT 1,268 1,999 2,662 3,014 Other Current Assets 1,063 2,420 2,325 2,184
Associate Contributions 0 0 0 0 Total Assets 29,968 30,110 31,735 33,568
Net Interest Income/(Expense) 189 (1) (1) (1) ST Debt 547 547 547 547
Pre-tax Profit 1,318 1,998 2,661 3,015 Other Current Liabilities 2,705 2,879 3,152 3,348
Tax (247) (300) (399) (452) LT Debt 6,591 6,591 6,591 6,591
Minorities 89 89 89 89 Other LT Liabilities 984 0 0 0
Net Profit 1,160 1,787 2,351 2,651 Shareholders' Equity 19,335 20,287 21,638 23,275
Net Profit (Adjusted) 1,407 1,787 2,351 2,650 Minority Interest (193) (193) (193) (193)
Total Liabilities & Equity 29,968 30,110 31,735 33,568
CASH FLOW KEY METRICS
Year to 31 Dec (RMm) 2017 2018F 2019F 2020F Year to 31 Dec (%) 2017 2018F 2019F 2020F
Operating 2,155 3,101 3,749 3,990 Profitability
Pre-tax Profit 1,318 1,998 2,661 3,015 EBITDA Margin 23.7 28.0 30.5 31.0
Tax (176) (300) (399) (452) Pre-tax Margin 14.1 18.7 22.0 23.3
Depreciation & Amortisation 940 998 1,029 1,002 Net Margin 12.4 16.7 19.4 20.5
Associates 0 0 0 0 ROA 4.0 5.9 7.6 8.1
Working Capital Changes 135 105 157 125 ROE 5.9 9.0 11.2 11.8
Other Operating Cashflows (63) 300 300 300
Investing (2,281) (2,000) (1,500) (600) Growth
Capex (Growth) (2,659) (2,000) (1,500) (600) Turnover 4.4 14.6 13.3 7.0
Investments 0 0 0 0 EBITDA (9.3) 35.7 23.2 8.8
Proceeds from Sale of Assets 0 0 0 0 Pre-tax Profit (57.3) 51.6 33.2 13.3
Others 378 0 0 0 Net Profit (59.7) 54.1 31.6 12.8
Financing (1,442) (835) (999) (1,014) Net Profit (Adjusted) (9.9) 27.0 31.6 12.7
Dividend Payments (991) (835) (999) (1,014) EPS (5.7) 27.0 31.6 12.7
Issue of Shares 0 0 0 0
Proceeds from Borrowings 5,010 0 0 0 Leverage
Loan Repayment (2,340) 0 0 0 Debt to Total Capital 27.2 26.2 25.0 23.6
Others/Interest Paid (3,121) 0 0 0 Debt to Equity 36.9 35.2 33.0 30.7
Net Cash Inflow (Outflow) (1,568) 266 1,250 2,376 Net Debt/(Cash) to Equity 5.9 19.1 12.1 1.1
Beginning Cash & Cash Equivalent 4,568 3,001 3,267 4,516 Interest Cover (x) n.a. 4,879.3 6,011.3 6,540.9
Changes Due to Forex Impact 0 0 0 0
Ending Cash & Cash Equivalent 3,001 3,267 4,516 6,892

134
M a l a y s i a S t r a t e g y July 2018
Inari Amertron (INRI MK) BACKGROUND
Inari Amerton (Inari) operates 12 factories in Malaysia, the Philippines and China with a total manufacturing floor space of 1.08m sf and 6,000 employees. Inari is a key OSAT vendor for Broadcom’s radio frequency (RF) filters and dominates testing jobs in this segment. Inari is also the largest testhouse for RF system-in-packages (SiP) in Southeast Asia. Over the past three years, Inari has expanded its service offerings to include iris scanner production, data centre component testing and fibre optics-related foundry back-end services.
OUTLOOK/RECOMMENDATION
New projects with OSRAM to start commercial production in 2HFY19. Inari is poised to get three new projects from OSRAM Opto Semiconductors (OSRAM) that will commence soon facial recognition systems (for biometric authentication) and health sensors for smart devices as well as mini LED for billboard applications. These new products are expected to boost Inari’s under-utilised capacity for iris scanner. Commercial production of these products could start in early-19 and take up some floor space at Inari’s new plant, P21.
Broadcom to transfer more in-house jobs to ISL. Broadcom is poised to transfer more in-house jobs to Inari’s subsidiary, Inari Semiconductor Lab (ISL), which houses the foundry bank-end process for fibre optics products. The transfer is targeted to be completed by end-18. Recall that such a process transfer first took place in 2015 and Inari is the sole vendor for Broadcom. While ISL is expected to contribute only 5-6% of Inari’s total revenue in FY19-20, such a transfer suggests that Inari will continue benefitting from Broadcom’s high-margin and high-value engineering focus.
Long-term positive on RF. While Inari’s RF segment is weaker hoh in 2HFY18, the RF segment is expected to ramp up production in Jul-Aug 18, in preparation for its US end-customer’s launch of new smartphone models in September. Over the long run, the RF segment’s growth remains promising on the commercialisation of 5G networks.
Still in factory expansion mode. To cater for future expansion, Inari plans to build a RM60m factory with four blocks and total floor space of 600,000sf (55% of current total floor space) at its Batu Kawan land with the first block (170,000sf) to be ready by Oct 18. The utilisation plan for this new plant has not been disclosed, but we believe the plant could tap into potential business from OSRAM and Broadcom.
Consolidating operations to improve operational efficiency. To improve operational efficiency, Inari plans to consolidate its RF operations in Penang by moving the operations in plant P8 (rented premises) to P13, which is expected to save RM3m-5m p.a. Separately, the consolidation of the Philippines operations (transferring operations in Paranaque, Manila to Clark Field) is targeted for completion by Jul 18.
Maintain BUY with target price of RM2.68, pegged to 22x fully-diluted FY19F PE. We deem that Inari’s premium over the sector average is justifiable with its solid sales CAGR of 21% in FY17-20 and its strongest revenue prospects among local OSATs.
KEY FINANCIALS
Year to 30 Jun (RMm) 2016 2017 2018F 2019F 2020F
Net Turnover 1,043 1,176 1,485 1,804 2,093 EBITDA 208 309 362 475 566 Operating Profit 158 243 274 376 458 Net Profit (Reported/Actual) 148 228 254 351 429 Net Profit (Adjusted) 155 200 254 351 429 EPS (sen) 8.0 9.7 8.0 11.0 13.4 PE (x) 44.8 36.0 28.3 20.5 16.8 P/B (x) 10.0 7.9 7.3 6.5 5.7 EV/EBITDA (x) 32.6 21.9 18.7 14.3 11.9 Dividend Yield (%) 1.9 3.7 2.4 3.3 4.0 Net Margin (%) 14.2 19.4 17.1 19.4 20.5 Net Debt/(Cash) to Equity (%) (25.8) (47.3) (31.1) (27.8) (27.9) Interest Cover (x) 39.6 142.0 96.0 126.1 150.5 ROE (%) 24.3 29.2 27.7 34.4 37.3 Consensus Net Profit - - 273 338 397 UOBKH/Consensus (x) - - 0.93 1.04 1.08
Source: Inari, Bloomberg, UOB Kay Hian
BUY
(Maintained)
Share Price RM2.25
Target Price RM2.68
Upside +19.1%
COMPANY DESCRIPTION
Largest semiconductor company in Malaysia and a top OSAT provider of radio frequency components to Broadcom. Also manufactures and assembles optoelectronics and fibre optics-related components.
STOCK DATA
GICS sector Information Technology
Bloomberg ticker INRI MK
Shares issued (m) 3,141.0
Market cap (RMm) 7,067.4
Market cap (US$m) 1,748.0
3-mth avg daily t'over (US$m) 6.0
Price Performance (%) 52-week high/low RM2.53/RM1.41
1mth 3mth 6mth 1yr YTD
(5.1) 27.8 (8.5) 55.9 (0.7)
Major Shareholders %Insas Bhd 18.1
Kumpulan Wang Persaraan 14.1
Vanguard Group 2.2
FY18 NAV/Share (RM) 0.31FY18 Net Cash/Share (RM) 0.10
PRICE CHART
Source: Bloomberg ANALYST Yeoh Bit Kun +60 2147 1988 [email protected]
80
90
100
110
120
130
140
150
160
170
180
1.20
1.40
1.60
1.80
2.00
2.20
2.40
2.60
(%)(lcy) INARI AMERTRON BHD INARI AMERTRON BHD/FBMKLCI INDEX
0
20
40
60
Jul 17 Sep 17 Nov 17 Jan 18 Mar 18 May 18 Jul 18
Volume (m)

135
M a l a y s i a S t r a t e g y July 2018
PROFIT & LOSS BALANCE SHEET
Year to 30 Jun (RMm) 2017 2018F 2019F 2020F Year to 30 Jun (RMm) 2017 2018F 2019F 2020F
Net Turnover 1,176 1,485 1,804 2,093 Fixed Assets 332 399 450 492
EBITDA 309 362 475 566 Other LT Assets 14 14 14 14
Depreciation & Amortisation 66 88 99 108 Cash/ST Investment 455 340 340 382
EBIT 243 274 376 458 Other Current Assets 401 536 652 756
Net Interest Income/(Expense) (2) (4) (4) (4) Total Assets 1,202 1,290 1,457 1,645
Pre-tax Profit 241 270 372 455 ST Debt 16 16 16 16
Tax (12) (15) (20) (25) Other Current Liabilities 281 284 334 379
Minorities (1) (1) (1) (1) LT Debt 25 25 25 25
Net Profit 228 254 351 429 Other LT Liabilities 7 7 7 7
Net Profit (Adjusted) 200 254 351 429 Shareholders' Equity 876 961 1,079 1,223
Minority Interest (2) (3) (4) (5)
Total Liabilities & Equity 1,202 1,290 1,457 1,645
CASH FLOW KEY METRICS
Year to 30 Jun (RMm) 2017 2018F 2019F 2020F Year to 30 Jun (%) 2017 2018F 2019F 2020F
Operating 311 211 379 471 Profitability
Pre-tax Profit 241 270 372 455 EBITDA Margin 26.2 24.3 26.3 27.1
Tax (8) (15) (20) (25) Pre-tax Margin 20.5 18.2 20.6 21.7
Depreciation & Amortisation 66 88 99 108 Net Margin 19.4 17.1 19.4 20.5
Working Capital Changes 38 (133) (65) (59) ROA 21.9 20.4 25.5 27.7
Other Operating Cashflows (25) 1 (7) (8) ROE 29.2 27.7 34.4 37.3
Investing (53) (160) (150) (150)
Capex (Growth) (121) (160) (150) (150) Growth
Investments 0 0 0 0 Turnover 12.8 26.2 21.5 16.0
Proceeds from Sale of Assets 68 0 0 0 EBITDA 48.6 17.1 31.3 19.3
Others 0 0 0 0 Pre-tax Profit 57.3 12.2 37.7 22.2
Financing (15) (165) (228) (279) Net Profit 53.7 11.7 37.9 22.2
Dividend Payments (95) (165) (228) (279) Net Profit (Adjusted) 28.6 27.3 37.9 22.2
Issue of Shares 73 0 0 0 EPS 22.3 (18.1) 37.9 22.2
Proceeds from Borrowings 7 0 0 0
Loan Repayment 0 0 0 0 Leverage
Others/Interest Paid 0 0 0 0 Debt to Total Capital 4.5 4.1 3.7 3.3
Net Cash Inflow (Outflow) 243 (115) 1 42 Debt to Equity 4.7 4.3 3.8 3.3
Beginning Cash & Cash Equivalent 209 455 340 340 Net Debt/(Cash) to Equity (47.3) (31.1) (27.8) (27.9)
Changes Due to Forex Impact 3 0 0 0 Interest Cover (x) 142.0 96.0 126.1 150.5
Ending Cash & Cash Equivalent 455 340 340 382

136
M a l a y s i a S t r a t e g y July 2018
Public Bank (PBK MK) BACKGROUND
Public Bank (PBank) is the third-largest domestic banking group in Malaysia by assets, and the sixth-largest by asset size in Southeast Asia with market leadership in the residential and commercial property financing and hire purchase segments. Major shareholders are Tan Sri Dato’ Sri Dr Teh Hong Piow with a 23.9% stake and the Employees Provident Fund with 14.1%.
OUTLOOK/RECOMMENDATION
Earnings resilience in light of government policy changes. Although foreign shareholding remained high at 38.3% as at end-June 18 vs an all-time high of 39.4%, we believe stability in share price will eventually be anchored by the group’s more resilient earnings outlook in the light of the new Pakatan Harapan (PH) government’s cancellation of a number of mega infrastructure projects. PBank’s construction- and government-related loans constitute 2.0% and 0.4% of its total loans base respectively vs sector average of 4% and 2% respectively. This would also place the group in a better position to contain any potential lumpy NPL risk emanating from the review/cancellation of various infrastructure projects.
In the right segments to benefit from stronger purchasing power in the longer term. The group’s loans composition, which is heavily skewed to the consumer and SME segments (86% of domestic loans books), should benefit from the PH government’s mandate to raise the disposable income of the masses and have the private sector as a key economic growth engine. This may help fuel stronger consumer and SME loans growth. We believe auto loans (15.6% of PBank’s loans base vs industry’s 10.0%) and SME loans in the wholesale and retail trade segments (8.4% of PBank’s loans base vs industry’s 7.2%) could see a more immediate uplift in growth.
Share price has displayed resilience in times of uncertainties. We note that PBank’s foreign shareholding rose despite the oil price and currency challenges that Malaysia faced in 2015-16 as its defensive qualities were well reflected in the group’s 12.5%/2.5% earnings growth vs the sector’s earnings contraction of 2.5%/0.8%. As such, an inverse relationship was observed between its share price performance and a slight decline in ROE as investors have a habit of flocking to PBank in periods of uncertainties.
Commendable PPOP growth. In its recent 1Q18 results, PBank’s pre-provision operating profit (PPOP) was the strongest and among the most balanced compared to other large-cap banking peers. PPOP expanded 9.4% yoy underpinned by: a) 12.1% yoy growth in fee income, b) 6bp qoq expansion in NIM arising from the recent rate hike, and c) tight cost discipline resulting in a marginal 1.4% yoy uptick in operating expense.
Maintain BUY and target price of RM25.20 (2.45x 2018 PBV, ROE: 14.7%). While there could still be a slight downside risk to share price performance given its relatively high foreign shareholding of 39.0% as at end-May 18 vs 20-year mean of 32%, we note that current valuations of 14.9x 2019F PE is close to -1SD below its five-year historical mean PE of 14.4x and the group should be a prime beneficiary of the new government’s policies in raising disposable income and private sector growth over the longer term.
KEY FINANCIALS
Year to 31 Dec (RMm) 2015 2016 2017F 2018F 2019F
Net Interest Income 6,920 7,417 7,963 8,571 9,156 Non-Interest Income 2,094 2,331 2,498 2,654 2,816 Net Profit (Reported/Actual) 5,207 5,470 5,843 6,277 6,658 Net Profit (Adjusted) 5,207 5,470 5,843 6,277 6,658 EPS (sen) 134.1 140.9 150.5 161.7 171.5 PE (x) 17.1 16.3 15.2 14.2 13.4 P/B (x) 2.6 2.4 2.2 2.1 2.0 Dividend Yield (%) 2.6 2.8 3.0 3.2 3.4 Net Interest Margin (%) 2.2 2.3 2.3 2.3 2.3 Cost/Income (%) 32.3 31.9 31.3 30.9 31.0 Loan Loss Cover (%) 102.7 95.5 100.4 116.3 145.0 Consensus Net Profit - - 5,825 6,230 6,658 UOBKH/Consensus (x) - - 1.00 1.01 1.00
Source: PBank, Bloomberg, UOB Kay Hian
BUY
(Maintained)
Share Price RM22.90
Target Price RM25.20
Upside +10.0%
COMPANY DESCRIPTION
Third-largest domestic banking group in Malaysia by assets with about 14.8% of system assets and 16.2% of loan market.
STOCK DATA
GICS sector Financials
Bloomberg ticker PBK MK
Shares issued (m) 3,882.1
Market cap (RMm) 88,901.0
Market cap (US$m) 21,988.9
3-mth avg daily turnover (US$m) 37.2
Price Performance (%) 52-week high/low RM25.20/RM19.90
1mth 3mth 6mth 1yr YTD
(4.7) (4.3) 10.2 12.6 10.2
Major Shareholders %Tan Sri Dato’ Sri Dr. Teh Hong Piow 23.9
EPF 14.1
FY18 NAV/Share (RM) 10.26
FY18 CAR Tier-1 (%) 14.85
PRICE CHART
Source: Bloomberg ANALYST
Keith Wee +603 2147 1981 [email protected]
90
100
110
120
130
140
18
20
22
24
26
28
(%)(lcy) PUBLIC BANK BERHAD PUBLIC BANK BERHAD/FBMKLCI INDEX
0
10
20
30
Jul 17 Sep 17 Nov 17 Jan 18 Mar 18 May 18 Jul 18
Volume (m)
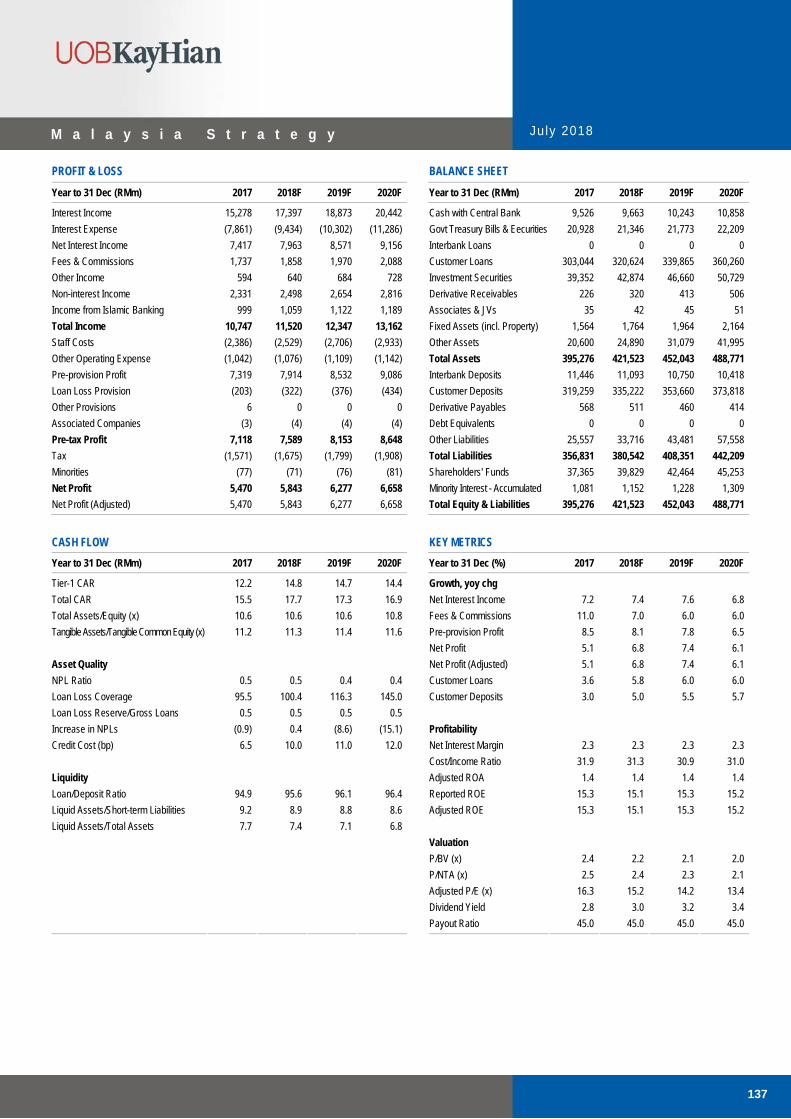
137
M a l a y s i a S t r a t e g y July 2018
PROFIT & LOSS BALANCE SHEET
Year to 31 Dec (RMm) 2017 2018F 2019F 2020F Year to 31 Dec (RMm) 2017 2018F 2019F 2020F
Interest Income 15,278 17,397 18,873 20,442 Cash with Central Bank 9,526 9,663 10,243 10,858
Interest Expense (7,861) (9,434) (10,302) (11,286) Govt Treasury Bills & Eecurities 20,928 21,346 21,773 22,209
Net Interest Income 7,417 7,963 8,571 9,156 Interbank Loans 0 0 0 0
Fees & Commissions 1,737 1,858 1,970 2,088 Customer Loans 303,044 320,624 339,865 360,260
Other Income 594 640 684 728 Investment Securities 39,352 42,874 46,660 50,729
Non-interest Income 2,331 2,498 2,654 2,816 Derivative Receivables 226 320 413 506
Income from Islamic Banking 999 1,059 1,122 1,189 Associates & JVs 35 42 45 51
Total Income 10,747 11,520 12,347 13,162 Fixed Assets (incl. Property) 1,564 1,764 1,964 2,164
Staff Costs (2,386) (2,529) (2,706) (2,933) Other Assets 20,600 24,890 31,079 41,995
Other Operating Expense (1,042) (1,076) (1,109) (1,142) Total Assets 395,276 421,523 452,043 488,771
Pre-provision Profit 7,319 7,914 8,532 9,086 Interbank Deposits 11,446 11,093 10,750 10,418
Loan Loss Provision (203) (322) (376) (434) Customer Deposits 319,259 335,222 353,660 373,818
Other Provisions 6 0 0 0 Derivative Payables 568 511 460 414
Associated Companies (3) (4) (4) (4) Debt Equivalents 0 0 0 0
Pre-tax Profit 7,118 7,589 8,153 8,648 Other Liabilities 25,557 33,716 43,481 57,558
Tax (1,571) (1,675) (1,799) (1,908) Total Liabilities 356,831 380,542 408,351 442,209
Minorities (77) (71) (76) (81) Shareholders' Funds 37,365 39,829 42,464 45,253
Net Profit 5,470 5,843 6,277 6,658 Minority Interest - Accumulated 1,081 1,152 1,228 1,309
Net Profit (Adjusted) 5,470 5,843 6,277 6,658
Total Equity & Liabilities 395,276 421,523 452,043 488,771
CASH FLOW KEY METRICS
Year to 31 Dec (RMm) 2017 2018F 2019F 2020F Year to 31 Dec (%) 2017 2018F 2019F 2020F
Tier-1 CAR 12.2 14.8 14.7 14.4 Growth, yoy chg
Total CAR 15.5 17.7 17.3 16.9 Net Interest Income 7.2 7.4 7.6 6.8
Total Assets/Equity (x) 10.6 10.6 10.6 10.8 Fees & Commissions 11.0 7.0 6.0 6.0
Tangible Assets/Tangible Common Equity (x) 11.2 11.3 11.4 11.6 Pre-provision Profit 8.5 8.1 7.8 6.5
Net Profit 5.1 6.8 7.4 6.1
Asset Quality Net Profit (Adjusted) 5.1 6.8 7.4 6.1
NPL Ratio 0.5 0.5 0.4 0.4 Customer Loans 3.6 5.8 6.0 6.0
Loan Loss Coverage 95.5 100.4 116.3 145.0 Customer Deposits 3.0 5.0 5.5 5.7
Loan Loss Reserve/Gross Loans 0.5 0.5 0.5 0.5
Increase in NPLs (0.9) 0.4 (8.6) (15.1) Profitability
Credit Cost (bp) 6.5 10.0 11.0 12.0 Net Interest Margin 2.3 2.3 2.3 2.3
Cost/Income Ratio 31.9 31.3 30.9 31.0
Liquidity Adjusted ROA 1.4 1.4 1.4 1.4
Loan/Deposit Ratio 94.9 95.6 96.1 96.4 Reported ROE 15.3 15.1 15.3 15.2
Liquid Assets/Short-term Liabilities 9.2 8.9 8.8 8.6 Adjusted ROE 15.3 15.1 15.3 15.2
Liquid Assets/Total Assets 7.7 7.4 7.1 6.8
Valuation
P/BV (x) 2.4 2.2 2.1 2.0
P/NTA (x) 2.5 2.4 2.3 2.1
Adjusted P/E (x) 16.3 15.2 14.2 13.4
Dividend Yield 2.8 3.0 3.2 3.4
Payout Ratio 45.0 45.0 45.0 45.0

138
M a l a y s i a S t r a t e g y July 2018
Tenaga Nasional (TNB MK)
BACKGROUND
Tenaga Nasional (TNB) is the sole offtaker of electricity in Peninsular Malaysia. It has a 57% share of Peninsular Malaysia’s electricity generation market. In addition, the company controls the transmission and distribution of electricity to some 9m customers in the industrial, commercial and residential segments. TNB also owns 80% of Sabah Electricity.
OUTLOOK/RECOMMENDATION
Energy reforms promote efficiency… A regulatory meeting reaffirms our view that the government is committed to carrying out energy reforms, including the gas subsidy rationalisation programme. As such, we believe the government will continue to subscribe to the Incentive Based Regulation (IBR), which promotes asset efficiency. In addition, we believe the stabilisation fund is sufficient for the government to pay for imbalance cost pass-through (ICPT) surcharges in the next three years (assuming coal and gas prices continue to rise). This bodes well for TNB.
...and this bodes well for TNB, lifting regulatory overhang on the stock. More importantly, the government recently approved a 1.35 sen/kwh electricity tariff hike for the commercial and industrial segments (which account for 75% of users). This allows TNB to recover the higher coal costs incurred in 1H18 via the ICPT mechanism. We believe TNB stands to benefit from policy clarity as regulatory risk dissipates. To recap, the ICPT mandates that TNB returns/claws back uncontrollable fuel price fluctuations (coal, gas, LNG), and anchors TNB’s future earnings sustainability and predictability.
Cash flow prowess under IBR paves the way for sustainable dividends. The IBR framework promotes a sustainable dividend payout for TNB. From 2018, TNB aims to distribute 30-60% of core PATAMI as dividends. Management alluded that this range is sustainable while maintaining an efficient capital structure to sufficiently cater to business prospects. We are positive on the above development and expect the market to reward TNB for the active capital management. Importantly, we opine this fundamental change will convince the market that a more sustainable dividend yield for TNB is in the region of 4-5%.
Maintain BUY with a DCF-based target price of RM17.70. Following the change in the government, share price has dropped >10%. This reflects concerns over the validity of both the IBR and ICPT under the new administration. The government remains committed to energy reforms. The stock is attractive at 11.5x FY18F earnings and offers a sustainable dividend yield of 5%. At our DCF-based target price, the stock would trade at 15x FY19F PE and 8x EV/EBTIDA – a fair valuation, given good earnings visibility, sustainable dividend yields and market liquidity.
KEY FINANCIALS
Year to 31 Dec (RMm) 2016 2017 2018F 2019F 2020F Net Turnover 44,532 47,417 48,630 49,569 50,106 EBITDA 14,826 15,491 15,854 16,486 16,931 Operating Profit 9,104 9,386 9,635 10,167 10,517 Net Profit (Reported/Actual) 7,368 6,491 6,971 6,815 7,060 Net Profit (Adjusted) 7,758 7,330 6,971 6,815 7,060 EPS (sen) 137.5 129.9 123.5 120.7 125.1 PE (x) 10.5 11.1 11.7 11.9 11.5 P/B (x) 1.6 1.4 1.4 1.3 1.2 EV/EBITDA (x) 7.8 7.5 7.3 7.0 6.8 Dividend Yield (%) 2.2 4.2 5.0 5.0 5.2 Net Margin (%) 16.5 13.7 14.3 13.7 14.1 Net Debt/(Cash) to Equity (%) 57.9 59.2 55.1 51.1 47.1 Interest Cover (x) 20.0 12.7 11.9 11.5 11.3 ROE (%) 14.8 11.9 11.9 11.1 11.0 Consensus Net Profit - - 7,239 7,219 7,351 UOBKH/Consensus (x) - - 0.96 0.94 0.96 Source: TNB, Bloomberg, UOB Kay Hian
BUY
(Maintained)
Share Price RM14.30
Target Price RM17.70
Upside +23.8%
COMPANY DESCRIPTION
Generates and distributes electricity in Peninsular Malaysia and Sabah.
STOCK DATA
GICS sector Utilities
Bloomberg ticker TNB MK
Shares issued (m) 5,678.2
Market cap (RMm) 81,198.0
Market cap (US$m) 20,158.4
3-mth avg daily turnover (US$m) 47.6
Price Performance (%) 52-week high/low RM16.24/RM13.66
1mth 3mth 6mth 1yr YTD
(2.2) (9.9) (9.9) 1.3 (6.3)
Major Shareholders %Khazanah Nasional 32.4
EPF 12.1
Skim Amanah Saham Bumiputera 8.4
FY18 NAV/Share (RM) 10.63FY18 Net Debt/Share (RM) 5.86
PRICE CHART
Source: Bloomberg ANALYST
Chong Lee Len +603-2147 1992 [email protected]
90
100
110
120
130
140
18
20
22
24
26
28
(%)(lcy) PUBLIC BANK BERHAD PUBLIC BANK BERHAD/FBMKLCI INDEX
0
10
20
30
Jul 17 Sep 17 Nov 17 Jan 18 Mar 18 May 18 Jul 18
Volume (m)

139
M a l a y s i a S t r a t e g y July 2018
PROFIT & LOSS BALANCE SHEET
Year to 31 Dec (RMm) 2017 2018F 2019F 2020F Year to 31 Dec (RMm) 2017 2018F 2019F 2020F
Net turnover 47,417 48,630 49,569 50,106 Fixed Assets 103,084 104,864 106,544 108,131
EBITDA 15,491 15,854 16,486 16,931 Other LT Assets 11,408 11,523 11,642 11,765
Depreciation & Amortisation 6,105 6,220 6,320 6,414 Cash/ST Investment 5,056 5,790 6,621 7,578
EBIT 9,386 9,635 10,167 10,517 Other Current Assets 22,465 22,715 22,909 23,020
Total Other Non-operating Income 0 0 0 0 Total Assets 142,012 144,892 147,717 150,494
Associate Contributions 128 115 119 123 ST Debt 1,808 1,808 1,708 1,608
Net Interest Income/(Expense) (1,218) (1,336) (1,429) (1,501) Other Current Liabilities 13,518 13,378 13,569 13,678
Pre-tax Profit 7,869 8,414 8,857 9,139 LT Debt 37,038 37,038 36,938 36,838
Tax (1,370) (1,435) (2,034) (2,071) Other LT Liabilities 32,063 32,192 32,293 32,350
Minorities (8) (8) (8) (8) Shareholders' Equity 57,111 59,993 62,719 65,521
Net Profit 6,491 6,971 6,815 7,060 Minority Interest 473 482 490 498
Net Profit (Adjusted) 7,330 6,971 6,815 7,060
Total Liabilities & Equity 142,012 144,892 147,717 150,494
CASH FLOW KEY METRICS
Year to 31 Dec (RMm) 2017 2018F 2019F 2020F Year to 31 Dec (%) 2017 2018F 2019F 2020F
Operating 12,559 14,158 14,549 14,916 EBITDA Margin 32.7 32.6 33.3 33.8
Pre-tax Profit 8,282 8,414 8,857 9,139 Pre-tax Margin 16.6 17.3 17.9 18.2
Tax (1,370) (1,435) (2,034) (2,071) Net Margin 13.7 14.3 13.7 14.1
Depreciation & Amortisation 6,105 6,220 6,320 6,414 ROA 4.7 4.9 4.7 4.7
Associates (128) (115) (119) (123) ROE 11.9 11.9 11.1 11.0
Working Capital Changes (1,364) (261) 97 56
Non-cash Items 0 0 0 0 Growth
Other Operating Cashflows 1,033 1,336 1,429 1,501 Turnover 6.5 2.6 1.9 1.1
Investing (12,685) (7,675) (7,628) (7,574) EBITDA 4.5 2.3 4.0 2.7
Capex (Growth) (12,520) (8,000) (8,000) (8,000) Pre-tax Profit (2.5) 6.9 5.3 3.2
Investments 1,158 0 0 0 Net Profit (11.9) 7.4 (2.2) 3.6
Others (1,324) 325 372 426 Net Profit (Adjusted) (5.5) (4.9) (2.2) 3.6
Financing 1,227 (5,750) (6,090) (6,385) EPS (5.5) (4.9) (2.2) 3.6
Dividend Payments (2,206) (4,089) (4,089) (4,258)
Issue of Shares 5,481 0 0 0 Leverage
Proceeds from Borrowings 4,540 0 (200) (200) Debt to Total Capital 40.3 39.1 37.9 36.8
Others/Interest Paid (6,589) (1,661) (2,001) (2,127) Debt to Equity 68.0 64.8 61.6 58.7
Net Cash Inflow (Outflow) 1,100 733 832 957 Net Debt/(Cash) to Equity 59.2 55.1 51.1 47.1
Beginning Cash & Cash Equivalent 3,971 5,056 5,790 6,621 Interest Cover (x) 12.7 11.9 11.5 11.3
Changes Due to Forex Impact (15) 0 0 0
Ending Cash & Cash Equivalent 5,056 5,790 6,621 7,578

140
M a l a y s i a S t r a t e g y July 2018
Cahya Mata Sarawak (CMS MK) BACKGROUND
Amid concerns of political risk which we think are overblown, Cahya Mata Sarawak’s (CMS) earnings outlook remains bright with OM Sarawak (OMS) expected to turn around significantly in 2018. Concession on state road maintenance has been extended for another year while construction of the Malaysian Phosphate Additives (Sarawak) Sdn Bhd (MPAS) plant is slated to commence in Jul 18. Maintain BUY and target price of RM4.00 which implies 13.6x PE based on 2019F EPS.
OUTLOOK/RECOMMENDATION
Significant earnings turnaround from OMS. Earnings is expected to improve remarkably in 2018 and beat consensus primarily driven by OMS’ maiden profit contribution. ASPs for manganese and ferroalloys have surged from an average of US$900/tonne in 2017 to US$1,400/tonne currently – thanks to lower output from China. We believe that demand and ASP for manganese and ferroalloys at OMS will continue to be sustainable, largely attributable to a cleaner source of energy used in its production coupled with lower electricity prices as a result of long-term power supply agreements.
Extension of road maintenance concession for another year. The concession for road maintenance for state roads has been extended for another year starting Jul 18. Although this is below their initial expectation of a 15-year extension, CMS remains hopeful that when the dust has settled, they will be able to secure a longer contract extension upon expiry of the current concession agreement. This will be largely backed by its good track record, heavy investment in machineries worth over RM100m, and reliance on Sarawakians (employs over 800 local people).
MPAS on track for commissioning. We are positively surprised that the much-awaited MPAS plant is finally gaining momentum as CMS could start the construction as early as Jul 18. Recall that CMS’ 40% stake in MPAS could enhance shareholder value by 10%. The plant, which is located in Bintulu, will house an annual capacity of 1.5 MT of food, feed and fertiliser phosphates, making it the largest plant in Southeast Asia.
No risk of Pan Borneo Highway cancellation. While other mega and infrastructure projects are under review and facing risks of cancellation or deferment, we understand that the Pan Borneo Highway (especially in Sarawak) will continue as planned although there could be delays in Sabah’s portion.
Maintain BUY and target price of RM4.00 based on 25% holding company discount to our SOTP valuation, which implies 13.6x PE based on 2019F EPS. We also imputed a 23 sen “option value” for MPAS (assumption: 50% success rate, RM1.4b investment cost) from a NPV of RM490.1m based on CMS’ 40% stake.
KEY FINANCIALS
Year to 31 Dec (RMm) 2016 2017 2018F 2019F 2020F
Net Turnover 1,552 1,607 1,666 1,755 1,831 EBITDA 397 353 404 415 431 Net Profit (Adjusted) 169 260 314 318 332 EPS (sen) 15.7 24.2 29.3 29.6 30.9 PE (x) 15.4 9.9 8.3 8.2 7.8 P/B (x) 1.2 1.1 1.0 1.0 0.9 EV/EBITDA (x) 6.8 7.3 5.4 4.1 2.8 Dividend Yield (%) 2.6 3.3 4.8 4.9 5.1 Net Margin (%) 10.9 16.2 18.9 18.1 18.1 Net Debt/(Cash) to Equity (%) (9.5) (14.5) (31.4) (48.7) (64.1) Interest Cover (x) 31.8 12.5 14.5 14.8 15.4 ROE (%) 7.6 11.0 12.4 11.6 11.3 Consensus Net Profit - - 276 297 315 UOBKH/Consensus (x) - - 1.1 1.1 1.1
Source: CMS, UOB Kay Hian
BUY
(Maintained)
Share Price RM2.42 Target Price RM4.00 Upside +64.6%
COMPANY DESCRIPTION Infrastructure conglomerate in Sarawak. Diversifying income stream from renewable energy banking on lower electricity cost.
STOCK DATA GICS sector Materials
Bloomberg ticker CMS MK
Shares issued (m) 1,071.1
Market cap (RMm) 2,603.0
Market cap (US$m) 642.9
3-mth avg daily t'over (US$m) 2.1
Price Performance (%)
52-week high/low RM4.42/RM1.741mth 3mth 6mth 1yr YTD
(8.0) (34.3) (37.9) (39.3) (37.1)
Major Shareholders %Majaharta Sdn Bhd 12.6
Employees Provident Fund Board 10.9
Taib Lejla 10.4
FY17 NAV/Share (RM) 2.13FY17 Net Debt/Share (RM) 0.32
PRICE CHART
Source: Bloomberg
ANALYST
Abdul Hadi Manaf +603 2147 1971 [email protected]
80
90
100
110
120
1.20
1.30
1.40
1.50
1.60
1.70
1.80
(%)(lcy) YONG TAI BHD YONG TAI BHD/FBMKLCI INDEX
0
5
10
15
20
Jul 17 Sep 17 Nov 17 Jan 18 Mar 18 May 18 Jul 18
Volume (m)

141
M a l a y s i a S t r a t e g y July 2018
PROFIT & LOSS BALANCE SHEET
Year to 31 Dec (RMm) 2017 2018F 2019F 2020F Year to 31 Dec (RMm) 2017 2018F 2019F 2020F
Net turnover 1,607 1,666 1,755 1,831 Fixed Assets 728 777 814 848
EBITDA 353 404 415 431 Other LT Assets 1,329 1,228 1,228 1,228
Depreciation & Amortisation (56) (61) (64) (67) Cash/ST Investment 978 1,433 1,968 2,515
EBIT 297 343 351 365 Other Current Assets 1,050 914 946 973
Net Interest Income/(Expense) 1 8 2 5 Total Assets 4,085 4,351 4,955 5,563
Pre-tax Profit 372 476 479 498 ST Debt 52 52 52 52
Tax (84) (91) (90) (93) Other Current Liabilities 646 674 1,038 1,395
Net Profit 215 336 339 353 LT Debt 585 585 585 585
Net Profit (Adjusted) 260 314 318 332 Other LT Liabilities 118 118 118 118
Shareholders' Equity 2,352 2,540 2,731 2,930
Minority Interest 333 382 432 484
Total Liabilities & Equity 4,085 4,351 4,955 5,563
CASH FLOW KEY METRICS
Year to 31 Dec (RMm) 2017 2018F 2019F 2020F Year to 31 Dec (%) 2017 2018F 2019F 2020F
Operating 283 328 357 375 Profitability
Pre-tax Profit 333 454 458 477 EBITDA Margin 22 24 24 24
Tax (77) (91) (90) (93) Pre-tax Margin 23 29 27 27
Depreciation & Amortisation 56 61 64 67 Net Margin 16 20 19 19
Working Capital Changes 45 (23) (1) (2) ROA 6 7 6 6
Other Operating Cashflows (74) (74) (74) (74) ROE 11 12 12 11
Investing (57) (95) (95) (95)
Capex (Maintenance) (62) (100) (100) (100) Growth
Investments (3) (3) (3) (3) Turnover 4 4 5 4
Proceeds from Sale of Assets 1 1 1 1 EBITDA -11 15 3 4
Others 7 7 7 7 Pre-tax Profit 10 37 1 4
Financing 295 226 276 271 Net Profit 27 46 1 4
Distribution to Unitholders (91) (126) (127) (133) Net Profit (Adjusted) 53 21 1 4
Issue of Shares 0 0 0 0 EPU 53 21 1 4
Proceeds from Borrowings (115) (150) (100) (100)
Loan Repayment 1 2 3 4 Leverage
Others/Interest Paid 500 500 500 500 Debt to Total Capital 16 15 13 11
Net Cash Inflow (Outflow) 522 459 538 551 Debt to Equity 27 25 23 22
Beginning Cash & Cash Equivalent 528 1,050 1,509 2,047 Net Debt/(Cash) to Equity -15 -31 -49 -64
Changes Due to Forex Impact 0 0 0 0 Interest Cover (x) 12.5 14.5 14.8 15.4
Ending Cash & Cash Equivalent 1,050 1,509 2,047 2,598

142
M a l a y s i a S t r a t e g y July 2018
Gabungan AQRS (AQRS MK) BACKGROUND
Gabungan AQRS’ (GAQRS) primary business involves the construction of buildings and infrastructure. It also has exposure to property development in Kota Kinabalu and Johor Bahru. GAQRS underwent massive restructuring changes in 2016 with new shareholders and CEO coming on board. Since the restructuring, the group has secured over RM3b of new construction orders. AQRS is expected to be one of the front-runners for the East Coast Rail Line (ECRL) and the Sabah portion of the Pan Borneo Highway (PBHS).
OUTLOOK/RECOMMENDATION
Optimistic on ECRL and PBHS proceeding. Despite the temporary stop work order by MRL to the main contractor CCCC recently, we strongly believe this is to facilitate negotiations between the involved parties and is expected to proceed subject to better contract terms agreed such as: a) lower construction cost, and b) better direct and indirect participation of Malaysian companies in the project and an addition of RM20b on top of what has been paid. GAQRS remains optimistic PBHS would also proceed.
Improving balance sheet raises ability to reward shareholders. A modest net gearing (0.06x in 1Q18) and expected strong cash flows from property projects create an enviable position for GAQRS to reward shareholders. Its two key property projects could yield cumulative net cash flows of >RM500m through 2021, close to GAQRS’ market cap. Besides, GAQRS could raise additional cash proceeds from its outstanding warrants. Warrant A (Expiry date: 20 Jul 18 @ RM1.30) could raise up to RM149m (assuming full conversion). There is also the proposed bonus issue of 1-for-4 Warrant B (Exercise price and issuance size – subject to conversion of Warrant A; to be determined at a later date). Both warrants will further strengthen the company’s overall balance sheet.
Ample outstanding orderbook of RM2.7b (2.5x 2018F revenue cover). We estimate outstanding construction orderbook as of 31 Mar 18 at RM2.7b, representing a 2.5x orderbook cover compared with 2018 revenue. Ytd, the group has secured about RM60m worth of works, ie the recent sub-contract works for the Sungai Besi-Ulu Kelang highway. We expect AQRS to recognise RM980m, RM1.1b and RM1.1b in construction revenue in 2018-20 respectively, with margins at 11.0-12.5%.
E’Island to propel property division’s earnings. We project the property division’s earnings to jump to RM37m in 2020 (22% of group PBT). We expect brisk demand for E’Island Residence condominium with 80% of units priced around RM350,000/unit, well below the neighbouring condominium developments’ net pricing of >RM500 psf (E’Island units are semi-furnished whereas the neighbouring condominiums are delivered bare). Other attractions include its low density and lake view frontage. The company expects E’Island to deliver 20% PBT margin given its low land cost (10% of GDV) and waiver obtained on the need to comply with Rumah Selangorku’s low-cost housing quota. The group’s construction arm is also expected to benefit as physical construction works will be done in-house.
Maintain BUY with a target price of RM1.86 based on 10x its 2019 fully-diluted EPS of 19 sen. Key catalysts for the stock would be new, large construction orders in 2H18.
KEY FINANCIALS
Year to 31 Dec (RMm) 2016 2017 2018F 2019F 2020F
Net Turnover 330.1 469.4 1,072.9 1,329.1 1,358.6 EBITDA 87.6 143.1 234.3 299.8 312.3 Operating Profit 58.9 94.4 128.3 165.2 178.4 Net Profit (Reported/Actual) 22.6 48.1 83.0 109.5 120.0 Net Profit (Adjusted) 22.6 35.7 83.0 109.5 120.0 EPS (sen) 5.8 6.0 14.1 18.6 20.3 PE (x) 20.6 19.7 8.5 6.4 5.9 P/B (x) 1.4 1.5 1.3 1.1 1.0 Dividend Yield (%) 0.0 1.7 3.5 4.7 5.1 Net Margin (%) 6.8 10.2 7.7 8.2 8.8 Net Debt/(Cash) to Equity (%) 68.5 11.1 2.2 (1.1) (9.8) Interest Cover (x) 3.9 7.9 13.4 21.5 30.0 ROE (%) 6.6 10.4 15.7 17.8 17.0 Consensus Net Profit - - 71.4 92.8 126.0 UOBKH/Consensus (x) - - 1.2 1.2 1.0 Source: GAQRS, Bloomberg, UOB Kay Hian
BUY
(Maintained)
Share Price RM1.19 Target Price RM1.86 Upside +56.3%
COMPANY DESCRIPTION Integrated construction company that offers comprehensive end-to-end construction solutions for infrastructure and civil works. Also involved in property development.
STOCK DATA GICS sector Industrials
Bloomberg ticker AQRS MK
Shares issued (m) 454.9
Market cap (RMm) 541.3
Market cap (US$m) 133.7
3-mth avg daily t'over (US$m) 1.6
Price Performance (%)
52-week high/low RM2.16/RM0.62
1mth 3mth 6mth 1yr YTD
41.2 (26.5) (40.4) (8.6) (35.8)
Major Shareholders %Dato’ Azizan Jaafar 11.4
Dato’ Paul Ow Chee Cheoon 7.3
FY17 NAV/Share (RM) 0.78FY17 Net Debt/Share (RM) 0.09
PRICE CHART
Source: Bloomberg
ANALYST Vincent Khoo, CFA +603 2147 1998 [email protected]
40
60
80
100
120
140
160
180
0.50
1.00
1.50
2.00
2.50
(%)(lcy) GABUNGAN AQRS BHD GABUNGAN AQRS BHD/FBMKLCI INDEX
0
20
40
60
Jul 17 Sep 17 Nov 17 Jan 18 Mar 18 May 18 Jul 18
Volume (m)

143
M a l a y s i a S t r a t e g y July 2018
PROFIT & LOSS BALANCE SHEET
Year to 31 Dec (RMm) 2017 2018F 2019F 2020F Year to 31 Dec (RMm) 2017 2018F 2019F 2020F
Net Turnover 469 1,073 1,329 1,359 Fixed Assets 70 68 92 111
EBITDA 143 234 300 312 Other LT Assets 66 44 48 52
Depreciation & Amortisation 15 12 12 16 Cash/ST Investment 137 136 115 137
EBIT 94 128 165 178 Other Current Assets 851 933 943 946
Associate Contributions 0 0 0 0 Total Assets 1,124 1,182 1,197 1,246
Net Interest Income/(Expense) (12) (10) (8) (6) ST Debt 159 119 79 39
Pre-tax Profit 83 119 158 172 Other Current Liabilities 464 496 466 461
Tax (33) (34) (47) (51) LT Debt 30 30 30 30
Minorities 2 1 1 1 Other LT Liabilities 2 2 2 2
Net Profit 48 83 109 120 Shareholders' Equity 463 528 613 707
Net Profit (Adjusted) 36 83 109 120 Minority Interest 8 8 8 8
Total Liabilities & Equity 1,125 1,182 1,197 1,246
CASH FLOW KEY METRICS
Year to 31 Dec (RMm) 2017 2018F 2019F 2020F Year to 31 Dec (%) 2017 2018F 2019F 2020F
Operating 149 223 77 124 Profitability
Pre-tax Profit 83 119 158 172 EBITDA Margin 30.5 21.8 22.6 23.0
Tax (14) (34) (47) (51) Pre-tax Margin 17.6 11.1 11.9 12.7
Depreciation & Amortisation (15) (12) (12) (16) Net Margin 10.2 7.7 8.2 8.8
Working Capital Changes 54 141 (32) 8 ROA 4.3 7.0 9.1 9.6
Other Operating Cashflows 41 10 10 10 ROE 10.4 15.7 17.8 17.0
Investing (20) (10) (35) (35)
Capex (Growth) (2) (10) (35) (35) Growth
Investments 0 0 0 0 Turnover 42.2 128.5 23.9 2.2
Proceeds from Sale of Assets 0 0 0 0 EBITDA 63.4 63.7 27.9 4.2
Others (18) 0 0 0 Pre-tax Profit 89.4 43.6 32.7 9.5
Financing (109) (58) (64) (66) Net Profit 113.1 72.6 32.0 9.6
Dividend Payments 0 (18) (24) (26) Net Profit (Adjusted) 58.1 132.6 32.0 9.6
Issue of Shares 54 0 0 0 EPS 4.7 132.6 32.0 9.6
Proceeds from Borrowings 1 0 0 0
Loan Repayment (152) (40) (40) (40) Leverage
Others/Interest Paid (12) 0 0 0 Debt to Total Capital 16.7 12.5 9.0 5.5
Net Cash Inflow (Outflow) 20 155 (22) 22 Debt to Equity 40.6 28.1 17.6 9.6
Beginning Cash & Cash Equivalent (38) (19) 136 115 Net Debt/(Cash) to Equity 11.1 2.2 (1.1) (9.8)
Changes Due to Forex Impact 0 0 0 0 Interest Cover (x) 7.9 13.4 21.5 30.0
Ending Cash & Cash Equivalent (19) 136 115 137

144
M a l a y s i a S t r a t e g y July 2018
Scientex (SCI MK) BACKGROUND
Scientex is one of the world’s largest producers of industrial stretch film with an export market that covers more than 60 countries. In recent years, it has also emerged as one of Malaysia’s leading manufacturers of consumer packaging products via acquisitions and expansion. Scientex ventured into property development in 1995. Today, the property segment propels the company’s next phase of growth, accounting for 25% and 56% of its revenue and EBIT respectively.
OUTLOOK/RECOMMENDATION
Earnings prospects remain intact despite recent earnings disappointment. 3QFY18 results came in below expectations on weaker-than-expected contribution from the property segment amid lower progress billings and longer-than-expected property approval process prior to the general election. Nevertheless, we are expecting a stronger 4QFY18 core net profit on: a) the maiden contribution from Klang Hock Plastic Industries starting May 18, and b) the property segment’s normalised performance post general election.
Penetrative pricing effect in manufacturing segment should ease. Gross margin in the manufacturing segment dipped 2.8ppt yoy to 11.8% in FY17, primarily attributed to the penetrative pricing strategy adopted to gain market share amid capacity expansion, especially in consumer packaging. That said, we expect margin compression to ease once the biaxially oriented polypropylene plant (BOPP) plant begins to contribute in the coming quarters. Our forecast incorporates a 1.2ppt improvement in FY18 gross margin.
Growing consumer packaging. Scientex has increased its polyethylene (PE) capacity by more than three-fold in three years after completing: a) the installation of additional production lines at its plants in Rawang for RM21m as at end-16; and b) capacity expansion of 24,000 MT p.a. (for RM50m) at its Ipoh plant (Scientex Great Wall Ipoh). Consequently, annual PE output has increased to 84,000MT p.a. Management intends to install a third BOPP line in the new plant in FY18-19, which should subsequently raise capacity to about 100,000MT p.a.
Maintain BUY and SOTP-based target price of RM8.20 based on 14x FY19F PE for the manufacturing segment and RNAV methodology for the property segment. Our target price implies 11.1x FY19F PE. We continue to believe Scientex’s long-term prospects are promising, attributed to greater economies of scale at its manufacturing segment post acquisitions and landbank expansion to support the property segment.
KEY FINANCIALS
Year to 31 Jul (RMm) 2016 2017 2018F 2019F 2020F Net Turnover 2,201 2,043 2,620 3,595 4,357 EBITDA 367 388 447 544 606 Operating Profit 313 325 374 471 533 Net Profit (Reported/Actual) 241 256 290 363 413 Net Profit (Adjusted) 248 258 290 363 413 EPS (sen) 53.9 53.3 60.0 75.1 85.3 PE (x) 13.3 13.4 11.9 9.5 8.4 P/B (x) 2.8 2.3 2.0 1.7 1.5 EV/EBITDA (x) 10.6 10.1 8.7 7.2 6.4 Dividend Yield (%) 2.1 2.2 2.5 3.1 3.6 Net Margin (%) 10.9 12.5 11.1 10.1 9.5 Net Debt/(Cash) to Equity (%) 31.6 18.0 19.2 7.2 4.9 Interest Cover (x) 26.9 27.7 34.6 47.1 59.4 ROE (%) 22.8 18.9 17.7 19.5 19.3 Consensus Net Profit - - 274 318 364 UOBKH/Consensus (x) - - 1.06 1.14 1.13 Source: Scientex, Bloomberg, UOB Kay Hian
BUY
(Maintained)
Share Price RM7.16
Target Price RM8.20
Upside +14.5%
COMPANY DESCRIPTION
One of the largest industrial packaging companies in the world and a niche property developer in southern Malaysia.
STOCK DATA
GICS sector Materials
Bloomberg ticker SCI MK
Shares issued (m) 488.9
Market cap (RMm) 3,500.7
Market cap (US$m) 865.9
3-mth avg daily turnover (US$m) 0.5
Price Performance (%) 52-week high/low RM9.80/RM6.55
1mth 3mth 6mth 1yr YTD
2.3 (8.3) (21.5) (17.1) (17.3)
Major Shareholders %Scientex Holdings Sdn Bhd 21.37
Scientex Leasing Sdn Bhd 9.65
Lim Teck Meng Sdn Bhd 7.91
FY16 NAV/Share (RM) 3.60FY16 Net Debt/Share (RM) 0.69
PRICE CHART
Source: Bloomberg ANALYST
Malaysia Research Team +603 2147 1988 [email protected]
70
80
90
100
110
120
130
6.00
7.00
8.00
9.00
0.00
1.00
(%)(lcy) SCIENTEX BHD SCIENTEX BHD/FBMKLCI INDEX
0
1
2
3
Jul 17 Sep 17 Nov 17 Jan 18 Mar 18 May 18 Jul 18
Volume (m)

145
M a l a y s i a S t r a t e g y July 2018
PROFIT & LOSS BALANCE SHEET
Year to 31 Jul (RMm) 2017 2018F 2019F 2020F Year to 31 Jul (RMm) 2017 2018F 2019F 2020F
Net Turnover 2,043 2,620 3,595 4,357 Fixed Assets 1,013 1,143 1,150 1,137
EBITDA 388 447 544 606 Other LT Assets 612 798 818 819
Depreciation & Amortisation 63 73 73 73 Cash/ST Investment 192 96 197 229
EBIT 325 374 471 533 Other Current Assets 761 770 990 1,282
Associate Contributions 7 7 7 7 Total Assets 2,578 2,808 3,155 3,467
Net Interest Income/(Expense) (14) (13) (12) (10) ST Debt 301 250 200 200
Pre-tax Profit 318 368 466 530 Other Current Liabilities 442 496 674 690
Tax (58) (74) (98) (111) LT Debt 167 180 140 140
Minorities (4) (4) (6) (6) Other LT Liabilities 64 70 70 71
Net Profit 256 290 363 413 Shareholders' Equity 1,535 1,739 1,993 2,282
Net Profit (Adjusted) 258 290 363 413 Minority Interest 68 73 78 85
Total Liabilities & Equity 2,578 2,808 3,155 3,467
CASH FLOW KEY METRICS
Year to 31 Jul (RMm) 2017 2018F 2019F 2020F Year to 31 Jul (%) 2017 2018F 2019F 2020F
Operating 323 431 380 215 Profitability
Pre-tax Profit 318 368 466 530 EBITDA Margin 19.0 17.1 15.1 13.9
Tax (70) (74) (98) (111) Pre-tax Margin 15.6 14.1 13.0 12.2
Depreciation & Amortisation 63 73 73 73 Net Margin 12.5 11.1 10.1 9.5
Working Capital Changes 3 63 (62) (276) ROA 10.6 10.8 12.2 12.5
Other Operating Cashflows 8 0 0 0 ROE 18.9 17.7 19.5 19.3
Investing (253) (400) (80) (60)
Capex (Growth) (127) (200) (80) (60) Growth
Investments 0 0 0 0 Turnover (7.2) 28.2 37.2 21.2
Proceeds from Sale of Assets 0 0 0 0 EBITDA 5.8 15.2 21.7 11.3
Others (126) (200) 0 0 Pre-tax Profit 3.8 15.9 26.6 13.6
Financing 22 (126) (199) (124) Net Profit 6.2 13.5 25.0 13.6
Dividend Payments (106) (87) (109) (124) Net Profit (Adjusted) 4.0 12.6 25.0 13.6
Issue of Shares 154 0 0 0 EPS (1.1) 12.6 25.0 13.6
Proceeds from Borrowings 85 0 0 0
Loan Repayment (92) (38) (90) 0 Leverage
Others/Interest Paid (19) (2) 0 0 Debt to Total Capital 22.6 19.2 14.1 12.6
Net Cash Inflow (Outflow) 91 (96) 101 32 Debt to Equity 30.5 24.7 17.1 14.9
Beginning Cash & Cash Equivalent 101 192 96 197 Net Debt/(Cash) to Equity 18.0 19.2 7.2 4.9
Changes Due to Forex Impact 0 0 0 0 Interest Cover (x) 27.7 34.6 47.1 59.4
Ending Cash & Cash Equivalent 192 96 197 229

146
M a l a y s i a S t r a t e g y July 2018
Serba Dinamik Holdings (SDH MK) BACKGROUND
Serba Dinamik Holdings (Serba) is a global integrated service provider of operation and maintenance (O&M) and engineering, procurement, construction and commissioning (EPCC) services. O&M is its bread and butter (>85% of revenue), encompassing maintenance, repair and overhaul (MRO) of rotating equipment, and inspection, repair and maintenance (IRM) of static equipment. The group also executes EPCC of plants and facilities. The Middle East remains the key contributing region for the group, accounting for 59% of overall 2017 revenue (2016: 51%), while Malaysia’s stood at 32% (2016: 36%).
OUTLOOK/RECOMMENDATION
More upside in future earnings. Leveraging on its proven track record for an extremely high renewal rate (>90%) for its existing O&M orderbook, as well as consistency in profit margins, Serba expects to capture more growth and diversification by: a) securing more contracts to meet its target RM7.5b orderbook by end-18, and b) clinching more asset ownership projects to meet its target to own 200MW of equity-accounted power capacities by end-18 (current: 89.1MW). The latter will not only help Serba gain new O&M/EPCC contracts, but also contribute to its long-term recurring income stream and diversification to utilities/renewable energy.
New investments to drive JV income from 2Q18 and IoT. The recent 49% associate investment in Al-Sagar gives access to Al-Sagar’s testing facility for pump equipment and complements Serba’s service offerings in the Middle East. The 25% investment in CSE Global opens doors for Serba to penetrate the US and Australia markets. Moreover, CSE Global’s track record as a leading system integrator and automation will elevate Serba’s Internet of Things (IoT) capabilities and Industry 4.0 potential. A recent contract secured involves big data analytics services for Petronas Carigali. Serba will most likely collaborate with its technology partners to perform preventive maintenance solutions by using predictive analysis to identify breakdowns before they occur.
Secured RM1.3b contracts ytd. Orderbook has increased to RM6.6b ytd (2017: RM5.5b), split between RM4.6b for O&M and RM2b for EPCC. The large contracts secured include EPCC contracts for several Maju hydropower plants, and new O&M contracts for the UAE, Bahrain and Kazakhstan. Management is still pursuing other large utility projects (where the EPCC values can go up to RM0.5b each) under its asset ownership strategy. Some of these projects are in Malaysia, Laos and Central Asia.
Maintain BUY with target price of RM4.30, pegged to 12x 2019F PE, at a premium to smaller local peer Deleum given Serba’s superior diversification, earnings growth (20-36% CAGR) and ROE (23%). Our forecast is 3-11% above consensus estimate, which already conservatively assumes significant JV losses and lower US$/RM of 3.80.
KEY FINANCIALS
Year to 31 Dec (RMm) 2016 2017 2018F 2019F 2020F Net Turnover 2,168 2,722 3,352 4,569 5,098 EBITDA 356 451 576 763 852 Operating Profit 303 382 482 644 708 Net Profit (Reported/Actual) 246 308 398 514 556 Net Profit (Adjusted) 275 323 398 514 556 EPS (sen) 18.7 22.0 27.1 35.0 37.9 PE (x) 17.8 15.2 12.3 9.5 8.8 P/B (x) 6.1 3.5 2.4 2.0 1.7 EV/EBITDA (x) 15.9 12.5 9.8 7.4 6.6 Dividend Yield (%) 0.0 2.0 2.4 3.1 3.4 Net Margin (%) 11.4 11.3 11.9 11.2 10.9 Net Debt/(Cash) to Equity (%) 55.9 29.3 36.0 43.4 46.6 Interest Cover (x) 10.2 13.3 12.3 11.0 9.3 ROE (%) 38.5 28.1 23.1 22.8 21.0 Consensus Net Profit - - 388 462 528 UOBKH/Consensus (x) - - 1.03 1.11 1.05
Source: Serba, Bloomberg, UOB Kay Hian
BUY
(Maintained)
Share Price RM3.34 Target Price RM4.30 Upside +28.7%
COMPANY DESCRIPTION
A leader in the operation and maintenance of rotating equipment for downstream and upstream industries, with major revenues coming from the Middle East.
STOCK DATA
GICS sector Energy
Bloomberg ticker: SDH MK
Shares issued (m): 1,468.5
Market cap (RMm): 4,904.8
Market cap (US$m): 1,213.2
3-mth avg daily t'over (US$m): 2.6
Price Performance (%) 52-week high/low RM3.68/RM1.86
1mth 3mth 6mth 1yr YTD
2.1 12.1 (3.2) 67.8 3.1
Major Shareholders %Mohd Abdul Karim Bin Abdullah 25.3
Abdul Kadier Sahib 20.8
Daung Awang Dato 11.7
FY18 NAV/Share (RM) 1.40FY18 Net Debt/Share (RM) 0.51
PRICE CHART
Source: Bloomberg ANALYST
Kong Ho Meng +603 2147 1987 [email protected]
70
90
110
130
150
170
190
1.50
2.00
2.50
3.00
3.50
4.00
(%)(lcy) SERBA DINAMIK HOLDINGS BHD SERBA DINAMIK HOLDINGS BHD/FBMKLCI INDEX
0
10
20
30
Jul 17 Sep 17 Nov 17 Jan 18 Mar 18 May 18 Jul 18
Volume (m)
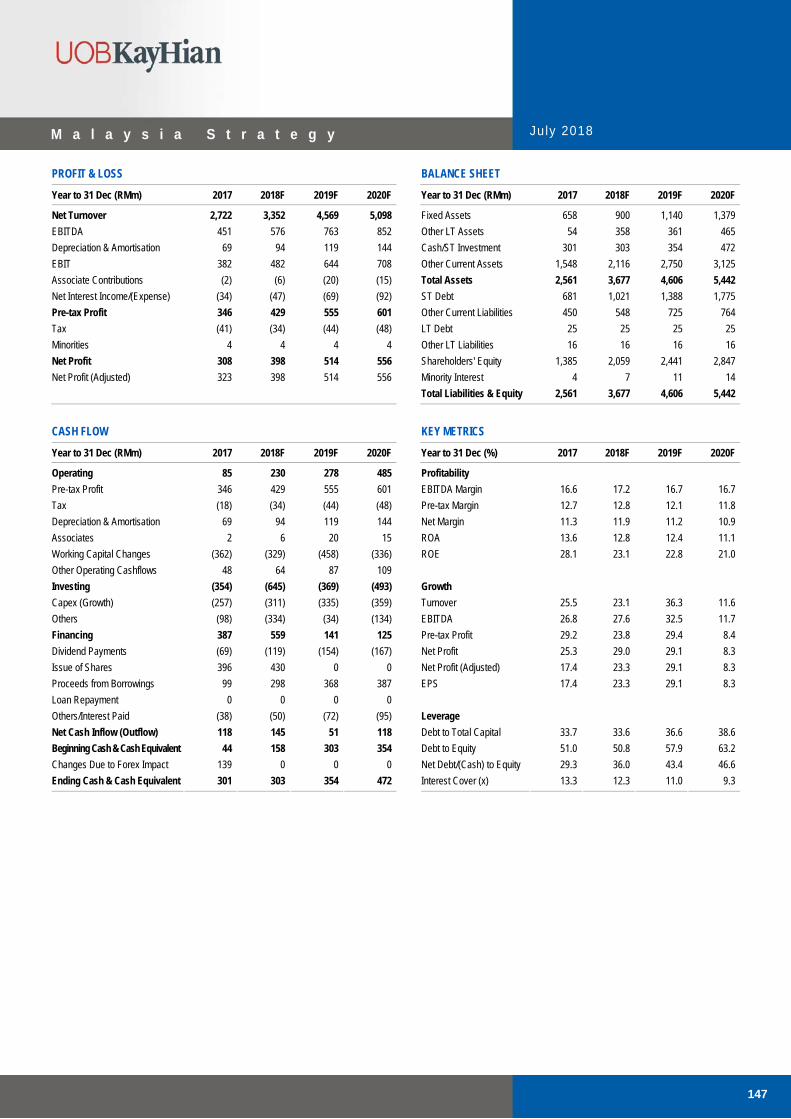
147
M a l a y s i a S t r a t e g y July 2018
PROFIT & LOSS BALANCE SHEET
Year to 31 Dec (RMm) 2017 2018F 2019F 2020F Year to 31 Dec (RMm) 2017 2018F 2019F 2020F
Net Turnover 2,722 3,352 4,569 5,098 Fixed Assets 658 900 1,140 1,379
EBITDA 451 576 763 852 Other LT Assets 54 358 361 465
Depreciation & Amortisation 69 94 119 144 Cash/ST Investment 301 303 354 472
EBIT 382 482 644 708 Other Current Assets 1,548 2,116 2,750 3,125
Associate Contributions (2) (6) (20) (15) Total Assets 2,561 3,677 4,606 5,442
Net Interest Income/(Expense) (34) (47) (69) (92) ST Debt 681 1,021 1,388 1,775
Pre-tax Profit 346 429 555 601 Other Current Liabilities 450 548 725 764
Tax (41) (34) (44) (48) LT Debt 25 25 25 25
Minorities 4 4 4 4 Other LT Liabilities 16 16 16 16
Net Profit 308 398 514 556 Shareholders' Equity 1,385 2,059 2,441 2,847
Net Profit (Adjusted) 323 398 514 556 Minority Interest 4 7 11 14
Total Liabilities & Equity 2,561 3,677 4,606 5,442
CASH FLOW KEY METRICS
Year to 31 Dec (RMm) 2017 2018F 2019F 2020F Year to 31 Dec (%) 2017 2018F 2019F 2020F
Operating 85 230 278 485 Profitability
Pre-tax Profit 346 429 555 601 EBITDA Margin 16.6 17.2 16.7 16.7
Tax (18) (34) (44) (48) Pre-tax Margin 12.7 12.8 12.1 11.8
Depreciation & Amortisation 69 94 119 144 Net Margin 11.3 11.9 11.2 10.9
Associates 2 6 20 15 ROA 13.6 12.8 12.4 11.1
Working Capital Changes (362) (329) (458) (336) ROE 28.1 23.1 22.8 21.0
Other Operating Cashflows 48 64 87 109
Investing (354) (645) (369) (493) Growth
Capex (Growth) (257) (311) (335) (359) Turnover 25.5 23.1 36.3 11.6
Others (98) (334) (34) (134) EBITDA 26.8 27.6 32.5 11.7
Financing 387 559 141 125 Pre-tax Profit 29.2 23.8 29.4 8.4
Dividend Payments (69) (119) (154) (167) Net Profit 25.3 29.0 29.1 8.3
Issue of Shares 396 430 0 0 Net Profit (Adjusted) 17.4 23.3 29.1 8.3
Proceeds from Borrowings 99 298 368 387 EPS 17.4 23.3 29.1 8.3
Loan Repayment 0 0 0 0
Others/Interest Paid (38) (50) (72) (95) Leverage
Net Cash Inflow (Outflow) 118 145 51 118 Debt to Total Capital 33.7 33.6 36.6 38.6
Beginning Cash & Cash Equivalent 44 158 303 354 Debt to Equity 51.0 50.8 57.9 63.2
Changes Due to Forex Impact 139 0 0 0 Net Debt/(Cash) to Equity 29.3 36.0 43.4 46.6
Ending Cash & Cash Equivalent 301 303 354 472
Interest Cover (x) 13.3 12.3 11.0 9.3

148
M a l a y s i a S t r a t e g y July 2018
VS Industry (VSI MK)
BACKGROUND
Although stock price has declined 9% for the past one month on weaker-than-expected 3QFY18 results, we believe the worst is over as earnings should improve in subsequent quarters on margin improvement. VS Industry (VSI), a global electronics manufacturing services (EMS) player, is poised to achieve a three-year core net profit CAGR of 22.4%, driven by higher sales volumes from its key customers. VSI is focusing on filling up capacities at its two new plants which came on stream recently.
OUTLOOK/RECOMMENDATION
Stronger quarters ahead on margin improvement... VSI reported weaker-than-expected results in the last two quarters due to margin erosion mainly from decreasing operating leverage given delays in the commencement of contracts on a large workforce of about 8,000 workers. As the large workforce is part of COGS, VSI needs to achieve higher sales to increase its operating leverage, which will in turn improve margins. We expect margins to recover in subsequent quarters, driven by higher sales which will improve current operating leverage.
…from commencement of production of new models in 2H18-1H19. VSI has been producing a new replacement model for its US customer since May 18. We gather that there will be three more new models coming up in 2H18-1H19.
Price adjustments by key customers from Jun 18 onwards. We note that pricings of selected products have been revised up by its key customers to alleviate cost pressure, notably from labour. We estimate cost pass-through impact at RM15m p.a.
Focus on filling up capacities coming on stream in mid-18 over next 3-5 years. VSI acquired a new plant near its headquarters in Jalan Murni, Johor Bahru for about RM30m early this year. This is in addition to the construction of a new facility with a warehouse that should be ready soon. Combined space of the two new plants is 300,000sf, a 23% increase from the existing built-up space of 1,300,000sf. VSI is looking to diversify by seeking contracts from new customers.
Maintain BUY and target price of RM1.85, based on a 13x PE pegged to FY19F EPS. VSI has a minimum 40% dividend payout policy. Assuming a payout of 45%, this translates into yields of 2.1-4.1% for FY18-20 (on a fully-diluted basis). Share price catalysts include: a) large contract wins from existing/new customers, and b) favourable forex.
KEY FINANCIALS
Year to 31 Jul (RMm) 2016 2017 2018F 2019F 2010F
Net Turnover 2,176 3,281 3,973 5,370 6,178 EBITDA 226 322 315 423 500 Operating Profit 154 244 235 341 415 Net Profit (Reported/Actual) 118 156 148 234 287 Net Profit (Adjusted) 123 156 148 234 287 EPS (sen) 10.5 13.0 7.8 12.4 15.2 PE (x) 16.1 12.9 21.4 13.6 11.1 P/B (x) 2.2 1.9 2.5 2.3 2.1 EV/EBITDA (x) 14.3 10.1 10.3 7.7 6.5 Dividend Yield (%) 2.8 2.9 2.1 3.3 4.1 Net Margin (%) 5.4 4.8 3.7 4.4 4.6 Net Debt/(Cash) to Equity (%) 22.3 34.2 15.9 10.1 6.5 Interest Cover (x) 16.1 16.0 15.4 23.6 29.0 ROE (%) 14.2 16.1 12.8 17.6 19.5 Consensus Net Profit - - 149 220 268 UOBKH/Consensus (x) - - 0.99 1.06 1.07 Source: VSI, Bloomberg, UOB Kay Hian
BUY
(Maintained)
Share Price RM1.68
Target Price RM1.85
Upside +10.1%
COMPANY DESCRIPTION
Involved in the manufacturing of plastic parts and components, contract manufacturing, precision mould making, sub-assembly of electronic and electrical equipment and other secondary processes.
STOCK DATA
GICS sector Information Technology
Bloomberg ticker VSI MK
Shares issued (m) 1,678.2
Market cap (RMm) 2,819.3
Market cap (US$m) 697.3
3-mth avg daily turnover (US$m) 2.9
Price Performance (%) 52-week high/low RM2.58/RM1.39
1mth 3mth 6mth 1yr YTD
(8.7) (1.4) (30.5) 1.4 (30.2)
Major Shareholders %Datuk Beh Kim Ling & Family 20.4
KWAP 9.2
Datuk Gan Sem Yan & Family 6.7
FY18 NAV/Share (RM) 0.67FY18 Net Debt/Share (RM) 0.11
PRICE CHART
Source: Bloomberg ANALYST
Fong Kah Yan (603) 2147 1993 [email protected]
60
80
100
120
140
160
180
1.00
1.50
2.00
2.50
3.00
(%)(lcy) V.S. INDUSTRY BERHAD V.S. INDUSTRY BERHAD/FBMKLCI INDEX
0
20
40
60
Jul 17 Sep 17 Nov 17 Jan 18 Mar 18 May 18 Jul 18
Volume (m)

149
M a l a y s i a S t r a t e g y July 2018
PROFIT & LOSS BALANCE SHEET
Year to 31 Jul (RMm) 2017 2018F 2019F 2020F Year to 31 Jul (RMm) 2017 2018F 2019F 2020F
Net Turnover 3,281 3,973 5,370 6,178 Fixed Assets 839 823 790 755
EBITDA 322 315 423 500 Other LT Assets 231 231 236 241
Depreciation & Amortisation 78 81 83 85 Cash/ST Investment 345 379 419 440
EBIT 244 235 341 415 Other Current Assets 1,482 1,522 1,905 2,188
Associate Contributions 0 1 5 5 Total Assets 2,896 2,956 3,351 3,624
Net Interest Income/(Expense) (20) (21) (18) (17) ST Debt 588 500 500 500
Pre-tax Profit 224 215 328 402 Other Current Liabilities 834 837 1,120 1,251
Tax (66) (64) (90) (111) LT Debt 119 80 60 40
Minorities (1) (2) (4) (4) Other LT Liabilities 77 54 54 54
Net Profit 156 148 234 287 Shareholders' Equity 1,058 1,262 1,390 1,548
Net Profit (Adjusted) 156 148 234 287 Minority Interest 220 223 226 231
Total Liabilities & Equity 2,896 2,956 3,351 3,624
CASH FLOW KEY METRICS
Year to 31 Jul (RMm) 2017 2018F 2019F 2020F Year to 31 Jul (%) 2017 2018F 2019F 2020F
Operating 78 169 215 220 Profitability
Pre-tax Profit 224 215 328 402 EBITDA Margin 9.8 7.9 7.9 8.1
Tax (43) (64) (90) (111) Pre-tax Margin 6.8 5.4 6.1 6.5
Depreciation & Amortisation 78 81 83 85 Net Margin 4.8 3.7 4.4 4.6
Associates (234) (38) (100) (152) ROA 6.4 5.1 7.4 8.2
Working Capital Changes 32 0 0 0 ROE 16.1 12.8 17.6 19.5
Other Operating Cashflows 21 (23 -5 -5
Investing (194) (150) (50) (50) Growth
Capex (Growth) (150) (150) (50) (50) Turnover 50.8 21.1 35.1 15.1
Investments (52) 0 0 0 EBITDA 42.3 (2.1) 34.3 18
Proceeds from Sale of Assets 7 0 0 0 Pre-tax Profit 57.7 (4) 52.5 22.8
Others 1 0 0 0 Net Profit 32.6 (5.2) 57.7 22.7
Financing 204 (15) (125) (149) Net Profit (Adjusted) 27 (5.2) 57.7 22.7
Dividend Payments (65) (67) (105) (129) EPS 24.1 (39.6) 57.7 22.7
Issue of Shares 22 123 0 0
Proceeds from Borrowings n.a. n.a. n.a. n.a. Leverage
Loan Repayment 245 (127) (20) (20) Debt to Total Capital 35.6 28.1 25.7 23.3
Others/Interest Paid 2 86 0 0 Debt to Equity 66.8 46 40.3 34.9
Net Cash Inflow (Outflow) 89 34 40 21 Net Debt/(Cash) to Equity 34.2 15.9 10.1 6.5
Beginning Cash & Cash Equivalent 218 345 379 419 Interest Cover (x) 16 15.4 23.6 29
Changes Due to Forex Impact 38 0 0 0
Ending Cash & Cash Equivalent 345 379 419 440

150
M a l a y s i a S t r a t e g y July 2018
Yong Tai (YTB MK)
BACKGROUND
The critically-acclaimed Encore Melaka made its maiden performance on 1 July. Online ticket sales have been encouraging. One daily show is expected to be hosted in the first month of operations and the frequency will increase to two shows daily in the subsequent months. We continue to like Yong Tai’s business model as earnings are secured because 70% of its annual capacity has been locked in by travel agents.
OUTLOOK/RECOMMENDATION
Strong interest from online ticketing. The sales tickets for the show have received strong interest, especially from online bookings. Out of its annual capacity of 1.4m seats, 1m tickets have been secured through Yong Tai’s offtake agreements with six local and foreign travel agents over the next three years. The 1m tickets represent a 70% occupancy rate of the theatre based on two shows daily.
Earnings expected to turn around significantly. We expect earnings to improve markedly from RM12m in FY18F to RM151m in FY19F, largely underpinned by Encore Melaka. This is premised on the assumption of two shows daily, or 1.48m seats p.a. Since Yong Tai has secured 1m forward ticket sales p.a. for the next three years, more shows could be added. Our sensitivity analysis indicates that every additional daily show could add 732,000 seats, which translates to an additional RM88m in revenue and RM41m to bottom-line, assuming 100% take-up.
Unperturbed by change in government. With the recent election resulting in a new state government in Melaka, we are assured that it will be business as usual for Yong Tai. We understand that the new state assembly representative who is in charge or tourism has visited Encore Melaka and is satisfied with the development of the project. Yong Tai stressed that Encore Melaka is poised to help the local economy as it employs 100% local talent (except for the performance director who is from China).
Impression City to ride on spillover effects from Encore Melaka. The group has access to over 100 acres of land surrounding the theatre. The development will be an integrated mixed development that includes F&B clusters, a shopping mall, hotels, serviced apartments and offices. Other key projects include serviced apartments on Jalan U-Thant, Kuala Lumpur and an integrated development in Bukit Bintang.
Maintain BUY and target price of RM2.10. Our target price is based on a 30% discount to our SOTP valuation of RM3.00/share. Our target price implies 10.6x FY19F PE. We expect no dividend payout in the first two financial years, but as operating cash flow improves, there could be dividends distributed.
KEY FINANCIALS
Year to 30 Jun (RMm) 2016 2017 2018F 2019F 2020F Net Turnover 30.2 41.2 390.7 735.0 886.7 EBITDA 13.0 13.5 110.3 239.3 307.2 Operating Profit 11.8 7.4 67.6 159.7 211.3 Net Profit (Reported/Actual) 3.7 5.6 52.4 132.5 179.0 Net Profit (Adjusted) 3.7 5.6 52.4 132.5 179.0 EPS (sen) 2.3 3.5 7.6 19.2 25.9 PE (x) 63.4 41.4 19.1 7.6 5.6 P/B (x) 2.6 0.5 1.9 1.5 1.2 Dividend Yield (%) 0.0 0.0 0.0 0.0 0.0 Net Margin (%) 12.2 13.6 13.4 18.0 20.2 Net Debt/(Cash) to Equity (x) (1.8) (10.1) 25.0 7.4 (9.1) Interest Cover (x) 48.8 291.1 23.8 69.0 291.3 ROE (%) 4.3 2.0 10.3 22.0 23.6 Consensus Net Profit - - 17.0 129.0 163.8 UOBKH/Consensus (x) - - 0.71 1.03 1.09
Source: Yong Tai, Bloomberg, UOB Kay Hian
BUY
(Maintained)
Share Price RM1.45 Target Price RM2.10 Upside +44.8%
COMPANY DESCRIPTION Investment holding company originally involved in textile manufacturing and dyeing. Now fully focuses on tourism-related property development.
STOCK DATA GICS sector Real Estate
Bloomberg ticker YTB MK
Shares issued (m) 482.8
Market cap (RMm) 700.1
Market cap (US$m) 172.9
3-mth avg daily t'over (US$m) 0.3
Price Performance (%)
52-week high/low RM1.75/RM1.30
1mth 3mth 6mth 1yr YTD
5.0 2.8 (11.9) 0.7 (2.6)
Major Shareholders %Full Winning Dev Ltd 31.1
Datuk Wira Boo Kuang Loon 13.2
Lee Ee Hoe 7.4
FY18 NAV/Share (RM) 1.14FY18 Net Debt/Share (RM) 0.34
PRICE CHART
Source: Bloomberg
ANALYST Abdul Hadi Manaf +603 2147 1971 [email protected]
80
90
100
110
120
1.20
1.30
1.40
1.50
1.60
1.70
1.80
(%)(lcy) YONG TAI BHD YONG TAI BHD/FBMKLCI INDEX
0
5
10
15
20
Jul 17 Sep 17 Nov 17 Jan 18 Mar 18 May 18 Jul 18
Volume (m)

151
M a l a y s i a S t r a t e g y July 2018
PROFIT & LOSS BALANCE SHEET
Year to 30 Jun (RMm) 2017 2018F 2019F 2020F Year to 30 Jun (RMm) 2017 2018F 2019F 2020F
Net Turnover 41 336 735 887 Fixed Assets 69 287 370 461
EBITDA 14 59 239 307 Other LT Assets 25 25 25 25
Depreciation & Amortisation (4) (22) (43) (52) Cash/ST Investment 49 56 131 297
EBIT 7 19 160 211 Other Current Assets 299 366 437 436
Associate Contributions 0 0 0 0 Total Assets 598 839 1,154 1,406
Net Interest Income/(Expense) (0) (3) (2) (1) ST Debt 0 0 0 0
Pre-tax Profit 7 16 157 210 Other Current Liabilities 113 139 298 366
Tax (2) (4) (25) (31) LT Debt 0 150 150 150
Minorities 0 0 0 0 Other LT Liabilities 0 0 0 0
Net Profit 6 12 133 179 Shareholders' Equity 485 551 705 890
Net Profit (Adjusted) 6 12 133 179 Minority Interest 0 0 0 0
Total Liabilities & Equity 598 839 1,154 1,406
CASH FLOW KEY METRICS
Year to 30 Jun (RMm) 2017 2018F 2019F 2020F Year to 30 Jun (%) 2017 2018F 2019F 2020F
Operating (131) 57 125 216 Profitability
Pre-tax Profit 12 81 188 226 EBITDA Margin 32.8 32.1 32.0 31.3
Tax (3) (15) (34) (41) Pre-tax Margin 17.9 20.5 21.8 21.4
Depreciation & Amortisation 2 22 43 52 Net Margin 13.6 16.6 17.9 17.6
Working Capital Changes (129) (31) (72) (20) ROA 1.6 9.1 15.5 14.5
Other Operating Cashflows (14) 0 0 0 ROE 2.0 12.7 24.6 23.2
Investing (148) (200) (50) (50)
Capex (Growth) (61) (200) (50) (50) Growth
Investments (3) 0 0 0 Turnover 36.6 858.9 118.7 21.9
Proceeds from Sale of Assets 4 0 0 0 EBITDA 3.8 837.9 118.0 19.5
Others (88) 0 0 0 Pre-tax Profit (36.1) 998.1 131.9 19.9
Financing 347 150 0 0 Net Profit 53.2 1,070.4 134.8 19.9
Dividend Payments 0 0 0 0 Net Profit (Adjusted) 53.2 1,070.4 134.8 19.9
Issue of Shares 354 0 0 0 EPS 53.2 171.5 134.8 19.9
Proceeds from Borrowings 0 150 0 0
Loan Repayment 0 0 0 0 Leverage
Others/Interest Paid (8) 0 0 0 Debt to Total Capital 0.0 38.4 38.4 38.4
Net Cash Inflow (Outflow) 67 7 75 166 Debt to Equity 0.0 27.2 21.3 16.9
Beginning Cash & Cash Equivalent 2 49 56 131 Net Debt/(Cash) to Equity (10.1) 20.8 5.6 (14.3)
Changes Due to Forex Impact 0 0 0 0 Interest Cover (x) 291.1 31.1 91.3 826.5
Ending Cash & Cash Equivalent 69 56 131 297

152
M a l a y s i a S t r a t e g y Ju ly 2018
Corporate Statistics Avg Daily Share Price Last Net Profit EPS PE DPS Yield Hist. Net Hist. Hist. No. of Market BV Price/ Net Cash/(Debt) to 52-Wk Price Turnover Company Ticker Rec 5 Jul 18 Year 2017 2018F 2019F 2017 2018F 2019F 2017 2018F 2019F 2018F 2019F 2018F 2019F CFPS Margin ROA ROE Shares Cap. ps BV ps Mkt Cap Equity High Low 52-Wk (RM) End (RMm) (RMm) (RMm) (sen) (sen) (sen) (x) (x) (x) (sen) (sen) (%) (%) (RM) (%) (%) (%) (m) (RMm) (RM) (x) (%) (%) (RM) (RM) ('000)
AUTOMOBILE Bermaz Auto BAUTO MK BUY 2.26 4/18 142.4 214.5 241.5 12.3 18.5 20.8 18.4 12.2 10.9 13.8 15.6 6.1 6.9 0.13 7.0 15.6 30.2 1,161.8 2,626 0.41 5.5 10.0 56.3 2.47 1.84 1,836 UMW Holdings UMWH MK HOLD 6.07 12/17 349.5 478.9 562.7 29.9 41.0 48.2 20.3 14.8 12.6 20.5 23.1 3.4 3.8 (0.27) 3.2 2.7 9.0 1,168.3 7,092 2.68 2.3 (29.3) (53.3) 6.98 4.70 1,035 Sector 491.9 693.3 804.2 19.8 14.0 12.1 4.1 4.6 3.8 3.5 11.2 9,717 2.7 (18.7) (41.7)
AVIATION AirAsia AAGB MK BUY 3.10 12/17 1,425.7 991.1 835.0 42.7 29.7 25.0 7.3 10.5 12.4 37.4 11.0 12.0 3.5 0.77 16.9 7.5 21.8 3,342.0 10,360 2.38 1.3 (11.8) (16.2) 4.75 2.93 9,121 Malaysia Airports MAHB MK HOLD 8.76 12/17 178.8 284.4 619.5 10.8 17.1 37.3 81.3 51.1 23.5 12.0 12.0 1.4 1.4 0.67 5.1 1.1 2.7 1,659.2 14,535 5.49 n.a. (23.3) (38.2) 9.45 7.86 3,201 Sector 1,604.5 1,275.5 1,454.5 15.5 19.5 17.1 5.8 2.3 13.1 4.3 11.5 24,895 1.3 (18.5) (28.1)
BANKING Affin Bank ABANK MK HOLD 2.56 12/17 565.7 537.1 547.5 29.1 27.6 28.2 8.8 9.3 9.1 8.3 8.4 3.2 3.3 n.a. n.a. 0.6 5.9 1,942.9 4,974 4.27 0.6 n.a. n.a. 2.70 2.22 208 Alliance Bank ABMB MK HOLD 4.21 3/18 493.2 557.8 604.9 31.9 36.0 39.1 13.2 11.7 10.8 17.9 19.4 4.2 4.6 n.a. n.a. 0.9 9.3 1,548.1 6,518 3.53 1.2 n.a. n.a. 4.49 3.62 1,217 AMMB AMM MK HOLD 3.78 3/18 1,278.1 1,318.2 1,412.4 42.4 43.7 46.9 8.9 8.6 8.1 15.0 17.5 4.0 4.6 n.a. n.a. 0.8 7.0 3,014.2 11,394 5.48 0.7 n.a. n.a. 5.12 3.40 2,926 BIMB BIMB MK BUY 3.78 12/17 619.8 641.1 674.0 36.6 37.9 39.8 10.3 10.0 9.5 15.7 16.5 4.1 4.4 n.a. n.a. 1.0 14.7 1,693.6 6,402 2.83 1.3 n.a. n.a. 4.57 3.76 552 CIMB Group CIMB MK BUY 5.53 12/17 4,475.2 5,217.2 5,735.9 47.8 55.7 61.2 11.6 9.9 9.0 28.6 30.4 5.2 5.5 n.a. n.a. 0.9 9.6 9,365.8 51,793 5.09 1.1 n.a. n.a. 7.39 5.32 16,792 Hong Leong Bank HLBK MK HOLD 18.24 6/17 2,248.0 2,544.2 2,669.7 109.9 124.4 130.5 16.6 14.7 14.0 55.1 57.8 3.0 3.2 n.a. n.a. 1.1 9.8 2,045.6 37,312 11.41 1.6 n.a. n.a. 20.02 14.90 1,031 Hong Leong Financial HLFG MK BUY 17.78 6/17 1,506.8 1,776.3 1,919.4 131.6 155.1 167.6 13.5 11.5 10.6 40.5 43.8 2.3 2.5 n.a. n.a. 0.7 9.4 1,145.2 20,362 15.41 1.2 n.a. n.a. 20.40 15.40 193 Maybank MAY MK HOLD 9.03 12/17 7,335.5 7,754.3 8,243.4 67.1 70.9 75.4 13.5 12.7 12.0 56.5 60.1 6.3 6.7 n.a. n.a. 1.0 10.6 10,930.8 98,705 6.72 1.3 n.a. n.a. 11.08 8.68 14,454 Public Bank PBK MK BUY 22.90 12/17 5,470.0 5,843.0 6,277.3 140.9 150.5 161.7 16.3 15.2 14.2 67.7 72.8 3.0 3.2 n.a. n.a. 1.4 15.3 3,882.1 88,901 9.74 2.4 n.a. n.a. 25.78 19.90 5,141 RHB Bank RHBBANK MK HOLD 5.35 12/17 1,950.1 2,219.3 2,349.9 48.6 55.3 58.6 11.0 9.7 9.1 16.6 17.6 3.1 3.3 n.a. n.a. 0.8 8.7 4,010.0 21,454 5.57 1.0 n.a. n.a. 5.88 4.71 1,782 Sector 25,942.6 28,408.4 30,434.5 13.4 12.2 11.4 4.3 4.6 n.a. 1.0 10.4 347,813 1.4 n.a. n.a.
BUILDING MATERIALS Hume Industries HUME MK HOLD 1.06 6/17 18.7 (38.6) 17.7 3.9 (8.1) 3.7 27.1 n.m. 28.8 1.1 3.9 1.0 3.7 0.14 2.8 1.2 4.2 479.1 508 0.88 1.2 (135.3) (156.0) 2.72 1.06 77 Press Metal PMAH MK HOLD 4.18 12/17 602.8 751.3 1,007.1 15.6 19.4 26.0 26.8 21.5 16.1 7.1 9.5 1.7 2.3 0.25 7.4 7.9 26.9 3,868.8 16,171 0.79 5.3 (17.1) (123.1) 5.83 2.60 7,308 Sector 621.5 712.7 1,024.7 26.8 23.4 16.3 1.7 2.3 7.0 6.8 23.2 16,679 4.8 (20.7) (128.5)
CONGLOMERATE MMC Corp MMC MK HOLD 1.35 12/17 225.4 349.9 372.6 7.4 11.5 12.2 18.2 11.7 11.0 3.5 3.5 2.6 2.6 0.23 5.4 1.0 2.4 3,045.1 4,111 3.15 0.4 (195.3) (84.3) 2.50 1.28 829 PPB Group PEP MK HOLD 19.88 12/17 1,197.4 1,051.2 1,167.0 101.0 88.7 98.4 19.7 22.4 20.2 27.2 25.4 1.4 1.3 1.14 28.0 5.3 5.8 1,185.5 23,568 17.06 1.2 3.1 3.5 21.04 16.32 758 Sector 1,422.9 1,401.1 1,539.6 19.5 19.8 18.0 1.5 1.5 16.9 3.1 4.7 27,679 0.9 (26.3) (23.9)
CONSTRUCTION Gamuda GAM MK BUY 3.47 7/17 700.6 850.7 880.1 28.4 34.5 35.7 12.2 10.1 9.7 15.0 15.0 4.3 4.3 0.30 18.7 4.0 8.4 2,468.0 8,564 3.07 1.1 (57.5) (68.7) 5.48 3.00 6,291 IJM Corp IJM MK BUY 1.78 3/18 306.8 486.4 560.7 8.5 13.4 15.4 21.1 13.3 11.5 5.4 6.3 3.1 3.5 0.18 5.8 1.7 3.7 3,630.9 6,463 2.62 0.7 (61.8) (42.1) 3.53 1.60 4,614 Kerjaya Prospek KPG MK BUY 1.49 12/17 127.1 158.0 182.8 10.2 12.7 14.7 14.6 11.7 10.1 3.4 3.9 2.3 2.6 0.12 13.0 11.0 15.2 1,242.0 1,851 0.73 2.0 12.3 27.7 1.96 1.34 969 Sunway Construction SCGB MK HOLD 1.85 12/17 100.3 169.2 175.8 7.8 13.1 13.6 23.8 14.1 13.6 4.6 4.7 2.5 2.6 0.14 6.6 7.9 26.3 1,292.2 2,391 0.45 4.1 19.1 87.3 2.64 1.72 1,682 WCT Holdings WCTHG MK BUY 0.80 12/17 154.6 172.4 183.2 11.1 12.4 13.2 7.2 6.4 6.1 2.2 2.4 2.8 2.9 0.12 8.1 2.0 5.2 1,387.9 1,110 2.22 0.4 (267.4) (100.6) 2.15 0.70 4,708 Sector 1,389.5 1,836.7 1,982.7 14.7 11.1 10.3 3.4 3.6 9.7 2.9 6.5 20,378 0.9 (55.0) (53.4)

153
M a l a y s i a S t r a t e g y Ju ly 2018
Corporate Statistics
Avg Daily Share Price Last Net Profit EPS PE DPS Yield Hist. Net Hist. Hist. No. of Market BV Price/ Net Cash/(Debt) to 52-Wk Price Turnover Company Ticker Rec 5 Jul 18 Year 2017 2018F 2019F 2017 2018F 2019F 2017 2018F 2019F 2018F 2019F 2018F 2019F CFPS Margin ROA ROE Shares Cap. ps BV ps Mkt Cap Equity High Low 52-Wk (RM) End (RMm) (RMm) (RMm) (sen) (sen) (sen) (x) (x) (x) (sen) (sen) (%) (%) (RM) (%) (%) (%) (m) (RMm) (RM) (x) (%) (%) (RM) (RM) ('000)
CONSUMER
BAT ROTH MK HOLD 34.32 12/17 522.4 444.3 477.0 183.0 155.6 167.0 18.8 22.1 20.5 149.4 160.4 4.4 4.7 1.75 16.4 44.0 99.0 285.5 9,799 1.24 27.7 3.8 74.4 44.94 22.46 357 Carlsberg CAB MK HOLD 19.66 12/17 221.2 246.8 261.1 71.9 80.2 84.9 27.3 24.5 23.2 82.0 85.2 4.2 4.3 0.83 12.5 33.8 71.3 307.6 6,048 1.27 15.5 2.6 50.1 20.88 14.48 114 F&N FNH MK HOLD 39.00 9/17 376.1 372.5 430.1 102.6 101.6 117.3 38.0 38.4 33.2 59.1 64.5 1.5 1.7 1.13 7.9 10.0 15.7 366.5 14,295 6.02 6.5 0.7 4.6 39.98 23.40 613 Heineken HEIM MK HOLD 22.42 12/17 270.1 289.5 304.0 89.4 95.8 100.6 25.1 23.4 22.3 92.0 96.6 4.1 4.3 0.94 14.0 32.2 71.7 302.1 6,773 1.35 16.6 0.2 4.1 24.02 17.30 98 Nestle NESZ MK SELL 147.80 12/17 640.4 711.3 755.9 273.1 303.3 322.4 54.1 48.7 45.8 294.1 309.5 2.0 2.1 3.31 12.3 25.6 100.3 234.5 34,659 3.68 40.2 (0.8) (40.7) 163.00 82.70 226 QL Resources QLG MK SELL 5.98 3/18 206.2 250.9 292.0 12.7 15.5 18.0 47.0 38.7 33.2 4.6 5.4 0.8 0.9 0.20 6.3 6.3 11.6 1,622.4 9,702 1.11 5.4 (7.1) (38.9) 6.05 3.71 678 Sector 2,236.3 2,315.3 2,520.2 36.3 35.1 32.3 2.4 2.5 11.2 18.6 38.1 81,277 11.9 (0.4) (5.6)
EXCHANGE Bursa Malaysia BURSA MK HOLD 7.54 12/17 223.0 232.4 221.4 27.7 28.8 27.5 27.3 26.2 27.5 27.4 26.1 3.6 3.5 0.31 42.7 9.6 26.0 806.3 6,079 1.54 4.9 6.3 44.3 8.20 6.31 1,421 Sector 223.0 232.4 221.4 27.3 26.2 27.5 3.6 3.5 42.7 9.6 26.0 6,079 4.9 6.3 44.3
GAMING Berjaya Sports Toto BST MK BUY 2.41 4/18 255.4 303.5 318.9 19.0 22.5 23.7 12.7 31.2 32.2 18.0 18.9 7.5 7.8 0.20 4.1 8.8 30.7 1,347.0 3,246 0.54 4.5 (22.7) (98.4) 2.62 2.06 1,223 Genting Bhd GENT MK BUY 8.44 12/17 2,051.4 2,700.1 2,879.0 53.5 70.5 75.1 15.8 12.0 11.2 21.4 22.9 2.5 2.7 1.11 7.2 1.6 4.3 3,831.7 32,340 8.72 1.0 12.8 12.2 9.90 8.31 3,400 Genting Malaysia GENM MK BUY 4.85 12/17 1,407.2 1,786.9 2,350.8 24.9 31.6 41.6 19.5 15.4 11.7 17.3 20.7 3.6 4.3 0.37 12.4 4.0 5.9 5,656.6 27,435 3.34 1.5 (5.1) (7.2) 6.09 4.59 6,527 Magnum MAG MK BUY 2.09 12/17 206.6 238.6 254.8 14.5 16.8 17.9 14.4 12.5 11.7 11.6 12.4 5.6 5.9 0.15 7.8 5.8 8.4 1,423.0 2,974 1.74 1.2 (16.2) (19.6) 2.34 1.66 758 Sector 3,920.6 5,029.2 5,803.5 16.8 13.1 11.4 3.3 3.8 8.1 2.4 5.4 65,994 1.1 2.3 2.7
GLOVE MANUFACTURING Hartalega HART MK SELL 5.95 3/18 398.0 507.1 568.8 12.0 15.3 17.2 49.6 38.9 34.7 9.5 10.5 1.6 1.8 0.16 18.3 19.2 23.9 3,316.5 19,733 0.60 9.9 (1.4) (14.7) 6.64 3.19 3,378 Kossan Rubber KRI MK HOLD 8.52 12/17 183.9 201.6 233.1 28.8 31.5 36.4 29.6 27.0 23.4 15.8 18.2 1.8 2.1 0.40 9.4 10.8 16.7 639.5 5,448 1.84 4.6 (2.3) (11.2) 8.79 6.38 674 Top Glove TOPG MK SELL 12.30 8/17 332.7 469.6 561.8 26.0 36.7 44.0 47.2 33.5 28.0 18.6 22.3 1.5 1.8 0.35 9.8 11.9 29.4 1,277.9 15,718 1.78 6.9 (11.9) (166.2) 12.48 5.33 3,695 Sector 914.7 1,178.3 1,363.7 44.7 34.7 30.0 1.6 1.8 12.3 14.1 23.5 40,900 7.5 (5.6) (55.8)
HEALTHCARE KPJ Healthcare KPJ MK HOLD 1.04 12/17 174.9 180.8 190.1 4.2 4.3 4.5 25.1 24.2 23.1 1.8 1.8 1.8 1.8 0.07 5.1 4.0 9.7 4,214.5 4,383 0.40 2.6 (28.3) (74.8) 1.15 0.84 2,889 Sector 174.9 180.8 190.1 25.1 24.2 23.1 1.8 1.8 5.1 4.0 9.7 4,383 2.6 (28.3) (74.8)
INSURANCE Tune Protect TIH MK HOLD 0.91 12/17 46.3 58.3 62.5 6.2 7.8 8.3 14.8 11.7 10.9 3.6 3.8 4.0 4.2 n.a. n.a. 3.5 9.2 751.8 684 0.69 1.3 n.a. n.a. 1.26 0.71 1,868 Syarikat Takaful STMB MK HOLD 3.89 12/17 206.1 216.9 235.0 25.0 26.3 28.5 15.6 14.8 13.6 15.8 17.1 4.1 4.4 n.a. n.a. 2.6 30.2 824.2 3,206 1.07 3.6 n.a. n.a. 4.23 3.17 202 Sector 252.4 275.2 297.5 15.4 14.1 13.1 4.0 4.4 n.a. 2.7 21.3 3,890 2.8 n.a. n.a.
MANUFACTURING Denko Industrial DEN MK BUY 1.60 12/17 79.1 92.5 128.2 6.9 8.1 11.2 23.2 19.8 14.3 3.9 5.0 2.4 3.1 0.14 4.0 9.9 29.5 1,147.0 1,835 0.40 4.0 (0.2) (1.3) 2.00 1.18 473 Scientex SCI MK BUY 7.16 7/17 257.9 290.3 363.0 52.7 59.4 74.2 13.6 12.1 9.6 18.0 22.5 2.5 3.1 0.67 10.6 10.6 18.9 488.9 3,501 3.51 2.0 (7.8) (20.3) 9.85 6.51 243 SKP Resources SKP MK HOLD 1.42 3/18 125.6 141.2 170.7 10.0 11.3 13.7 14.1 12.6 10.4 5.8 7.0 4.1 5.0 0.12 6.0 12.9 25.1 1,250.2 1,775 0.45 3.2 1.1 4.0 2.35 1.27 4,614 VS Industry VSI MK BUY 1.68 7/17 156.3 148.2 233.7 9.3 8.8 13.9 18.0 19.0 12.1 3.5 5.6 2.1 3.3 0.14 4.8 6.4 16.1 1,678.2 2,819 0.94 1.8 (10.1) (29.5) 2.62 1.27 6,827 Sector 619.0 672.2 895.6 16.0 14.8 11.1 2.7 3.5 6.3 9.3 20.1 9,931 2.3 (5.5) (17.3)
MEDIA Astro ASTRO MK BUY 1.63 1/17 677.7 674.9 698.3 13.0 12.9 13.4 12.5 12.6 12.2 11.7 12.1 7.2 7.4 0.35 13.9 11.8 120.7 5,213.9 8,499 0.13 12.4 (44.9) (597.2) 2.94 1.31 3,071 Sector 677.7 674.9 698.3 12.5 12.6 12.2 7.2 7.4 13.9 11.8 120.7 8,499 12.4 (44.9) (597.2)
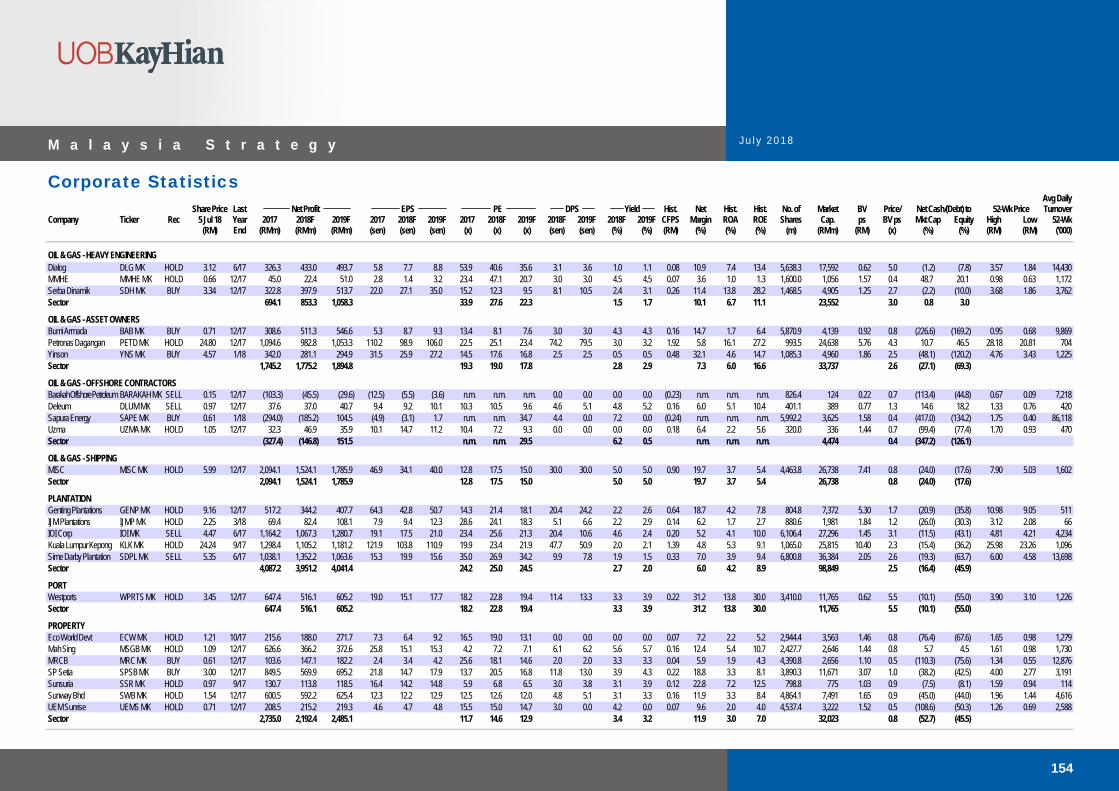
154
M a l a y s i a S t r a t e g y Ju ly 2018
Corporate Statistics
Avg Daily Share Price Last Net Profit EPS PE DPS Yield Hist. Net Hist. Hist. No. of Market BV Price/ Net Cash/(Debt) to 52-Wk Price Turnover Company Ticker Rec 5 Jul 18 Year 2017 2018F 2019F 2017 2018F 2019F 2017 2018F 2019F 2018F 2019F 2018F 2019F CFPS Margin ROA ROE Shares Cap. ps BV ps Mkt Cap Equity High Low 52-Wk (RM) End (RMm) (RMm) (RMm) (sen) (sen) (sen) (x) (x) (x) (sen) (sen) (%) (%) (RM) (%) (%) (%) (m) (RMm) (RM) (x) (%) (%) (RM) (RM) ('000)
OIL & GAS - HEAVY ENGINEERING Dialog DLG MK HOLD 3.12 6/17 326.3 433.0 493.7 5.8 7.7 8.8 53.9 40.6 35.6 3.1 3.6 1.0 1.1 0.08 10.9 7.4 13.4 5,638.3 17,592 0.62 5.0 (1.2) (7.8) 3.57 1.84 14,430 MMHE MMHE MK HOLD 0.66 12/17 45.0 22.4 51.0 2.8 1.4 3.2 23.4 47.1 20.7 3.0 3.0 4.5 4.5 0.07 3.6 1.0 1.3 1,600.0 1,056 1.57 0.4 48.7 20.1 0.98 0.63 1,172 Serba Dinamik SDH MK BUY 3.34 12/17 322.8 397.9 513.7 22.0 27.1 35.0 15.2 12.3 9.5 8.1 10.5 2.4 3.1 0.26 11.4 13.8 28.2 1,468.5 4,905 1.25 2.7 (2.2) (10.0) 3.68 1.86 3,762 Sector 694.1 853.3 1,058.3 33.9 27.6 22.3 1.5 1.7 10.1 6.7 11.1 23,552 3.0 0.8 3.0
OIL & GAS - ASSET OWNERS Bumi Armada BAB MK BUY 0.71 12/17 308.6 511.3 546.6 5.3 8.7 9.3 13.4 8.1 7.6 3.0 3.0 4.3 4.3 0.16 14.7 1.7 6.4 5,870.9 4,139 0.92 0.8 (226.6) (169.2) 0.95 0.68 9,869 Petronas Dagangan PETD MK HOLD 24.80 12/17 1,094.6 982.8 1,053.3 110.2 98.9 106.0 22.5 25.1 23.4 74.2 79.5 3.0 3.2 1.92 5.8 16.1 27.2 993.5 24,638 5.76 4.3 10.7 46.5 28.18 20.81 704 Yinson YNS MK BUY 4.57 1/18 342.0 281.1 294.9 31.5 25.9 27.2 14.5 17.6 16.8 2.5 2.5 0.5 0.5 0.48 32.1 4.6 14.7 1,085.3 4,960 1.86 2.5 (48.1) (120.2) 4.76 3.43 1,225 Sector 1,745.2 1,775.2 1,894.8 19.3 19.0 17.8 2.8 2.9 7.3 6.0 16.6 33,737 2.6 (27.1) (69.3)
OIL & GAS - OFFSHORE CONTRACTORS Barakah Offshore Petroleum BARAKAH MK SELL 0.15 12/17 (103.3) (45.5) (29.6) (12.5) (5.5) (3.6) n.m. n.m. n.m. 0.0 0.0 0.0 0.0 (0.23) n.m. n.m. n.m. 826.4 124 0.22 0.7 (113.4) (44.8) 0.67 0.09 7,218 Deleum DLUM MK SELL 0.97 12/17 37.6 37.0 40.7 9.4 9.2 10.1 10.3 10.5 9.6 4.6 5.1 4.8 5.2 0.16 6.0 5.1 10.4 401.1 389 0.77 1.3 14.6 18.2 1.33 0.76 420 Sapura Energy SAPE MK BUY 0.61 1/18 (294.0) (185.2) 104.5 (4.9) (3.1) 1.7 n.m. n.m. 34.7 4.4 0.0 7.2 0.0 (0.24) n.m. n.m. n.m. 5,992.2 3,625 1.58 0.4 (417.0) (134.2) 1.75 0.40 86,118 Uzma UZMA MK HOLD 1.05 12/17 32.3 46.9 35.9 10.1 14.7 11.2 10.4 7.2 9.3 0.0 0.0 0.0 0.0 0.18 6.4 2.2 5.6 320.0 336 1.44 0.7 (99.4) (77.4) 1.70 0.93 470 Sector (327.4) (146.8) 151.5 n.m. n.m. 29.5 6.2 0.5 n.m. n.m. n.m. 4,474 0.4 (347.2) (126.1)
OIL & GAS - SHIPPING MISC MISC MK HOLD 5.99 12/17 2,094.1 1,524.1 1,785.9 46.9 34.1 40.0 12.8 17.5 15.0 30.0 30.0 5.0 5.0 0.90 19.7 3.7 5.4 4,463.8 26,738 7.41 0.8 (24.0) (17.6) 7.90 5.03 1,602 Sector 2,094.1 1,524.1 1,785.9 12.8 17.5 15.0 5.0 5.0 19.7 3.7 5.4 26,738 0.8 (24.0) (17.6)
PLANTATION Genting Plantations GENP MK HOLD 9.16 12/17 517.2 344.2 407.7 64.3 42.8 50.7 14.3 21.4 18.1 20.4 24.2 2.2 2.6 0.64 18.7 4.2 7.8 804.8 7,372 5.30 1.7 (20.9) (35.8) 10.98 9.05 511 IJM Plantations IJMP MK HOLD 2.25 3/18 69.4 82.4 108.1 7.9 9.4 12.3 28.6 24.1 18.3 5.1 6.6 2.2 2.9 0.14 6.2 1.7 2.7 880.6 1,981 1.84 1.2 (26.0) (30.3) 3.12 2.08 66 IOI Corp IOI MK SELL 4.47 6/17 1,164.2 1,067.3 1,280.7 19.1 17.5 21.0 23.4 25.6 21.3 20.4 10.6 4.6 2.4 0.20 5.2 4.1 10.0 6,106.4 27,296 1.45 3.1 (11.5) (43.1) 4.81 4.21 4,234 Kuala Lumpur Kepong KLK MK HOLD 24.24 9/17 1,298.4 1,105.2 1,181.2 121.9 103.8 110.9 19.9 23.4 21.9 47.7 50.9 2.0 2.1 1.39 4.8 5.3 9.1 1,065.0 25,815 10.40 2.3 (15.4) (36.2) 25.98 23.26 1,096 Sime Darby Plantation SDPL MK SELL 5.35 6/17 1,038.1 1,352.2 1,063.6 15.3 19.9 15.6 35.0 26.9 34.2 9.9 7.8 1.9 1.5 0.33 7.0 3.9 9.4 6,800.8 36,384 2.05 2.6 (19.3) (63.7) 6.00 4.58 13,698 Sector 4,087.2 3,951.2 4,041.4 24.2 25.0 24.5 2.7 2.0 6.0 4.2 8.9 98,849 2.5 (16.4) (45.9)
PORT Westports WPRTS MK HOLD 3.45 12/17 647.4 516.1 605.2 19.0 15.1 17.7 18.2 22.8 19.4 11.4 13.3 3.3 3.9 0.22 31.2 13.8 30.0 3,410.0 11,765 0.62 5.5 (10.1) (55.0) 3.90 3.10 1,226 Sector 647.4 516.1 605.2 18.2 22.8 19.4 3.3 3.9 31.2 13.8 30.0 11,765 5.5 (10.1) (55.0)
PROPERTY Eco World Devt ECW MK HOLD 1.21 10/17 215.6 188.0 271.7 7.3 6.4 9.2 16.5 19.0 13.1 0.0 0.0 0.0 0.0 0.07 7.2 2.2 5.2 2,944.4 3,563 1.46 0.8 (76.4) (67.6) 1.65 0.98 1,279 Mah Sing MSGB MK HOLD 1.09 12/17 626.6 366.2 372.6 25.8 15.1 15.3 4.2 7.2 7.1 6.1 6.2 5.6 5.7 0.16 12.4 5.4 10.7 2,427.7 2,646 1.44 0.8 5.7 4.5 1.61 0.98 1,730 MRCB MRC MK BUY 0.61 12/17 103.6 147.1 182.2 2.4 3.4 4.2 25.6 18.1 14.6 2.0 2.0 3.3 3.3 0.04 5.9 1.9 4.3 4,390.8 2,656 1.10 0.5 (110.3) (75.6) 1.34 0.55 12,876 SP Setia SPSB MK BUY 3.00 12/17 849.5 569.9 695.2 21.8 14.7 17.9 13.7 20.5 16.8 11.8 13.0 3.9 4.3 0.22 18.8 3.3 8.1 3,890.3 11,671 3.07 1.0 (38.2) (42.5) 4.00 2.77 3,191 Sunsuria SSR MK HOLD 0.97 9/17 130.7 113.8 118.5 16.4 14.2 14.8 5.9 6.8 6.5 3.0 3.8 3.1 3.9 0.12 22.8 7.2 12.5 798.8 775 1.03 0.9 (7.5) (8.1) 1.59 0.94 114 Sunway Bhd SWB MK HOLD 1.54 12/17 600.5 592.2 625.4 12.3 12.2 12.9 12.5 12.6 12.0 4.8 5.1 3.1 3.3 0.16 11.9 3.3 8.4 4,864.1 7,491 1.65 0.9 (45.0) (44.0) 1.96 1.44 4,616 UEM Sunrise UEMS MK HOLD 0.71 12/17 208.5 215.2 219.3 4.6 4.7 4.8 15.5 15.0 14.7 3.0 0.0 4.2 0.0 0.07 9.6 2.0 4.0 4,537.4 3,222 1.52 0.5 (108.6) (50.3) 1.26 0.69 2,588 Sector 2,735.0 2,192.4 2,485.1 11.7 14.6 12.9 3.4 3.2 11.9 3.0 7.0 32,023 0.8 (52.7) (45.5)

155
M a l a y s i a S t r a t e g y Ju ly 2018
Corporate Statistics Avg Daily Share Price Last Net Profit EPS PE DPS Yield Hist. Net Hist. Hist. No. of Market BV Price/ Net Cash/(Debt) to 52-Wk Price Turnover Company Ticker Rec 5 Jul 18 Year 2017 2018F 2019F 2017 2018F 2019F 2017 2018F 2019F 2018F 2019F 2018F 2019F CFPS Margin ROA ROE Shares Cap. ps BV ps Mkt Cap Equity High Low 52-Wk (RM) End (RMm) (RMm) (RMm) (sen) (sen) (sen) (x) (x) (x) (sen) (sen) (%) (%) (RM) (%) (%) (%) (m) (RMm) (RM) (x) (%) (%) (RM) (RM) ('000)
REITs
Axis REIT AXRB MK HOLD 1.45 12/17 91.2 111.0 119.8 7.4 9.0 9.7 19.6 16.1 14.9 8.8 9.5 6.1 6.6 0.10 72.6 5.1 8.2 1,232.3 1,787 1.31 1.1 (49.4) (59.1) 1.67 1.19 499
CMMT CMMT MK HOLD 1.20 12/17 157.9 156.8 161.5 7.7 7.7 7.9 15.5 15.6 15.2 7.7 7.9 6.4 6.6 0.08 43.9 3.9 6.0 2,040.6 2,449 1.28 0.9 (49.1) (44.7) 1.83 0.98 1,126
IGB REIT IGBREIT MK BUY 1.66 12/17 294.9 306.2 318.6 8.4 8.7 9.0 19.8 19.1 18.4 10.1 10.5 6.1 6.3 0.10 65.4 6.6 9.3 3,524.6 5,851 1.06 1.6 (17.3) (27.4) 1.80 1.46 2,085
KLCC Property KLCCSS MK HOLD 7.66 12/17 720.1 745.3 791.6 39.9 41.3 43.8 19.2 18.6 17.5 36.7 37.6 4.8 4.9 0.50 64.2 4.9 17.8 1,805.3 13,829 7.21 1.1 (11.1) (31.2) 8.64 6.77 421
MRCB-Quill REIT MQREIT MK HOLD 1.12 12/17 88.3 87.4 89.2 8.2 8.2 8.3 13.6 13.7 13.5 7.9 8.0 7.0 7.2 0.07 38.8 3.0 5.1 1,071.8 1,200 1.26 0.9 (66.8) (58.4) 1.36 1.00 422
Pavilion REIT PREIT MK HOLD 1.56 12/17 232.6 271.5 306.5 7.7 8.9 10.1 20.4 17.4 15.4 8.4 9.5 5.4 6.1 0.08 50.9 4.4 6.3 3,034.5 4,734 1.28 1.2 (26.8) (32.3) 1.78 1.32 919
Sunway REIT SREIT MK HOLD 1.70 6/17 181.8 183.7 195.9 6.2 6.2 6.7 27.5 27.3 25.6 9.8 10.4 5.8 6.1 0.14 81.2 6.3 10.3 2,945.1 5,007 1.41 1.2 (53.7) (65.0) 1.90 1.48 1,635
Sector 1,766.8 1,862.0 1,983.1 19.7 18.7 17.6 5.5 5.8 62.1 5.1 10.1 34,856 1.1 (26.9) (42.2)
TECHNOLOGY
Globetronics GTB MK BUY 2.24 12/17 51.3 84.6 108.9 7.7 12.7 16.3 29.1 17.7 13.7 10.1 13.0 4.5 5.8 0.12 16.8 14.5 18.8 667.0 1,494 0.98 2.3 5.7 31.2 2.97 1.49 2,378
Inari Amertron INRI MK BUY 2.25 6/17 199.8 254.5 350.8 6.4 8.1 11.2 35.4 27.8 20.1 5.3 7.3 2.4 3.3 0.09 19.4 21.9 29.2 3,141.0 7,067 0.49 4.6 7.0 63.7 2.55 1.42 12,717
My EG MYEG MK BUY 0.89 6/17 214.2 244.0 301.4 6.0 6.9 8.5 14.7 12.9 10.4 2.0 2.5 2.3 2.8 0.06 54.2 25.4 42.3 3,552.3 3,144 0.19 4.7 1.0 6.6 3.03 0.66 25,517
Sector 465.3 583.1 761.1 25.2 20.1 15.4 2.6 3.5 25.9 22.0 31.4 11,705 4.1 5.2 40.1
TELECOMMUNICATIONS
Axiata Axiata MK HOLD 4.11 12/17 1,093.4 1,087.6 1,622.8 12.1 12.0 17.9 34.0 34.2 22.9 9.7 14.4 2.4 3.5 0.76 3.7 1.3 3.8 9,049.7 37,194 2.58 1.6 (33.4) (51.5) 5.82 3.76 5,372
DiGi.Com DIGI MK BUY 4.17 12/17 1,471.0 1,522.7 1,617.6 18.9 19.6 20.8 22.0 21.3 20.0 19.5 20.7 4.7 5.0 0.29 23.3 26.1 284.5 7,775.0 32,422 0.09 46.3 (6.9) (431.3) 5.10 3.93 4,537
Maxis Maxis MK HOLD 5.39 12/17 2,298.0 1,998.9 2,001.7 29.4 25.6 25.6 18.3 21.1 21.0 20.5 20.5 3.8 3.8 0.44 23.1 10.4 34.2 7,816.6 42,132 0.90 6.0 (17.2) (123.3) 6.14 5.23 2,991
OCK OCK MK BUY 0.67 12/17 34.5 30.1 35.8 4.0 3.5 4.1 16.9 19.4 16.3 7.5 10.7 11.2 16.0 0.06 5.1 2.5 5.8 871.5 584 0.47 1.4 (61.7) (85.6) 0.95 0.65 465
Telekom Malaysia T MK BUY 3.50 12/17 863.2 642.3 654.5 23.0 17.1 17.4 15.2 20.5 20.1 16.2 16.5 4.6 4.7 0.91 7.7 5.0 12.0 3,757.9 13,153 2.01 1.7 (50.1) (84.8) 6.66 3.00 3,882
Sector 5,760.1 5,281.7 5,932.4 21.8 23.8 21.2 3.7 4.2 10.3 4.6 13.8 125,484 3.2 (23.0) (74.5)
UTILITY
Gas Malaysia GMB MK HOLD 2.83 12/17 164.1 171.2 177.7 12.8 13.3 13.8 22.1 21.2 20.5 13.3 13.8 4.7 4.9 0.20 3.6 8.5 18.8 1,284.0 3,634 0.78 3.6 (0.4) (1.5) 3.02 2.66 428
Malakoff MLK MK BUY 0.85 12/17 319.4 266.1 298.8 6.5 5.4 6.1 13.0 15.6 13.9 4.3 4.8 5.0 5.7 0.25 4.3 1.0 5.3 4,919.1 4,157 1.21 0.7 (342.1) (240.9) 1.17 0.83 4,817
Tenaga Nasional TNB MK BUY 14.42 8/17 7,330.2 6,970.8 6,814.6 129.1 122.8 120.0 11.2 11.7 12.0 72.5 72.5 5.0 5.0 2.22 14.6 6.3 12.6 5,678.2 81,879 10.20 1.4 (45.6) (68.2) 16.34 13.54 11,062
YTL Power YTLP MK HOLD 1.05 6/17 746.0 740.0 751.0 9.5 9.4 10.6 11.0 11.1 9.9 5.0 5.0 4.8 4.8 0.22 6.9 1.5 5.2 7,831.8 8,223 1.60 0.7 (236.5) (151.0) 1.42 0.73 6,493
Sector 8,559.7 8,148.2 8,122.5 11.4 12.0 12.1 5.0 5.0 11.6 4.3 10.8 97,893 1.3 (72.5) (95.2)
OVERALL 68.7b 71.4b 78.1b 17.0 16.4 15.0 3.7 3.8 15.7 1.8 9.4 1,169b 1.7 (17.8) (30.9)
CMMT = Capitaland Malaysia Mall Trust, MMHE = Malaysia Marine And Heavy Engineering Holdings, MRCB = Malaysian Resources Corporation. Notes: If year end is before June, earnings are shown in the previous period.

M a l a y s i a S t r a t e g y July 2018
156
Appendix 1: GE14 Results GE13 & 14 PARLIAMENTARY RESULTS
State/Federal Territory No. of
Parliamentary Seats
GE13 Results GE14 Results
BN PAS DAP PR Independent & Others
BN PH Gagasan Sejahtera
Independent & Others
- -
Perlis 3 3 - - - - 2 1 - -
Kedah 15 10 1 - 4 - 2 10 3 -
Kelantan 14 5 9 - - - 5 - 9 -
Terengganu 8 4 4 - - - 2 - 6 -
Penang 13 3 - 7 3 - 2 11 - -
Perak 24 12 2 7 3 - 11 13 - -
Pahang 14 10 1 1 2 - 9 5 - -
Selangor 22 5 4 4 9 - 2 20 - -
WP Kuala Lumpur 11 2 - 5 4 - - 10 - -
WP Putrajaya 1 1 - - - - 1 - - -
Negeri Sembilan 8 5 - 2 1 - 3 5 - -
Malacca 6 4 - 1 1 - 2 4 - -
Johor 26 21 - 4 1 - 8 18 - -
WP Labuan 1 1 - - - - 1 - - -
Sabah 25 22 - 2 1 - 10 15 - 1
Sarawak 31 25 - 5 1 - 19 10 - 2
Total 222 133 21 38 30 0 79 122 18 3
Popular Votes (%) 47.4 20.4 15.7 14.8 35.6 45.6 17.0 0.8
Note: Gagasan Sejahtera is a coalition of opposition consisting of PAS, Malaysia National Alliance Party and Pan-Malaysian Islamic Front. Pakatan Harapan (2018) is a successor to Pakatan Rakyat (2013) consisting of Democratic Action Party, People's Justice Party, National Trust Party and Malaysian United Indigenous Party. Source: Election Commission, media, UOB Kay Hian

M a l a y s i a S t r a t e g y July 2018
157
Appendix 2: 2018 Malaysia Cabinet Members NEW CABINET MEMBERS
Ministry Minister Minister’s Background
Prime Minister Tun Dr. Mahathir Mohamad Fourth Prime Minister of Malaysia
Deputy Prime Minister &
Women, Family And Community Development
Dato' Seri Dr. Wan Azizah Binti Wan Ismail Former leader of the fledgling Reformasi movement after the dismissal and arrest of her husband in 1998.
Elected herself as the Member of Parliament for Permatang Pauh, which was formerly held by Anwar Ibrahim.
Home Affairs Tan Sri Haji Muhyiddin Bin Haji Mohd. Yassin Former Deputy Prime Minister and Minister of Education in 2008
Finance Lim Guan Eng Secretary-General of DAP since 2004 and served as the Chief Minister of Penang between 2008 and 2018
Defense Haji Mohamad Bin Sabu Formerly the Deputy President of PAS. Detained twice under the Internal Security Act (ISA) from 1984 to 1986 on
charges of being involved in extremist movements; from 1987 to 1989 under the operation codenamed Ops Lalang (Operation Lalang).
Education Dr. Maszlee Bin Malik Joined ‘Parti Pribumi Bersatu Malaysia’ (PPBM) on 12 Mar 18. Elected as the Member of Parliament from Simpang Renggam.
Rural Development Puan Rina Binti Mohd Harun Active in politics since 2002. Women’s Chief of the Malaysian United Indigenous Party (PPBM)
Economic Affairs Dato' Seri Mohamed Azmin Bin Ali Member of Parliament for Gombak, as well as the assemblyman for Bukit Antarabangsa in the Selangor State Assembly.
Works with Anwar Ibrahim since 1987 and is one of the co-founders of Parti Keadilan Rakyat (PKR).
Housing and Local Development Zuraida Binti Kamaruddin Current Member of Parliament for Ampang. Women Chief of PKR.
Transportation Anthony Loke Siew Fook Member of Parliament of Malaysia for Seremban, and a senior official in DAP.
Communications and Multimedia Gobind Singh Deo Deputy Chairman of DAP. Politician, lawyer and the Member of Parliament of Puchong, Selangor.
Human Resources M. Kulasegaran A/L V. Murugeson National Vice-Chairman of DAP and served as the Member of Parliament for Ipoh Barat, Perak.
Agriculture and Agro-Based Industry Salahuddin Bin Haji Ayub Deputy President of AMANAH. Former member of Parliament of Malaysia for the Kubang Kerian constituency in
Kelantan representing PAS for two terms from 2004 to 2013. Former vice-president of PAS. Former head of PAS’ youth wing.
Health Dr. Haji Dzulkefly Bin Ahmad Currently the Member of the Parliament of Malaysia for Kuala Selangor.
Contested but lost in Rembau, Negeri Sembilan parliamentary seat for PAS in 2004. However he then won the seat of Kuala Selangor in the 2008 election.
Foreign Affairs Saifuddin Abdullah Member of Parliament for Indera Makhota. Former Secretary-General of the Malaysian Youth Council Appointed as the deputy prime minister and was the Deputy Prime Minister for
Higher Education
Quit UMNO and joined PKR in 2015
Youth and Sports Syed Saddiq Syed Abdul Rahman Leader of youth wing of PPBM and has been a spokesperson for the party since its inception in 2016. Considered as one of the founding members and sits on the party council.
Contested in the 2018 general election for the Muar parliamentary seat and was elected to the Parliament.
Won the Asia's Best Speaker Award at the Asian British Parliamentary Debating Championship three times.
Domestic Trade and Consumer Affairs
Saifuddin Nasution Ismail Member of Parliament for the Kulim-Bandar Baharu constituency in Kedah. Penang State Legislative Assemblyman for Pantai Jerejak. Initially a member of the youth wing of UMNO party but was expelled in 1999.
Source: Various, UOB Kay Hian

M a l a y s i a S t r a t e g y July 2018
158
NEW CABINET MEMBERS (CONT’D)
Ministry Minister Minister’s Background
Natural Resources and Environment Dr. Xavier Jayakumar Selangor State Legislative Assemblyman for Seri Andalas, Klang.
Primary Industries Teresa Kok Political secretary to Opposition Leader Lim Kit Siang from 1990 to 1995. Won and retained the Parliamentary Seat of Seputeh in Kuala Lumpur.
Entrepreneur Development Mohd Redzuan Md Yusof Member of Parliament of Alor Gajah.
Public Works Baru Bian First leader of the Lun Bawang community to be appointed as Cabinet Minister. Former Supreme council member of Parti Bansa Dayak Sarawak (PBDS). Appointed as the Chairman of PKR Sarawak in 2009. Contested for the Selangau parliamentary seat and won in May 2018.
Federal Territories Khalid Samad Former Columnist at The Malaysian Insider. Former prominent member of the moderate wing of PAS before they split to set
up the new Amanah Party.
Energy, Green Technology, Science, and Climate Change
Yeo Bee Yin Volunteered for DAP since 2012 before joining the party permanently. Contested for the first time during the 2013 general election and won the State
Constituency for Damansara Utama on a DAP ticket. Elected as the Selangor State Legislative Assemblywoman for Damansara
Utama in 2013.
Tourism, Arts and Culture Mohamaddin Ketapi Appointed as the Youth Deputy Chief of Parti Bersatu Sabah (PBS) and deputy secretary-general of the Central Committee before contesting and winning the Lahad Datu state seat in 1986.
Joined the formation of Parti Warisan Sabah 2 years ago where he was made Warisan supreme council member and Silam parliamentary division leader.
Minister in the Prime Minister’s Department (Judicial Affairs)
Liew Vui Keong Former member of Parliament of Malaysia for the Sandakan Constituency in Sabah from 2008 until his defeat in the 2013 election.
Minister in the Prime Minister’s Department (Islamic Affairs)
Mujahid Yusof Rawa Member of Parliament of Malaysia for the Parit Buntar constituency in Perak, and a member of AMANAH.
International Trade and Industry Darell Leiking Member of Parliament of Penampang Constantly urges the government to provide a definite solution to the problem of
illegal immigrants in the state, especially the problems caused by Project IC with the huge influx of Filipino refugees, and to set to rest the North Borneo dispute once and for all.
Source: Media, UOB Kay Hian

M a l a y s i a S t r a t e g y July 2018
159
Appendix 3: Key Economic Indicators And AFC KEY ECONOMIC INDICATORS
(yoy % chg) 2015 2016 2017 2018F
GDP Growth 5.0 4.2 5.9 5.0
Consumption 5.7 4.9 6.7 6.6
Public Consumption 4.4 0.9 5.4 4.0
Private Consumption 6.0 6.0 7.0 7.2
Net Exports (3.7) 1.5 (1.1) 29.8
Exports 0.3 1.1 9.6 6.5
Imports 0.8 1.1 11.0 3.7
CPI 2.1 2.1 3.7 1.5
Unemployment Rate (4Q) (%) 3.2 3.5 3.4 3.3
Current Account (% of GDP) 3.0 2.4 3.0 3.4
Fiscal Balance (FY, % of GDP) (3.2) (3.1) (2.9) (2.8)
Nominal GDP (US$b) 303.3 302.3 311.1 351.5
Per Capita GDP (US$) 9,242 9,110 9,551 10,885
Population (m) 31.2 31.6 32.1 32.9
Forex Reserves (US$b) 95.3 94.6 102.4 n.a.
RM/US$ 4.29 4.49 4.05 3.95
Policy Rate (%) 3.25 3.00 3.00 3.25
Source: BNM Annual Report 2015, UOB Global Economics & Markets Research

M a l a y s i a S t r a t e g y July 2018
160
Appendix 4: Foreign Shareholding
STOCKS WITH HIGH FOREIGN PORTFOLIO SHAREHOLDING (%)
Company Sector Foreign Shareholding (%)
Genting Bhd Gaming 45.0
Public Bank Banking 39.4
Malaysia Airports Holdings (MAHB) Airports 39.3
Genting Malaysia Gaming 39.2
Top Glove Corporation Glove 38.0
British American Tobacco (Malaysia) (BAT) Consumer 38.0
Alliance Bank Malaysia Banking 32.1
Gamuda Construction 32.0
Inari Amertron Technology 30.0
CIMB Group Holdings Banking 28.8
Bursa Malaysia Exchange 28.5
IJM Corporation Construction 26.0
Magnum Gaming 26.0
Tenaga Nasional Utilities 24.0
Sapura Energy Oil and Gas 23.0
Heineken Malaysia Consumer 22.5
Maybank Banking 22.3
AMMB Holdings Banking 22.0
Source: Bloomberg, Respective companies, UOB Kay Hian

M a l a y s i a S t r a t e g y July 2018
161
Disclosures/Disclaimers This report is prepared by UOB Kay Hian Securities (M) Sdn. Bhd. ("UOBKHM") which is a licensed corporation providing investment advisory services in Malaysia. This report is provided for information only and is not an offer or a solicitation to deal in securities or to enter into any legal relations, nor an advice or a recommendation with respect to such securities. This report is prepared for general circulation. It does not have regard to the specific investment objectives, financial situation and the particular needs of any recipient hereof. Advice should be sought from a financial adviser regarding the suitability of the investment product, taking into account the specific investment objectives, financial situation or particular needs of any person in receipt of the recommendation, before the person makes a commitment to purchase the investment product. This report is confidential. This report may not be published, circulated, reproduced or distributed in whole or in part by any recipient of this report to any other person without the prior written consent of UOBKHM. This report is not directed to or intended for distribution to or use by any person or any entity who is a citizen or resident of or located in any locality, state, country or any other jurisdiction as UOBKHM may determine in its absolute discretion, where the distribution, publication, availability or use of this report would be contrary to applicable law or would subject UOBKHM and its associated persons (as defined in the Capital Market Services Act 2007) to any registration, licensing or other requirements within such jurisdiction. The information or views in the report (“Information”) has been obtained or derived from sources believed by UOBKHM to be reliable. However, UOBKHM makes no representation as to the accuracy or completeness of such sources or the Information and UOBKHM accepts no liability whatsoever for any loss or damage arising from the use of or reliance on the Information. UOBKHM and its associate may have issued other reports expressing views different from the Information and all views expressed in all reports of UOBKHM and its connected persons are subject to change without notice. UOBKHM reserves the right to act upon or use the Information at any time, including before its publication herein. Except as otherwise indicated below, (1) UOBKHM, its associated persons and its officers, employees and representatives may, to the extent permitted by law, transact with, perform or provide broking, underwriting, corporate finance-related or other services for or solicit business from, the subject corporation(s) referred to in this report; (2) UOBKHM, its associated persons and its officers, employees and representatives may also, to the extent permitted by law, transact with, perform or provide broking or other services for or solicit business from, other persons in respect of dealings in the securities referred to in this report or other investments related thereto; (3) the officers, employees and representatives of UOBKHM may also serve on the board of directors or in trustee positions with the subject corporation(s) referred to in this report. (All of the foregoing is hereafter referred to as the “Subject Business”); and (4) UOBKHM may otherwise have an interest (including a proprietary interest) in the subject corporation(s) referred to in this report. As of the date of this report, no analyst responsible for any of the content in this report has any proprietary position or material interest in the securities of the corporation(s) which are referred to in the content they respectively author or are otherwise responsible for. IMPORTANT DISCLOSURES FOR U.S. PERSONS This research report is prepared by UOBKHM, a company authorized, as noted above, to engage in investment advisory in Malaysia. UOBKHM is not a registered broker-dealer in the United States and, therefore, is not subject to U.S. rules regarding the preparation of research reports and the independence of research analysts. This research report is provided for distribution by UOBKHM (whether directly or through its US registered broker dealer affiliate named below) to “major U.S. institutional investors” in reliance on the exemption from registration provided by Rule 15a-6 of the U.S. Securities Exchange Act of 1934, as amended (the “Exchange Act”). All US persons that receive this document by way of distribution from or which they regard as being from UOBKHM by their acceptance thereof represent and agree that they are a major institutional investor and understand the risks involved in executing transactions in securities. Any U.S. recipient of this research report wishing to effect any transaction to buy or sell securities or related financial instruments based on the information provided in this research report should do so only through UOB Kay Hian (U.S.) Inc (“UOBKHUS”), a registered broker-dealer in the United States. Under no circumstances should any recipient of this research report effect any transaction to buy or sell securities or related financial instruments through UOBKHM. UOBKHUS accepts responsibility for the contents of this research report, subject to the terms set out below, to the extent that it is delivered to and intended to be received by a U.S. person other than a major U.S. institutional investor. The analyst whose name appears in this research report is not registered or qualified as a research analyst with the Financial Industry Regulatory Authority (“FINRA”) and may not be an associated person of UOBKHUS and, therefore, may not be subject to applicable restrictions under FINRA Rules on communications with a subject company, public appearances and trading securities held by a research analyst account.

M a l a y s i a S t r a t e g y July 2018
162
Analyst Certification/Regulation AC Each research analyst of UOBKHM who produced this report hereby certifies that (1) the views expressed in this report accurately reflect his/her personal views about all of the subject corporation(s) and securities in this report; (2) the report was produced independently by him/her; (3) he/she does not carry out, whether for himself/herself or on behalf of UOBKHM or any other person, any of the Subject Business involving any of the subject corporation(s) or securities referred to in this report; and (4) he/she has not received and will not receive any compensation that is directly or indirectly related or linked to the recommendations or views expressed in this report or to any sales, trading, dealing or corporate finance advisory services or transaction in respect of the securities in this report. However, the compensation received by each such research analyst is based upon various factors, including UOBKHM’s total revenues, a portion of which are generated from UOBKHM’s business of investment advisory. Reports are distributed in the respective countries by the respective entities and are subject to the additional restrictions listed in the following table.
General This report is not intended for distribution, publication to or use by any person or entity who is a citizen or resident of or located in any country or jurisdiction where the distribution, publication or use of this report would be contrary to applicable law or regulation.
Hong Kong This report is distributed in Hong Kong by UOB Kay Hian (Hong Kong) Limited ("UOBKHHK"), which is regulated by the Securities and Futures Commission of Hong Kong. Neither the analyst(s) preparing this report nor his associate, has trading and financial interest and relevant relationship specified under Para. 16.4 of Code of Conduct in the listed corporation covered in this report. UOBKHHK does not have financial interests and business relationship specified under Para. 16.5 of Code of Conduct with the listed corporation covered in this report. Where the report is distributed in Hong Kong and contains research analyses or reports from a foreign research house, please note: (i) recipients of the analyses or reports are to contact UOBKHHK (and not the relevant foreign research house) in Hong Kong in respect of any matters arising from, or in connection with, the analysis or report; and (ii) to the extent that the analyses or reports are delivered to and intended to be received by any person in Hong Kong who is not a professional investor, or institutional investor, UOBKHHK accepts legal responsibility for the contents of the analyses or reports only to the extent required by law.
Indonesia This report is distributed in Indonesia by PT UOB Kay Hian Sekuritas, which is regulated by Financial Services Authority of Indonesia. Where the report is distributed in Indonesia and contains research analyses or reports from a foreign research house, please note recipients of the analyses or reports are to contact PT UOBKH (and not the relevant foreign research house) in Indonesia in respect of any matters arising from, or in connection with, the analysis or report.
Malaysia Where the report is distributed in Malaysia and contains research analyses or reports from a foreign research house, the recipients of the analyses or reports are to contact UOBKHM (and not the relevant foreign research house) in Malaysia, at +603-21471988, in respect of any matters arising from, or in connection with, the analysis or report as UOBKHM is the registered person under CMSA to distribute any research analyses in Malaysia.
Singapore This report is distributed in Singapore by UOB Kay Hian Private Limited ("UOBKH"), which is a holder of a capital markets services licence and an exempt financial adviser regulated by the Monetary Authority of Singapore. Where the report is distributed in Singapore and contains research analyses or reports from a foreign research house, please note: (i) recipients of the analyses or reports are to contact UOBKH (and not the relevant foreign research house) in Singapore in respect of any matters arising from, or in connection with, the analysis or report; and (ii) to the extent that the analyses or reports are delivered to and intended to be received by any person in Singapore who is not an accredited investor, expert investor or institutional investor, UOBKH accepts legal responsibility for the contents of the analyses or reports only to the extent required by law.
Thailand This report is distributed in Thailand by UOB Kay Hian Securities (Thailand) Public Company Limited, which is regulated by the Securities and Exchange Commission of Thailand.
United Kingdom
This report is being distributed in the UK by UOB Kay Hian (U.K.) Limited, which is an authorised person in the meaning of the Financial Services and Markets Act and is regulated by The Financial Conduct Authority. Research distributed in the UK is intended only for institutional clients.
United States of America (“U.S.”)
This report cannot be distributed into the U.S. or to any U.S. person or entity except in compliance with applicable U.S. laws and regulations. It is being distributed in the U.S. by UOB Kay Hian (US) Inc, which accepts responsibility for its contents. Any U.S. person or entity receiving this report and wishing to effect transactions in any securities referred to in the report should contact UOB Kay Hian (US) Inc. directly.
Copyright 2018, UOB Kay Hian Securities (M) Sdn. Bhd. All rights reserved. http://www.utrade.com.my