Prerequisite Validation Study - Crafton Hills College/media/Files/SBCCD/CHC/About CHC... ·...
33
Prerequisite Validation Study Examination of Reading and English as Prerequisites to RELIG-100 (Introduction to Religious Studies) and RELIG-101 (Introduction to World Religions) Prepared by: Keith Wurtz Office of Research and Planning Date: 20120127 PrereqValidReligion.docx Grades_CHC_GOR_20110614_FiveYears_0607to1011.sav Grades_CHC_GOR_RELIG_20110614_FiveYears_0607to1011.sav Office of Research & Planning RRN 316
Transcript of Prerequisite Validation Study - Crafton Hills College/media/Files/SBCCD/CHC/About CHC... ·...
Prerequisite Validation Study
Examination of Reading and English as Prerequisites to RELIG-100 (Introduction to Religious Studies) and RELIG-101 (Introduction to World Religions)
Prepared by: Keith Wurtz
Office of Research and Planning Date: 20120127
PrereqValidReligion.docx Grades_CHC_GOR_20110614_FiveYears_0607to1011.sav
Grades_CHC_GOR_RELIG_20110614_FiveYears_0607to1011.sav
Offic e of
Researc h & Planning RRN
316
2
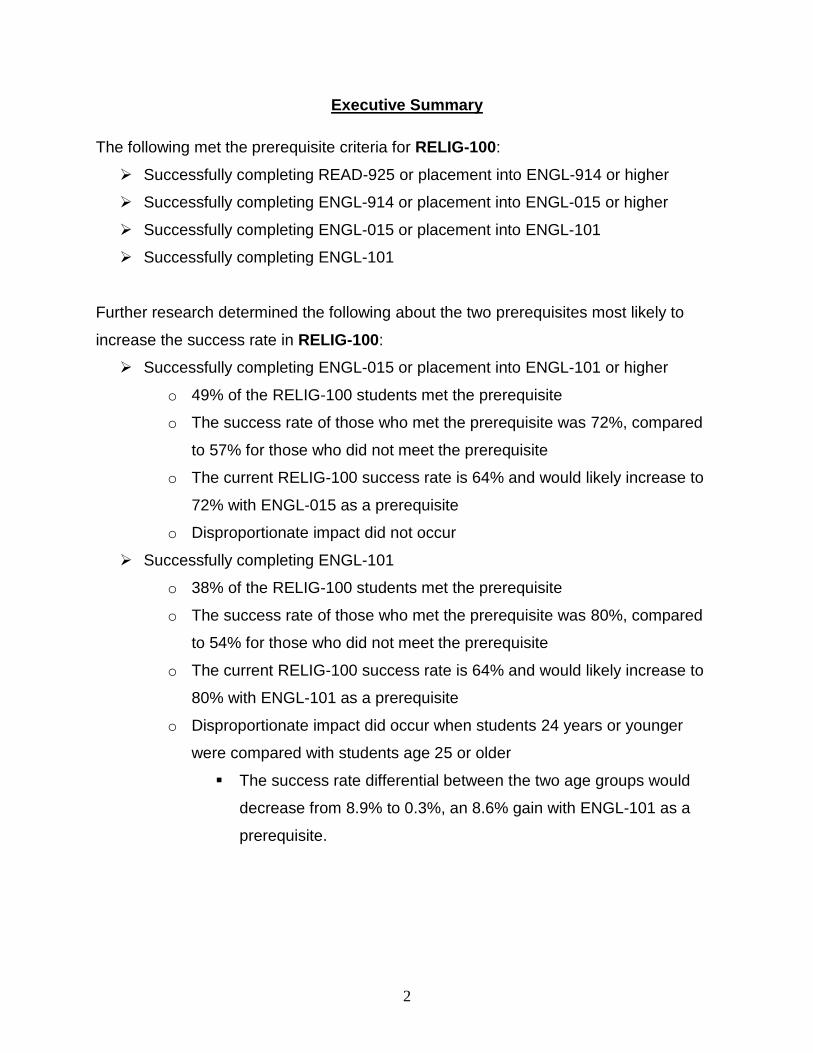
Executive Summary
The following met the prerequisite criteria for RELIG-100:
Successfully completing READ-925 or placement into ENGL-914 or higher
Successfully completing ENGL-914 or placement into ENGL-015 or higher
Successfully completing ENGL-015 or placement into ENGL-101
Successfully completing ENGL-101
Further research determined the following about the two prerequisites most likely to
increase the success rate in RELIG-100:
Successfully completing ENGL-015 or placement into ENGL-101 or higher
o 49% of the RELIG-100 students met the prerequisite
o The success rate of those who met the prerequisite was 72%, compared
to 57% for those who did not meet the prerequisite
o The current RELIG-100 success rate is 64% and would likely increase to
72% with ENGL-015 as a prerequisite
o Disproportionate impact did not occur
Successfully completing ENGL-101
o 38% of the RELIG-100 students met the prerequisite
o The success rate of those who met the prerequisite was 80%, compared
to 54% for those who did not meet the prerequisite
o The current RELIG-100 success rate is 64% and would likely increase to
80% with ENGL-101 as a prerequisite
o Disproportionate impact did occur when students 24 years or younger
were compared with students age 25 or older
The success rate differential between the two age groups would
decrease from 8.9% to 0.3%, an 8.6% gain with ENGL-101 as a
prerequisite.
3
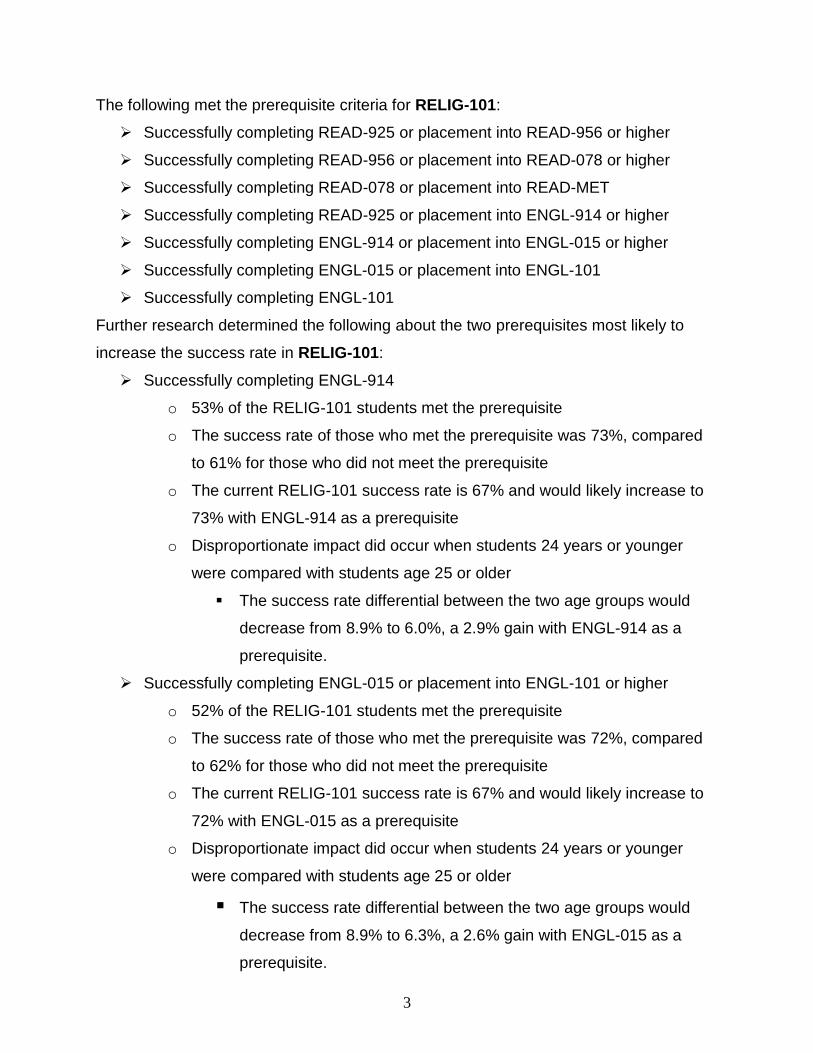
The following met the prerequisite criteria for RELIG-101:
Successfully completing READ-925 or placement into READ-956 or higher
Successfully completing READ-956 or placement into READ-078 or higher
Successfully completing READ-078 or placement into READ-MET
Successfully completing READ-925 or placement into ENGL-914 or higher
Successfully completing ENGL-914 or placement into ENGL-015 or higher
Successfully completing ENGL-015 or placement into ENGL-101
Successfully completing ENGL-101
Further research determined the following about the two prerequisites most likely to
increase the success rate in RELIG-101:
Successfully completing ENGL-914
o 53% of the RELIG-101 students met the prerequisite
o The success rate of those who met the prerequisite was 73%, compared
to 61% for those who did not meet the prerequisite
o The current RELIG-101 success rate is 67% and would likely increase to
73% with ENGL-914 as a prerequisite
o Disproportionate impact did occur when students 24 years or younger
were compared with students age 25 or older
The success rate differential between the two age groups would
decrease from 8.9% to 6.0%, a 2.9% gain with ENGL-914 as a
prerequisite.
Successfully completing ENGL-015 or placement into ENGL-101 or higher
o 52% of the RELIG-101 students met the prerequisite
o The success rate of those who met the prerequisite was 72%, compared
to 62% for those who did not meet the prerequisite
o The current RELIG-101 success rate is 67% and would likely increase to
72% with ENGL-015 as a prerequisite
o Disproportionate impact did occur when students 24 years or younger
were compared with students age 25 or older
The success rate differential between the two age groups would
decrease from 8.9% to 6.3%, a 2.6% gain with ENGL-015 as a
prerequisite.

4
Crafton Hills College Prerequisite Validation Studies
Background Title V Education Code regulations for prerequisites prior to February 2011 prohibited
colleges from establishing prerequisites unless the college uses “…sound research
practices and shows that a student is highly unlikely to succeed in the course unless the
student has met the proposed prerequisite….” Specifically, Title 5, Section 55201(3) (e)
stated that “a course in communication or computation skills may be established as a
prerequisite or corequisite for any course other than another course in communication
or computation skills only if, in addition to conducting a content review, the district
gathers data according to sound research practices and shows that a student is highly
unlikely to succeed in the course unless the student has met the proposed prerequisite
or corequisite.”
To assist districts in identifying and establishing “sound research practices,” the
California Community College Chancellor’s Office, Academic Senate for California
Community Colleges, the California Association of Community Colleges (CACC)
Commission on Research, the Research & Planning (RP) Group (at the time divided
into two entities – the Northern California Community College Research Group
(NORCAL) and the Southern California Community College Institutional Research
Association (SCCCIRA)), and the Matriculation Regional Advisory Committee all worked
diligently throughout the late 1980s and 1990s to develop a number of seminal
documents that had served as blueprints for researchers engaged in matriculation
evaluation. Influential publications include:
“The Model District Policy for Prerequisites, Corequisites, and Advisories on
Recommended Preparation, and Other Limitations on Enrollment” (September, 1993)
California Community College Chancellor’s Office “Matriculation Regulations” (rev. March 1998)
“Prerequisites, Corequisites, Advisories, and Limitations on Enrollment” (Fall 1997) – A questions-and-answers document prepared by the California Community College Chancellor’s Office and the Academic Senate of California

5
Community Colleges that provides technical assistance and interpretation of Title 5 regulations.
“Are Prerequisites Really That Hard to Establish?” – A short follow-up document prepared by Bill Scroggins
“Matriculation Standards” – Prepared by the Chancellor’s Office, this document identifies the various components of Matriculation and provides cross-references to Title 5 and AB-3 (Seymour-Campbell Matriculation Act of 1986)
“Matriculation Local Research Options Project” (November, 1989) – the initial document prepared by the California Community College Chancellor’s Office, CACC, SCCCIRA, NORCAL, and the Matriculation Regional Advisory Committee to assist districts in developing and conducting local Matriculation research
“Assessment Validation Project Local Research Options” (February, 1991) “Matriculation Evaluation: Monographs on Designs from the Local Research
Options Project” (February, 1992) – the second series of Matriculation research studies presented by the aforementioned groups
“Matriculation Evaluation: Phase III Local Research Options” (June, 1992) – the third series of Matriculation research designs addressed by the CCCCO, CACC, SCCCIRA, and NORCAL
However, in 2010 the California Community College Board of Governors expressed
concern about the effects of requiring sound research practices to establish
prerequisites on students (Russell, 2011). It was argued that the requirements prior to
2011 prohibited districts from establishing prerequisites unless students had a high
failure rate. Accordingly, the emphasis has been on failure rather than success. In
addition, the Academic Senate and other observers have argued for changes in this
area to make it easier for colleges to establish prerequisites, thereby increasing the
likelihood of student success.
In 2010 a Prerequisite Task Force was organized to include representatives from the
Academic Senate, Chief Instructional Officers, Chief Student Services Officers, and the
Chancellor’s Office (Russell, 2011). The recommendation of the Prerequisite Task
Force was that Title 5 be changed to be “permissive.” This would allow colleges to use
content review if they choose, rather than requiring “sound research practices” for
prerequisites that provide skills in reading, writing, or mathematics for courses other
than those in communication or computation. Moreover, the Prerequisite Task Force
also felt that Title 5 regulations needed to continue to require colleges to examine the

6
disproportionate impact of any prerequisite. According to Russell (2011), “The primary
goal of this regulation change is to increase student success throughout the California
Community Colleges.”
The Research and Planning Group (RP Group, 2010) responded to the newly proposed
regulations amended to Title 5 and did not support the amendment. Namely, the RP
Group (2010) argued that “Without [the] statistical validation of prerequisites, it is
virtually impossible to demonstrate that the establishment of prerequisites leads to an
improvement in student success.” The RP Group (2011) and the Crafton Hills College
Office of Research and Planning (ORP) is committed to ensuring that decision-making
is evidence-based. The RP Group does not support the establishment of prerequisites
based solely on a content review, and believes that decisions need to be supported by
multiple forms of research. The mission of the CHC ORP “…is to collaborate with
faculty, administration, staff, and students to provide high quality educational programs
and services by integrating institutional research, planning, analysis, and systematic
assessment to inform evidenced-based decision making and learning.” Consequently,
the CHC ORP supports providing multiple forms of evidence to help inform decision-
making with the ultimate goal of helping to increase student success.
The CHC ORP has thoroughly reviewed the referenced documents and has
incorporated a number of the identified best practices into Matriculation research
projects. Specific to the studies referenced in this document, the Crafton Hills College
Office of Research and Planning has developed a consistent methodology for
examining prerequisites, corequisites, and advisories courses that uses multiple forms
of statistical evidence to inform decision-making. The purpose of this research study is
to use “sound research practices” to examine what extent reading or writing proficiency
is a valid predictor of success in RELIG-100 or RELIG-101.

7
Sample
Two hundred and sixty-one students earned their first GOR in RELIG-100 from 2008 –
2009 to 2010 – 2011. Of those, 167 (64%) successfully completed RELIG-100 with a
“C” grade or better. In addition, 450 students earned their first GOR in RELIG-101 from
2008 – 2009 to 2010 – 2011. Of those, 303 (67%) successfully completed RELIG-101
with a “C” grade or better.
Methodology Working with the Crafton Hills College Dean of Arts and Sciences, Assessment Office,
and the Psychology faculty member who teaches and coordinates religion – the ORP
studied the effect of adding a reading and English competency pre-requisite as a
requirement for enrolling in Introduction to Religion (RELIG-100) or Introduction to
World Religions (RELIG-101). The ORP explored the following reading and English
courses as possible prerequisites for RELIG-100 and RELIG-101; READ 925
(Introduction to Reading), READ 956 (Intermediate Reading), READ 078 (Advanced
Reading), ENGL-914 (Basic English Skills), ENGL-015 (Preparation for College
Writing), and ENGL-101 (Freshman Composition). The research is intended to
measure the strength of the relationship between students reading or writing level and
the successful completion of RELIG-100 or RELIG-101. In this study reading and
English assessment placement and course completion are being treated as equivalent
to one another. Table 1 below shows how the reading assessment placements are
equivalent to successfully completing a reading course and Table 2 illustrates how the
reading assessment placements are equivalent to successfully completing an English
course.
Table 1: Reading Course Successful Grades and Equivalent Corresponding Reading Placements.
Successful Grade in Following Course Corresponding Reading Placement
NA READ-925
READ-925 READ-956
READ-956 READ-078
READ-078 NO READ

8
Table 2: English Course Successful Grades and Equivalent Corresponding English Placements.
Successful Grade in Following Course Corresponding Reading Placement
READ-925 ENGL-914
ENGL-914 ENGL-015
ENGL-015 ENGL-101
ENGL-101 NA
When examining how well the reading assessment test is a valid predictor of student
outcomes in RELIG-100 or 101 there are five possible Criterion/Outcome measures of
student course performance:
1. Points or scores
2. Midterm grade
3. Final grade
4. Only Credit/No Credit
5. Successful/Not Successful
The most common measure used is final grade. From a research perspective, use of a
final grade is attractive because final grades are accessible from a computer database;
however, one difficulty with using final grades as a criterion measure is that students
who withdraw may not be included (Rasor, 1991). In addition, grades represent a
limited five-point scale of performance and using a five point-scale does not control for
instructor variation in evaluation procedures. In establishing sufficient evidence to
enforce prerequisites that have a communication or computational skills component, the
Crafton Hills College Office of Research and Planning has taken a three-pronged
approach:
Comparison of Performance in the Target Course of Students Who Did and Did
Not Meet the Prerequisite:
Using RP Group definitions that have been adopted by the Chancellor’s Office, the
Crafton Hills College Office of Research and Planning used the District’s Management
Information System (MIS) data to initially identify all students who earned a grade on
record (A, B, C, CR, D, F, FW, NC, I, or W) in the target courses, RELIG-100 and 101

9
for Fall 2008, Spring 2009, Fall 2009, Spring 2010, Fall 2010, and Spring 2011. While a
student may have taken the target course multiple times, for purposes of prerequisite
validation only the first attempt in the target course was examined. Further coding was
created to identify students who were successful (earned an A, B, C, or CR grade) or
unsuccessful (earned a grade of D, F, FW, NC, I, or W) in the target course. Successful
grades were divided by total grades earned on record to compute success rate.
Once this step was completed, course outcomes for students who successfully
completed the prerequisite course, or tested at an equivalent reading or writing
assessment level prior to completing RELIG-100 or 101 were merged into the target
course file. For prerequisite courses, the best attempt (i.e., the highest grade earned in
the prerequisite course) was identified and merged into the target file. Using the
aforementioned definitions, a student was identified as having met the prerequisite if
he/she earned a successful grade on record in the prerequisite course or student
earned a sufficiently high enough placement recommendation on the assessment test.
Conversely, students who did not meet the prerequisite were identified as students who:
a) did not take the prerequisite course; b) the highest grade earned on record in the
prerequisite courses was a non-successful grade; or c) did not score at an equivalent
level on the assessment test.
Once the target course outcome of prerequisite completers and non-completers was
identified, the Office of Research and Planning conducted an independent samples t-
test to determine whether statistically significant differences in the target course
outcome existed between prerequisite completers and non-completers. The table on
page 13 illustrates the overall success rates in the target courses, the success rates of
students who met the prerequisites, the success rates of students who did not meet the
prerequisites, the percentage of students in the target courses who met the prerequisite,
and whether the success rates of completers/non-completers were identified as
statistically significantly different (p < .05).
10
Effect Size and Average Percent Gain:
Recognizing that statistically significant differences are often an artifact of sample size
(with large samples, only minimal differences can produce statistically significant
results; conversely, with small samples large outcome differences may not be identified
as statistically significantly different), effect size and the 95% confidence interval (CI) for
the effect size were also examined. In essence, effect size measures the strength of a
relationship between two variables, controlling for the influence of sample size.
Since t-tests were initially used to explore whether statistically significant differences
existed between prerequisite completers and non-completers, the logical measure
employed by the Office of Research and Planning to determine effect size was Cohen’s
d. Cohen’s d is defined as the difference between the two means divided by the pooled
standard deviation for the two means. Obtaining basic statistical data about the
populations in question (means and standard deviations); researchers can easily
calculate effect size. While interpretations vary, the most commonly accepted
interpretations suggest that a d of 0.20 indicates a small effect, 0.50 a medium effect,
and 0.80 or higher a large effect. Recognizing the difficulty in identifying a relationship
between two variables in a quasi-experimental environment like postsecondary
education, for the purposes of the current study sufficient evidence was considered to
exist if an effect size of 0.20 or higher was observed. In addition, the 95% effect size
confidence interval was to indicate when the relationship between meeting the
prerequisite and successfully completing the target course was more likely to lead to an
increase in the success rate. Specifically, a lower effect size limit higher than 0
indicates that the effect of the prerequisite has a 95% probability of increasing the
success rate in the target course.
Restricted Bivariate Correlation Coefficient and Corrections for Restriction of
Range:
Correlation coefficients are another method of examining the strength of a relationship
between two variables. For the purposes of the current study researchers employed

11
what is probably the most frequently used correlation coefficient, Pearson’s Product
Moment Correlation Coefficient, more commonly known as Pearson’s r. The Pearson’s
r employed in the current study examined the relationship between performance in the
prerequisite course and performance in the target course. Again recognizing the quasi-
experimental nature of postsecondary education, the Chancellor’s Office had previously
established a rough rule-of-thumb for obtained correlation coefficient. While usually
considered a moderate association, the Chancellor’s Office had established a positive
correlation coefficient of .35 as sufficient evidence that a relationship exists between a
prerequisite course and a target course, assuming that p < .05.
While the Pearson’s r provides an initial measure of the association between two
variables, an important consideration is the restricted distribution of prerequisite course
grades. In practical terms, only students who successfully complete the prerequisite
course will be permitted to enroll in the target course. While both distributions
(prerequisite and target course grades) represent continuous data, the prerequisite
course grades are restricted to students who were successful in the prerequisite course
(“C” grade or higher). Consistent with methodology cited in one of the local research
options documents, the Crafton Hills College Office of Research and Planning
recalculated the correlation coefficient between the prerequisite and target courses,
correcting for restriction of range. The excel spreadsheet on page 13 identifies the
restricted bivariate correlation coefficients, the number of cases examined in the
correlation generated, the p value of the correlation, and the correlation after a
correction for restriction of range is applied. Again, a correlation coefficient of .35 or
higher is considered sufficient evidence when examining the correlation corrected for
restriction of range.
For local validation efforts, the Crafton Hills College Office of Research and Planning
has developed a simple color-coding scheme to indicate whether sufficient evidence
existed to implement the proposed prerequisite:
Green – Sufficient evidence exists to enforce prerequisite (at least two out of three measures supported)
12
Yellow – Although evidence exists, only one out of three measures supports the prerequisite. Further discussion should occur within the department and the Curriculum Committee before the prerequisite is enforced
Red – Data does not exist to support enforcement of the prerequisite. None of the measures explored meet pre-established criteria
Insufficient Data – While evidence may point to the efficacy of the prerequisite, the sample size is too small to render a reliable decision.
The table on the following page presents evidence for the interdisciplinary prerequisites
that were examined and the color-coded recommendation generated by the Office of
Research and Planning based upon the data examined.
13
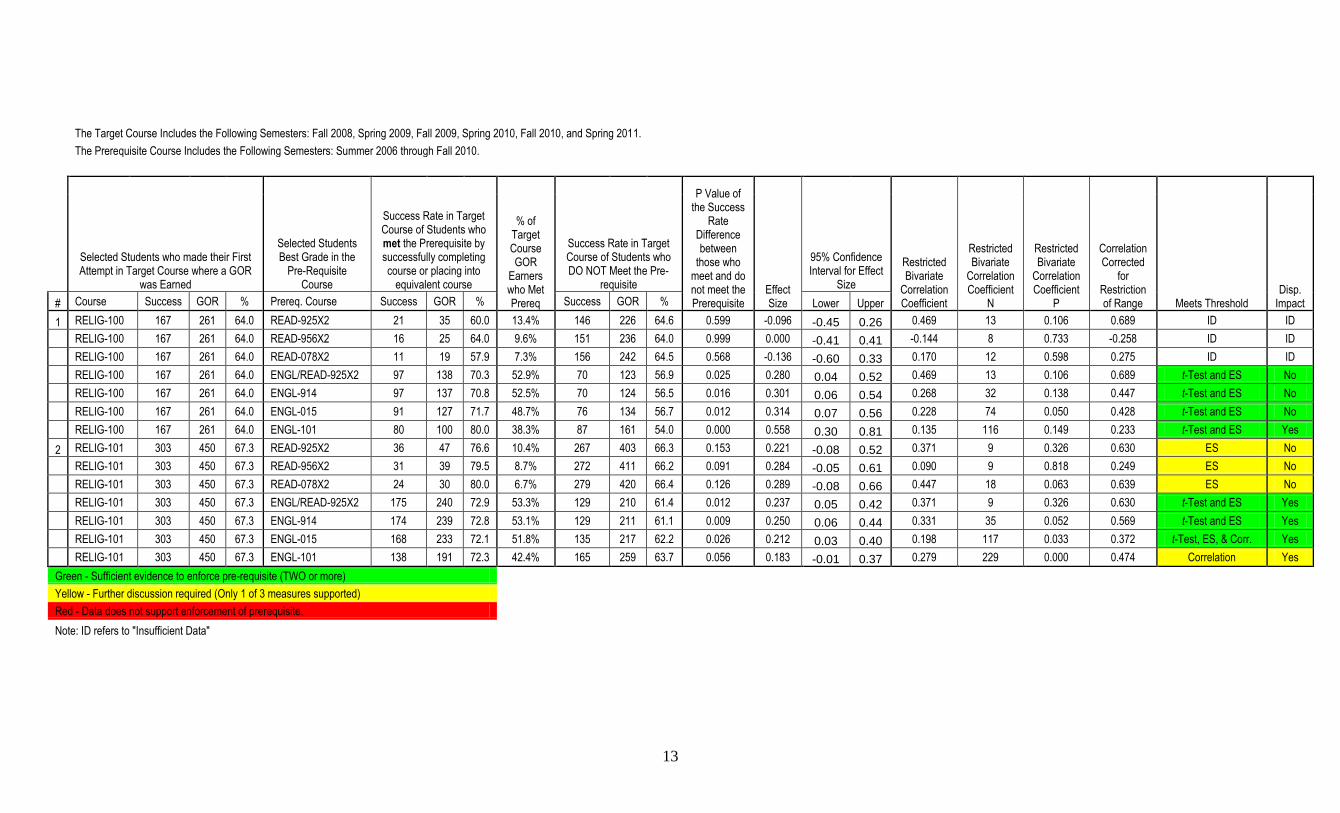
The Target Course Includes the Following Semesters: Fall 2008, Spring 2009, Fall 2009, Spring 2010, Fall 2010, and Spring 2011.
The Prerequisite Course Includes the Following Semesters: Summer 2006 through Fall 2010.
Selected Students who made their First Attempt in Target Course where a GOR
was Earned
Selected Students Best Grade in the
Pre-Requisite Course
Success Rate in Target Course of Students who met the Prerequisite by successfully completing course or placing into
equivalent course
% of Target Course GOR
Earners who Met Prereq
Success Rate in Target Course of Students who DO NOT Meet the Pre-
requisite
P Value of the Success
Rate Difference between
those who meet and do not meet the Prerequisite
Effect Size
95% Confidence Interval for Effect
Size
Restricted Bivariate
Correlation Coefficient
Restricted Bivariate
Correlation Coefficient
N
Restricted Bivariate
Correlation Coefficient
P
Correlation Corrected
for Restriction of Range Meets Threshold
Disp. Impact
# Course Success GOR % Prereq. Course Success GOR % Success GOR % Lower Upper
1 RELIG-100 167 261 64.0 READ-925X2 21 35 60.0 13.4% 146 226 64.6 0.599 -0.096 -0.45 0.26 0.469 13 0.106 0.689 ID ID
RELIG-100 167 261 64.0 READ-956X2 16 25 64.0 9.6% 151 236 64.0 0.999 0.000 -0.41 0.41 -0.144 8 0.733 -0.258 ID ID
RELIG-100 167 261 64.0 READ-078X2 11 19 57.9 7.3% 156 242 64.5 0.568 -0.136 -0.60 0.33 0.170 12 0.598 0.275 ID ID
RELIG-100 167 261 64.0 ENGL/READ-925X2 97 138 70.3 52.9% 70 123 56.9 0.025 0.280 0.04 0.52 0.469 13 0.106 0.689 t-Test and ES No
RELIG-100 167 261 64.0 ENGL-914 97 137 70.8 52.5% 70 124 56.5 0.016 0.301 0.06 0.54 0.268 32 0.138 0.447 t-Test and ES No
RELIG-100 167 261 64.0 ENGL-015 91 127 71.7 48.7% 76 134 56.7 0.012 0.314 0.07 0.56 0.228 74 0.050 0.428 t-Test and ES No
RELIG-100 167 261 64.0 ENGL-101 80 100 80.0 38.3% 87 161 54.0 0.000 0.558 0.30 0.81 0.135 116 0.149 0.233 t-Test and ES Yes
2 RELIG-101 303 450 67.3 READ-925X2 36 47 76.6 10.4% 267 403 66.3 0.153 0.221 -0.08 0.52 0.371 9 0.326 0.630 ES No
RELIG-101 303 450 67.3 READ-956X2 31 39 79.5 8.7% 272 411 66.2 0.091 0.284 -0.05 0.61 0.090 9 0.818 0.249 ES No
RELIG-101 303 450 67.3 READ-078X2 24 30 80.0 6.7% 279 420 66.4 0.126 0.289 -0.08 0.66 0.447 18 0.063 0.639 ES No
RELIG-101 303 450 67.3 ENGL/READ-925X2 175 240 72.9 53.3% 129 210 61.4 0.012 0.237 0.05 0.42 0.371 9 0.326 0.630 t-Test and ES Yes
RELIG-101 303 450 67.3 ENGL-914 174 239 72.8 53.1% 129 211 61.1 0.009 0.250 0.06 0.44 0.331 35 0.052 0.569 t-Test and ES Yes
RELIG-101 303 450 67.3 ENGL-015 168 233 72.1 51.8% 135 217 62.2 0.026 0.212 0.03 0.40 0.198 117 0.033 0.372 t-Test, ES, & Corr. Yes
RELIG-101 303 450 67.3 ENGL-101 138 191 72.3 42.4% 165 259 63.7 0.056 0.183 -0.01 0.37 0.279 229 0.000 0.474 Correlation Yes
Green - Sufficient evidence to enforce pre-requisite (TWO or more)
Yellow - Further discussion required (Only 1 of 3 measures supported)
Red - Data does not support enforcement of prerequisite.
Note: ID refers to "Insufficient Data"
14
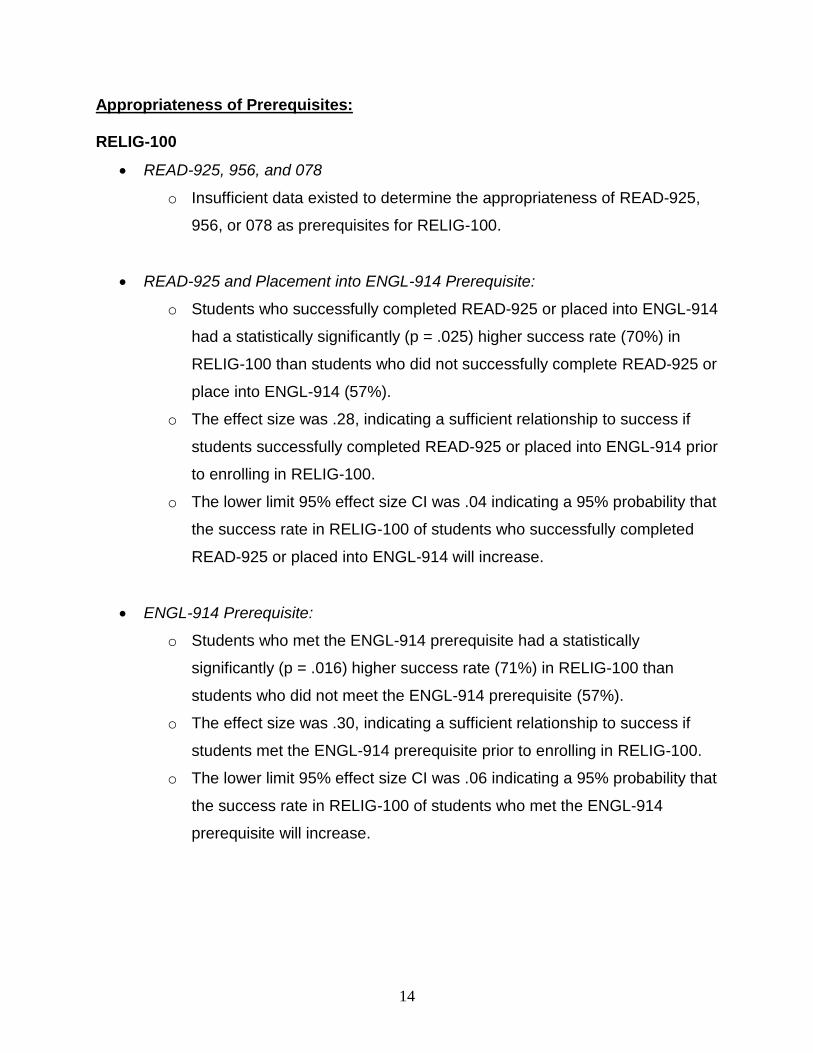
Appropriateness of Prerequisites: RELIG-100
READ-925, 956, and 078
o Insufficient data existed to determine the appropriateness of READ-925,
956, or 078 as prerequisites for RELIG-100.
READ-925 and Placement into ENGL-914 Prerequisite:
o Students who successfully completed READ-925 or placed into ENGL-914
had a statistically significantly (p = .025) higher success rate (70%) in
RELIG-100 than students who did not successfully complete READ-925 or
place into ENGL-914 (57%).
o The effect size was .28, indicating a sufficient relationship to success if
students successfully completed READ-925 or placed into ENGL-914 prior
to enrolling in RELIG-100.
o The lower limit 95% effect size CI was .04 indicating a 95% probability that
the success rate in RELIG-100 of students who successfully completed
READ-925 or placed into ENGL-914 will increase.
ENGL-914 Prerequisite:
o Students who met the ENGL-914 prerequisite had a statistically
significantly (p = .016) higher success rate (71%) in RELIG-100 than
students who did not meet the ENGL-914 prerequisite (57%).
o The effect size was .30, indicating a sufficient relationship to success if
students met the ENGL-914 prerequisite prior to enrolling in RELIG-100.
o The lower limit 95% effect size CI was .06 indicating a 95% probability that
the success rate in RELIG-100 of students who met the ENGL-914
prerequisite will increase.

15
RELIG-100 (Continued)
ENGL-015 Prerequisite:
o Students who met the ENGL-015 prerequisite had a statistically
significantly (p = .012) higher success rate (72%) in RELIG-100 than
students who did not meet the ENGL-015 prerequisite (57%).
o The effect size was .31, indicating a sufficient relationship to success if
students met the ENGL-015 prerequisite prior to enrolling in RELIG-100.
o The lower limit 95% effect size CI was .07 indicating a 95% probability that
the success rate in RELIG-100 of students who met the ENGL-015
prerequisite will increase.
ENGL-101 Prerequisite:
o Students who met the ENGL-101 prerequisite had a statistically
significantly (p < .001) higher success rate (80%) in RELIG-100 than
students who did not meet the ENGL-101 prerequisite (54%).
o The effect size was .56, indicating a substantial relationship to success if
students met the ENGL-101 prerequisite prior to enrolling in RELIG-100.
o The lower limit 95% effect size CI was .30 strongly indicating a 95%
probability that the success rate in RELIG-100 of students who met the
ENGL-101 prerequisite will increase substantially.
RELIG-101
READ-925 and Placement into READ-956 Prerequisite:
o Students who successfully completed READ-925 or placed into READ-
956 had a substantially (ES = .22) higher success rate (77%) in RELIG-
101 than students who did not successfully complete READ-925 or place
into READ-956 (66%).
16
RELIG-100 (Continued)
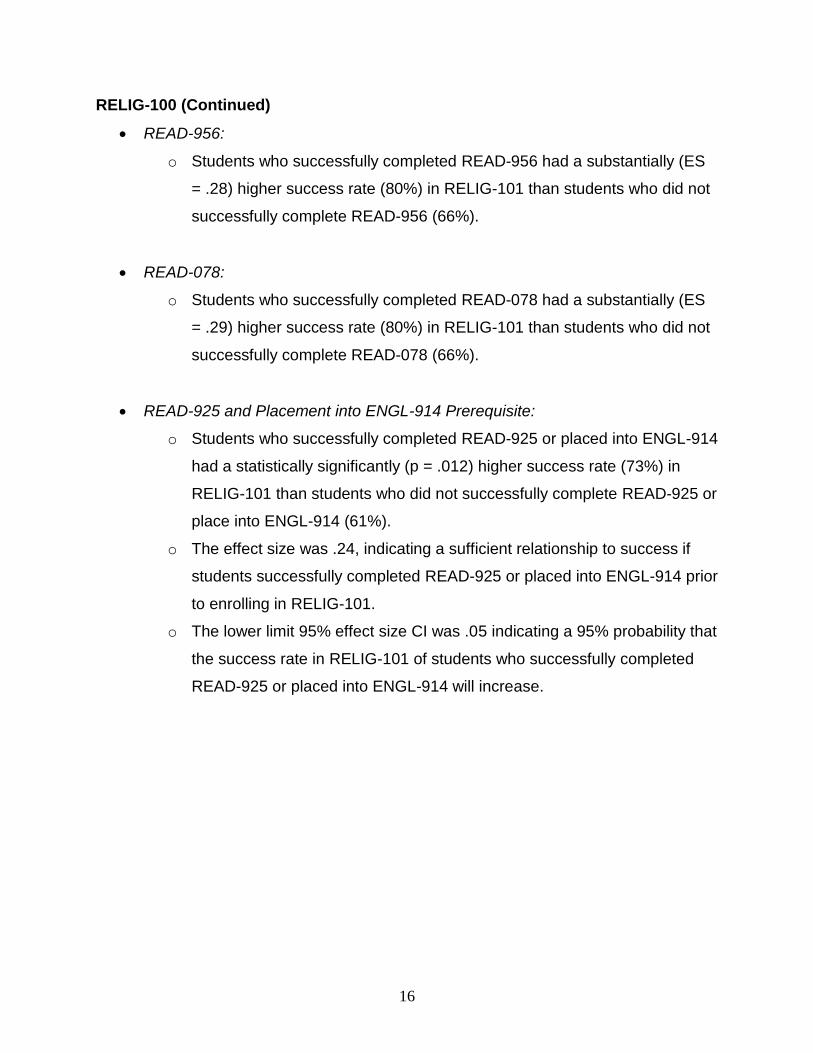
READ-956:
o Students who successfully completed READ-956 had a substantially (ES
= .28) higher success rate (80%) in RELIG-101 than students who did not
successfully complete READ-956 (66%).
READ-078:
o Students who successfully completed READ-078 had a substantially (ES
= .29) higher success rate (80%) in RELIG-101 than students who did not
successfully complete READ-078 (66%).
READ-925 and Placement into ENGL-914 Prerequisite:
o Students who successfully completed READ-925 or placed into ENGL-914
had a statistically significantly (p = .012) higher success rate (73%) in
RELIG-101 than students who did not successfully complete READ-925 or
place into ENGL-914 (61%).
o The effect size was .24, indicating a sufficient relationship to success if
students successfully completed READ-925 or placed into ENGL-914 prior
to enrolling in RELIG-101.
o The lower limit 95% effect size CI was .05 indicating a 95% probability that
the success rate in RELIG-101 of students who successfully completed
READ-925 or placed into ENGL-914 will increase.
17
RELIG-100 (Continued)
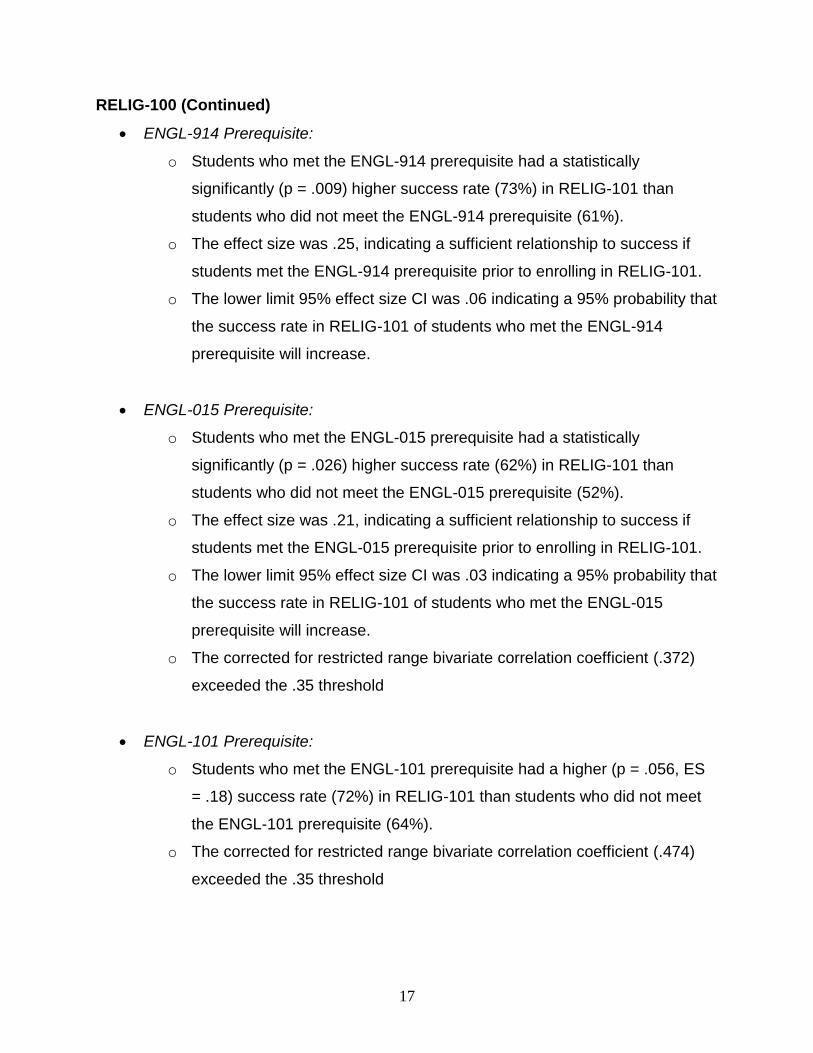
ENGL-914 Prerequisite:
o Students who met the ENGL-914 prerequisite had a statistically
significantly (p = .009) higher success rate (73%) in RELIG-101 than
students who did not meet the ENGL-914 prerequisite (61%).
o The effect size was .25, indicating a sufficient relationship to success if
students met the ENGL-914 prerequisite prior to enrolling in RELIG-101.
o The lower limit 95% effect size CI was .06 indicating a 95% probability that
the success rate in RELIG-101 of students who met the ENGL-914
prerequisite will increase.
ENGL-015 Prerequisite:
o Students who met the ENGL-015 prerequisite had a statistically
significantly (p = .026) higher success rate (62%) in RELIG-101 than
students who did not meet the ENGL-015 prerequisite (52%).
o The effect size was .21, indicating a sufficient relationship to success if
students met the ENGL-015 prerequisite prior to enrolling in RELIG-101.
o The lower limit 95% effect size CI was .03 indicating a 95% probability that
the success rate in RELIG-101 of students who met the ENGL-015
prerequisite will increase.
o The corrected for restricted range bivariate correlation coefficient (.372)
exceeded the .35 threshold
ENGL-101 Prerequisite:
o Students who met the ENGL-101 prerequisite had a higher (p = .056, ES
= .18) success rate (72%) in RELIG-101 than students who did not meet
the ENGL-101 prerequisite (64%).
o The corrected for restricted range bivariate correlation coefficient (.474)
exceeded the .35 threshold
18
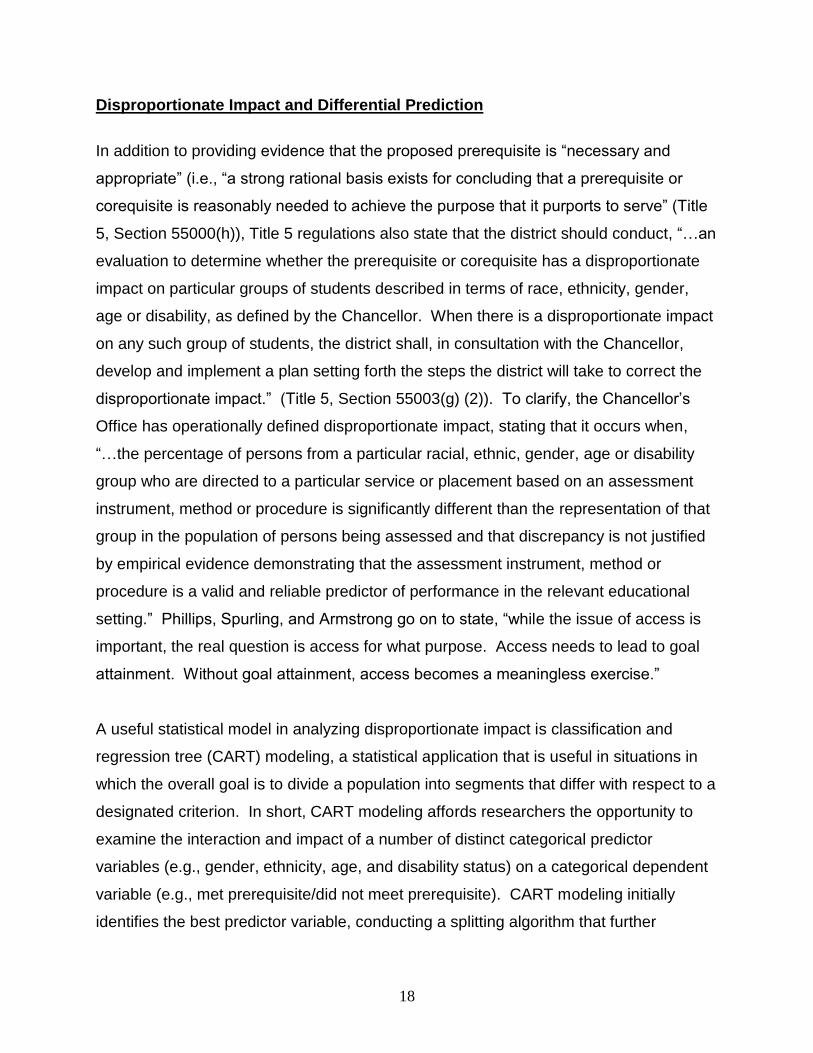
Disproportionate Impact and Differential Prediction
In addition to providing evidence that the proposed prerequisite is “necessary and
appropriate” (i.e., “a strong rational basis exists for concluding that a prerequisite or
corequisite is reasonably needed to achieve the purpose that it purports to serve” (Title
5, Section 55000(h)), Title 5 regulations also state that the district should conduct, “…an
evaluation to determine whether the prerequisite or corequisite has a disproportionate
impact on particular groups of students described in terms of race, ethnicity, gender,
age or disability, as defined by the Chancellor. When there is a disproportionate impact
on any such group of students, the district shall, in consultation with the Chancellor,
develop and implement a plan setting forth the steps the district will take to correct the
disproportionate impact.” (Title 5, Section 55003(g) (2)). To clarify, the Chancellor’s
Office has operationally defined disproportionate impact, stating that it occurs when,
“…the percentage of persons from a particular racial, ethnic, gender, age or disability
group who are directed to a particular service or placement based on an assessment
instrument, method or procedure is significantly different than the representation of that
group in the population of persons being assessed and that discrepancy is not justified
by empirical evidence demonstrating that the assessment instrument, method or
procedure is a valid and reliable predictor of performance in the relevant educational
setting.” Phillips, Spurling, and Armstrong go on to state, “while the issue of access is
important, the real question is access for what purpose. Access needs to lead to goal
attainment. Without goal attainment, access becomes a meaningless exercise.”
A useful statistical model in analyzing disproportionate impact is classification and
regression tree (CART) modeling, a statistical application that is useful in situations in
which the overall goal is to divide a population into segments that differ with respect to a
designated criterion. In short, CART modeling affords researchers the opportunity to
examine the interaction and impact of a number of distinct categorical predictor
variables (e.g., gender, ethnicity, age, and disability status) on a categorical dependent
variable (e.g., met prerequisite/did not meet prerequisite). CART modeling initially
identifies the best predictor variable, conducting a splitting algorithm that further
19
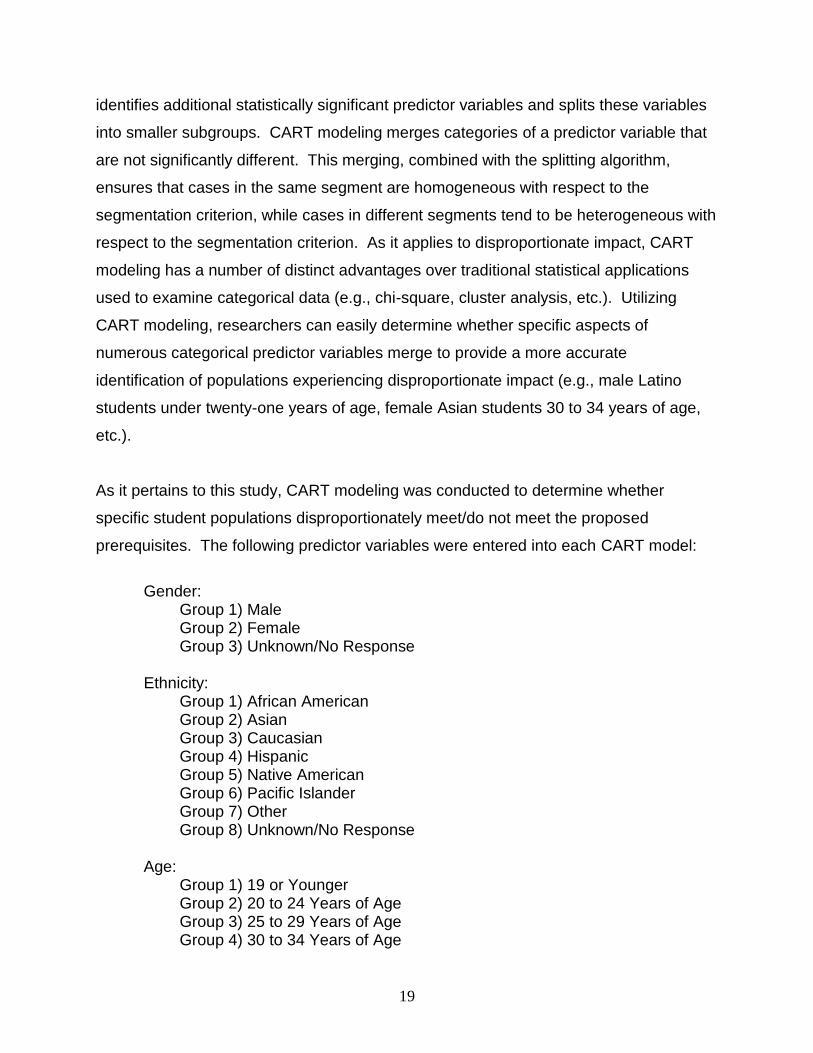
identifies additional statistically significant predictor variables and splits these variables
into smaller subgroups. CART modeling merges categories of a predictor variable that
are not significantly different. This merging, combined with the splitting algorithm,
ensures that cases in the same segment are homogeneous with respect to the
segmentation criterion, while cases in different segments tend to be heterogeneous with
respect to the segmentation criterion. As it applies to disproportionate impact, CART
modeling has a number of distinct advantages over traditional statistical applications
used to examine categorical data (e.g., chi-square, cluster analysis, etc.). Utilizing
CART modeling, researchers can easily determine whether specific aspects of
numerous categorical predictor variables merge to provide a more accurate
identification of populations experiencing disproportionate impact (e.g., male Latino
students under twenty-one years of age, female Asian students 30 to 34 years of age,
etc.).
As it pertains to this study, CART modeling was conducted to determine whether
specific student populations disproportionately meet/do not meet the proposed
prerequisites. The following predictor variables were entered into each CART model:
Gender: Group 1) Male Group 2) Female Group 3) Unknown/No Response Ethnicity: Group 1) African American Group 2) Asian Group 3) Caucasian Group 4) Hispanic
Group 5) Native American Group 6) Pacific Islander Group 7) Other Group 8) Unknown/No Response
Age: Group 1) 19 or Younger Group 2) 20 to 24 Years of Age Group 3) 25 to 29 Years of Age Group 4) 30 to 34 Years of Age

20
Group 5) 35 to 39 Years of Age Group 6) 40 to 49 Years of Age Group 7) 50 Years of Age or Older Group 8) Unknown/No Response
Disability: Group 1) Students with Disabilities Group 2) Students Who Do Not Have Disabilities
To examine whether disproportionate impact existed, CART models were generated for
each possible prerequisite course/target course combination. The last column in the
tables on page 13 (“Disproportionate Impact”) identify whether disproportionate impact
was observed (“Yes” if disproportionate impact was observed; “No” if disproportionate
impact was not observed).
When findings indicate that prerequisites may result in possible disproportionate impact,
it is useful to conduct additional research concerning the issues of differential prediction.
Differential prediction identifies the best prediction equations that are significantly
different for different groups of students (Young & Kobrin, 2001). Differential prediction
addresses two questions:
1. Is the predictive power of the test markedly stronger or weaker for particular
student groups? 2. Does the test systematically tend to overpredict or underpredict the performance
of particular groups?
Differential prediction could not be examined because there were not enough students
who had taken the religion courses and who had also completed the reading or English
course prerequisite. Since we weren’t able to look at differential prediction, an alternate
method to address the two questions above was used. In evaluating whether a pre-
requisite would have a disparate impact, a mathematical comparison must be made of
the disproportionately impacted group's predicted success rate versus the success rate
of the other group. Accordingly, the predicted outcome of the disproportionately
impacted group was examined to determine if there was an increase in the success
rates and a decrease in the gap between the expected outcomes for both groups.
Consequently, if the success rate gap between the two groups is reduced and the
21
prerequisite increases the likelihood of success for the disproportionately impacted
group then it is acceptable to proceed with the prerequisite (Meehl, & Rosen, 1955;
Phillips, Spurling, & Armstrong, 2002). Conversely, it is important to remember that
there are other considerations besides the success of students. Access to programs
and the right to fail are also areas that need to be addressed when considering
selection models for highly impacted programs. Access to programs for all groups is an
important consideration when trying to promote diversity. If high standards on a
prediction instrument deny access disproportionately to minority groups, then such a
selection method might be considered unfair. According to Meehl and Rosen’s
argument, given that not all applicants can be served, it makes sense to serve those
most likely to succeed. In addition, if a new higher standard were imposed, it is hard to
know how many students in each age group in the applicant population would meet that
higher standard. As a result, if the differential prediction analysis indicates that the gap
between groups is reduced and the likelihood of success increases for the
disproportionately impacted group then it is acceptable to institute the prerequisite and
monitor the progress of students.
The graphs and tables on the following pages identify: Student populations by gender, age, ethnicity, and/or disability that experienced
disproportionate impact (NOTE: only outcomes that resulted in observed disproportionate impact are included. If a CART model did not identify the occurrence of disproportionate impact (“No” in the Disproportionate Impact columns on pages 13), no further analyses were conducted
the success rates of segmented groups with and without prerequisite enforcement
whether the enforced prerequisite results in similar or greater predictive power (i.e., course outcome) for the disproportionately impacted group(s)
whether enforcement of the proposed prerequisite overpredicts or underpredicts performance of the disproportionately impacted group relative to: 1) all students; and b) students groups that are not disproportionately impacted
22
Graphs and tables are not shown for the following prerequisites and target courses
because disproportionate impact was not found:
Target Course: RELIG-100
READ-925 or Placement into ENGL-914
ENGL-914
ENGL-015
Target Course: RELIG-101
READ-925 or Placement into READ-956
READ-956
READ-078
In addition, disproportionate impact was not examined for READ-925, 956, and 078 as
the prerequisites for RELIG-100 because there was insufficient data.
23
ENGL-101 as a Prerequisite to RELIG-100 Disproportionate Impact
The figure on the following page uses segmentation modeling to identify
disproportionate impact when ENGL-101 is the prerequisite for RELIG-100. Overall,
38% of students who enter RELIG-100 successfully complete the ENGL-101
prerequisite. However, 44% of student’s age 20 years old or older who entered RELIG-
100 had successfully completed the ENGL-101 prerequisite. Conversely, only 29% of
students age 19 years or younger who entered RELIG-100 successfully completed the
ENGL-101 prerequisite. This finding, a 15% difference between segments,
represents an observed disproportionate impact by age.
Equally important is how the ENGL-101 prerequisite is related to the RELIG-100
success rates of students in each segment. As the table on the following page
indicates, the current success rate of students 19 years of age or younger is 59% while
the success rate of students 20 years of age or older is 67%, an 8% differential. When
the ENGL-101 prerequisite is applied; 89% of students age 19 or younger are
successful and 76% of students 20 years of age or older are successful. The success
rate for both groups increased substantially. For the students 19 years old or
younger the success rate increased from 59% to 89%, a 30% increase, and for the
students 20 years old or older the success rate increased from 67% to 76%, a 9%
increase. Accordingly, the success rates of students in the disproportionately
impacted segment (i.e., students 19 years of age or younger) increased 30%.

24
CART Segmentation Model Showing Disproportionate Impact When Prerequisite for RELIG-100 is ENGL-101 (Age, Gender, Ethnicity, and Disability examined)
*Risk Estimate = .383, SE of Risk Estimate = .030, Improvement set to .01, Child Node set to 5% of Total N, Parent Node is twice the Child Node.
The Impact of ENGL-101 as a Prerequisite for RELIG-100 on the Two Age Categories Identified in the Disproportionate Impact Study
Node Age All
Students
Students that Meet
PreReq
Percent of All
Students
Current Success
Rate
New Success
Rate
1 19 years old or younger 97 28 28.9 58.8 89.3
2 20 years old or older 164 72 43.9 67.1 76.4
Total 261 100 38.3 64.0 80.0

25
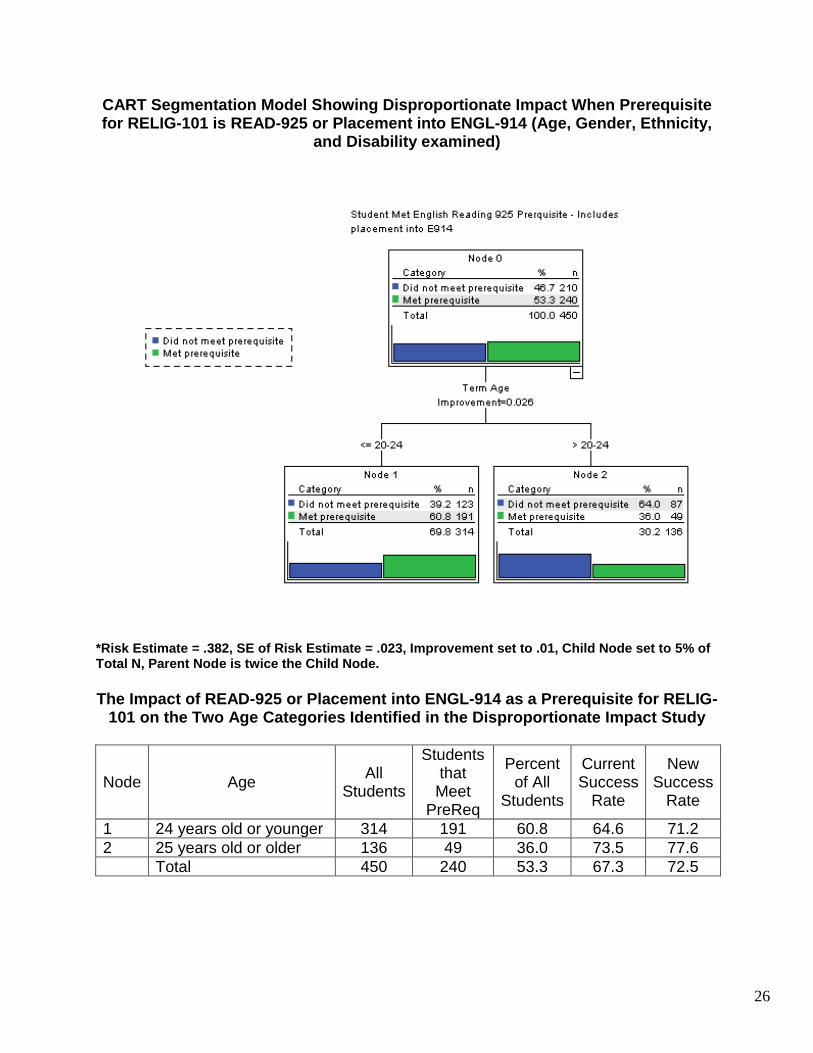
READ-925 or Placement into ENGL-914 as a Prerequisite to RELIG-101 Disproportionate Impact
The figure on the following page uses segmentation modeling to identify
disproportionate impact when READ-925 or placement into ENGL-914 is the
prerequisite for RELIG-101. Overall, 53% of students who enter RELIG-101
successfully complete the READ-925 or placement into ENGL-914 prerequisite.
However, 61% of student’s age 24 years old or younger who entered RELIG-101 had
successfully completed the READ-925 prerequisite or placed into ENGL-914 or higher.
Conversely, only 36% of student’s age 25 years old or older who entered RELIG-101
successfully completed the READ-925 prerequisite or placed into ENGL-914. This
finding, a 25% difference between segments, represents an observed
disproportionate impact by age.
Equally important is how the READ-925 or ENGL-914 placement prerequisite is related
to the RELIG-101 success rates of students in each segment. As the table on the
following page indicates, the current success rate of students 24 years of age or
younger is 65% while the success rate of students 25 years of age or older is 74%, a
9% differential. When the READ-925 or ENGL-914 placement prerequisite is applied;
71% of students 24 years of age or younger are successful and 78% of students 25
years of age or older are successful. The success rate for both groups increased.
For the students 24 years old or younger the success rate increased from 65% to
71%, a 6% increase, and for the students 25 years old or older the success rate
increased from 74% to 78%, a 4% increase. Accordingly, the success rates of
students in the disproportionately impacted segment (i.e., students 25 years of
age or older) increased 4%, and is higher than the students 24 years old or
younger.
26
CART Segmentation Model Showing Disproportionate Impact When Prerequisite for RELIG-101 is READ-925 or Placement into ENGL-914 (Age, Gender, Ethnicity,
and Disability examined)
*Risk Estimate = .382, SE of Risk Estimate = .023, Improvement set to .01, Child Node set to 5% of Total N, Parent Node is twice the Child Node. The Impact of READ-925 or Placement into ENGL-914 as a Prerequisite for RELIG-
101 on the Two Age Categories Identified in the Disproportionate Impact Study
Node Age All
Students
Students that Meet
PreReq
Percent of All
Students
Current Success
Rate
New Success
Rate
1 24 years old or younger 314 191 60.8 64.6 71.2
2 25 years old or older 136 49 36.0 73.5 77.6
Total 450 240 53.3 67.3 72.5
27
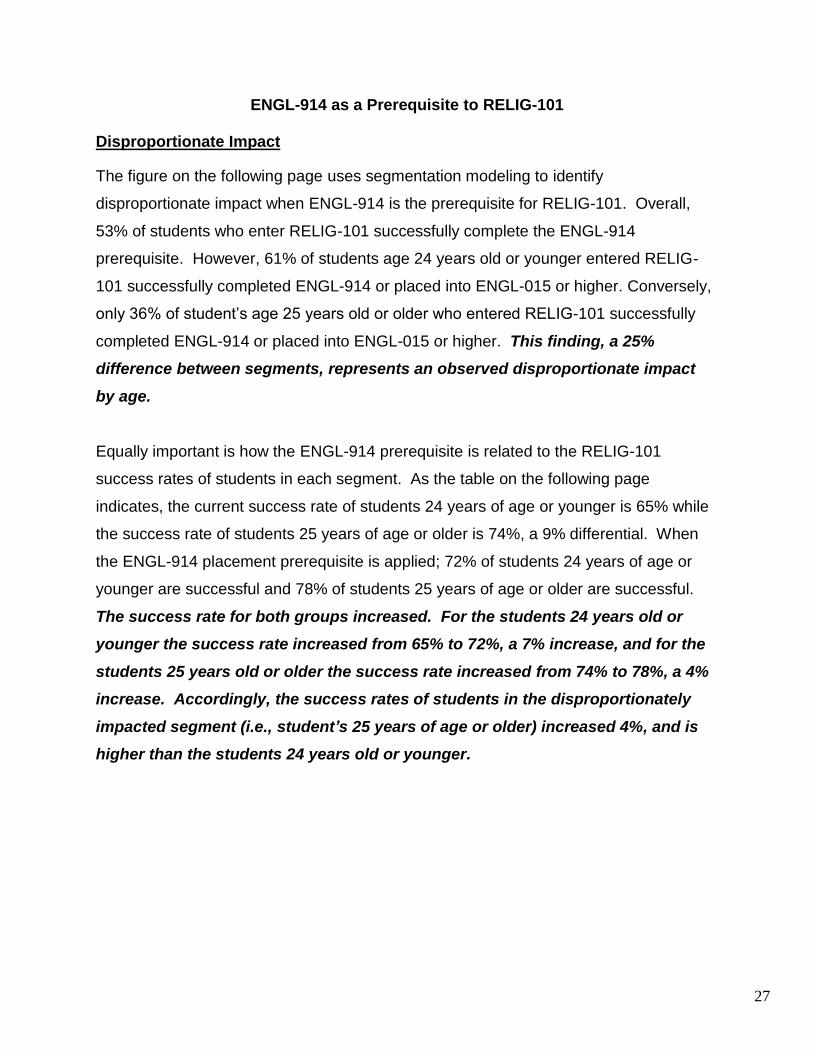
ENGL-914 as a Prerequisite to RELIG-101 Disproportionate Impact
The figure on the following page uses segmentation modeling to identify
disproportionate impact when ENGL-914 is the prerequisite for RELIG-101. Overall,
53% of students who enter RELIG-101 successfully complete the ENGL-914
prerequisite. However, 61% of students age 24 years old or younger entered RELIG-
101 successfully completed ENGL-914 or placed into ENGL-015 or higher. Conversely,
only 36% of student’s age 25 years old or older who entered RELIG-101 successfully
completed ENGL-914 or placed into ENGL-015 or higher. This finding, a 25%
difference between segments, represents an observed disproportionate impact
by age.
Equally important is how the ENGL-914 prerequisite is related to the RELIG-101
success rates of students in each segment. As the table on the following page
indicates, the current success rate of students 24 years of age or younger is 65% while
the success rate of students 25 years of age or older is 74%, a 9% differential. When
the ENGL-914 placement prerequisite is applied; 72% of students 24 years of age or
younger are successful and 78% of students 25 years of age or older are successful.
The success rate for both groups increased. For the students 24 years old or
younger the success rate increased from 65% to 72%, a 7% increase, and for the
students 25 years old or older the success rate increased from 74% to 78%, a 4%
increase. Accordingly, the success rates of students in the disproportionately
impacted segment (i.e., student’s 25 years of age or older) increased 4%, and is
higher than the students 24 years old or younger.

28
CART Segmentation Model Showing Disproportionate Impact When Prerequisite for RELIG-101 is ENGL-914 (Age, Gender, Ethnicity, and Disability examined)
*Risk Estimate = .384, SE of Risk Estimate = .023, Improvement set to .01, Child Node set to 5% of Total N, Parent Node is twice the Child Node.
The Impact of ENGL-914 as a Prerequisite for RELIG-101 on the Two Age Categories Identified in the Disproportionate Impact Study
Node Age All
Students
Students that Meet
PreReq
Percent of All
Students
Current Success
Rate
New Success
Rate
1 24 years old or younger 314 190 60.5 64.6 71.6
2 25 years old or older 136 49 36.0 73.5 77.6
Total 450 239 53.1 67.3 72.8
29
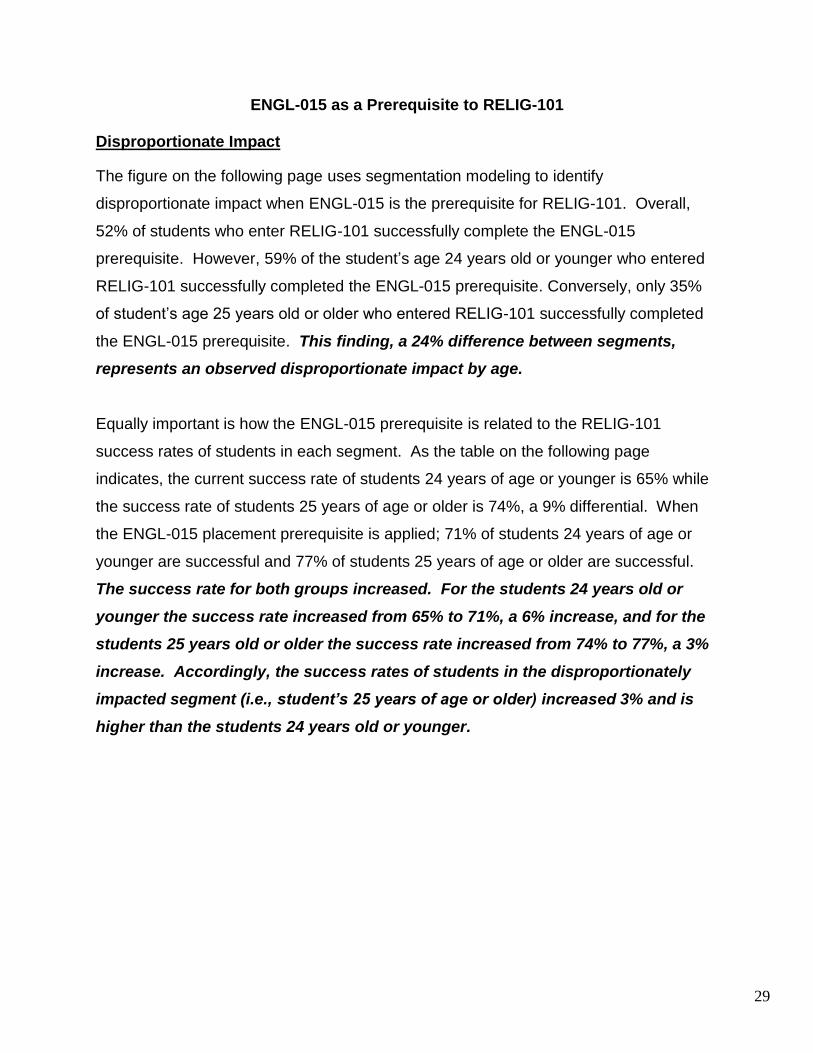
ENGL-015 as a Prerequisite to RELIG-101 Disproportionate Impact
The figure on the following page uses segmentation modeling to identify
disproportionate impact when ENGL-015 is the prerequisite for RELIG-101. Overall,
52% of students who enter RELIG-101 successfully complete the ENGL-015
prerequisite. However, 59% of the student’s age 24 years old or younger who entered
RELIG-101 successfully completed the ENGL-015 prerequisite. Conversely, only 35%
of student’s age 25 years old or older who entered RELIG-101 successfully completed
the ENGL-015 prerequisite. This finding, a 24% difference between segments,
represents an observed disproportionate impact by age.
Equally important is how the ENGL-015 prerequisite is related to the RELIG-101
success rates of students in each segment. As the table on the following page
indicates, the current success rate of students 24 years of age or younger is 65% while
the success rate of students 25 years of age or older is 74%, a 9% differential. When
the ENGL-015 placement prerequisite is applied; 71% of students 24 years of age or
younger are successful and 77% of students 25 years of age or older are successful.
The success rate for both groups increased. For the students 24 years old or
younger the success rate increased from 65% to 71%, a 6% increase, and for the
students 25 years old or older the success rate increased from 74% to 77%, a 3%
increase. Accordingly, the success rates of students in the disproportionately
impacted segment (i.e., student’s 25 years of age or older) increased 3% and is
higher than the students 24 years old or younger.
30
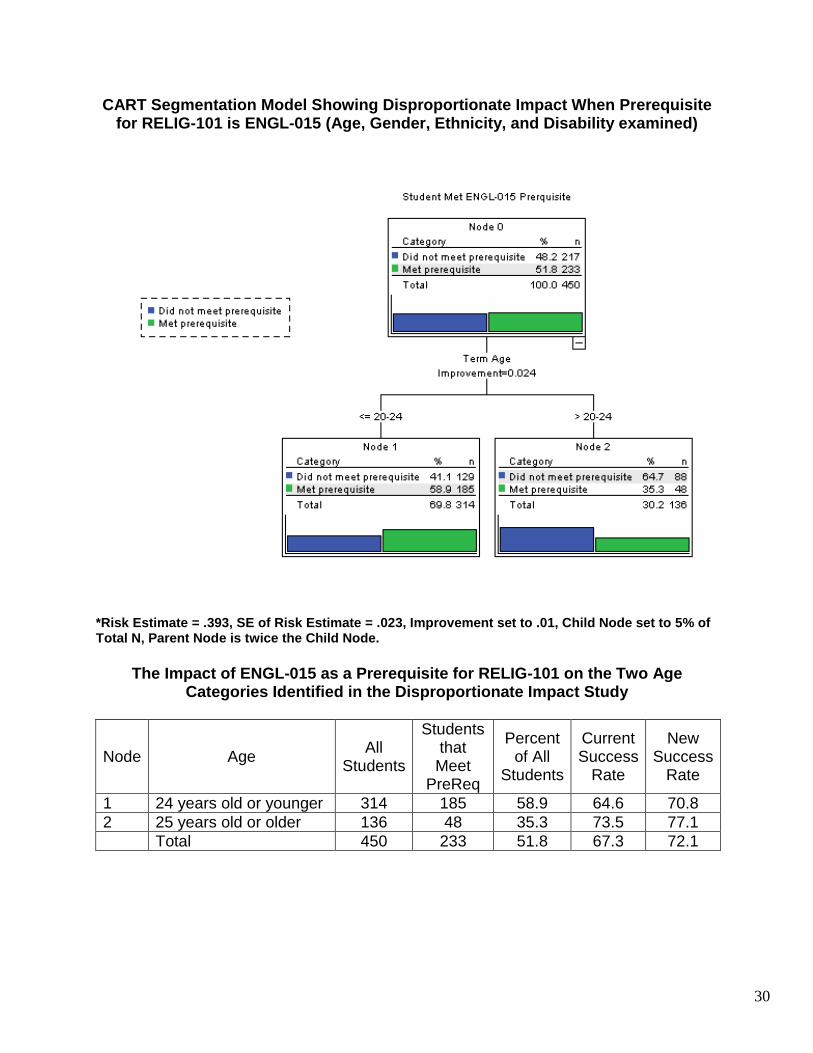
CART Segmentation Model Showing Disproportionate Impact When Prerequisite for RELIG-101 is ENGL-015 (Age, Gender, Ethnicity, and Disability examined)
*Risk Estimate = .393, SE of Risk Estimate = .023, Improvement set to .01, Child Node set to 5% of Total N, Parent Node is twice the Child Node.
The Impact of ENGL-015 as a Prerequisite for RELIG-101 on the Two Age Categories Identified in the Disproportionate Impact Study
Node Age All
Students
Students that Meet
PreReq
Percent of All
Students
Current Success
Rate
New Success
Rate
1 24 years old or younger 314 185 58.9 64.6 70.8
2 25 years old or older 136 48 35.3 73.5 77.1
Total 450 233 51.8 67.3 72.1
31
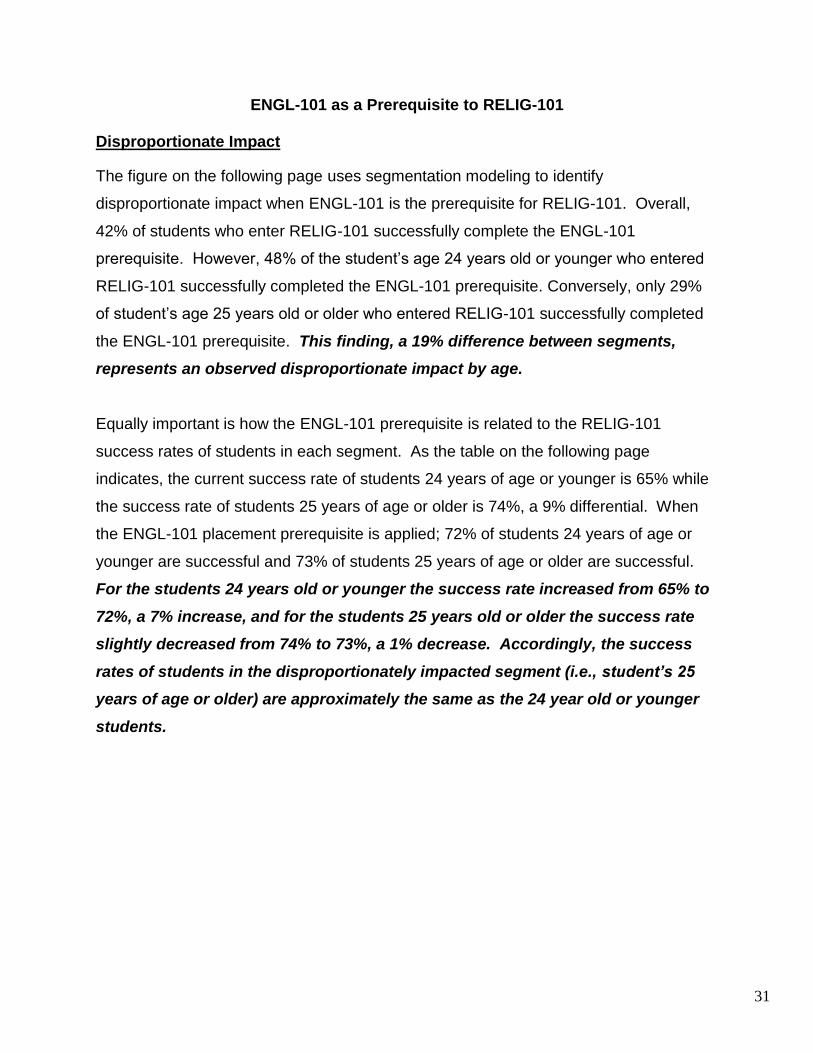
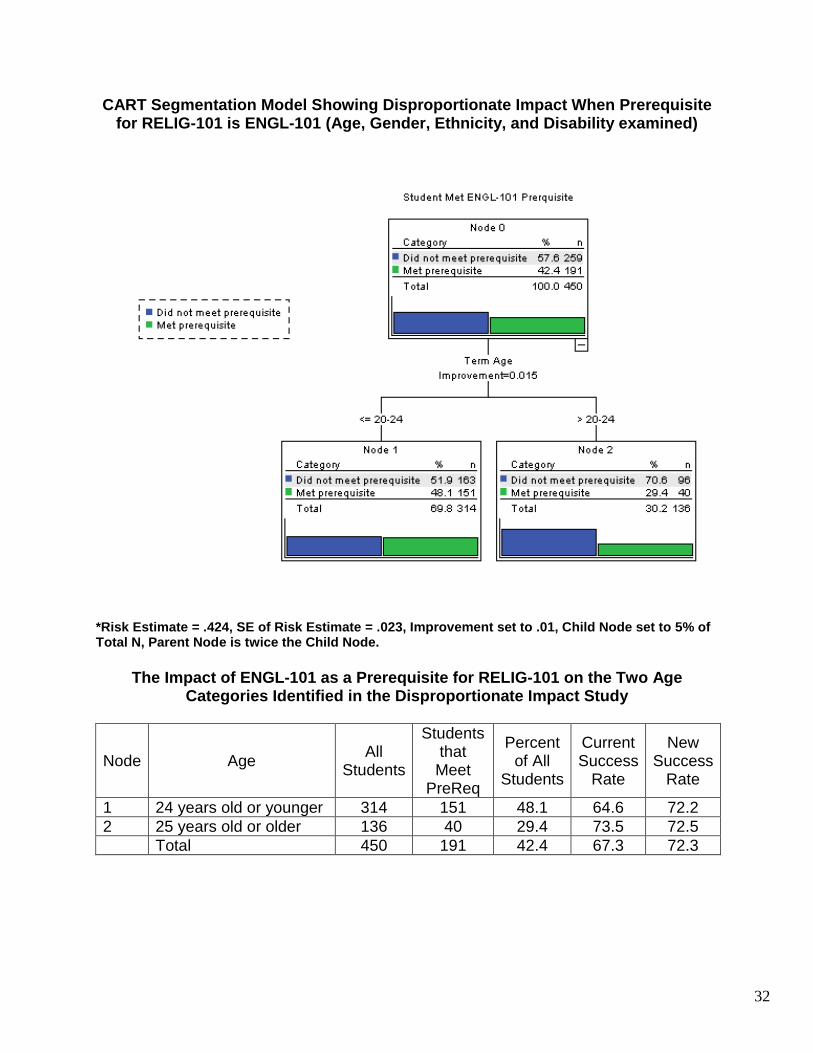
ENGL-101 as a Prerequisite to RELIG-101 Disproportionate Impact
The figure on the following page uses segmentation modeling to identify
disproportionate impact when ENGL-101 is the prerequisite for RELIG-101. Overall,
42% of students who enter RELIG-101 successfully complete the ENGL-101
prerequisite. However, 48% of the student’s age 24 years old or younger who entered
RELIG-101 successfully completed the ENGL-101 prerequisite. Conversely, only 29%
of student’s age 25 years old or older who entered RELIG-101 successfully completed
the ENGL-101 prerequisite. This finding, a 19% difference between segments,
represents an observed disproportionate impact by age.
Equally important is how the ENGL-101 prerequisite is related to the RELIG-101
success rates of students in each segment. As the table on the following page
indicates, the current success rate of students 24 years of age or younger is 65% while
the success rate of students 25 years of age or older is 74%, a 9% differential. When
the ENGL-101 placement prerequisite is applied; 72% of students 24 years of age or
younger are successful and 73% of students 25 years of age or older are successful.
For the students 24 years old or younger the success rate increased from 65% to
72%, a 7% increase, and for the students 25 years old or older the success rate
slightly decreased from 74% to 73%, a 1% decrease. Accordingly, the success
rates of students in the disproportionately impacted segment (i.e., student’s 25
years of age or older) are approximately the same as the 24 year old or younger
students.
32
CART Segmentation Model Showing Disproportionate Impact When Prerequisite for RELIG-101 is ENGL-101 (Age, Gender, Ethnicity, and Disability examined)
*Risk Estimate = .424, SE of Risk Estimate = .023, Improvement set to .01, Child Node set to 5% of Total N, Parent Node is twice the Child Node.
The Impact of ENGL-101 as a Prerequisite for RELIG-101 on the Two Age Categories Identified in the Disproportionate Impact Study
Node Age All
Students
Students that Meet
PreReq
Percent of All
Students
Current Success
Rate
New Success
Rate
1 24 years old or younger 314 151 48.1 64.6 72.2
2 25 years old or older 136 40 29.4 73.5 72.5
Total 450 191 42.4 67.3 72.3

33
References
Meehl, P., Rosen, A. (1955). Antecedent probability and psychometric signs.
Psychological Bulletin, 52(3), 194-216. Phillips, B., Spurling, S., & Armstrong, W. (2002). Associate degree
nursing: Model prerequisites validation study. California Community College Associate Degree Nursing Programs by the Center for Student Success and Health care Initiative Sponsored Project.
Russell, B. A. (January, 2011). Title 5 Section 55003: Policies for Prerequisites,
Corerequisites and Advisories on Recommended Preparation: First Reading (Public Hearing). Retrieved January 26, 2010 from http://www.cccco.edu/Portals/4/Executive/Board/2011_agendas/jan_2011/7_1_title_5_prerequisites.pdf
Research and Planning Group for the California Community Colleges (RP Group). (July
2010). A Comprehensive Approach to Prerequisites. Retrieved January 26, 2012 from http://www.rpgroup.org/sites/default/files/RP%20Group%20Response%20to%20Prerequisite%20Changes.pdf
Research and Planning Group for the California Community Colleges (RP Group).
(January 2011). RP Group Statement on the Title 5 Prerequisite Proposal Revision. Retrieved January 26, 2012 from http://www.rpgroup.org/sites/default/files/Statement%20on%20Prerequisite%20Proposal%20Revision.pdf
Young, J., & Kobrin, J. (2001). Differential validity, differential prediction, and college
admission testing: A comprehensive review and analysis. College Entrance Examination Board, New York, http://www.collegeboard.com/ research/pdf/differential_validity_10539.pdf.