
Prepared for - Urban Land...
44
Prepared for:
Transcript of Prepared for - Urban Land...

Prepared for:

About the Urban Land InstituteThe mission of the Urban Land Institute is to provide leadership in the responsible use of land and in creating and sustaining thrivingcommunities worldwide.
ULI is committed to● Bringing together leaders from across the fields of real estate and land use policy to exchange best practices and serve community needs;● Fostering collaboration within and beyond ULI’s membership through mentoring, dialogue, and problem solving;● Exploring issues of urbanization, conservation, regeneration, land use, capital formation, and sustainable development;● Advancing land use policies and design practices that respect the uniqueness of both the built and natural environments;● Sharing knowledge through education, applied research, publishing, and electronic media; and● Sustaining a diverse global network of local practice and advisory efforts that address current and future challenges.
Established in 1936, ULI today has more than 39,000 members worldwide, representing the entire spectrum of land use and development disciplines. Professionals represented include developers, builders, property owners, investors, architects, public officials, planners, real estate brokers, appraisers, attorneys, engineers, financiers, academics, students, and librarians.
About the ULI Terwilliger Center for Housing The ULI Terwilliger Center for Housing conducts research, performs analysis, and develops best practice and policy recommendations that reflect the land use and development priorities of ULI members across all residential product types. The Center’s mission is to facilitate creating and sustaining a full spectrum of housing opportunities—including workforce and affordable housing—in communities across the country. The Center was founded in 2007 with a gift from longtime ULI member and former ULI chairman J. Ronald Terwilliger.
© 2016 by the Urban Land Institute2001 L Street, NWSuite 200Washington, DC 20036
Printed in the United States of America. All rights reserved.Reproduction or use of the whole or any part of the contents withoutwritten permission of the copyright holder is prohibited
Recommended bibliographic listing:Burns, John, Chris Porter, and Ken Perlman. Demographic Strategies for Real Estate. Washington, D.C.: Urban Land Institute, 2016.ISBN: 978-0-87420-395-0
ii John Burns Real Estate Consulting LLC, 2016

About John Burns Real Estate Consulting
John Burns Real Estate Consulting LLC provides independent research and consulting services related to the U.S. housing industry, helping executives make informed housing industry investment decisions.
John Burns founded the company in 2001 because he saw a need for better analysis on the housing market. The company has grown to a highly passionate team of research analysts and consultants in offices across the country, who work together to provide the most trusted source of U.S. housing analysis.
The company seeks to enable the profitable development of the best places to live in the world through great research, helping its clients identify the best risk-adjusted investment opportunities through monitoring their markets. The company's diverse experience and broad exposure to business sectors and markets means that it can deliver valuable perspectives to help clients set goals and create a plan to achieve them.
iiiJohn Burns Real Estate Consulting LLC, 2016

Authors
John BurnsChief Executive OfficerJohn Burns Real Estate Consulting LLC
Chris PorterChief Demographer
Kenneth S. PerlmanPrincipal
Stockton WilliamsExecutive DirectorULI Terwilliger Center for Housing
James A. MulliganSenior Editor
Laura Glassman, Publications Professionals LLCManuscript Editor
Betsy Van BuskirkCreative Director
Craig ChapmanSenior Director, Publishing Operations
ULI Project Staff
iv John Burns Real Estate Consulting LLC, 2016

PREFACE
The Urban Land Institute Terwilliger Center for Housing has long produced and sponsored industry-leading research on the demographic trends shaping real estate development and land use. From our biennial Housing in America reports to last year’s America in 2015 survey, we believe that actionable intelligence on the ways American society is evolving is critical for real estate decision makers in all areas of the business.
Many of those decision makers are active in ULI’s extensive and growing member networks, such as the ULI Product Councils. We are very pleased to partner with one of those councils—the Residential Neighborhood Development Council (RNDC) (Blue Flight, chaired by Robert Bowman, president of Charter Homes and Neighborhoods)—to sponsor this report, Demographic Strategies for Real Estate.
John Burns Real Estate Consulting produced the report with input from RNDC members. The report brings a fresh, contemporary perspective to the key demographic shifts playing out with increased speed in our country and identifies what real estate companies need to understand to capitalize on them. We hope the report will spark new insights among leaders in all product types of real estate.
Stockton WilliamsExecutive DirectorULI Terwilliger Center for Housing
vJohn Burns Real Estate Consulting LLC, 2016


EXECUTIVE SUMMARY
The demographic research presented in this analysis has wide-ranging implications for every discipline of the real estate community. We encourage readers to evaluate this information critically and use it as a means to enhance their business strategies.
• Surban™ developments will replace shopping centers: Society’s shift toward enjoying experiences more than purchasing goods will continue to move retail stores toward selling experiences rather than selling goods. Because both consumers and cities want retail that is walkable from housing, retail and residential developers should work closely to create cohesive developments to satisfy this evolving consumer. An 86 percent surge in household formations to 12.5 million households over the coming decade in comparison with the prior decade will drive purchases in all stores that cater to new households, particularly renters, who will constitute 58 percent of the net new number of households. Stores and services catering to older buyers will flourish too, thanks to a 38 percent surge in the country’s population 65 and older from 2015 to 2025.
• Suburban office demand designed for flexible work lives will return: The 1980s Sharers, currently 26–35 years old, will soon move into senior management roles. They have already formed most of their households but have delayed marriage and childbirth more than any generation before them. The coming transition to family mode will cause many of them to move to the suburbs, a trend that is contrary to what has been occurring during the last decade. This rise in surban™ living will cater to their desire to live in good school districts with plenty of things to do near work and home. Female executives will play an increasingly prominent role in office space selection, given that women earned 58 percent of this generation’s college degrees. These inventors of the sharing economy will be far more willing to share space and e-commute (there is no more “tele-”) too because it is financially smart and offers them the flexibility they want. Expect fewer square feet per employee as more companies transition to a hotellikeatmosphere where people “rent” a desk for the day.
1John Burns Real Estate Consulting LLC, 2016

EXECUTIVE SUMMARY
• Housing rental rates will surge over the long term: Although a few overbuilt submarkets garner much of today’s attention, 7.3 million of the 12.5 million net new households created over the next decade will rent. The sharing economy continues to deemphasize owning, so we expect more and more households to rent and current homeowners to become renters sooner than usual late in life. Because heavy retirement will create more competition for good workers, we also expect wages to rise, resulting in better raises for many people. More income will allow for higher rents.
• Southern suburban migration will continue: The increase in population of those in their 20s over the last decade will almost certainly result in a surge in population in their 30s over the next decade. Affordable markets in pro-growth states will continue to attract young families. The southern regions where 42 percent of Americans currently live will welcome 62 percent of the U.S. household growth over the next decade. Rental housing, townhomes, and small-lot detached housing should continue to experience increased demand as today’s young adults begin their families.
• Municipalities can assist successful growth: Governments have always strongly influenced housing trends, and government laws and investments at the federal, state, and local levels changed society substantially. State government policies favoring low income tax have shifted population growth south, which is another reason we anticipate the southern states will see substantial growth in the coming years. Local government redevelopment investments have revitalized urban areas, and the most astute suburban municipal leaders are taking note and zoning areas of their communities for a mix of retail, housing, and jobs to reinvigorate themselves. Suburbs of all kinds will capture more than 79 percent of the coming wave of household creation as the 1980s Sharers and 1990s Connectors start families, shop for homes, and seek high-quality schools.
2 John Burns Real Estate Consulting LLC, 2016

REDEFINE THE GENERATIONS BY DECADE BORN
Traditional generation definitions can be unwieldy and difficult for comparison. Defining generationsby decade born groups people into similar life stages, making analysis far more relevant.
3John Burns Real Estate Consulting LLC, 2016

GENERATIONAL CLARITY
We gave the generation associated with each decade a nickname drawn from a major contribution it made to a societal shift.
The labels describe something that makes each generation great and unique, and a way in which its members led societal shifts that transformed consumer spending.
We do not mean to imply that other generations have not exhibited these same traits or that such labels sum up entire generations.
The names for each generation simply provide a convenient—and we hope catchy—shorthand that points to a notable demographic trait and makes the decennial generations easily identifiable.
The chart on this page should be required for all demographic discussions.
Each decade led a significant shift in society.2015 U.S. Population by Place of Birth
4 John Burns Real Estate Consulting LLC, 2016

GENERATIONAL CLARITY
1930s Savers
Shaped by forced frugality in childhood and booming economies during their working years, they drove the shift from cities to suburbs and started a surge in divorces. Ranging from 76 to 85 in 2015, they are spending on medical and remodeling, and struggling with how to live longer than anticipated in a low-interest-rate environment.
1940s Achievers
Driven to succeed financially, they began the surge in dual-income households and lower expenses (fewer kids), empowered by approval of the birth-control pill in 1960. Continuing to achieve financially today, 19 percent of those 65–69 years old still work full time, nearly double the Savers’ rate at that age.
1950s Innovators
They started new companies at rates not equaled since, boosting productivity and longevity with their inventions, and acquired possessions such as big houses at unprecedented levels, aided by credit cards, mortgages, and30+ years of falling interest rates. They are maintaining active lifestyles as they begin drawing on Social Security and spending their unprecedented net worth.
5John Burns Real Estate Consulting LLC, 2016

GENERATIONAL CLARITY
1960s Equalers
With both sexes pushing for more equal opportunities in the world, the Equaler women were the first beneficiaries of Title IX, and the first African American U.S. president came from this generation. For the first time, more than 60 percent of women worked. Dads more than doubled their involvement in child care. They will retire less affluent than prior generations.
1970s Balancers
Raised by more dual-income and divorced parents than ever before, Balancer teens embraced TV and video games. Reacting against their often-divorced parents’ workaholic lifestyles, they divorce less, stay home with kids more, and have children later in life. Disproportionately hurt by the housing crash, they own fewer homes and have much lower net worth; 23 percent are foreign born.
1980s Sharers
They invented the sharing economy out of necessity, taking advantage of new technologies. The most-educated cohort ever, they are racked with student debt, many are underemployed, and a full20 percent live below the poverty line. They share locations, likes, photos, cars, etc. to connect with friends and live in urban areas with more to do and mass transit.
6 John Burns Real Estate Consulting LLC, 2016

GENERATIONAL CLARITY
1990s Connectors
With many still in school, many of their shifts have yet to emerge. They grew up with internet access and know little privacy. More were raised by a single parent than previously, and early Connectors continue the growing trend of having children out of wedlock. They are highly educated, underemployed, and wary of credit.
2000s Globals
The Globals are growing up with multicultural friends and value diversity. They will bear the burden of prior generations’ underfunded retirement obligations. With technology a big part of their education to date, we expect big shifts from the Globals.
7John Burns Real Estate Consulting LLC, 2016

THE FOUR BIG INFLUENCERS
Four categories of external influence have shaped each of the generations over time.
Government: New government laws, programs, and investments have done everything from permanently boosting homeownership 15 percent to causing a 20 percent decline in births.
Economy: Economic growth has been a primary determinant of lifetime spending, homeownership, and living independently, both early and late in life.
Technology: Technology shifts have been responsible for everything from the rise in suburban living in the 1950s to rising births after the age of 40.
Societal shifts: Female education levels and earning power have risen dramatically while male incomes have fallen, as more women become the primary breadwinner and more men stay at home.
GOVERNMENT ECONOMY
TECHNOLOGY SOCIETAL SHIFTS
8 John Burns Real Estate Consulting LLC, 2016

THE 4-5-6 RULE FOR DEMOGRAPHIC PREDICTIONS
The Four Big Influencers during people’s Five Main Life Stages help answer the Six Key Consumer Questions most executives want to know about generational shifts.
THE 4 BIG INFLUENCERS
1. Government
2. Economy
3. Technology
4. Societal shifts
DURING PEOPLE’S5 MAIN LIFE STAGES
1. Childhood
2. Early career
3. Family formation
4. Late career
5. Retirement
1. How many will there be and how much money will they have?
2. What will they purchase?3. When will they purchase?4. Where will they live and
spend?5. Who will buy, and who will
they live with (spend money on and share expenses with)?
6. Why will they buy certain products and not others?
HELP ANSWER THE6 KEY CONSUMER QUESTIONS
9John Burns Real Estate Consulting LLC, 2016

FOUR BIGGEST DEMOGRAPHIC OPPORTUNITIES
Women: Women now earn 58 percent of all of the college degrees in the country. They earn more than their spouses 38 percent of the time. Women continue to have children later and alone. Both men and women stay at home more to raise the kids, a trend that started around 9/11. By 2025, we expect78 million working women to play an even greater role in the workforce—8 million more than in 2015.
Immigrants: America’s foreign-born population doubled from 1990 to 2010, resulting in 44 million immigrants living in the United States in 2015. At the current pace, the foreign-born population will grow to52 million by 2025—more than one of every seven residents. The background of the immigrant has changed dramatically too. Far more immigrants now arrive via airplane and with money to spend, and far fewer sneak across the border in search of a low-paying manual-labor job.
Retirees: By 2025, 18 million more people than in 2015 will be 65 or older, a whopping 38 percent increase from 48 million in 2015 to 66 million in 2025. In 2016, 3.5 million people turned 65, compared with just 2.2 million turning 65 in 2006, and the numbers will trend higher. Companies that accurately tailor their products to 66 million Americans over the age of 65 in 2025 will profit.
Young Adults: Those born from 1989 to 1993 constitute the largest five-year age group in the country. These 23- to 27-year-olds live at home or crowd into urban apartments more than any generation before them. For several reasons, their incomes will grow faster than most believe. They will lead the addition of 12.5 million more households from 2015 to 2025—86 percent more households than created in the prior ten years. Builders will construct 13.7 million new homes and apartments to meet the demand.
Four huge transformations reshaping America stand out the most:
10 John Burns Real Estate Consulting LLC, 2016
RISE OF THE WORKING WOMAN
Double the work: Women nearly doubled their workforce participation from37 percent working in 1950 to 73 percent in 1999.
Almost half of all jobs: Women hold nearly 47 percent of all jobs in America today, up from less than 38 percent in 1970.
Sharply rising incomes: Incomes of young adult females rose 34 percent over the last 40 years, whereas incomes of males fell 5 percent, adjusting both for inflation. Disparities still exist, but the gap certainly narrowed.
Primary breadwinners: Around 38 percent of married women now earn more than their spouse, up from just 24 percent in the early 1980s.
Delaying families: Forty years ago, 68 percent of women in their late 20s had both a husband and child. That number has tumbled to 22 percent.
Going it alone: Women also opt to parent alone more often. Approximately 18 percent of all newborns go home from the hospital to a single-parent household (41 percent of all births are to single women, 44 percent of whom do not live with the father).
Changing social attitudes—along with higher levels of education, income, and independence for women—contribute to a number of seismic shifts for women.
11John Burns Real Estate Consulting LLC, 2016

EXPANDING AFFLUENT IMMIGRATION
Immigration has reached its highest level since the 1920s. The background of the immigrant has changed dramatically, too.
By 2015, 15 percent of Americans will be foreign born. A strong desire for better economic, freedom, and lifestyle opportunities in America drives immigration demand.
A profound part of this country’s history and identity, immigrants again play a powerful role in American life. At its current pace, immigration will account for more than half our population growth by 2023.
These consumers are vital to the economy, but common wisdom about the ways they form households, buy homes, and behave in the marketplace no longer holds. Immigration has shifted from impoverished refugees walking across the border or landing via boat to affluent middle- and upper-class families fleeing their native lands after decades of amazing economic growth.
13% of Americans are immigrants, the highest percentage in 90+ years.Foreign-Born Share of U.S. Population
12 John Burns Real Estate Consulting LLC, 2016

DIVERSITY
Recent huge immigration has filled in much of the gap previously known as the Baby Bust, making the generations by decade more equalin size.
The 1970s Balancers easily rank as the most diverse of the decennial generations, with 23 percent—nearly one in four—foreign born.
Because so many people immigrate here in their 20s and 30s, the percentages of foreign-born individuals in the younger generations will grow over time.
Even today, diversity has surrounded these youngest generations in many ways. With so many of their parents born overseas, diversity has infused their classrooms, play dates, soccer teams, and first jobs.
We named those born in the 2000s “Globals” for this reason. They know people from cultures all over the world and accept international cultures more easily than any children before them.
Filter
The 1970s Balancers boast the greatest foreign diversity, with 23% foreign born.Percentage of 2015 Population That Is Foreign Born
13John Burns Real Estate Consulting LLC, 2016

The 1950s Innovators will drive explosive growth of 18 million more people 65+ over the next 10 years!65+ Population by Decade of Birth
THE GRAYING OF AMERICA
By 2025, 18 million more people will be 65 or older than in 2015.
The surge in births from the 1940s to the early 1960s will cause an explosion of retirees over the next decade.
The 65+ population will grow 38 percent from 2015 to 2025, adding 18 million “seniors,” a term that Americans in their 60s and even 70s now bristle at, insisting we should reserve it for “old people.”
Tremendous opportunities for customer segmentation abound. Executives must target narrow cohorts among retirees—the 1950s Innovators, the 1940s Achievers, etc.—for maximum effect, because each has different tastes and needs.
Filter
14 John Burns Real Estate Consulting LLC, 2016

EXPLODING HOUSEHOLD FORMATION
The United States is poised to add 12.5 million net new households during the next decade, from 2016 to 2025, nearly double the 7 million formed in the previous ten years.
This prediction might sound controversial—it represents a massive increase—but it rests on conservative household formation rate assumptions applied to a fairly predictable population.
This will occur even with an assumed increase in multigenerational adult households and will create huge opportunities for every business that sells products and services to households.
With a huge population of people born in the 1990s, plus pent-up household formation demand from the last decade, we could easily forecast more. However, the many societal shifts that have occurred over time lead us to forecast far more conservatively.
12.5 million households will be formed over the next decade.Net Household Formation, 1961–2025
15John Burns Real Estate Consulting LLC, 2016

YOUNG ADULTS DRIVING HOUSEHOLD FORMATION
The 1990s Connectors will drive the majority of new household growth over the next decade, despite forming households more slowly than their predecessors.
The 1990s Connectors and the 1980s Sharers create households more slowly than every generation sincethe 1930s.
Delays in getting married and forming a family have contributed to their slower rates of household formation, along with a greater share going to college. High rents, student debt, and the Great Recession have also held back household formation for these generations.
From 2016 through 2025, we forecast that• The 1980s Sharers will create 4.3 million
households;• The 1990s Connectors will create 14.0 million
households; and• The 2000s Globals will create 5.9 million
households.
1990s Connectors will create 14 million households.Net Household Formation by Those Born in 1990s
1980s Sharers will create 4.3 million households.Net Household Formation by Those Born in 1980s
16 John Burns Real Estate Consulting LLC, 2016

PLUNGING HOMEOWNERSHIP
The plunge in homeownership from 2005 to 2015 has been one of the biggest recent shifts, resulting in the lowest homeownership rate in decades.
Tough economic conditions have delayed homeownership, particularly for those under 45 in comparison to their parents.
Although surveys show that 1970s Balancers, 1980s Sharers, and 1990s Connectors want to own, we believe a declining percentage will choose homeownership. Student debt has become the most-cited reason people do not own homes.
Rental housing should thrive for some time, including single-family home rentals, which surged after the housing crash. We believe a larger percentage of households than ever before will opt to raise their family in a professionally managed, detached rental home.
Homeownership will reach 60.8% in 2025, the lowest rate since the 1950s.Homeownership Rate (Annual Average)
17John Burns Real Estate Consulting LLC, 2016

KEY ASSUMPTIONS
Although businesses assume some sort of macroeconomic outlook that they cannot control, very few actually write down their assumptions. Our macroeconomic assumptions, which we will revise and update as we get new information, are as follows:
Healthy economy: Over the next ten years, we assume 2 percent average annual GDP growth and less than 1 percent employment growth annually—both slightly below their long-term averages. The lack of labor and the high level of government indebtedness will slow the rate of job growth.
High immigration: We assume no major changes in immigration policy, allowing a net inflow of 1.2 million to 1.3 million immigrants each year, similar to recent history and in accord with current Census Bureau estimates. Twelve million to 13 million immigrants over the next decade would result in approximately 4.5 million households this decade (and more in future decades). A full 36 percent of forecast household growth should come from people not living in America in 2015.
Substantial entitlements: We anticipate no significant changes to Medicare, Social Security, and other retirement benefits before 2025, although the risk will certainly rise each year. A reduction in benefits could shift behavior dramatically, requiring people to work longer and to live on less in retirement.
Continued social shifts: We foresee continued rising college-education costs and associated delays in household formation, marriage, and children, consistent with recent historic trends. We expect younger generations to save more than their parents and to borrow less.
18 John Burns Real Estate Consulting LLC, 2016

KEY ASSUMPTIONS
Life-extending technology: Technology will continue to allow women to have children later, thereby allowing their early careers to prosper. Technology will also continue to help people live longer, propping up the number of households while challenging retiree budgets.
Favorable mortgage policies and terms: We assume fixed 30-year mortgage rates that started at just under 4 percent in 2015 will stay low for years and then rise to 6 percent by 2025. This will challenge housing affordability and hurt homeownership. We also envision a loosening in mortgage documentation requirements, particularly for the self-employed and retired.
Home prices and rents: We assume home prices and rents will increase slightly faster than incomes each year. Home prices should not grow much faster than incomes, but mortgage payments will grow faster as interest rates rise. Increased regulation and supply constraints around the country will continue to limit supply, applying upward pressure on prices and rents, particularly along the coasts. Housing affordability will get even worse.
19John Burns Real Estate Consulting LLC, 2016

IMMINENT LABOR SHORTAGE
The traditional labor pool of the working-age population 20–64 will grow much more slowly over the next decade, which means slower job growth and increased wages.
The retirement surge over the next decade means that by 2025, the number of people leaving the labor pool (the total number of people ages 20–64) will almost equal the number entering it.
The labor pool’s historical growth of approximately1.5 million workers per year will drop below 500,000 by 2022—and stay there through at least 2025. And this forecast assumes that America’s robust immigration continues.
Because of this decline in the growth rate of workers, the economy almost certainly cannot experience sustained robust economic growth. The impact will be a shortage of workers and a dramatic rise in wages unless the economy grows very slowly, immigration substantially increases, or new technologies successfully replace millions of workers.
Retirement will dramatically slow job creation.Growth of U.S. Resident Population Ages 20–64
20 John Burns Real Estate Consulting LLC, 2016

GO SOUTH FOR GROWTH
62% of the household growth will be in the South, where 42% of households are in warm, affordable areas.Estimated Share of Household Growth, 2016–2025
Household growth over the next decade will tilt heavily south, toward the “affordable sunshine states” of the Sun Belt: Florida, Texas, the Southeast, and the Southwest.
These regions, which accounted for just 32 percent of U.S. households in 1970, now account for 42 percent of all households.
We predict that over the next decade, these regions will see 62 percent of U.S. household growth, driven by:
• A pro-growth environment light on taxes, regulations, and unions and aggressive on business recruitment and incentives, that has attracted a wide range of companies and jobs; and
• Affordability, especially in housing, that pulls residents from more expensive regions.
And warm weather remains a perennial draw.
21John Burns Real Estate Consulting LLC, 2016

NEIGHBORHOOD ENVIRONMENTS
Filter
Based on our definitions, 15 percent of Americans live in urban areas, 64 percent live in suburbanareas, and 21 percent live in rural areas.
22 John Burns Real Estate Consulting LLC, 2016

NEIGHBORHOOD ENVIRONMENTS DEFINED
Filter
Classifying areas as urban, suburban, and rural poses a daunting task. The following represents a quick overview of our methodology, which provides much-needed clarity of definition for neighborhood environments.Urban living occurs in big cities that contain job centers with dense housing, walkable neighborhoods, and at least some high rises. We divided the 50 cities that met these criteria into two categories:• Urban downtowns include zip codes that designate areas commonly called “downtown.” They are densely populated and offer
alternatives to automobile commuting.• Urban neighborhoods are all other areas within the city limits. Neighborhoods usually appear less dense than downtowns but
denser than a city’s surrounding suburbs. Although downtown revitalization has received much attention, urban neighborhoods grew faster.
Suburban living takes place in all parts of the metropolitan statistical area (MSA)’s central counties not within urban downtowns or urban neighborhoods. Nearly two-thirds of U.S. households live in the suburbs. We identified four primary categories of suburbanliving:• Big suburban cities are large, commutable suburbs outside larger urban areas and with their own job bases.• Booming suburbs are family-oriented cities with rapid growth. They eventually will become big suburban cities.• Small principal suburbs emerged from bigger cities to host their own job centers. These towns likely provide jobs for residents
of the next suburban category, small suburban cities.• Small suburban cities are the balance of the central counties in MSAs. These cities offer some employment, but most
residents enjoy short commutes to the large cities nearby.
Rural living tends to include extremely low density, affordable housing, lower incomes, and long distances to employment centers. Families with children dominate, usually in detached single-family houses or in manufactured or mobile homes. Despite the internet enabling many workers to live wherever they want and allowing rural dwellers to shop online, society has continued to shift away from rural living. We identified three primary categories of rural living:• Exurbs or commuter counties lie on the outskirts of the urban core, yet are economically tied to it. These constitute America’s
long-commute communities. We believe society has shifted significantly away from commuting.• Micropolitan areas are geographically distant from larger cities and centered around their own urban cores. Micropolitan areas
tend to support themselves economically. • Rustic areas are outlying, sparse counties that do not fit any of the definitions above. Much of the center of the country is rustic,
a designation associated with farming.23John Burns Real Estate Consulting LLC, 2016

SHIFTS IN POPULATION BY AGE
The “urban lifestyle population” of young adults and empty nesters will grow much more slowly than it did in recent years.
The urban lifestyle population—ages 20 to 29 and 55 to 64—grew by 15 million people in the last decade.
These same age groups will grow much more slowly over the next decade, resulting in huge growth in “family” and “retirement” years.
Change in Population by Age, 2005–2015 Change in Population by Age, 2015–2025
24 John Burns Real Estate Consulting LLC, 2016

RETURNING SUBURBAN GROWTH
During the next decade, 79 percent of household growth will occur in the suburbs.
Suburbs of all kinds will dominate the coming wave of household creation as the 1980s Sharers and 1990s Connectors get a later start forming families. They will turn to the suburbs, where housing is more affordable and the schools are usually better.
Urban and rural areas will grow, too, but more slowly.
Urban areas, which tend to have higher prices, less room to build, and fewer desirable schools, will capture 15 percent of household growth, modestly boosting cities’ share of the total number of households.
Rural areas, which have plenty of available land but long commutes to employment centers, will lose some of their share of the total, capturing just 6 percent of household growth.
Both urban and suburban locales will capture a higher share of growth. Share of Household Growth by Decade
25John Burns Real Estate Consulting LLC, 2016

SURBANS™
Urban living, which has enjoyed a modest resurgence, will continue to grow in popularity—but mostly in the suburbs.
A new supply of smaller homes with little or no yards in high-population areas will meet the demand to commute less and live closer to restaurants and entertainment.
We coined the word “surban” for these developments—bringing the best of urban living to a more affordable suburban environment.
Many suburban cities created decades ago that are now largely built out continue to reinvigorate themselves with vibrant surban downtowns composed of new retail and residential developments.
In surban areas, housing affordability, home size, privacy, and kid-friendliness feel more urban than suburban, while school quality, public transportation, and proximity to employment feel more suburban.
Filter
26 John Burns Real Estate Consulting LLC, 2016

SURBANS™
These examples of surban areas bring the best of urban life to suburban areas:
• Reston Town Center in the Washington, D.C., suburb of Reston, Virginia
• Downtown Naperville, Illinois, in the suburbs of Chicago
• Old Town Pasadena, California, in the suburbs of Los Angeles
• A-Town in Anaheim, California, in a neighborhood around the Angels major league ballpark
• Legacy Town Center in Plano, Texas, in the suburbs of Dallas
• Santana Row in San Jose, California, on a former run-down mall site
• CityCentre in Houston, Texas, on a former run-down mall site
• Downtown Tempe, Arizona, in the suburbs of Phoenix
• Larkspur, California, north of San Francisco, with new housing sandwiched between a top-notchhigh school and a rejuvenated old downtown
• Geneva, Illinois, in the suburbs of Chicago
27John Burns Real Estate Consulting LLC, 2016

SHIFT TO SHARING AND EXPERIENCE ECONOMY
The sharing economy will create many opportunities for consumers to live more financially efficient lives and will reshape the outlook for many businesses along the way.
Those born in the 1980s pioneered what we now call the sharing economy, partially out of necessity. Tough economic times and onerous student debt contribute to their need to share.
Incredible new technologies help Americans reduce expenses, while at the same time allowing them to stay more connected to each other than ever before.
Using their smartphones, they share the details of their lives on social media—photos on Instagram, opinions on Twitter, and recommendations on Yelp. They save money by sharing goods from dresses to bikes to apartments, renting rooms on Airbnb, and hitching rides on Uber and Zipcar.
Filter
28 John Burns Real Estate Consulting LLC, 2016
SHIFT TO SHARING AND EXPERIENCE ECONOMY
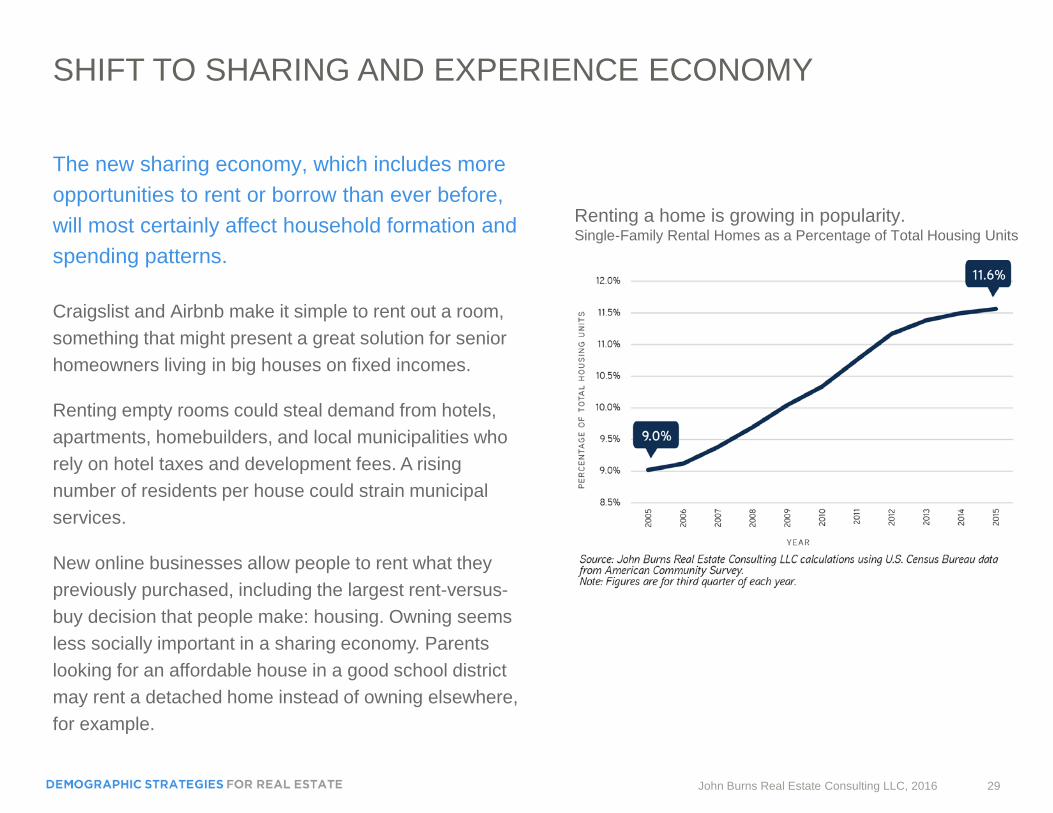
The new sharing economy, which includes more opportunities to rent or borrow than ever before, will most certainly affect household formation and spending patterns.
Craigslist and Airbnb make it simple to rent out a room, something that might present a great solution for senior homeowners living in big houses on fixed incomes.
Renting empty rooms could steal demand from hotels, apartments, homebuilders, and local municipalities who rely on hotel taxes and development fees. A rising number of residents per house could strain municipal services.
New online businesses allow people to rent what they previously purchased, including the largest rent-versus-buy decision that people make: housing. Owning seems less socially important in a sharing economy. Parents looking for an affordable house in a good school district may rent a detached home instead of owning elsewhere, for example.
Filter
Renting a home is growing in popularity.Single-Family Rental Homes as a Percentage of Total Housing Units
29John Burns Real Estate Consulting LLC, 2016

Household formation drives the economy, and ebbs and flows under the influence of government, the economy, technology, and societal shifts.
Consider all the goods and services that new households need—appliances, furniture, utilities, bedding, cookware, etc. Virtually all retailers focus on future household growth for the site selection of their next store. More households also drive the need for more construction.
To determine household formation, we analyzed headship rates—the percentage of adults who head households—for every generation.
Key to determining the number of people who would head households is understanding the major reasons people do not head households. (Members of a generation who do not head a household live with someone else or in group quarters.) We studied and forecast these reasons by age.
The examples shown on the next several pages represent the ages when people would attend their major high school reunions (ten-year reunion at age 28, 20-year reunion at age 38, 30-year reunion at age 48, and so on over the decades). We use these examples to illustrate the generations’ likelihood to head households in the future, and the reasons they will not head households.
HOUSEHOLD FORMATION TRENDS
30 John Burns Real Estate Consulting LLC, 2016

HOUSEHOLD FORMATION TRENDS, 1990S CONNECTORS
The 1990s Connectors are ages 17 to 26 in 2016 and will be ages 26 to 35 in 2025.
We forecast that the 1990s Connectors will be less likely to head a household at 28 than 1980s Sharers.
We expect the 1990s Connectors to continue to delay marriage, which will keep them living with parents or other relatives later.
Percentage of 28-Year-Olds Not Heading a Household
31John Burns Real Estate Consulting LLC, 2016
Percentage of 28-Year-Olds Who Head a Household

HOUSEHOLD FORMATION TRENDS, 1980S SHARERS
The 1980s Sharers are ages 27 to 36 in 2016and will be ages 36 to 45 in 2025.
1980s Sharers heads of household at 38 will fall below the 1970s Balancers.
1980s Sharers will lead a minor resurgence in living with their spouse or partner.
Percentage of 38-Year-Olds Not Heading a Household
Percentage of 38-Year-Olds Who Head a Household
32 John Burns Real Estate Consulting LLC, 2016

HOUSEHOLD FORMATION TRENDS, 1970S BALANCERS
The 1970s Balancers are ages 37 to 46 in 2016and will be ages 46 to 55 in 2025.
1970s Balancers will head households at a greater rate at 48 than the 1960s Equalers, largely because they comprise more single adults.
1970s Balancers have a low marital rate today, which we expect to continue.
Percentage of 48-Year-Olds Not Heading a Household
Percentage of 48-Year-Olds Who Head a Household
33John Burns Real Estate Consulting LLC, 2016

HOUSEHOLD FORMATION TRENDS, 1960S EQUALERS
The 1960s Equalers are ages 47 to 56 in 2016and will be ages 56 to 65 in 2025.
1960s Equalers are likely to head a household at a lower rate at 58 than the Innovators and Achievers, because they are more likely to be living with a spouse or multigenerationally.
1960s Equalers have been divorcing less.
Percentage of 58-Year-Olds Not Heading a Household
Percentage of 58-Year-Olds Who Head a Household
34 John Burns Real Estate Consulting LLC, 2016

HOUSEHOLD FORMATION TRENDS, 1950S INNOVATORS
The 1950s Innovators are ages 57 to 66 in 2016and will be ages 66 to 75 in 2025. By 2025, all 1950s Innovators will be older than the traditional retirement age.
1950s Innovators are slightly less likely to head a household at 68 as 1940s Achievers.
The 1950s Innovators are more likely to live multigenerationally, including in a household headed by a son or daughter.
Percentage of 68-Year-Olds Not Heading a Household
Percentage of 68-Year-Olds Who Head a Household
35John Burns Real Estate Consulting LLC, 2016

METHODOLOGY AND APPROACH
Our goal with this research was to pull together significant demographic information and communicate the meaningful trends in a way that makes the information digestible and usablefor decision making.
Using a wide range of publicly available data sources—relying particularly on U.S. Census Bureau data—John BurnsReal Estate Consulting examined the demographic shifts that both create opportunities and present challenges for executives today.
From examining the generations and the events and circumstances that shaped their lives and decisions, to taking a bottom-up approach to understand local and regional issues, we parsed the best available data to identify the key trends executives need to know. We supported our findings with color charts that are easy to interpret.
We developed new frameworks to make trends easier to identify and analyze, thereby bringing clarity to the overwhelming volume of data and anecdotes that leave so many confused. We reconciled multiple data sources that occasionally disagreed and translated arcane data definitions into language that is easy to understand.
For some key trends, we chose to include forecasts. We forecast to 2025, which was ten years out from the most recent data we had available, which seemed like a reasonable amount of time for meaningful estimates.
We make certain assumptions about the future, including government policy, the economy, technology, and societal shifts. We assume what we consider the most likely scenario today, knowing full well that these assumptions will need to change over time, as trends can accelerate or even reverse, driven by unpredictable events.
All of this work allowed us to identify the biggest demographic opportunities, as well as the biggest shifts related to howand where people will live, and to make strategic recommendations for real estate executives based on these findings.
36 John Burns Real Estate Consulting LLC, 2016

Patrick L. Phillips Global Chief Executive Officer
Michael TerseckChief Financial Officer/Chief Administrative Officer
Cheryl Cummins Global Governance Officer
Jeanne R. Myerson Chief Executive Officer, ULI Americas
Lisette van DoornChief Executive Officer, ULI Europe
John Fitzgerald Chief Executive Officer, ULI Asia Pacific
Kathleen B. Carey President and Chief Executive Officer,ULI Foundation
Adam J. SmolyarChief Marketing and Membership Officer
Steve RiddExecutive Vice President, Global Business Operations
Stephanie Wasser Executive Vice President, Member Networks
J. Ronald Terwilliger, ChairTerwilliger Pappas Multifamily Properties
Douglas AbbeySwift Real Estate Partners
Toby BozzutoThe Bozzuto Group
Daryl CarterAvanath Capital Management
Victoria DavisUrban Atlantic
Hal FerrisSpectrum Development Solutions
Marty JonesMassDevelopment
Gadi KaufmannRCLCO
Dara KovelBeacon Communities Development LLC
Linda MandoliniEden Housing
John McIlwainJonathan Rose Companies
Dionne NelsonLaurel Street Residential
Peter PappasTerwilliger Pappas Multifamily Properties
Pamela Hughes PatenaudeJ. Ronald Terwilliger Foundation for Housing America’s Families
Michael PitchfordCommunity Preservation and Development Corporation
Nicolas RetsinasHarvard Business School
Richard RosanUrban Land Institute Foundation
Jonathan RoseJonathan Rose Companies
Robert SharpeRancho Sahuarita Company
Alazne SolisEnterprise Community Partners Inc.
Douglas TyminsAIG Global Real Estate Investment Corp.
Stephen WhyteVitus Group
Margaret WyldeProMatura Group LLC
Robert YoungentobEYA
ULI Senior Executives ULI Terwilliger Center National Advisory Board Members
37John Burns Real Estate Consulting LLC, 2016

uli.org/demographicstrategies
2001 L Street, NWSuite 200Washington, DC 20036www.uli.org
USD $12.95
>