Prepared by: GTS Group International Inc - Alberta · Alberta Metal Fabrication and Machinery...
32
Alberta Metal Fabrication and Machinery Manufacturing: Sector Overview Prepared by: GTS Group International Inc. Prepared for: Alberta Finance and Enterprise Edmonton Economic Development Corporation Central Alberta Regional Innovation Network Calgary Economic Development August 2008
Transcript of Prepared by: GTS Group International Inc - Alberta · Alberta Metal Fabrication and Machinery...

Alberta Metal Fabrication and Machinery Manufacturing: Sector Overview
Prepared by:
GTS Group International Inc.
Prepared for:
Alberta Finance and Enterprise Edmonton Economic Development Corporation
Central Alberta Regional Innovation Network Calgary Economic Development
August 2008

GTS Group International
ii
Table of Contents
Page Executive Summary . . . . . . . . . . . . . . . . . . . . . . . . . . . . . . . . . . . i 1. Introduction . . . . . . . . . . . . . . . . . . . . . . . . . . . . . . . . . . . 1 2. The Metal Fabrication Industry in Alberta . . . . . . . . . . . . . . . . . . . . . 2 2.1 Industry Summary . . . . . . . . . . . . . . . . . . . . . 2 2.2 The Primary Metal Manufacturing Sub-Sector . . . . . . . . . . . . . . 4 2.3 The Fabricated Metal Products Sub-Sector . . . . . . . . . . . . . . 6 2.4 The Machinery Manufacturing Sub-Sector . . . . . . . . . . . . . . 8 2.5 The Transportation Equipment Manufacturing Sub-Sector . . . . . 10 2.6 Metal Fabrication Industry Growth Forecast . . . . . . . . . . . . . . 13 3. Industry Exports . . . . . . . . . . . . . . . . . . . . . . . . . . . . . . . . . . . 14 3.1 Primary Metals Manufacturing Exports . . . . . . . . . . . . . . 14 3.2 Fabricated Metal Products Exports . . . . . . . . . . . . . . 14 3.3 Machinery Manufacturing Exports . . . . . . . . . . . . . . 14 3.4 Transportation Equipment Manufacturing Exports . . . . . . . 14 3.5 Total Industry Exports . . . . . . . . . . . . . . 16 4. Industry Information from Interviews . . . . . . . . . . . . . . . . . . . . . 16 4.1 Industry Sectors Served by Alberta’s Metal Fabricating Industry. . 16 4.2 Products and Services Provided by the Metal Fabrication Industry. 17 4.3 Capabilities and Areas of Expertise . . . . . . . . . . . . . . 19 4.4 Geographical Markets Served . . . . . . . . . . . . . . 19 4.5 Size Distribution by Employees of Firms Surveyed . . . . . . . 20 5. SWOT Analysis . . . . . . . . . . . . . . . . . . . . . . . . . . . . . . . . . . . 21 5.1 Strengths . . . . . . . . . . . . . . . . . . . . . . . . . . . . . . . . . . . 21 5.1.1 Strengths of Individual Firms . . . . . . . . . . . . . . . . . . . . . 21 5.1.2 Sector Strengths . . . . . . . . . . . . . . . . . . . . . 22 5.2 Weaknesses . . . . . . . . . . . . . . . . . . . . . . . . . . . . . . . . . . . 22 5.2.1 Weaknesses of Individual Firms . . . . . . . . . . . . . . . . . . . . . 22 5.2.2 Sector Weaknesses . . . . . . . . . . . . . . . . . . . . . 23 5.3 Opportunities . . . . . . . . . . . . . . . . . . . . . . . . . . . . . . . . . . . 23 5.3.1 Opportunities for Individual firms . . . . . . . . . . . . . . 23 5.3.2 Sector Opportunities . . . . . . . . . . . . . . . . . . . . . 24 5.4 Threats . . . . . . . . . . . . . . . . . . . . . . . . . . . . . . . . . . . 24 5.4.1 Threats to Individual Firms . . . . . . . . . . . . . . . . . . . . . 24 5.4.2 Sector Threats . . . . . . . . . . . . . . . . . . . . . 24
6. Conclusions . . . . . . . . . . . . . . . . . . . . . . . . . . . . . . . . . . . 25 7. Recommendations . . . . . . . . . . . . . . . . . . . . . . . . . . . . . . . . . . . 25
GTS Group International
iii
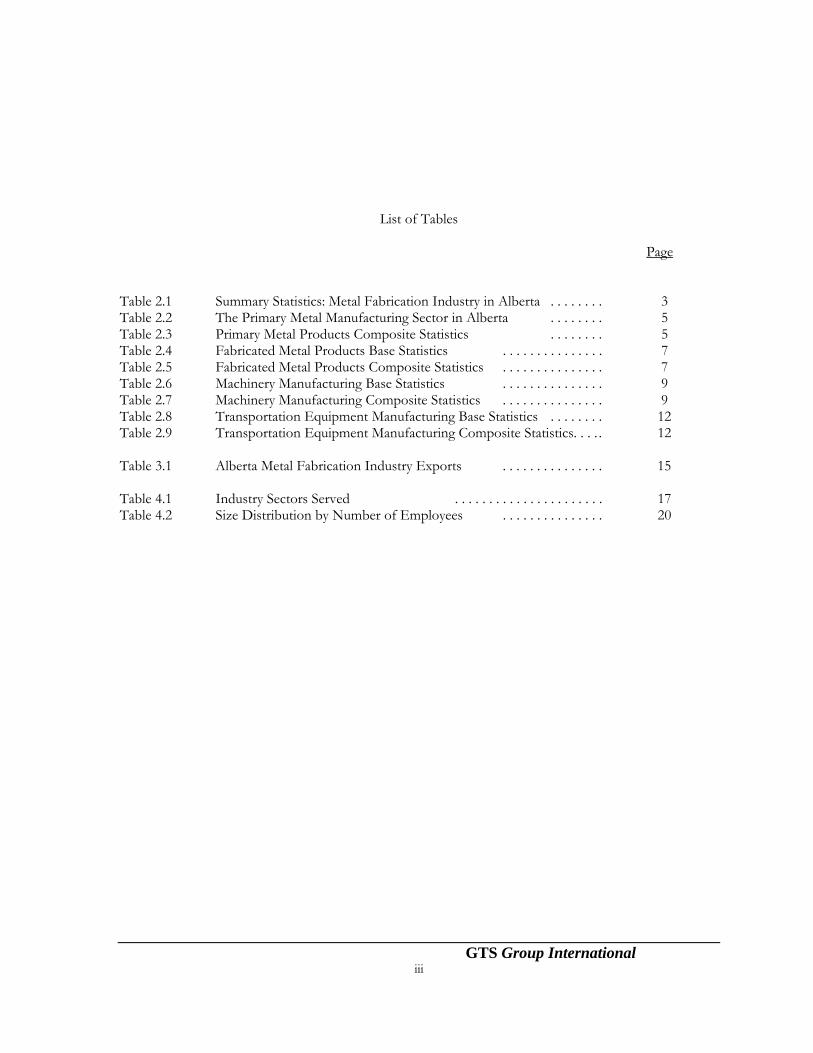
List of Tables Page Table 2.1 Summary Statistics: Metal Fabrication Industry in Alberta . . . . . . . . 3 Table 2.2 The Primary Metal Manufacturing Sector in Alberta . . . . . . . . 5 Table 2.3 Primary Metal Products Composite Statistics . . . . . . . . 5 Table 2.4 Fabricated Metal Products Base Statistics . . . . . . . . . . . . . . . 7 Table 2.5 Fabricated Metal Products Composite Statistics . . . . . . . . . . . . . . . 7 Table 2.6 Machinery Manufacturing Base Statistics . . . . . . . . . . . . . . . 9 Table 2.7 Machinery Manufacturing Composite Statistics . . . . . . . . . . . . . . . 9 Table 2.8 Transportation Equipment Manufacturing Base Statistics . . . . . . . . 12 Table 2.9 Transportation Equipment Manufacturing Composite Statistics. . . . . 12 Table 3.1 Alberta Metal Fabrication Industry Exports . . . . . . . . . . . . . . . 15 Table 4.1 Industry Sectors Served . . . . . . . . . . . . . . . . . . . . . . 17 Table 4.2 Size Distribution by Number of Employees . . . . . . . . . . . . . . . 20

GTS Group International
i
EXECUTIVE SUMMARY Introduction Alberta will require more than $200 billion of new construction and maintenance spending in the next 10-15 years, much of it—approximately $50 billion—for fabricated metal products. Based on existing activity of approximately $14 billion per year, in addition to that new spending, Alberta is quickly becoming one of Canada’s major metal manufacturing centres, behind only Ontario and Quebec. A market opportunity of this size has attracted the attention of the world and global supply chains emerging from Alberta have been expanding and forming as project construction cycles continue. This presents a remarkable opportunity for Alberta’s metal fabrication companies to grow. This report was sponsored by Alberta Finance and Enterprise, Calgary Economic Development, the Central Alberta Regional Innovation Network and Edmonton Economic Development Corporation to support the growth of the metal fabrication and manufacturing industry in Alberta by determining its present status and its future prospects. The sub-sectors included in this report are:
Primary Metal Manufacturing (NAICS code 331) Fabricated Metal Products (NAICS code 332) Machinery Manufacturing (NAICS code 333) Transportation Equipment Manufacturing (NAICS code 336)
Collectively, these sub-sectors are referred to as the metal fabrication industry in this report. The report provides an overview of the industry from the year 2000 to 2006 based on Statistics Canada data. In addition, interviews were held with 50 companies located throughout Alberta to develop a “feet-on-the-street” overview, determine markets and customers, products and services, as well as general industry capabilities. Working from those interviews, this report also offers an initial analysis of strengths, weaknesses, opportunities and threats (SWOT) influencing Alberta’s metal fabrications sector. Summary The following points are some of the highlights emerging from both the interviews and Statistics Canada data that form the basis of this report. The Metal Fabrication Industry in Alberta is substantial, with sales of approximately $14.1 billion in
2006. It employs almost 60,000 people province wide, and has a payroll of approximately $3.1 billion.
The estimated economic impact of the industry on the provincial economy in 2006 was $28.4 billion,
including direct, indirect, and induced impacts. The industry in Alberta is very diverse, supplying a wide variety of services and products to a number
of sectors, including: conventional oil and gas, heavy oil & oil sands, forestry, construction, agriculture, petrochemicals, mining, food processing and a number of other sectors.

GTS Group International
ii
The industry has considerable capabilities and areas of expertise including design, engineering,
fabrication and manufacture, and the ability to produce highly specialized products and equipment. In terms of markets, the industry is mainly local to Alberta, with secondary markets being other
Western Canadian provinces, the USA, and international markets. Companies with niche markets and/or products tend to be the most successful in accessing markets
outside the province. A good relationship with an Alberta company working internationally will facilitate off-shore exports
by an Alberta fabricator, as the senior Alberta contractor often prefers to be supplied by an Alberta partner.
The industry is comprised primarily of a large number of small businesses, with 85% of metal
fabrication firms in the Alberta having fewer than 50 employees, the Statistics Canada definition of a small business.
Strengths identified by the industry include diversity and flexibility, design and engineering, a highly
skilled workforce, quality products and workmanship, and what was considered to be the best apprenticeship program in Canada.
Weaknesses identified by the industry include a shortage/lack of skilled workers, rising wages and
labour costs, increasing costs and availability of material inputs, an over-dependence on the oil & gas sector, and the slowdown in the US economy.
Sector Growth Forecast Government of Alberta forecasts see provincial GDP nominally expanding 9.0% in 2008, with a
drop to just under 4% in 2009. Economic growth is seen to rebound over 2010 and 2011 with growth averaging 5.1% over the two-year period. Nominal GDP is set to surpass $300 billion for the first time in 2010.
Although exports will account for a minority share of rising production, they too will increase over
the forecast period. Oil and gas activity in the rest of Canada will be the primary determinant of export growth.
With both exports and domestic demand experiencing robust growth, real production will rise by an
average of 9.6 per cent over the forecast period to 2009. Increases in labour costs are expected to prove more enduring, with labour shortages and thus rising
real wages expected to persist over the forecast period. However, profit margins are not expected to be unduly affected.
o Producers have considerable pricing power and have proven capable of passing their higher costs on to their customers in the past. This is not expected to change given the robust growth in demand for the sector’s products.

GTS Group International
iii
o Output prices for the sector are expected to average growth of 2.8 per cent per year through 2009.
Recommendations
There is a need for consultation and cooperation between metal fabrication sector companies, government, professional associations and related organizations to identify and develop:
⇒ sources for skilled workers in order to alleviate labour shortages. ⇒ productivity, innovation and technology advancements that can be used to expand and
increase company competitiveness. ⇒ strategies to increase worker training and upgrading skills in order to assist in improving
productivity.
⇒ areas for cost reductions, such as supply sourcing, transportation costs, energy efficiency, employee productivity, etc.
⇒ effective strategies for market entry into the expanding oil sands construction and
maintenance markets.
⇒ new market and export opportunities and product development, such as aerospace, defence and military, alternate energy equipment, etc.
⇒ opportunities to play a role in the facilitation and consultation between major project contractors and metal fabricators to improve design and engineering specifications in order to increase productivity, and delivery times.
GTS Group International
1
1. Introduction This report was sponsored by Alberta Finance and Enterprise, Calgary Economic Development, Edmonton Economic Development Corporation and the Central Alberta Regional Innovation Network to ascertain the status of the metal fabrication industry in Alberta. The sub-sectors included in this report are:
Primary Metal Manufacturing (NAICS code 331), including o Iron and steel mills and ferro-alloy manufacturing o Iron and steel pipes and tubes manufacturing o Rolling and drawing o Alumina and aluminum production and processing o Extruding and alloying
Fabricated Metal Products (NAICS code 332), including o Forging and stamping o Plate work and fabricated structural product manufacturing o Prefabricated metal building and component manufacturing o Boiler, tank, pressure vessel and heat exchanger manufacturing o Machine shops
Machinery Manufacturing (NAICS code 333), including o Agricultural, construction and mining machinery manufacturing o Oil and gas field machinery manufacturing o Industrial machinery manufacturing o Sawmill and woodworking machinery manufacturing o Ventilation, heating, air conditioning and commercial refrigeration equipment
manufacturing Transportation Equipment Manufacturing (NAICS code 336), including
o Heavy duty truck manufacturing o Motor vehicle body and trailer manufacturing o Motor home, travel trailer and camper manufacturing o Aerospace products and parts manufacturing o Railroad rolling stock manufacturing
Collectively, these sub-sectors are referred to as the metal fabrication industry in this report. The report provides an overview of the industry from the year 2000 to 2006 based on Statistics Canada data. In addition, interviews were held with 50 companies located throughout Alberta to develop a “feet-on-the-street” overview, determine markets and customers, products and services, as well as general industry capabilities. Working from those interviews, this report also offers an initial analysis of strengths, weaknesses, opportunities and threats (SWOT) influencing Alberta’s metal fabrications sector.
GTS Group International
2
2. The Metal Fabrication Industry in Alberta This section contains statistics on the primary metal manufacturing, the fabricated metal products, the machinery manufacturing, and the transportation equipment manufacturing sub-sectors, herein collectively referred to as the metal fabricating industry. 2.1 Industry Summary Overview
o Summary statistics for the Metal Fabrication Industry in Alberta are contained in Table 2.1. By the end of 2006, the metal fabrication industry in Alberta was a $14.1 billion industry (sale of manufactured goods) with employment of approximately 60,000 people and a payroll of approximately $3.1 billion.
o There were approximately 2,600 establishments in the industry in 2006, up from approximately 1,600 in 2000.
Sales of Manufactured Goods
o The industry has experienced substantial growth based on sales of manufactured goods. Between 2000 and 2006, sales have more than doubled.
o Sales of manufactured goods grew by 16% between 2005 and 2006, reaching $14.1 billion in 2006.
Employment Growth
o Employment growth in the industry has also been substantial, although not at the same pace as sales. Total employment grew by 46% between 2000 and 2006 with total industry employment reaching almost 60,000 people
o In 2006, it is estimated the industry employed more than 44,800 production workers, with a further 14,500 employed in administrative capacities.
Payroll
o Payroll has also grown. It is estimated to have increased by 91% between 2000 and 2006, and grew by 19% in the one-year period from 2005 to 2006.
Economic Impact
o Applying provincial multipliers as developed by Alberta Finance and Enterprise for the NAICS 331, 332, 333, and 336 sub sectors, the total economic impact of the metal fabrication industry( direct, indirect and induced impacts - using sales of manufactured goods) was estimated to be $28.4 billion in 2006.

TableSum
Number of estSales of mSales of mCost ofCost ofCost ofManufactProductiProductiNon-mNon-mTotal emTotal Total valSource:* Esti** Es
2.1mary Statistics. Metal Fabrication Industry in Alberta % Change % Change % Change % Change
2000 2003 2005 2006 2000-2003 2003-2005 2005-2006 2000-2006ablishments 1,598 1,694 2,524 2,598 6% 49% 3% 63%
anufactured goods and other revenue (x 1,000) $7,365,142 $9,042,315 n/a n/a 23%anufactured goods (x 1,000) $6,802,392 $8,220,448 $12,216,160 $14,142,245 21% 49% 16% 108%
materials, supplies and goods for resale (x 1,000) $3,856,076 $4,985,965 n/a n/a 29% fuel and utilities (x 1,000) $116,458 $159,024 n/a n/a 37% materials and supplies (x 1,000) $3,466,926 $4,429,200 n/a n/a 28%
uring value added (x 1,000) $3,317,265 $3,643,102 n/a n/a 10%on workers (persons) * 32,681 35,125 40,523 44,843 7% 15% 11% 37%on workers wages (x 1,000) 1,147,470 1,386,017 n/a n/a 21%
anufacturing employees (persons) * 8,031 10,804 13,149 14,564 35% 22% 11% 81%anufacturing employee salaries (x 1,000) 455,069 645,935 n/a n/a 42%
ployees (persons) * 40,712 45,929 53,672 59,407 13% 17% 11% 46%salaries and wages (x 1,000) ** $1,602,539 $2,031,952 $2,571,244 $3,068,068 27% 27% 19% 91%
ue added (x 1,000) 3,503,313 3,900,172 n/a n/a 11% Statistics Canada. Principal statistics for manufacturing industries, by NAICS, annual nominal dollars unless otherwise noted
mates. Worker/employee data is not available for Primary Metal Products (NAICS 331). NAICS 331 account for <7% of total.timate. Wage/salary data not available for Primary Metal Products (NAICS 331). NAICS 331 account for <7% of the total.
GTS Group International 3

GTS Group International
4
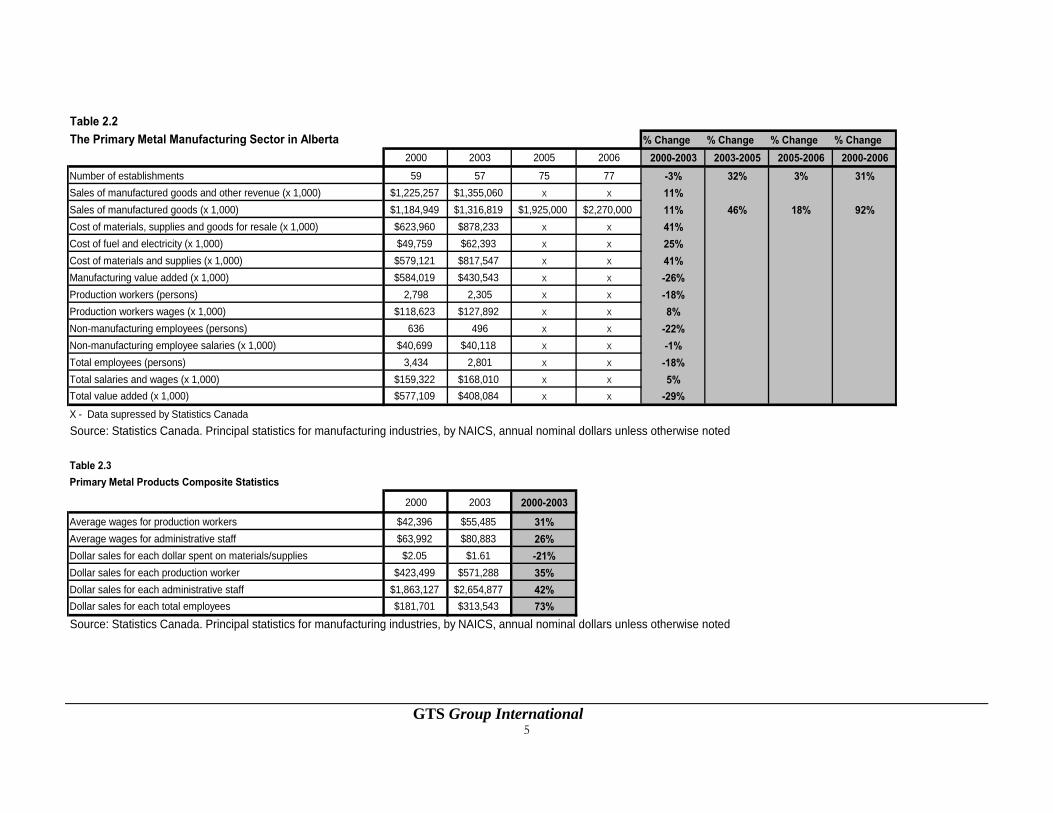
2.2 The Primary Metal Manufacturing Sub-Sector The primary metal manufacturing sector in Alberta includes iron and steel mills, steel rolling mills, and other primary metal facilities. Table 2.2 provides base statistics for the sector in Alberta for the period 2000 to 2003. For subsequent years, only the number of establishments is available from Statistics Canada due to confidentiality requirements. However, sale of manufactured goods are available from other sources for the years 2005 and 2006. This information has been incorporated into Table 2.2. Sales of manufactured goods were approximately $1.2 billion in the year 2000. During the years 2000 to 2003 sales increased by 11%, with a further increase of 46% between 2003 and 2005. With a large single year increase of 18% between 2005 and 2006, sales reached approximately $2.3 billion. Overall, from 2000 to 2006, sales of manufactured goods increased by 92%, for an average annual growth rate in excess of 15%. The cost of materials and supplies increased by 41% between 2000 and 2003, and as a result, the cost of materials increased from 52% of sales in 2000 to 66% of sales in 2003. In 2003, the sector employed some 2,300 production workers, down 18% from the 2,800 production workers employed in 2000. The number of non-manufacturing employees (administrative and professional staff) decreased by 22% during the years 2000 to 2003, from 636 staff to 496. The total number of employees in the sector decreased by 18% between 2000 and 2003, from 3,434 to 2,801. While the number of production workers decreased, the wage total wage bill for these workers increased by 8% between 2000 and 2003, from $118.6 million to $127.9 million. There was a slight decrease in the total salaries paid to non-production workers, from $40.7 million in 2000 to $40.1 million in 2003. Overall, total salaries and wages increased by 5% between 2000 and 2003, from $159.3 million to $168.0 million. As per Table 2.3, the average wages for production workers increased by 31% between 2000and 2003, going from $42,400 to $55,500 per year from $37,500 to $43,400 per year. The average salary for administrative staff reached $80,900 in 2003, an increase of 26% over the year 2000. Dollar sales for each dollar spent on materials and supplies decreased by 21% between 2000 and 2003, from $2.05 to $1.61. Gains in dollar sales per production worker seem to indicate productivity gains. Between 2000 and 2003, sales per production worker increased from $423,500 to $571,300, an increase of 35%. If gains in dollar sales per production worker were impressive, they were even more so for administrative staff. Dollar sales for each administrative staff reached almost $2.7 million in 2003, an increase of 42% over the year 2000.
GTS Group International
5
Table 2.2The Pri
NumbSales oSales oCost of mCost of fCost of mManufacProducProducNon-mNon-mTotal eTotal sTotal v
X - DaSourc
Table 2.3Primar
AverageAverageDollar sDollar sDollar sDollar s
Sourc
mary Metal Manufacturing Sector in Alberta % Change % Change % Change % Change2000 2003 2005 2006 2000-2003 2003-2005 2005-2006 2000-2006
er of establishments 59 57 75 77 -3% 32% 3% 31%f manufactured goods and other revenue (x 1,000) $1,225,257 $1,355,060 X X 11%f manufactured goods (x 1,000) $1,184,949 $1,316,819 $1,925,000 $2,270,000 11% 46% 18% 92%
aterials, supplies and goods for resale (x 1,000) $623,960 $878,233 X X 41%uel and electricity (x 1,000) $49,759 $62,393 X X 25%
aterials and supplies (x 1,000) $579,121 $817,547 X X 41%turing value added (x 1,000) $584,019 $430,543 X X -26%
tion workers (persons) 2,798 2,305 X X -18%tion workers wages (x 1,000) $118,623 $127,892 X X 8%anufacturing employees (persons) 636 496 X X -22%anufacturing employee salaries (x 1,000) $40,699 $40,118 X X -1%mployees (persons) 3,434 2,801 X X -18%alaries and wages (x 1,000) $159,322 $168,010 X X 5%alue added (x 1,000) $577,109 $408,084 X X -29%ta supressed by Statistics Canadae: Statistics Canada. Principal statistics for manufacturing industries, by NAICS, annual nominal dollars unless otherwise noted
y Metal Products Composite Statistics
2000 2003 2000-2003
wages for production workers $42,396 $55,485 31% wages for administrative staff $63,992 $80,883 26%
ales for each dollar spent on materials/supplies $2.05 $1.61 -21%ales for each production worker $423,499 $571,288 35%ales for each administrative staff $1,863,127 $2,654,877 42%ales for each total employees $181,701 $313,543 73%
e: Statistics Canada. Principal statistics for manufacturing industries, by NAICS, annual nominal dollars unless otherwise noted
GTS Group International
6
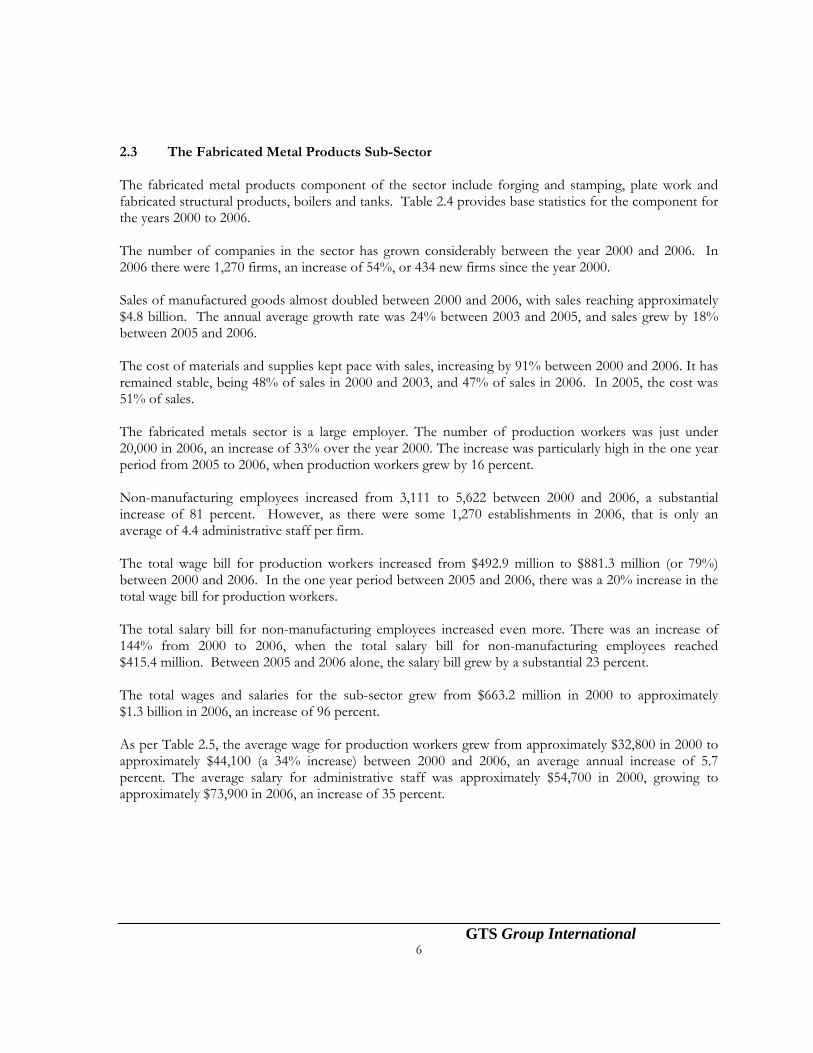
2.3 The Fabricated Metal Products Sub-Sector The fabricated metal products component of the sector include forging and stamping, plate work and fabricated structural products, boilers and tanks. Table 2.4 provides base statistics for the component for the years 2000 to 2006. The number of companies in the sector has grown considerably between the year 2000 and 2006. In 2006 there were 1,270 firms, an increase of 54%, or 434 new firms since the year 2000. Sales of manufactured goods almost doubled between 2000 and 2006, with sales reaching approximately $4.8 billion. The annual average growth rate was 24% between 2003 and 2005, and sales grew by 18% between 2005 and 2006. The cost of materials and supplies kept pace with sales, increasing by 91% between 2000 and 2006. It has remained stable, being 48% of sales in 2000 and 2003, and 47% of sales in 2006. In 2005, the cost was 51% of sales. The fabricated metals sector is a large employer. The number of production workers was just under 20,000 in 2006, an increase of 33% over the year 2000. The increase was particularly high in the one year period from 2005 to 2006, when production workers grew by 16 percent. Non-manufacturing employees increased from 3,111 to 5,622 between 2000 and 2006, a substantial increase of 81 percent. However, as there were some 1,270 establishments in 2006, that is only an average of 4.4 administrative staff per firm. The total wage bill for production workers increased from $492.9 million to $881.3 million (or 79%) between 2000 and 2006. In the one year period between 2005 and 2006, there was a 20% increase in the total wage bill for production workers. The total salary bill for non-manufacturing employees increased even more. There was an increase of 144% from 2000 to 2006, when the total salary bill for non-manufacturing employees reached $415.4 million. Between 2005 and 2006 alone, the salary bill grew by a substantial 23 percent. The total wages and salaries for the sub-sector grew from $663.2 million in 2000 to approximately $1.3 billion in 2006, an increase of 96 percent. As per Table 2.5, the average wage for production workers grew from approximately $32,800 in 2000 to approximately $44,100 (a 34% increase) between 2000 and 2006, an average annual increase of 5.7 percent. The average salary for administrative staff was approximately $54,700 in 2000, growing to approximately $73,900 in 2006, an increase of 35 percent.

Table 2.4 % Change % Change % Change % ChangeFabricated Metal Products Base Statistics 2000 2003 2005 2006 2000-2003 2003-2005 2005-2006 2000-2006Number of establishments 826 891 1210 1270 8% 36% 5% 54%Sales of manufactured goods and other revenue (x 1,000) $2,697,339 $3,089,845 4,444,886$ $5,183,103 15% 44% 17% 92%Sales of manufactured goods (x 1,000) $2,480,581 $2,804,796 4,142,709$ $4,792,358 13% 48% 16% 93%Cost of materials, supplies and goods for resale (x 1,000) $1,327,740 $1,543,042 n/a n/a 16%Cost of fuel and utilities (x 1,000) $38,551 $54,273 $73,831 $86,677 41% 36% 17% 125%Cost of materials and supplies (x 1,000) $1,187,401 $1,333,604 $2,032,478 $2,272,945 12% 52% 12% 91%Manufacturing value added (x 1,000) $1,270,900 $1,421,477 $2,036,494 $2,470,147 12% 43% 21% 94%Production workers (persons) 15,037 16,098 17,163 19,990 7% 7% 16% 33%Production workers wages (x 1,000) $492,928 $582,324 $733,577 $881,308 18% 26% 20% 79%Non-manufacturing employees (persons) 3,111 4,432 5,275 5,622 42% 19% 7% 81%Non-manufacturing employee salaries (x 1,000) $170,295 $232,224 $336,577 $415,365 36% 45% 23% 144%Total employees (persons) 18,148 20,530 22,438 25,612 13% 9% 14% 41%Total salaries and wages (x 1,000) $663,223 $814,548 $1,070,154 $1,296,673 23% 31% 21% 96%Total value added (x 1,000) $1,354,732 $1,496,102 n/a n/a 10%Source: Statistics Canada. Principal statistics for manufacturing industries, by NAICS, annual nominal dollars unless otherwise noted
Table 2.5 % Change % Change % Change % ChangeFabricated Metal Products Composite Statistics 2000 2003 2005 2006 2000-2003 2003-2005 2005-2006 2000-2006Average wages for production workers $32,781 $36,174 $42,742 $44,087 10% 18% 3% 34%Average wages for administrative staff $54,740 $52,397 $63,806 $73,882 -4% 22% 16% 35%Dollar sales for each dollar spent on materials/supplies $2.09 $2.10 $2.04 $2.11 - -3% 3% -Dollar sales for each production worker $164,965 $174,233 $241,374 $239,738 6% 39% -1% 45%Dollar sales for each administrative staff $797,358 $632,851 $785,348 $852,429 -20% 24% 9% 7%Dollar sales for each total employees $73,162 $75,160 $184,629 $187,113 3% 146% 1% 156%Source: Statistics Canada. Principal statistics for manufacturing industries, by NAICS, annual nominal dollars unless otherwise noted
GTS Group International 7

GTS Group International
8
The dollar sales for each dollar spent on materials and supplies were relatively stable in the period 2000 to 2006. It was $2.09 in 2000, decreasing slightly to $2.94 in 2005, and then increased again to $2.11 in 2006. The dollar sales for each production worker rose by 45% between 2000 and 2006 from approximately $165,000 to approximately $239,800. This would seem to indicate that there are productivity gains in the metal fabrication sector. On the other hand, the dollar sales for each administrative staff member increased by only 7% from 2000 to 2006 from approximately $797,400 to approximately $852,400. This rate of increase is far below that recorded by each production worker. 2.4 The Machinery Manufacturing Sub-Sector The machinery manufacturing component includes agricultural, construction, and mining and oil & gas field machinery manufacturing, industrial machinery manufacturing, and sawmill and woodworking machinery manufacturing. It is the largest of the sub-sectors in Alberta’s metal fabrication industry, both in terms of sales and in terms of employees. According to Table 2.6, sales of manufactured goods more than doubled (rising 139%) between 2000 and 2006, from approximately $2.6 billion to approximately $6.2 billion per year. On average, sales increased by 23% per year in the six-year period. If sales rose rapidly, the costs of input materials and supplies kept pace. Input prices more than doubled (147%) between 2000 and 2006, from $1.4 billion to $3.5 billion. The cost of materials and supplies has remained relatively stable, accounting for 54% of sales in 2000 and 56% of sales in 2006. While substantial, increases in production workers were not nearly as dramatic. The sector employed approximately 11,500 production workers in 2000, growing to approximately 19,200 in 2005, a 66% increase. This still translates into an annual average growth of more than 10% over the six-year period. Growth in the number of non-manufacturing employees was substantially higher than for production workers, increasing by 156% between 2000 and 2006, from approximately 2,800 to approximately 7,300. This indicates an average growth rate of about 25% over the past six years, although the annual growth seems to have moderated between 2005 and 2006. The wage bill for construction workers essentially doubled between 2000 and 2006 from approximately $437.7 million to approximately $876.2 million, while the salary bill for non-manufacturing workers increased by more than 200% between 2000 and 2006, from $172.6 million to $519.4 million. The total wage and salary bill grew from some $610.2 million in 2000 to $1.4 billion in 2006. In percentage terms the total wage bill has been relatively stable, representing approximately 23% of sales in both 2000 and 2006.

Table 2.6 % Change % Change % Change % ChangeMachinery Manufacturing Base Statistics 2000 2003 2005 2006 2000-2003 2003-2005 2005-2006 2000-2006Number of establishments 566 594 954 966 5% 61% 1% 71%Sales of manufactured goods and other revenue (x 1,000) $2,830,689 $3,781,150 $5,632,339 $6,668,671 34% 49% 18% 136%Sales of manufactured goods (x 1,000) $2,574,965 $3,323,433 $5,280,535 $6,154,659 29% 59% 17% 139%Cost of materials, supplies and goods for resale (x 1,000) $1,564,158 $2,139,978 n/a n/a 37%Cost of fuel and utilities (x 1,000) $22,259 $36,142 $64,305 $76,941 62% 78% 20% 246%Cost of materials and supplies (x 1,000) $1,402,916 $1,893,507 $2,906,879 $3,463,056 35% 54% 19% 147%Manufacturing value added (x 1,000) $1,188,821 $1,415,681 $2,343,499 $2,834,950 19% 66% 21% 138%Production workers (persons) 11,511 13,211 17,010 19,161 15% 29% 13% 66%Production workers wages (x 1,000) $437,656 $546,563 $747,674 $876,242 25% 37% 17% 100%Non-manufacturing employees (persons) 2,844 4,865 6,344 7,273 71% 30% 15% 156%Non-manufacturing employee salaries (x 1,000) $172,550 $316,544 $436,717 $519,363 83% 38% 19% 201%Total employees (persons) 14,355 18,076 23,354 26,434 26% 29% 13% 84%Total salaries and wages (x 1,000) $610,206 $863,107 $1,184,391 $1,395,605 41% 37% 18% 94%Total value added (x 1,000) $1,289,730 $1,623,894 n/a n/a 26%Source: Statistics Canada. Principal statistics for manufacturing industries, by NAICS, annual nominal dollars unless otherwise noted
Table 2.7 % Change % Change % Change % ChangeMachinery Manufacturing Composite Statistics 2000 2003 2005 2006 2000-2003 2003-2005 2005-2006 2000-2006Average wages for production workers $38,021 $41,372 $43,955 $45,730 9% 6% 4% 20%Average wages for administrative staff $60,672 $65,066 $68,839 $71,410 7% 6% 4% 18%Dollar sales for each dollar spent on materials/supplies $1.84 $1.76 $1.82 $1.78 -4% 3% -2% -3%Dollar sales for each production worker $223,696 $251,566 $310,437 $321,208 12% 23% 3% 44%Dollar sales for each administrative staff $905,403 $683,131 $832,367 $846,234 -25% 22% 2% -7%Dollar sales for each total employees $108,963 $118,388 $226,108 $232,831 9% 91% 3% 114%Source: Statistics Canada. Principal statistics for manufacturing industries, by NAICS, annual nominal dollars unless otherwise noted
GTS Group International
9

GTS Group International
10
As per Table 2.7, the average wages for production workers increased by 20% between 2000 and 2006, from $38,021 to $45,730. In percentage terms, this translates into an average annual increase of 3.3 percent The average salary for administrative staff increased from $60,672 in 2000 to $71,410 in 2006, an increase of 18%. Again, with an average annual increase of 3%, this rate of growth does not seem to be excessive. Dollar sales for each dollar spent on materials and supplies have shown some slight variation over the six-year period between 2000 and 2006, fluctuating between $1.76 and $1.84. Dollar sales for each production worker have risen steadily since 2000, from approximately $223,700 to $321,200 in 2006, an overall increase of 44%. This would seem to indicate a substantial productivity gain, as the annual average rate of increase over the six year period exceeds 7 percent. Dollar sales for each administrative staff has decreased between 2000 and 2006, from approximately $905,400 to $846,200, a decrease of 7 percent. The ratio of production workers to administrative workers was 4.04:1 in 2000, decreasing to 2.63:1 in 2006. This could indicate some potential for productivity gain, but there may well be valid reasons for the change in the ratio. 2.5 The Transportation Equipment Manufacturing Sub-sector Transportation equipment manufacturing includes heavy duty truck manufacturing, and trailer and truck body manufacturing. As of 2006, there were some 285 firms in this sub-sector. Table 2.8 shows that sales of manufactured goods increased by 58% between 2000 and 2006, from $612 million to $966 million, for an annual average growth rate in the period of just under 10 percent. Cost of materials and supplies grew at a somewhat higher rate of 67% in the same period, increasing from $297.5 million in 2000 to $496.3 million in 2006. As a percentage of sales, cost of materials and supplies have varied somewhat in the period, from a low of 48% in 2003 to a high of 56% in 2005. In 2006, cost of materials and supplies were 53% of sales. There was a small increase in the number of production workers from 3,335 to 3,582 from 2000 to 2006, an increase of 7 percent. There was a different pattern for non-manufacturing employees. The sector shed 30% of its non-manufacturing employees between 2000 and 2006, decreasing from 1,440 to just over 1,000 employees. There was a period low of 878 non-manufacturing employees in 2005. As can be seen in Table 2.9, production workers’ average annual wages increased from $29,464 in 2000 to $38,497 in 2006, an increase of 31 percent. The annual average increase in the period amounted to just over 5 percent. Non-manufacturing employees’ average salaries increased by 29% between 2000 and 2006, from $49,670 to $63,975. Dollar sales for each dollar spent on materials/supplies showed considerable variation in the period, ranging from a high of $2.02 in 2003 to a low of $1.78 in 2005. In 2006, dollar sales for each dollar spent on materials and supplies amounted to $1.86.
GTS Group International
11
Dollar sales for each production worker increased steadily between 2000 and 2006, from $168,500 to $258,300 per worker, a total increase of 53% - or almost 9% per year. Although the annual growth rate was almost 9%, there was a slight decrease in sales per production worker in 2006. Dollar sales for each administrative staff increased by a substantial 136% from $390,200 to $921,500 between 2000 and 2006, for an annual average growth rate in excess of 22 percent. As with the production workers, there was a decrease in dollar sales per administrative staff in 2006.

GTS Group International
12
Table 2TransporNumber ofSalesSalesCost of mCost of fuCost of mManufaProductProductNon-mNon-mTotal emTotal Total Sourc
Table 2Transpor
Average wAverage wDollar salDollar salDollar Dollar salSourc
.8 % Change % Change % Change % Changetation Equipment Manufacturing Base Statistics 2000 2003 2005 2006 2000-2003 2003-2005 2005-2006 2000-2006 establishments 147 152 285 285 3% 88% - 94%
of manufactured goods and other revenue (x 1,000) $611,857 $816,260 $921,468 $965,806 33% 13% 5% 58% of manufactured goods (x 1,000) $561,897 $775,400 $867,916 $925,228 38% 12% 7% 65%
aterials, supplies and goods for resale (x 1,000) $340,218 $424,712 n/a n/a 25%el and utilities (x 1,000) $5,889 $6,216 $8,800 $9,278 6% 42% 5% 58%aterials and supplies (x 1,000) $297,488 $384,542 $487,045 $496,257 29% 27% 2% 67%
cturing value added (x 1,000) $273,525 $375,401 $369,754 $428,954 37% -2% 16% 57%ion workers (persons) 3,335 3,511 3,319 3,582 5% -5% 8% 7%ion workers wages (x 1,000) $98,263 $129,238 $121,178 $137,895 32% -6% 14% 40%
anufacturing employees (persons) 1,440 1,011 878 1,004 -30% -13% 14% -30%anufacturing employee salaries (x 1,000) $71,525 $57,049 $49,979 $64,231 -20% -12% 29% -10%
ployees (persons) 4,775 4,522 4197 4,586 -5% -7% 9% -4%salaries and wages (x 1,000) $169,788 $186,287 $171,157 $202,126 10% -8% 18% 19%value added (x 1,000) $281,742 $372,092 n/a n/a 32%e: Statistics Canada. Principal statistics for manufacturing industries, by NAICS, annual nominal dollars unless otherwise noted
.9tation Equipment Manufacturing Composite Statistics % Change % Change % Change % Change
2000 2003 2005 2006 2000-2003 2003-2005 2005-2006 2000-2006ages for production workers $29,464 $36,809 $36,510 $38,497 25% -1% 5.00% 31%ages for administrative staff $49,670 $56,428 $56,924 $63,975 14% 1% 12.00% 29%
es for each dollar spent on materials/supplies $1.89 $2.02 $1.78 $1.86 7% -12% 4.00% -2%es for each production worker $168,485 $220,849 $261,499 $258,299 31% 18% -1.00% 53%
sales for each administrative staff $390,206 $766,963 $988,515 $921,542 97% 29% -7.00% 136%es for each total employees $71,250 $93,921 $206,794 $201,751 32% 122% -2.00% 183%
e: Statistics Canada. Principal statistics for manufacturing industries, by NAICS, annual nominal dollars unless otherwise noted

GTS Group International
13
2.6 Metal Fabrication Industry Growth Forecast Government of Alberta forecasts see provincial GDP nominally growing 9.0% in 2008, with a drop to just under 4% in 2009. Economic growth is seen to rebound over 2010 and 2011 with growth averaging 5.1% over the two-year period. Nominal GDP is set to surpass $300 billion for the first time in 2010. Domestic (i.e. Alberta-based) demand for fabricated metal products will be the key source of growth for the sector. Forecasts are calling for average annual growth in real domestic demand of 10.3 per cent per year through to 2009, though this figure may be reduced slightly as the industry deals with the impacts of the stronger Canadian dollar and the re-profiling of major industrial project schedules. Although exports will account for a minority share of rising production, they too will increase over the forecast period. This may be affected by the current and near-term weakness of the American dollar and by international economic uncertainties. However oil and gas activity in the rest of Canada will be the primary determinant of in-country export growth. With both exports and domestic demand experiencing robust growth, real production will rise by an average of 9.6 per cent over the forecast period to 2009. This will have an impact on the trade flows of fabricated metal goods and the steel feedstock demanded by the industry, and is heavily dependent on the timing of major capital projects in the oil sands and energy sectors. Increases in labour costs are expected to prove more enduring, with labour shortages and thus rising real wages expected to persist over the forecast period. However, profit margins are not expected to be unduly affected. Producers have considerable pricing power and have proven capable of passing their higher costs on to their customers in the past; this is not expected to change given robust demand growth for the sector’s products. Output prices for the sector are expected to average growth of 2.8 per cent per year through 2009.

GTS Group International
14
3. Industry Exports Industry exports are shown in Table 3.1.
3.1 Primary Metals Manufacturing Primary metals manufacturing exports have more than tripled from approximately $435.5 million in 2000 to $1.5 billion in 2006. While exports represented 37% of total sales in 2000, they have grown to represent some 66% of sales in 2006. Thus, there is a growing export dependency in this sub-sector, with more than half of the output being dependent on export markets. From 2000 through 2006, the US market grew from 22% of exports to 31%. This would seem to indicate that, notwithstanding the increasing proportion going to the US, there is diversity in export markets for this sector. 3.2 Fabricated Metal Products Exports Fabricated metal products have the lowest ratio of exports to total sales of all the sub-sectors comprising the metal fabrication industry in Alberta. Exports have remained stable at 13% - 14% of total sales for the entire period from 2000 to 2006, being $332 million in 2000 and $635 million in 2006. Consequently, it can be concluded that this sub-sector is essentially domestic. While overall exports are low, the US market accounts for 72% - 78% of total exports. Thus, exports are largely dependent upon the US market. 3.3 Machinery Manufacturing Exports Machinery manufacturing exports amounted to more than $2.1 billion in 2005, the highest of all the sub-sectors. Exports have grown in approximate lock-step with total sales, ranging between 33% and 38% of sales in the 2000 to 2006 period. The US market accounted for 65% of exports in 2000, and has remained relatively stable, with the US market accounting for 61% in 2006. 3.4 Transportation Equipment Manufacturing Exports Exports as a percentage of total sales have declined between 2000 and 2006. In 2000, exports amounted to 60% of sales, dropping to 46% in 2003 and 2005, before recovering to 50% of total sales in 2006. Thus, as with primary metals manufacturing, this sub-sector can be deemed to be export dependent, as any disruption in exports would have substantial impact. In the period 2000 to 2006, the US market accounted for 75% to 85% of total exports. Thus, in terms of exports there is a substantial dependency on the US market.

GTS Group International
15
Table 3.Alber
NAICS
1ta Metal Fabrication Industry Exports (in $000)
% ∆ % ∆ % ∆ % ∆2000 2003 2005 2006 2000 - 2003 2003 - 2005 2005 - 2006 2000 - 2006
331 - Primary Metal ManufacturingTotal Sales of Manufacured Goods $1,184,949 $1,316,819 $1,925,000 $2,270,000 11% 46% 18% 92%
as a % of SalesExports 37% 51% 56% 66%Exports to All Countries $435,536 $665,649 $1,073,747 $1,497,895 53% 61% 40% 244%ports $94,174 $141,247 $333,187 $470,014 50% 136% 41% 399%ports as % of Total 22% 21% 31% 31%
332 - Fabricated Metal Product Manufacturing
Total US ExUS Ex
NAICSTotal Sales of Manufacured Goods $2,480,581 $2,804,796 $4,142,709 $4,792,358 13% 48% 16% 93%
as a % of SalesExports 13% 14% 13% 13%Exports to All Countries $331,984 $383,991 $522,563 $634,650 16% 36% 21% 91%ports $259,317 $286,551 $377,624 $471,771 11% 32% 25% 82%ports as % of Total 78% 75% 72% 74%
333 - Machinery Manufacturing
Total US ExUS Ex
NAICSTotal Sales of Manufacured Goods $2,574,965 $3,323,433 $5,280,535 $6,154,659 29% 59% 17% 139%
as a % of SalesExports 38% 38% 33% 35%Exports to All Countries $967,630 $1,273,298 $1,737,000 $2,147,597 32% 36% 24% 122%ports $632,317 $735,417 $1,030,530 $1,317,900 16% 40% 28% 108%ports as % of Total 65% 58% 59% 61%
336 - Transportation Equipment Manufacturing
Total US ExUS Ex
NAICSTotal Sales of Manufacured Goods $561,897 $775,400 $867,916 $925,228 38% 12% 7% 65%
as a % of SalesExports 60% 46% 46% 50%Exports to All Countries $334,571 $355,299 $397,233 $462,950 6% 12% 17% 38%ports $259,704 $302,691 $318,550 $346,093 17% 5% 9% 33%ports as % of Total 78% 85% 80% 75%
Sales of Manufacured Goods
Total US ExUS Ex
Total $6,802,392 $8,220,448 $12,216,160 $14,142,245 21% 49% 16% 108%as a % of SalesExports 30% 33% 31% 34%
xports NAICS 331, 332, 333, 336 $2,069,721 $2,678,237 $3,730,544 $4,743,092 29% 39% 27% 129%ports NAICS 331, 332, 333, 336 $1,245,512 $1,465,906 $2,059,890 $2,605,779 18% 41% 27% 109%ports as % of Total 60% 55% 55% 55%
data: Statistics Canada
Total EUS ExUS Ex
Source of

GTS Group International
16
3.5 Total Industry Exports Total industry exports have more than doubled between 2000 and 2006, from $2.1 billion to $4.7 billion. In 2006, exports amounted to 34% of total sales for the metal fabrication industry in Alberta. The US market accounted for 55% to 60% of exports, making it the dominant export market for this industry sector. While there is considerable variation in export dependency between the sub-sectors, overall it can be concluded that the industry is not particularly export dependent, but do depend to a considerable extent on the US market for its exports. 4. Industry Information from Interviews Some 50 firms located throughout the province were interviewed for this project. Firms were selected by the study’s project management team as generally representative of the Alberta metal fabrication industry. While the results of these interviews cannot be considered to be statistically significant, they nevertheless provide good insight into the industry in Alberta. 4.1 Industry Sectors Served by Alberta’s Metal Fabricating Industry The metal fabrication industry in Alberta serves a number of sectors. Table 4.1 provides information on the sectors served by companies interviewed for this report. Some 87% of respondents reported doing work in the conventional oil and gas sector. Geographically, firms doing work in oil and gas were located throughout all the regions in the province. Some 23% of the firms do work for the oil sands in northeastern Alberta. The firms working for oil sands were, with one exception, located from Red Deer and north, with the great majority located in the Greater Edmonton region. The one exception is a firm in southern Alberta doing oil sands work on a sub-contract basis. Thirteen percent of the firms reported doing work in the forestry, construction, and agriculture sectors. Construction included both industrial and residential. The firms doing work in the forestry sectors were located primarily in Edmonton, but also in northern Alberta. The firms doing work in the agricultural sector tended to be located outside of the Edmonton and Calgary metropolitan areas. Another 9% of the firms reported doing work in the petrochemical and mining sectors. The firms serving the petrochemical industry were located in Red Deer, Edmonton and in-between, which is where most of Alberta’s petrochemical complex is located. Firms serving the mining industry (primarily coal mining) were located in Edmonton, central and southwestern Alberta.
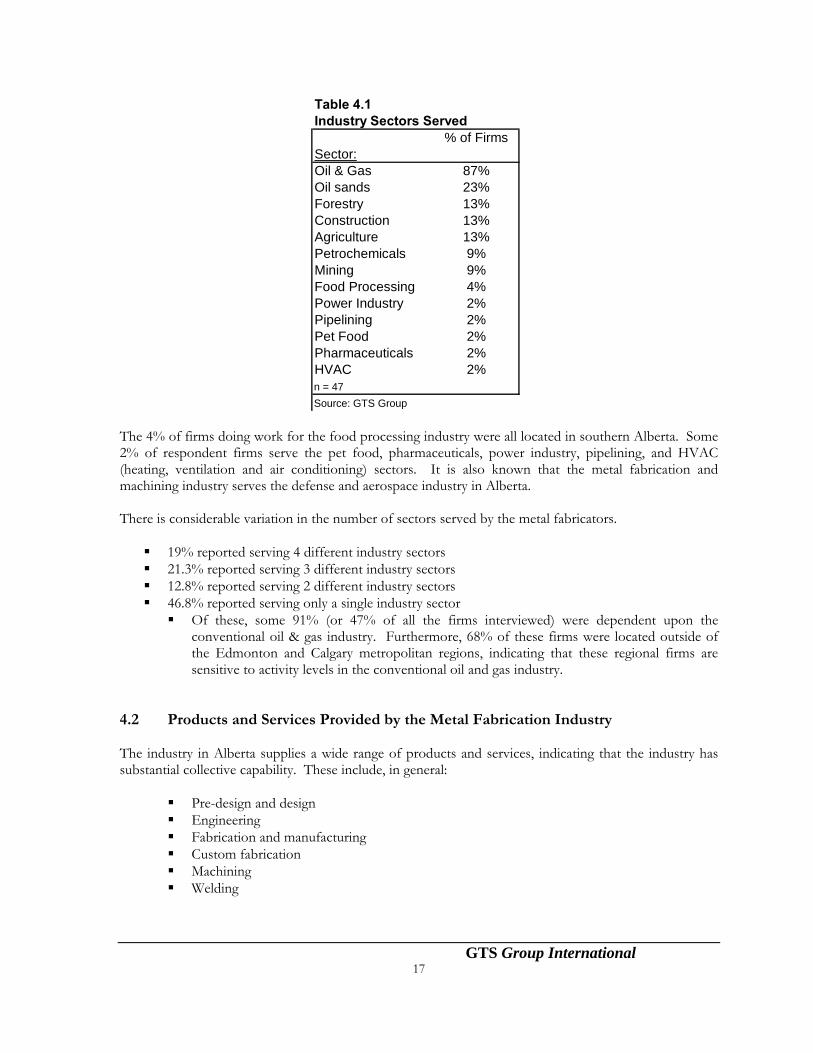
Table 4.1Industry Sectors Served
% of FirmsSector:Oil & Gas 87%Oil sands 23%Forestry 13%Construction 13%Agriculture 13%Petrochemicals 9%Mining 9%Food Processing 4%Power Industry 2%Pipelining 2%Pet Food 2%Pharmaceuticals 2%HVAC 2%n = 47Source: GTS Group
The 4% of firms doing work for the food processing industry were all located in southern Alberta. Some 2% of respondent firms serve the pet food, pharmaceuticals, power industry, pipelining, and HVAC (heating, ventilation and air conditioning) sectors. It is also known that the metal fabrication and machining industry serves the defense and aerospace industry in Alberta. There is considerable variation in the number of sectors served by the metal fabricators.
19% reported serving 4 different industry sectors 21.3% reported serving 3 different industry sectors 12.8% reported serving 2 different industry sectors 46.8% reported serving only a single industry sector
Of these, some 91% (or 47% of all the firms interviewed) were dependent upon the conventional oil & gas industry. Furthermore, 68% of these firms were located outside of the Edmonton and Calgary metropolitan regions, indicating that these regional firms are sensitive to activity levels in the conventional oil and gas industry.
4.2 Products and Services Provided by the Metal Fabrication Industry The industry in Alberta supplies a wide range of products and services, indicating that the industry has substantial collective capability. These include, in general:
Pre-design and design Engineering Fabrication and manufacturing Custom fabrication Machining Welding
GTS Group International 17

GTS Group International
18
Specific products and services identified included:
Turnkey screw piles Turbine rebuilds for hydro plants Water pumps and maintenance
thereof Vehicles and vans, Manufacture of mobile equipment
and tank trucks Manufacture of trucks for oil
services and well sites Wireline trucks and skids Equipment for oil sands plant
maintenance Plant maintenance Buildings for portable power plants Buildings in general Roll cages for logging equipment Components for cranes moving
logs Design, engineering, fabrication of
pressure vessels Custom spooling for pipelines and
petrochemicals Equipment for oil and gas in
general Hydraulic rams
Lime Boring Case hole products Grease injection Pressure testers Separation equipment Valves Wellsite equipment Wellhead equipment Well control and downhole
equipment Swabbing units Galvanized duct work Zed bars Prefinished flashing Structural steel Air cooled heat exchanger
assemblies Feed mixers Refurbishing of agricultural and
food processing equipment Processing systems and equipment Oil & gas processing equipment Drilling equipment Processing plants Global dehydration systems

GTS Group International
19
4.3 Capabilities and Areas of Expertise The companies reported a wide range of capabilities and areas of expertise. These included:
Design, drafting, engineering and manufacture 3D design Product development Custom and precision machining Welding, including pressure and specialized welding Cutting and forming Assembly Overlay tungsten carbide for buckets Fabrication of pressure vessels Equipment for transport of dangerous goods Screw piles Manufacturing and installing heating and ventilation systems Process design for oil/water separators Well control and wellhead equipment Air cooled heat exchanger assemblies Manufacturing of roller chain sprockets and specialty sprockets Break laser Shears Plasma burn table Packing modularized units
4.4 Geographical Markets Served The metal fabrication industry serves primarily local Alberta markets, and to a lesser extent markets in western Canada, the United States, and abroad. No detailed information was collected on the relative importance and/or share of various market areas. However, some general observations are possible:
The industry in Alberta is typically local in nature, to the extent that some companies only do business within the specific region of Alberta in which they are located
Where they do business in British Columbia, Saskatchewan and Manitoba, Alberta firms’ activities in those markets are likely tied mostly to Alberta companies in oil and gas, forestry, agriculture and mining with which they do business in Alberta
With regard to the US and international markets, these are likely served through Alberta prime contractors on a sub-contract basis, and overwhelmingly related to oil and gas
It can be concluded that the fabrication industry is substantially dependent upon the Alberta home market, and servicing of other geographic market areas is largely facilitated through Alberta companies with which they do business.
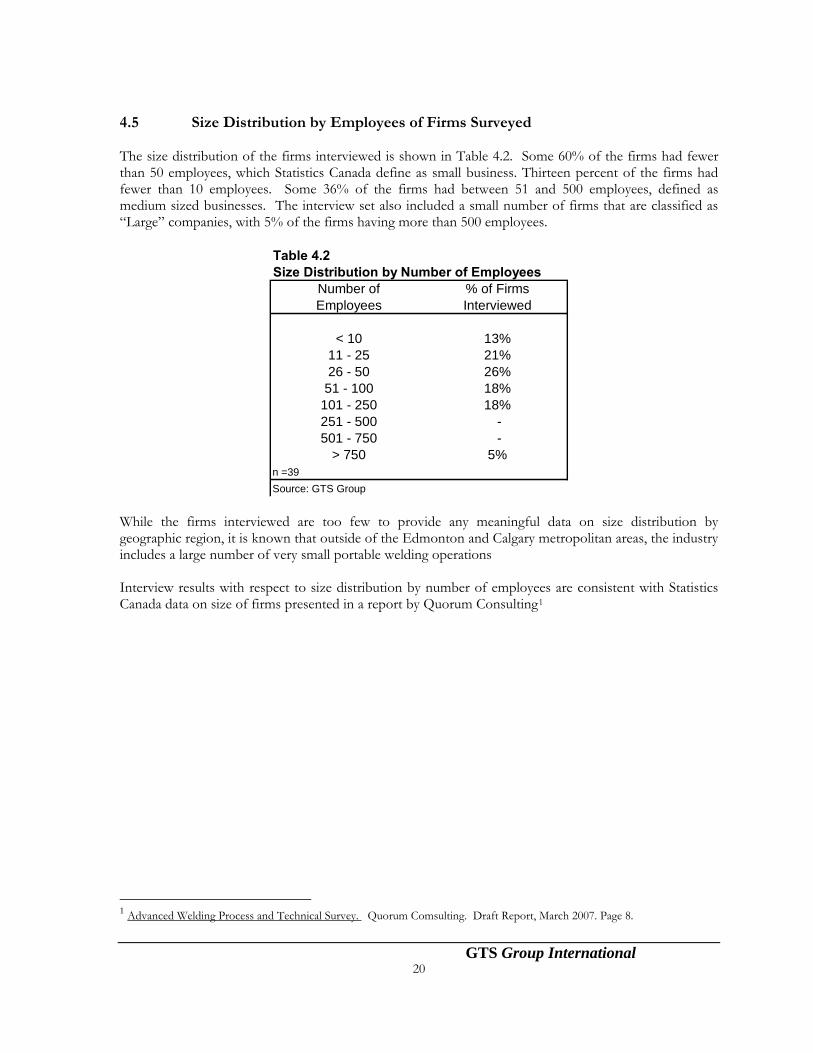
4.5 Size Distribution by Employees of Firms Surveyed The size distribution of the firms interviewed is shown in Table 4.2. Some 60% of the firms had fewer than 50 employees, which Statistics Canada define as small business. Thirteen percent of the firms had fewer than 10 employees. Some 36% of the firms had between 51 and 500 employees, defined as medium sized businesses. The interview set also included a small number of firms that are classified as “Large” companies, with 5% of the firms having more than 500 employees.
Table 4.2Size Distribution by Number of Employees
Number of % of FirmsEmployees Interviewed
< 10 13%11 - 25 21%26 - 50 26%51 - 100 18%
101 - 250 18%251 - 500 -501 - 750 -
> 750 5%n =39Source: GTS Group
While the firms interviewed are too few to provide any meaningful data on size distribution by geographic region, it is known that outside of the Edmonton and Calgary metropolitan areas, the industry includes a large number of very small portable welding operations Interview results with respect to size distribution by number of employees are consistent with Statistics Canada data on size of firms presented in a report by Quorum Consulting1
1 Advanced Welding Process and Technical Survey. Quorum Comsulting. Draft Report, March 2007. Page 8.
GTS Group International 20

GTS Group International
21
5. SWOT Analysis Firms interviewed were asked to provide their opinions on strengths, weaknesses, opportunities and threats, both for their individual firms and for the industry as a whole in Alberta. While most firms did identify their own situation, fewer firms provided an opinion on the industry as a whole or provided identical answers to those for their own firms. In the lists below, items are arranged in order from most frequently mentioned to least mentioned. 5.1 Strengths 5.1.1 Strengths of Individual Firms Strengths of individual firms were identified both in terms of business capabilities and in terms of specific products.
Diversity and flexibility was identified as strengths by 26% of respondents. This entails capability to produce a variety of products, and a flexibility in terms of manufacturing and meeting customers’ requirements
Design and Engineering was identified by 23% of respondents as corporate strengths People/Employees were identified as strengths by 17% of respondents Quality, in terms of products and workmanship was identified by 17% of respondents Fabrication and manufacturing was identified by 11% of respondents. This included pressure
vessels, large structural items, tanks and equipment, and screw piles Other company strengths mentioned included:
Possession of CNC pattern cutters, wet jets, laser and plasma Cutting and forming capabilities Pressure welding Stable work force Long term relationships with customers Product line variety Quick decision making ability Environmentally responsible people and solar powered separation equipment Corporate experience Short turn-around capability Leader in production of feed mixers CNC ISO 9001 certification
GTS Group International
22
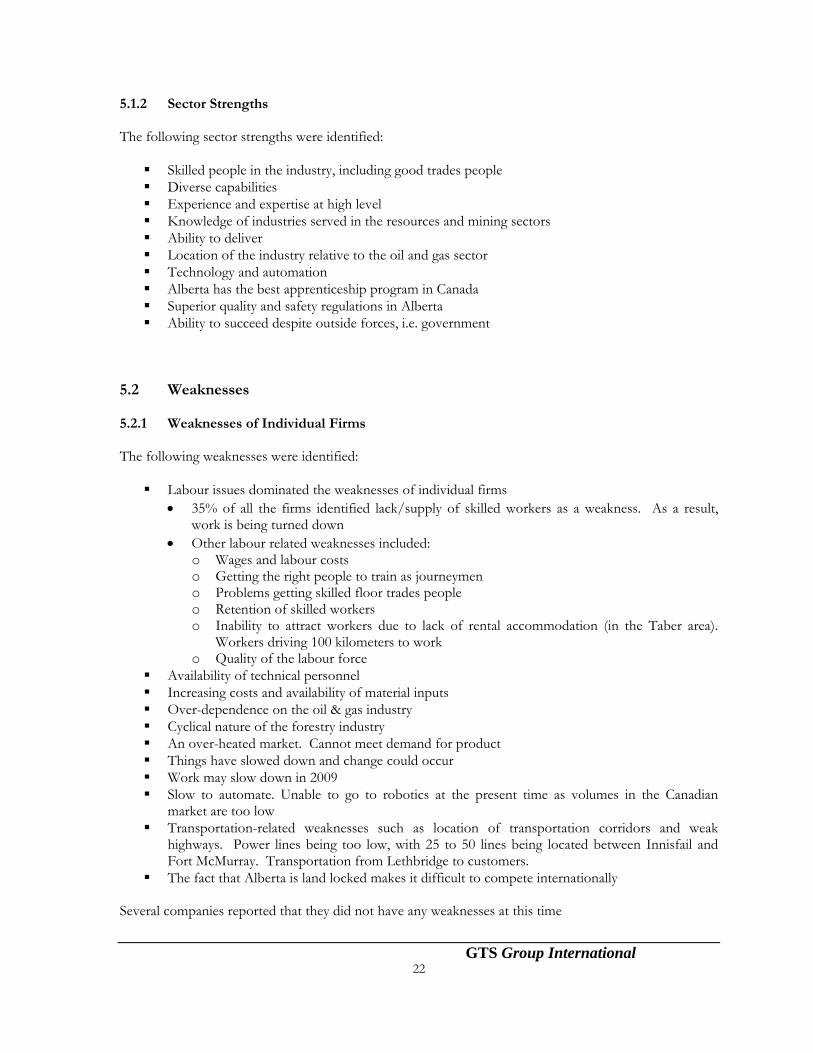
5.1.2 Sector Strengths The following sector strengths were identified:
Skilled people in the industry, including good trades people Diverse capabilities Experience and expertise at high level Knowledge of industries served in the resources and mining sectors Ability to deliver Location of the industry relative to the oil and gas sector Technology and automation Alberta has the best apprenticeship program in Canada Superior quality and safety regulations in Alberta Ability to succeed despite outside forces, i.e. government
5.2 Weaknesses 5.2.1 Weaknesses of Individual Firms The following weaknesses were identified:
Labour issues dominated the weaknesses of individual firms • 35% of all the firms identified lack/supply of skilled workers as a weakness. As a result,
work is being turned down • Other labour related weaknesses included:
o Wages and labour costs o Getting the right people to train as journeymen o Problems getting skilled floor trades people o Retention of skilled workers o Inability to attract workers due to lack of rental accommodation (in the Taber area).
Workers driving 100 kilometers to work o Quality of the labour force
Availability of technical personnel Increasing costs and availability of material inputs Over-dependence on the oil & gas industry Cyclical nature of the forestry industry An over-heated market. Cannot meet demand for product Things have slowed down and change could occur Work may slow down in 2009 Slow to automate. Unable to go to robotics at the present time as volumes in the Canadian
market are too low Transportation-related weaknesses such as location of transportation corridors and weak
highways. Power lines being too low, with 25 to 50 lines being located between Innisfail and Fort McMurray. Transportation from Lethbridge to customers.
The fact that Alberta is land locked makes it difficult to compete internationally Several companies reported that they did not have any weaknesses at this time

GTS Group International
23
5.2.2 Sector Weaknesses The following sector weaknesses were identified:
The overwhelming weakness for the sector is a shortage and retention of skilled workers Wages and labour costs, which are higher than for competitors located in Saskatchewan Lack of labour training programs Regarding apprenticeship programs, other provinces’ standards are lower than Alberta, which
can cause problems in productivity. Other provinces need to raise their levels. Alberta is the best, British Columbia the worst, Saskatchewan/Manitoba non-existent. There is no shortage of people - the shortage is of skilled, knowledgeable certificate people
Too many junior people involved in major projects. Engineers need more training No trade designation for fabricators Increasing costs and availability of material inputs Over-dependence on the oil and gas sector. Slow down in conventional oil and gas Weakening of the residential construction sector No diversification of the provincial economy over the past 4 years The slow down in the US economy and its effect on Canada
5.3 Opportunities 5.3.1 Opportunities for Individual firms The following opportunities were identified:
Oil sands projects, including new plants and projects, ongoing maintenance of existing plants, Peace River deposits, expansion of heavy oil in the St. Paul region, and oil sands recovery equipment
Conventional oil and gas industry. However, this is seen as royalty dependent. Things have slowed down and people have been laid off. Royalties and cancelled projects limit new opportunities
A strong Alberta economy will create opportunities Expected recovery in all sectors in 2009 will create new opportunities Local Alberta development in key sectors will create opportunities There are new and potential opportunities in the biodiesel sector, in upgraders, in nuclear plants,
and in a continued construction boom. The commercial and industrial sectors are seen as strong Companies see new opportunities in US markets (where they believe manufacturing is maxed
out) and in international markets due to oil prices There are new opportunities for companies in diversification, new product development and in
deployment of new technologies

GTS Group International
24
5.3.2 Sector Opportunities The following opportunities were identified for the sector as a whole:
Oil sands and upgraders Continued construction activity Continued good opportunities in Alberta for a number of years Opportunities in the US and in international markets Continued heavy involvement by industry in trades training Employment of immigration/temporary workers, who are excellent additions
5.4 Threats 5.4.1 Threats to Individual Firms The following threats were identified:
Lack/shortage of skilled labour. Need both journeymen and apprentices. It is suggested that for long term growth in Alberta, the Alberta apprenticeship branch needs to be in line with federal government immigration policies. Foreign workers can now only access short term programs, and apprenticeship is long term. Appropriate labour training is required
Trained personnel leaving for better jobs is a threat and continuous problem Design consultants that can’t design are being retained by construction owners to manage trades
people. They have no knowledge of trades people’s skills and knowledge and this slows down the process
Wages of skilled workers is a long term threat The rising Canadian dollar is a threat. Off-shore markets are being lost to Asian companies Increasing costs and availability of production inputs Increased competition in general from Asia Increased competition from out-of–province companies, including Ontario and the US Oil and gas sector slow down, believed to be due to increased royalties has resulted in cancelled
orders and lack of work for some The slump in the forest industry is a threat Changes in environmental regulations could be a threat if equipment design specifications are
changed as a result thereof High transport costs to the Port of Vancouver Oversized equipment having to be shipped out through Houston or Montreal due to snow sheds
on the Trans-Canada Highway A few companies did not see any threats to their operations at present

GTS Group International
25
5.4.2 Sector Threats The following threats were identified:
Lack of economic diversification in the province What to do when oil sands plants and upgraders are completed Competition from companies in other jurisdictions, particularly jurisdictions with weaker
regulations than Alberta. Price undercutting by such competitors Lack/shortage of skilled labour. Lack of training and workers not completing apprenticeship programs Wage escalations Volatility of oil markets and effects of increased royalties Oil and gas slowdown believed to be due to increased royalties Lack of long term commitments by oil companies Low productivity on oil sands projects High Canadian dollar High transportation costs
6. Conclusions
1. As put by one interviewee, "If it is metal, can be welded and/or machined, the Alberta Fabrication and Machining sector can make it." This sector has diverse, world class, design and engineering, machining and welding capabilities second to none.
2. Most raw materials and inputs are from outside Canada, so Alberta companies are dependent on
the world supply, and this supply is affected by increased economic activity in regions such as China, India and, Southeast Asia causing price increases and availability of metals.
3. Transportation costs are a major concern for Alberta companies in remaining competitive in the
United States and international markets. Efficient modes of transportation, including road and rail, are very important for the timely movement of goods, especially larger non-containerized types of products.
4. The fabrication sector is dependent on the continuing supply of skilled workers, preferably from
local sources, in order to maintain the level of productivity and quality of finished goods. The industry is dependent upon Alberta’s apprenticeship programs and the high quality of these programs.
5. Exports are mainly to the United States, therefore any slow down in the American economy has
a major effect on Alberta companies. 6. The fabrication sector is mainly focused on the oil and gas activity in Alberta, so any reduction in
activity, such as during the fall of 2007 and the first quarter of 2008, has a major negative impact on the companies in our province.
GTS Group International
26
7. Recommendations
There is a need for consultation and cooperation between metal fabrication sector companies, government, professional associations and related organizations to identify and develop:
⇒ sources for skilled workers in order to alleviate labour shortages. ⇒ productivity, innovation and technology advancements that can be used to expand and
increase company competitiveness. ⇒ strategies to increase worker training and upgrading skills in order to assist in improving
productivity.
⇒ areas for cost reductions, such as supply sourcing, transportation costs, energy efficiency, employee productivity, etc.
⇒ effective strategies for market entry into the expanding oil sands construction and
maintenance markets
⇒ new market and export opportunities and product development, such as aerospace, defence and military, alternate energy equipment, etc...
⇒ opportunities to play a role in the facilitation and consultation between major project contractors and metal fabricators to improve design and engineering specifications in order to increase productivity, and delivery times.