Music and Historical Consciousness among the - John M. Chernoff
Upload
nguyenmienCategory
view
217download
0
Prepared for: Biodiversity Management and Climate Change Adaptation Project
Downscaling Climate Data for Climate Change Adaptation Action Planning in Alberta September 2013 Prepared by Greg Chernoff
This report was produced as part of the Biodiversity Management and Climate Change Adaptation Project. This project is led by the Alberta Biodiversity Monitoring Institute, with collaborators from the University of Alberta and the Miistakis Institute. The project receives its core funding from the Climate Change and Emissions Management (CCEMC) Corporation.
Disclaimer The material in this publication does not imply the expression of any opinion on the part of any individual or organization other than the authors. Errors, omissions or inconsistencies in this publication are the sole responsibilities of the authors. The authors and ABMI assume no liability in connection with the information products or services made available by the institute. While every effort is made to ensure the information contained in these products and services is correct, the ABMI disclaims any liability in negligence or otherwise for any loss or damage which may occur as a result of reliance on this material. CCEMC makes no warranty, express or implied, nor assume any legal liability or responsibility for the accuracy, completeness, or usefulness of any information contained in this publication, nor that use thereof does not infringe on privately owned rights. The views and opinions of the author expressed herein do not necessarily reflect those of CCEMC. The directors, officers, employees, agents and consultants of CCEMC are exempted, excluded and absolved from all liability for damage or injury, howsoever caused, to any person in connection with or arising out of the use by that person for any purpose of this publication or its contents. Use of this material: This publication may be reproduced in whole or in part and in any form for educational, data collection or non-profit purposes without special permission from the authors or ABMI, provided acknowledgement of the source is made. No use of this publication may be made for resale without prior permission in writing from the ABMI. Corresponding author: Alberta Biodiversity Monitoring Institute Guy Greenaway CW-405 Biological Sciences Miistakis Institute University of Alberta
Edmonton, Alberta, Canada T6G 2E9 Phone: (403) Phone: (780) 492-6322 E-mail: [email protected]

Downscaling Climate Data for Climate Change Adaptation Action Planning in Alberta 1
Abstract As part of the ABMI-led Biodiversity Management and Climate Change Adaptation project, Miistakis is developing a community decision support toolkit that will help communities identify climate change adaptation (CCA) action planning strategies that will satisfy their goals while maintaining the benefits of biodiversity-related ecosystem services. Meaningful downscaling and representation of climate data is a key component of the CCA action planning process. Here we provide an overview of the goals of downscaling climate data for climate change action planning processes and review examples of current approaches to support our next step: development of a visualization toolkit that will support the CCA planning needs of Alberta municipalities. Downscaling climate data is the process of interpreting the outputs of Global Climate or Global Circulation Models (GCMs) at finer spatial scales, typically one square kilometre. While this spatial downscaling can provide useful and meaningful information for CCA action planning, it cannot necessarily convey the potential localized climatic changes and specific impacts of those changes for a community. A complementary approach to communicating climate data for use in the action planning process is “narrative downscaling”, wherein broader-scale climate data is interpreted in a local, but not necessarily spatial, context to emphasize the potential consequences of climate change for a community. Examples of narrative downscaling can include graphs, charts, and tables of select climatic, environmental, social or economic variables, but also non-traditional media such as graphic representations of local landscapes over time or stories told by community members. We review examples of techniques for downscaling climate data for CCA action planning, including examples of both spatial and narrative downscaling. While this review is not comprehensive, these examples provide a useful starting point for the development of climate change representations for Alberta municipalities.
Downscaling Climate Data for Climate Change Adaptation Action Planning in Alberta 2
Table of Contents
!
Abstract . . . . . . . . . . . . . . . . . . . . . . . . . . . . . . . . . . . . . . . . . . . . . . . . . . . . . . . . . . . . . . . . . . . . . . . . . . . . . . . . . . . . . . . . . . . . . . . . . . . . . . . . . . . . . . . . . . . . . . . . . . . . . . . . . . . . . . . . . . . . . . . . . . . . . 1
Table of Contents . . . . . . . . . . . . . . . . . . . . . . . . . . . . . . . . . . . . . . . . . . . . . . . . . . . . . . . . . . . . . . . . . . . . . . . . . . . . . . . . . . . . . . . . . . . . . . . . . . . . . . . . . . . . . . . . . . . . . . . . . . . . . . . . . . . . . . . 2
PROJECT BACKGROUND . . . . . . . . . . . . . . . . . . . . . . . . . . . . . . . . . . . . . . . . . . . . . . . . . . . . . . . . . . . . . . . . . . . . . . . . . . . . . . . . . . . . . . . . . . . . . . . . . 3
‘Biodiversity and Cl imate Change Adaptat ion’ project overview . . . . . . . . . . . . . . . . . . . . . . . . . . . . . . . . . . . . . . . . . . . . . . . . . . . . . . . . . . . . . . . . 3
‘Local Adaptat ions’ sub-project overview . . . . . . . . . . . . . . . . . . . . . . . . . . . . . . . . . . . . . . . . . . . . . . . . . . . . . . . . . . . . . . . . . . . . . . . . . . . . . . . . . . . . . . . . . . . . . . . . . . 3
INTRODUCTION . . . . . . . . . . . . . . . . . . . . . . . . . . . . . . . . . . . . . . . . . . . . . . . . . . . . . . . . . . . . . . . . . . . . . . . . . . . . . . . . . . . . . . . . . . . . . . . . . . . . . . . . . . . . . . . 4
WHAT IS DOWNSCALING? . . . . . . . . . . . . . . . . . . . . . . . . . . . . . . . . . . . . . . . . . . . . . . . . . . . . . . . . . . . . . . . . . . . . . . . . . . . . . . . . . . . . . . . . . . . . . . 5
The Limits of “Spatial Downscal ing” . . . . . . . . . . . . . . . . . . . . . . . . . . . . . . . . . . . . . . . . . . . . . . . . . . . . . . . . . . . . . . . . . . . . . . . . . . . . . . . . . . . . . . . . . . . . . . . . . . . . . . . . . . 7
The Need for “Narrat ive Downscal ing” . . . . . . . . . . . . . . . . . . . . . . . . . . . . . . . . . . . . . . . . . . . . . . . . . . . . . . . . . . . . . . . . . . . . . . . . . . . . . . . . . . . . . . . . . . . . . . . . . . . . . . 7
REPRESENTING CLIMATE DATA FOR LOCAL ADAPTATION . . . . . . . . . . . . . . . . . . . . . . . . . . . . . . . . . . . . . . . . . . . . . . 8
Making the Best Use of Project Resources . . . . . . . . . . . . . . . . . . . . . . . . . . . . . . . . . . . . . . . . . . . . . . . . . . . . . . . . . . . . . . . . . . . . . . . . . . . . . . . . . . . . . . . . . . . . . . . . 9
Downscal ing in Exist ing and planned Alberta Adaptat ion Processes . . . . . . . . . . . . . . . . . . . . . . . . . . . . . . . . . . . . . . . . . . . . . . . . . . . . . . . . . 9 ICLEI ................................................................................................................................................................................................................. 9 C3 .................................................................................................................................................................................................................... 10
Examples of Meaningful Downscal ing . . . . . . . . . . . . . . . . . . . . . . . . . . . . . . . . . . . . . . . . . . . . . . . . . . . . . . . . . . . . . . . . . . . . . . . . . . . . . . . . . . . . . . . . . . . . . . . . . . . . . . 11 ClimateWise/GEOS Mapping ..................................................................................................................................................................... 11 PCIC Plan2Adapt Tool ................................................................................................................................................................................. 12 CBT Adaptation Discovery Tool ................................................................................................................................................................ 13 Climate Wisconsin ....................................................................................................................................................................................... 14
NEXT STEPS WITH DOWNSCALING . . . . . . . . . . . . . . . . . . . . . . . . . . . . . . . . . . . . . . . . . . . . . . . . . . . . . . . . . . . . . . . . . . . . . . . . . . . . . . . 15
REFERENCES . . . . . . . . . . . . . . . . . . . . . . . . . . . . . . . . . . . . . . . . . . . . . . . . . . . . . . . . . . . . . . . . . . . . . . . . . . . . . . . . . . . . . . . . . . . . . . . . . . . . . . . . . . . . . . . . . 16
APPENDIX 1 - LIST OF CLIMATE-RELATED VARIABLES . . . . . . . . . . . . . . . . . . . . . . . . . . . . . . . . . . . . . . . . . . . . . . . . . 17

Downscaling Climate Data for Climate Change Adaptation Action Planning in Alberta 3
PROJECT BACKGROUND
‘Biodiversity and Climate Change Adaptation’ project overview The Biodiversity and Climate Change Adaptation Project was conceived by the Alberta Biodiversity Monitoring Institute (ABMI) in response to the need to define the scope of change required to effectively manage biodiversity under a changing climatic regime, and to support Alberta’s biodiversity management system with essential knowledge and tools for successful adaptation to a changing future climate. The rationale for this initiative rests on the importance of biodiversity to Albertans, and the complex relationship between climate and biodiversity. Biodiversity, which includes species and their ecosystems, supports the delivery of numerous ecosystem services. These include provisioning services (e.g., food, fibre, fuel, water), regulating services (e.g. water and air filtration, flood regulation), cultural services (e.g., nature recreation, wildlife viewing) and supporting services such as soil formation and wildlife habitat. Because these biodiversity related services are impacted by a changing climate, and because the relationship between climate and biodiversity is uncertain, knowledge gaps constrain effective adaptation. Proactive investments in the knowledge and tools for effective biodiversity management under a changing climate regime will deliver significant benefits to people and avoid crisis-driven interventions that are by their nature reactive, costly and often ineffective. The goal of the Biodiversity Management and Climate Change Adaptation project is to develop essential knowledge and tools to support the management of Alberta’s biodiversity and promote successful adaptation to a changing climate. The project is comprised of four objectives: 1. Predicting the impacts of climate change on Alberta’s native species and ecosystems 2. Predicting invasive species responses to climate change 3. Assessing strategies to support climate sensitive species-at-risk 4. Developing and evaluating adaptation policy and tools to manage biodiversity in a changing climate The Local adaptations for biodiversity-related ecosystem services sub-project (concisely, the Local
Adaptations sub-project) lead by the Miistakis Institute directly supports objective 4.
‘Local Adaptations’ sub-project overview As the climate changes, Alberta’s communities will be required to make decisions that encourage adaptation to the new climate conditions. To make appropriate decisions, communities will need to understand how the ecosystem services on which they rely might be affected by climate change, and
Downscaling Climate Data for Climate Change Adaptation Action Planning in Alberta 4
what are their potential adaptation strategies. Alberta currently lacks a framework for local governments to address climate change; filling this gap will enable communities to plot a path forward. The first step in enabling local community adaptation to climate change is the development of community-based Climate Change Adaptation (CCA) Action Plans. To this end, Miistakis is developing a community decision support toolkit that will help communities identify climate change adaptation strategies that satisfy their goals while maintaining the benefits of biodiversity-related ecosystem services. This toolkit is envisioned to support Alberta-based climate change adaptation (CCA) action planning processes with spatially-explicit tools which allow local managers to visualize the impact a changing climate has on their community’s economy, infrastructure, and natural systems. The central challenge of this sub-project is to connect the vast realm of biodiversity and climate change data to the everyday world of a local community decision-maker. The approach is intended to be pragmatic, seeking a rigorous method while recognizing limits in relevant data and the needs of affected communities, thus ensuring that databases and information are accessible to local decision makers. Several key concepts will determine the ultimate form and content of this decision-support toolkit:
• The specific needs (i.e., gaps) in Alberta with regard to embracing climate change adaptation (CCA) action plans;
• The identity of the partner community(ies) and their decision-making needs, realizing that the ultimate product will be somewhat specific to the community(ies) chosen (i.e., a proof-of-concept approach);
• The knowledge base (data) required; ecosystem services may be the best way to connect biodiversity and local decision making, but no ecosystem services-specific spatial data currently exist in Alberta;
• The interface between the climate change adaptation (CCA) action plan and the supporting visualization tools (GIS-reliant or otherwise); and
• The value of web delivering tools and products to the greatest degree possible.
INTRODUCTION In the Miistakis Institute report, “Climate Change Adaptation Action Plans - Alberta Process Review” (Sanderson, 2013), meaningful downscaling and representation of climate data is identified as a key component in the “Information” phase of a generic climate change adaptation planning process representative of ongoing, planned, and possible future processes within Alberta. Aspects of the “Planning” and “Implementation” phases of this generic process would also likely benefit from the availability and thoughtful representation of downscaled climate data. Miistakis has committed in the Local Adaptations sub-project to “explore the process of downscaling climate data, … and determine what, if anything can be done to make this more efficient for both processes and communities in Alberta.” (Sanderson, 2013, p.13)
Downscaling Climate Data for Climate Change Adaptation Action Planning in Alberta 5
The purpose of this report is: ● to explain our interpretation of downscaling in the context of the Local Adaptations sub-
project; ● to discuss some considerations - valuable resources, useful examples, etc. - for
representing downscaled climate data in support of local adaptation efforts; and ● to consider potential next steps for Miistakis in representing climate data in a locally
meaningful context.
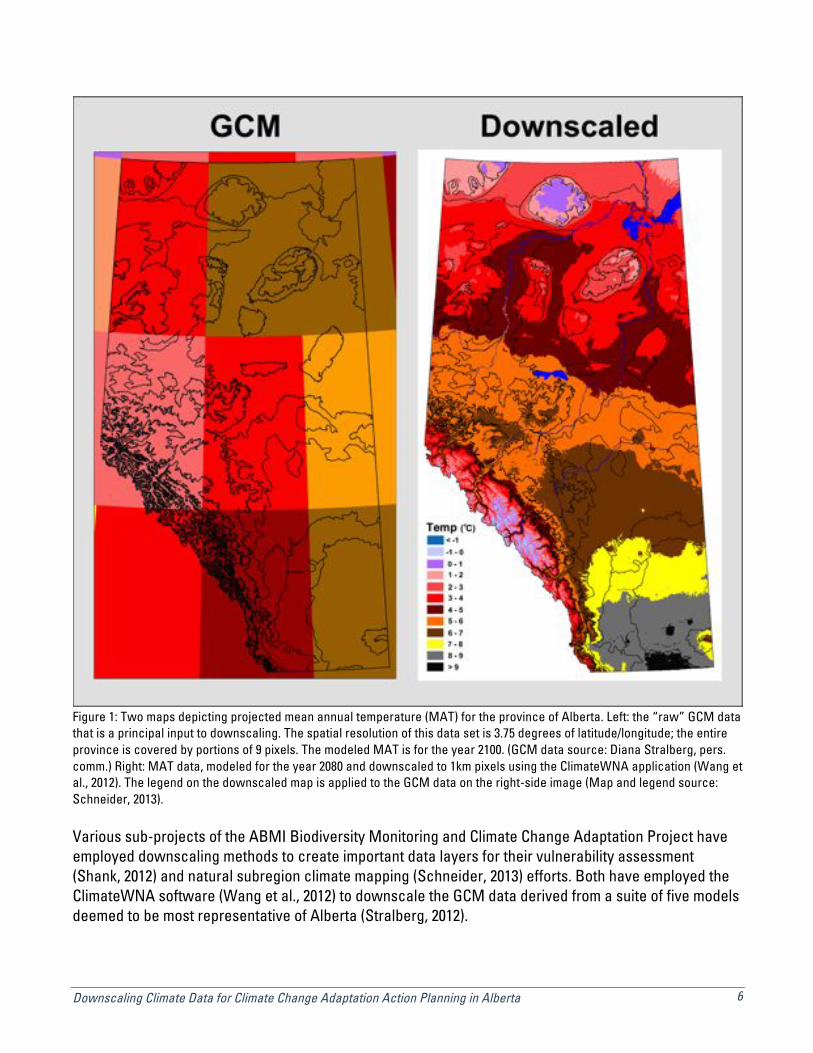
WHAT IS DOWNSCALING? Downscaling is the interpretation of the outputs of Global Climate or Global Circulation Models (GCMs) at finer scales than the original data. In many cases, downscaling takes the form of a spatially explicit interpolation of GCM data, commonly at the resolution of tens or hundreds of kilometres, down to scales and resolutions that are more meaningful at a local or regional level. This type of downscaling relies on locally-recorded historic climate data, topography, and other inputs to convert global-scale data to much more detailed interpretations of GCM outputs. Figure 1 illustrates the process of downscaling from GCM data to 1-kilometre pixels (Schneider, 2013). The outputs of downscaling processes can be used to infer numerous climate-related variables, including:
● Minimum, Maximum, and Average Temperatures (monthly, annually) ● Specific Humidity ● Incident Solar Radiation ● Fractional Cloud Cover ● Derived Soil Moisture ● Mean Sea Level Pressure ● Relative Humidity ● Surface Temperature ● Soil Moisture Content (Climate Moisture Index (CMI), etc.) ● Snow Depth ● Snow Melt ● Degree-Days Above or Below Specific Temperatures (Growing Degree-Days (GDD), etc.) ● Number of Frost-Free Days ● Snowfall
A list of specific climate-related metrics that can be derived from downscaled data is included in Appendix 1 (source: Sanderson, 2013).
Downscaling Climate Data for Climate Change Adaptation Action Planning in Alberta 6
Figure 1: Two maps depicting projected mean annual temperature (MAT) for the province of Alberta. Left: the “raw” GCM data that is a principal input to downscaling. The spatial resolution of this data set is 3.75 degrees of latitude/longitude; the entire province is covered by portions of 9 pixels. The modeled MAT is for the year 2100. (GCM data source: Diana Stralberg, pers. comm.) Right: MAT data, modeled for the year 2080 and downscaled to 1km pixels using the ClimateWNA application (Wang et al., 2012). The legend on the downscaled map is applied to the GCM data on the right-side image (Map and legend source: Schneider, 2013). Various sub-projects of the ABMI Biodiversity Monitoring and Climate Change Adaptation Project have employed downscaling methods to create important data layers for their vulnerability assessment (Shank, 2012) and natural subregion climate mapping (Schneider, 2013) efforts. Both have employed the ClimateWNA software (Wang et al., 2012) to downscale the GCM data derived from a suite of five models deemed to be most representative of Alberta (Stralberg, 2012).
Downscaling Climate Data for Climate Change Adaptation Action Planning in Alberta 7
The Limits of “Spatial Downscaling” The spatially explicit type of downscaling described above - which we will term “spatial downscaling” - has limits to its applicability and utility when considering the generic climate change adaptation process, and the tools we can build to support adaptation and resilience in a local context. Specifically: spatial downscaling is only appropriate or useful up to a limit of spatial resolution. Any spatial downscaling process is constrained by the quality of available data on which the spatial downscaling model relies. In the case of the ABMI BMCCA project, the favoured ClimateWNA model requires both weather station data and topographic/elevation data derived from a digital elevation model (DEM). Topographic data may not impose a significant limitation, but the limits of reliable spatial downscaling may be impacted by the spatial distribution of weather stations within Alberta (Wang et al., 2012). These limits have not been exceeded by the efforts of other sub-projects, but they likely would be if one were to attempt a higher resolution of spatial downscaling than the current benchmark of one square kilometre. This gives rise to an important question: How much spatial downscaling is appropriate, useful, or required? Let us assume for a moment that none of the technical constraints to spatial downscaling - density of weather stations, resolution of DEM, computer processing power, etc. - are constraints to the extent we can scale climate data down. From a purely technical perspective, we have the ability to downscale, for example, to sub-metre pixel resolution. Should we? Emphatically, the answer is “No.” Downscaling to too fine a resolution would create serious problems for local communities seeking useful information to help them understand issues related to climate change, adaptation and resilience. The risk would increase of overstating the accuracy or predictive power of spatially downscaled data, or of the GCMs from which they were derived. Moreover, higher-resolution downscaling gives individuals the opportunity to examine climate data at the level of an individual parcel of land, increasing the chances that a model output will not match a site-specific observation, supporting the position of skeptics or deniers of climate change and threatening the credibility of the whole process. Our societal tendency - likely based on real limitations that have only recently been removed - is to go by default to the limits of our technical capacity to conduct analyses and generate high-resolution data. Now that the constraints imposed by processing power and data resolution are less significant, we need to re-examine the appropriate level of analyses, now governed more by need, pragmatism, and common sense.
The Need for “Narrative Downscaling” Although it is impractical and inappropriate to spatially downscale climate data to a site-specific level, climate adaptation and resilience action plans rely on an understanding of the local, community-specific portents of a changing climate. Local communities need information and tools that will help them better understand the environmental changes and localize impacts that a changing climate is expected to bring. This information needs to be conveyed in a way that is useful and meaningful to laypeople and decision-

Downscaling Climate Data for Climate Change Adaptation Action Planning in Alberta 8
makers, and that leads to action in support of adaptation and resilience. So how do we bridge the gap between what we can responsibly and appropriately generate through spatial downscaling, and what is needed to inform localized or site-specific decisions? To meet this need, Miistakis proposes to employ a different method of downscaling, or of interpreting broader-scale climate data in a local context. We refer to this general approach as “narrative downscaling” - the term encompasses any efforts that can be considered to be downscaling, but which are not spatially explicit, and which do not produce spatial data layers as outputs. The objective of narrative downscaling is to bring the knowledge and concepts of climate change and adaptation home to local communities; to bridge the gap between regional data and local concerns; in short, to make climate change matter locally. Narrative downscaling can take a number of different forms, many of which will be discussed in greater detail through the examples provided below. These include graphs, charts and tables; graphic representations of local landscapes; animations; interactive graphic applications; or stories told by members of the community. Through appropriate use of both narrative and spatial downscaling, we strive to build tools that will give the user a meaningful impression of the type of changes that will occur in the local landscape.
REPRESENTING CLIMATE DATA FOR LOCAL ADAPTATION The second year of the Local Adaptations sub-project has three principal objectives:
1. Identify future climate conditions and resulting changes to landscape and ecology within the Grasslands natural regions of Alberta;
2. Identify the implications of climate change in terms of impacts on local economy, culture, and infrastructure; and
3. Develop draft decision support tools that are spatial, interactive, and web-based, which will serve as valuable augmentations to existing or pending climate change adaptation action planning processes, and will serve as proof-of-concept and demonstrate the value of such decision support tools.
Success in each of these three objectives is underpinned by the necessity for meaningfully downscaled climate data. This section outlines, in as much detail as presently possible, how Miistakis intends to downscale and represent climate data in support of local climate adaptation processes and strategies. It highlights some key opportunities to make the best use of BMCCA project work that is already completed, summarizes what we’ve learned from discussion with leaders of ongoing climate adaptation processes in Alberta, provides some relevant examples of how adaptation efforts in other jurisdictions have achieved meaningful downscaling, and finally, underscores some opportunities to build new functionality into this critical step in the adaptation process.

Downscaling Climate Data for Climate Change Adaptation Action Planning in Alberta 9
Making the Best Use of Project Resources The Local-Adaptations sub-project - and specifically our efforts to meaningfully represent downscaled climate data to local communities - will draw heavily upon the work that has been done by other BMCCA sub-projects. Diana Stralberg has coordinated efforts to evaluate a select a comprehensive suite of five complementary Global Circulation Models (GCMs) to use in Alberta, and the ECHAM5/MPI-OM (Germany) model as being most representative of Alberta (Stralberg, 2012). These GCM’s have been used as inputs in subsequent modeling efforts within the BMCCA project, including Chris Shank’s biodiversity vulnerability assessment (Shank, 2012) and Rick Schneider’s work describing anticipated changes to Alberta’s natural subregions under a changing climate (Schneider, 2013). Both of these sub-projects employed similar methodologies and the ClimateWNA software (Wang et al., 2012) to downscale climate data to regional and provincial scales. In particular, we anticipate that Rick Schneider’s work, and data that has been downscaled to 1km pixel resolution, will be a tremendous asset and a useful starting point in Miistakis’ efforts to represent the impacts of climate change in a locally meaningful way. As noted above, there is an abundance of information that comes out of a spatially downscaled climate model. These can in turn be used as inputs to model landscape changes, species responses, frequency of severe weather events, susceptibility of infrastructure, changing viability of agriculture or other resource-based economies, and so on. Our goal with the Local Adaptations sub-project is not to build visualization tools or other narrative downscaling to depict all of these changes, but to focus on those changes that matter most to the stakeholders and communities we engage; that resonate the strongest with local communities and inspire adaptive action. Ongoing Local Adaptations sub-project work seeks to identify locally significant impacts of anticipated climate change, and to link these impacts to biodiversity and ecosystem services. Only after this work is completed will we start to understand the essential linkages between Local Adaptations and other BMCCA sub-projects, such as the vulnerability assessments mentioned above and the planned and completed work on species’ response to climate change (e.g. Fisher & Bayne, 2012).
Downscaling in Existing and planned Alberta Adaptation Processes A recent Miistakis Report reviews three climate adaptation action planning processes that have either current or planned projects in Alberta (Sanderson, 2013). Part of this review was an examination of the approach to downscaling in two of the three processes; the following is a summary of these findings.
ICLEI
ICLEI provides a “Climate Data Report” for the communities during the planning process. Report data is compiled from a number of sources. This report provides basic climate trend information specific to their region including precipitation, temperature, lake levels, storm surge, and extreme weather events. The contents vary by region and attempt to paint a plan language picture of climate change projections for
Downscaling Climate Data for Climate Change Adaptation Action Planning in Alberta 10
2020, 2050 and 2080. If a community has specific needs beyond what is covered by the general Climate Data Report, then ICLEI will work with the community to create the needed information. Some sources of climate data used by ICLEI include:
● Climate Adaptation and Impacts Research (http://www.ec.gc.ca/sc-cs/default.asp?lang=En&n=9AF9494E-1) ● Institute of Catastrophic Loss (http://www.iclr.org/) ● Health Canada – Heat Risk Vulnerability (http://www.hc-sc.gc.ca/ewh-
semt/pubs/climat/heat-chaleur/index-eng.php) ● Adapting to Climate Change: A Risk-based Guide for Alberta Municipalities ( ● http://blackshieldps.com/wp-content/uploads/2009/01/Risk-based-Adaptation-Guide-for-
AB-Distribution-Draft-July-6-09.pdf) ● Climate Change Adaptation and Extreme Weather (http://act-adapt.org/extreme-weather/) ● ORANOS Consortium on Regional Climatology and Adaptation to Climate Change
(http://www.ouranos.ca/en/)
C3
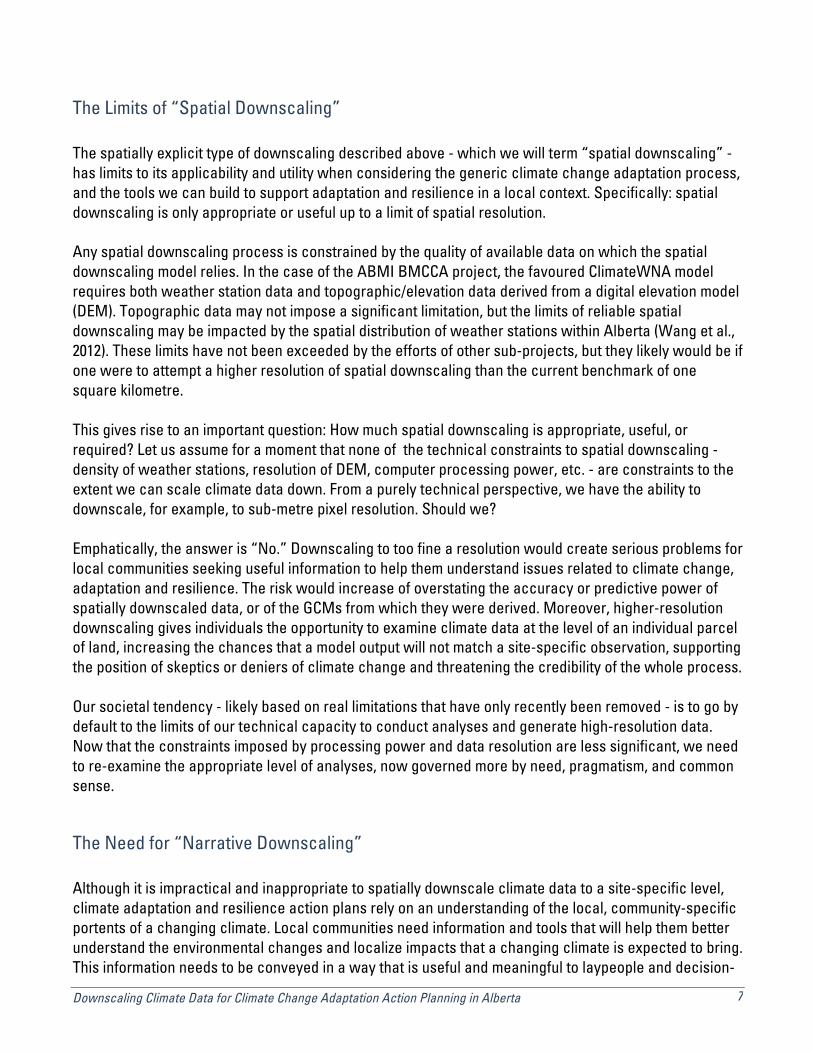
The climate change adaptation action planning process used by C3 (formerly Climate Change Central) will rely heavily on the Columbia Basin Trust (CBT) process developed in British Columbia. However, the approach to downscaling climate data may be substantially different. In the case of CBT process, downscaling climate data was completed in partnership with the Pacific Climate Impacts Consortium (PCIC) (http://www.pacificclimate.org). The climate information and impacts are explained to the local community in a way people can relate to, making it meaningful to the community (see Figure 2). The PCIC downscaling method also employs the ClimateWNA software (Wang et al., 2012) used in BMCCA sub-projects. Though much depends on available funding, C3 does not currently have plans to do any downscaling of climate data in Alberta. Jeff Zukiwsky, a consultant who is working with C3 to develop their adaptation planning process, wrote: “It is our opinion that for the type of adaptation planning we envision, an understanding of regional
trends is accurate enough to project potential future impacts. E.g. you could downscale climate data to a
specific location and determine that temperature is projected to change by 2.5C, rather than 2.3C. But, I
don’t think small changes like that have an effect on the outcome of a CCA strategic planning process.” (personal communication; source: Sanderson, 2013) This suggests that the downscaling efforts that have already been undertaken for Rick Schneider’s natural subregions report might well be sufficient to the spatial downscaling needs of the Local Adaptations sub-project.
Downscaling Climate Data for Climate Change Adaptation Action Planning in Alberta 11
Figure 2: An example of the display of downscaled data that PCIC provides to CBT for CCA action planning processes in British Columbia. The map series depicts mean winter temperature for two time periods: historically (1961-1990); and in the future (2041-2070) based on a regionally downscaled climate model. Source: Murdock & Werner, 2011.
Examples of Meaningful Downscaling The following are some good examples of various ways that climate change and climate data have been downscaled and represented. In every example, the emphasis is on making climate change science easy to understand, and in making the impacts of a changing climate resonate within local communities. The examples span the current range of approaches to downscaling, from strictly spatial to strictly narrative.
CLIMATEWISE/GEOS MAPPING
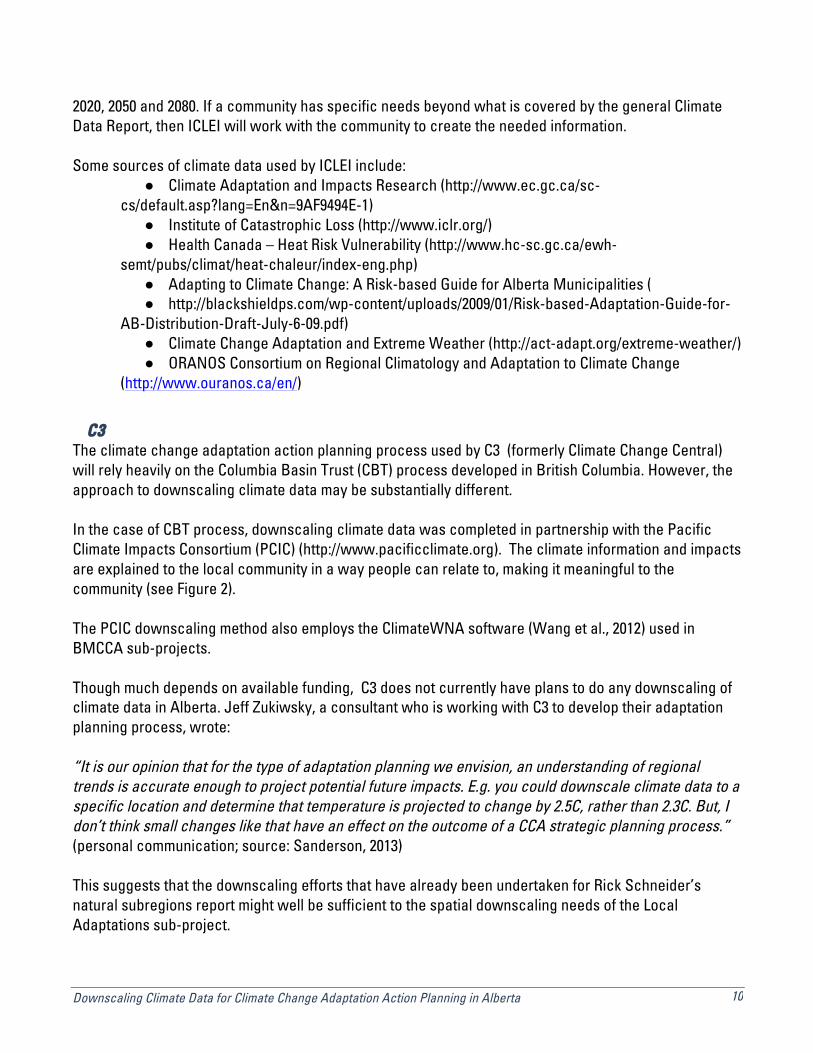
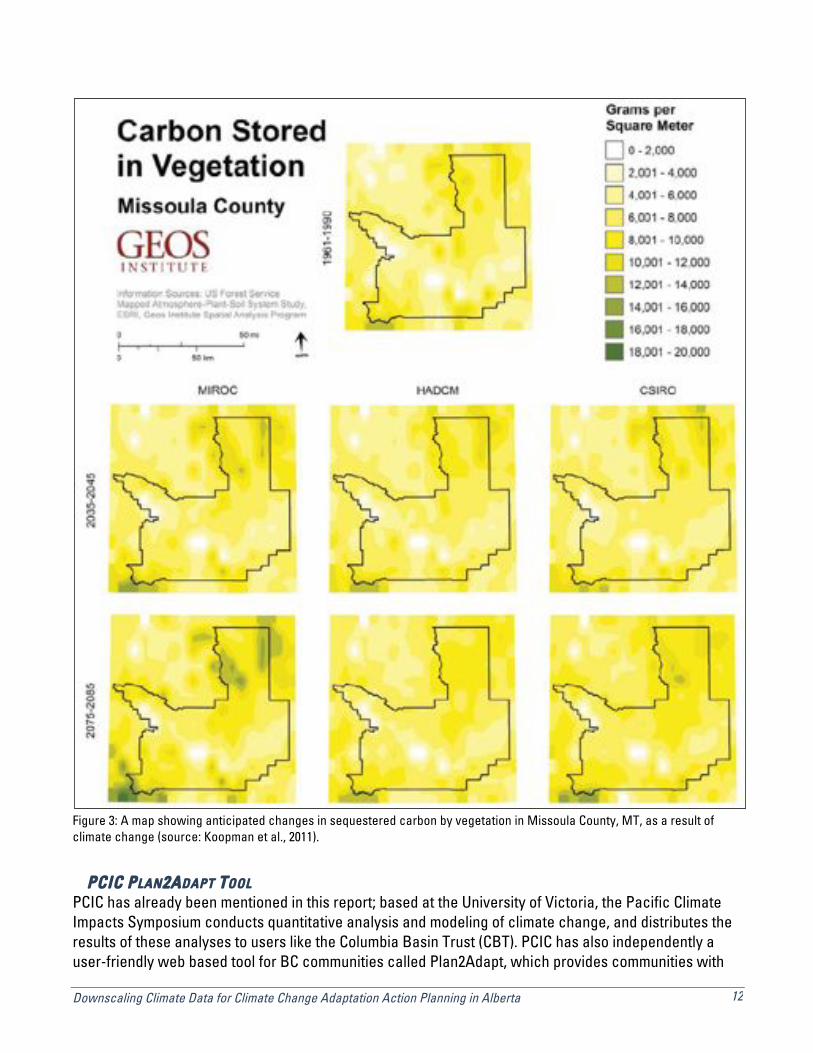
As part of the ClimateWise Climate Change Adaptation Action Planning process for Missoula County, Montana, the GEOS Institute modeled and mapped future climate conditions, and compiled the results in report format (Koopman et al., 2011). Downscaling was performed using a less sophisticated method than the ClimateWNA approach, relying only on historical information from weather stations and GCM data as inputs (i.e. omitting consideration of topography). The output data was downscaled to a pixel resolution of 8km. The report pairs maps (see figure 3) with a narrative description of the impacts to local ecology, economy, and culture foretold by the anticipated climate change.
Downscaling Climate Data for Climate Change Adaptation Action Planning in Alberta 12
Figure 3: A map showing anticipated changes in sequestered carbon by vegetation in Missoula County, MT, as a result of climate change (source: Koopman et al., 2011).
PCIC PLAN2ADAPT TOOL
PCIC has already been mentioned in this report; based at the University of Victoria, the Pacific Climate Impacts Symposium conducts quantitative analysis and modeling of climate change, and distributes the results of these analyses to users like the Columbia Basin Trust (CBT). PCIC has also independently a user-friendly web based tool for BC communities called Plan2Adapt, which provides communities with

Downscaling Climate Data for Climate Change Adaptation Action Planning in Alberta 13
basic climate change trends for 2020, 2050 and 2080 in accessible map-based or chart-based formats. Some description of the specific climate measures is included, but Plan2Adapt neglects any explanation of the impacts or implications of any anticipated changes. The tool can be viewed at: http://www.pacificclimate.org/tools-and-data/plan2adapt. A screenshot of the mapping display is also included below (see Figure 4).
Figure 4: Screenshot of the map-based component of Plan2Adapt, developed by PCIC. The mapping tool allows the user to choose a climate variable to display, an area of interest, a time frame for the climate change forecast, and other variables. The left screen shows current conditions, and the right shows anticipated future conditions (source: PCIC Plan2Adapt web site).
CBT ADAPTATION DISCOVERY TOOL
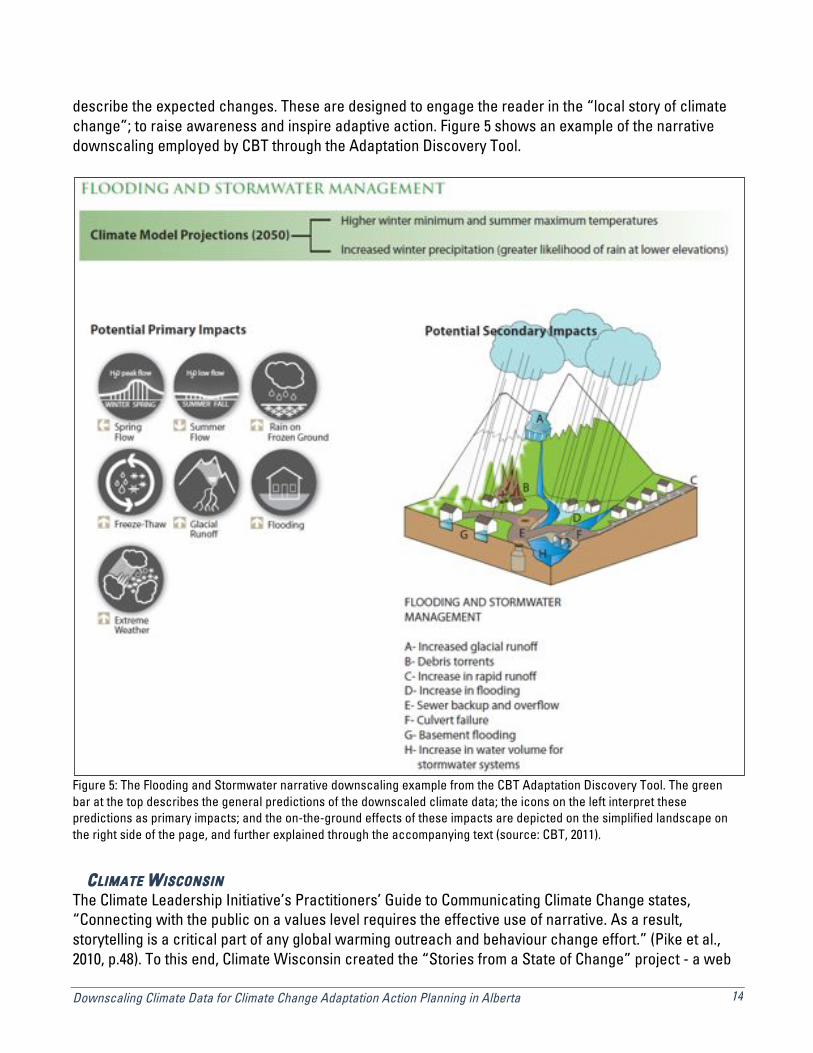
As part of their Communities Adapting to Climate Change Initiative (CACCI), CBT developed the Climate Change Adaptation Discovery Tool as a way to tell the story of expected local impacts of climate change. To create the Adaptation Tool, CBT took the results of downscaling to a regional climate model (conducted by PCIC as described above), and used these to tell the stories of local climate change impacts. For each aspect of the local community - for example, agricultural food production, stormwater management, or wildfires - the tool utilizes a series of icons corresponding to different modeled climate variables, and indicates how each of these factors is expected to change. The anticipated impacts are then illustrated on a simplified but representative landscape, with accompanying text to explicitly
Downscaling Climate Data for Climate Change Adaptation Action Planning in Alberta 14
describe the expected changes. These are designed to engage the reader in the “local story of climate change”; to raise awareness and inspire adaptive action. Figure 5 shows an example of the narrative downscaling employed by CBT through the Adaptation Discovery Tool.
Figure 5: The Flooding and Stormwater narrative downscaling example from the CBT Adaptation Discovery Tool. The green bar at the top describes the general predictions of the downscaled climate data; the icons on the left interpret these predictions as primary impacts; and the on-the-ground effects of these impacts are depicted on the simplified landscape on the right side of the page, and further explained through the accompanying text (source: CBT, 2011).
CLIMATE WISCONSIN
The Climate Leadership Initiative’s Practitioners’ Guide to Communicating Climate Change states, “Connecting with the public on a values level requires the effective use of narrative. As a result, storytelling is a critical part of any global warming outreach and behaviour change effort.” (Pike et al., 2010, p.48). To this end, Climate Wisconsin created the “Stories from a State of Change” project - a web

Downscaling Climate Data for Climate Change Adaptation Action Planning in Alberta 15
based initiative that can be viewed at http://climatewisconsin.org/. The project consists of a series of short stories that depict impacts of climate change at a very local level. It is a pure manifestation of narrative downscaling. For narrators, Climate Wisconsin turned to people in the very communities that the project was trying to reach: farmers, foresters, nordic skiers, and urbanites. The stories are well-told, and they resonate with a sincerity that could not come from without a local community. The message contains very few data points, facts, or maps - usually only one per episode - but the impacts of climate change are explained and embraced in a way that is perhaps even more powerful. None of the above examples are perfect, and not one individually would meet the need or fill the gap that Miistakis has identified in the CCA action planning process. But they provide a good cross-section of the types of downscaling that have been presented in the past, and serve as useful starting points and touchstones for the tools we plan to develop.
NEXT STEPS WITH DOWNSCALING Many aspects of the Local Adaptations sub-project will converge to inform the direction Miistakis follows in the creation of tools to display and represent downscaled climate data. The review of existing processes has provided some useful downscaling examples, and helped us to identify a gap between science and outreach and a real need for meaningful information on climate change and its impacts that builds understanding and inspires adaptive action among local communities. Ongoing work to identify most locally significant impacts of climate change, and to link those impacts to biodiversity and ecosystem services in Alberta’s grassland regions will enable us to refine our data needs. This will allow us to be more selective about the stories we need to tell through downscaling, and through representing downscaled data in narrative or spatial formats. And engaging a community of stakeholders in open, honest discussion will provide insight to what message we need to send and how we need to send it, and valuable feedback as a sounding board for the tools we develop. Governed by all the useful information we expect from other components of the Local Adaptations sub-project, we will build a visualization tool that addresses the gap in current CCA action planning processes. Representation of downscaled data will likely take a form that blends spatial and narrative approaches, that meets the needs of local communities by “making climate change matter”, and that makes the best use of the skills of Miistakis and the BMCCA Project Team. The ideal solution to representing downscaled data will take the best elements of the examples provided in this report, make the best use of all our skills and knowledge, and address the real need that will only become clearer as the project progresses.
Downscaling Climate Data for Climate Change Adaptation Action Planning in Alberta 16
REFERENCES Columbia Basin Trust (CBT). 2011. Climate Change Adaptation Discovery Tool, First Edition. CBT Communities Adapting to Climate Change Initiative (CACCI). Fisher, Ryan and Erin Bayne. 2012 (Revised Feb. 2013). Protecting Rare Grasslands Birds from Extreme Weather Events. ABMI Biodiversity and Climate Change Adaptation Project / University of Alberta. Koopman, Marni E., Cindy Deacon Williams, Alan Journet, Richard S. Nauman, and Jessica L. Leonard. Future Climate Conditions in Missoula County and the Western Montana Region. Geos Institute. Murdock, Trevor Q. and A.T. Werner. 2011. Canadian Columbia Basin Climate Trends and Projections: 2007-2010 Update. Pacific Climate Impacts Consortium, University of Victoria. Pike, Cara, Bob Doppelt, and Meridith Herr. 2010. Climate Communications and Behaviour Change: A Guide for Practitioners. The Climate Leadership Initiative. Sanderson, Ken. 2013. Climate Change Adaptation Action Plans - Alberta Process Review. ABMI Biodiversity and Climate Change Adaptation Project / Miistakis Institute. Schneider, Richard R. 2013. Alberta’s Natural Subregions Under a Changing Climate: Past, Present, and Future. ABMI Biodiversity and Climate Change Adaptation Project / University of Alberta. Shank, Chris. 2012. Framework for Assessing the Vulnerability of Alberta’s Biodiversity to Climate Change. ABMI Biodiversity and Climate Change Adaptation Project. Stralberg, Diana. 2012. General Circulation Model Recommendations for Alberta. ABMI Biodiversity and Climate Change Adaptation Project / University of Alberta. Wang, T. L., A. Hamann, D. L. Spittlehouse, and T. Q. Murdock. 2012. ClimateWNA - High-Resolution Spatial Climate Data for Western North America. Journal of Applied Meteorology and Climatology, vol. 51, pp16-29.
Downscaling Climate Data for Climate Change Adaptation Action Planning in Alberta 17
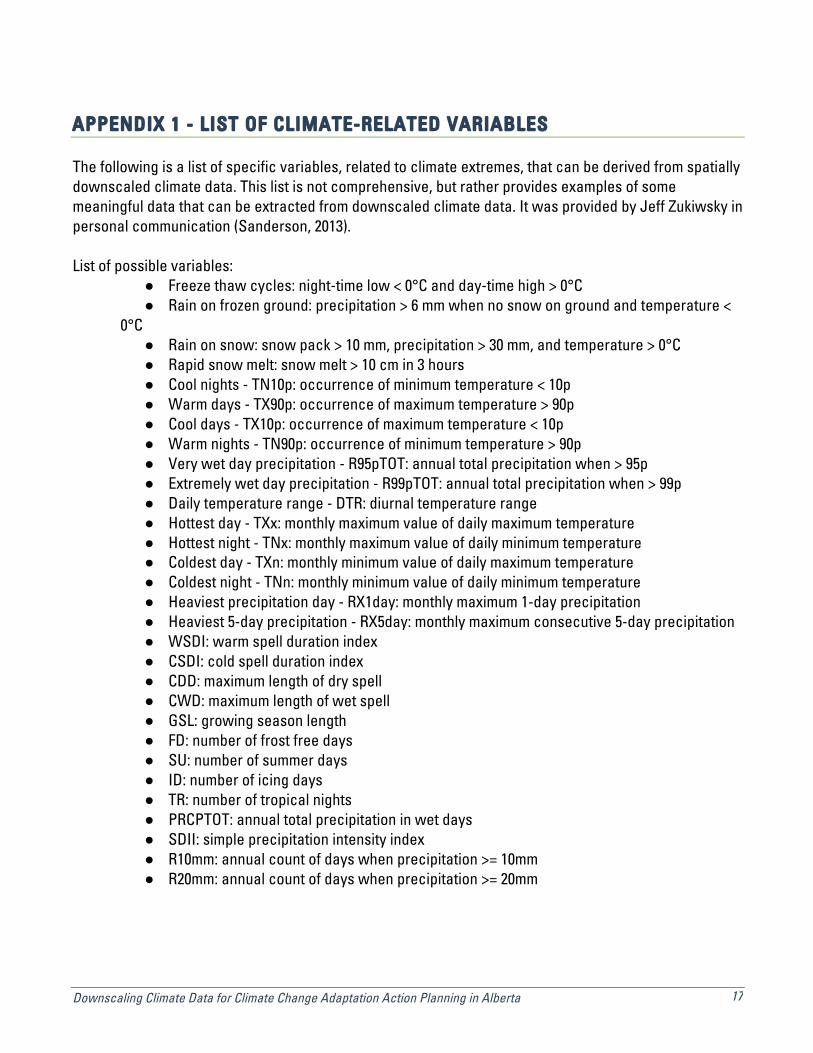
APPENDIX 1 - LIST OF CLIMATE-RELATED VARIABLES The following is a list of specific variables, related to climate extremes, that can be derived from spatially downscaled climate data. This list is not comprehensive, but rather provides examples of some meaningful data that can be extracted from downscaled climate data. It was provided by Jeff Zukiwsky in personal communication (Sanderson, 2013). List of possible variables:
● Freeze thaw cycles: night-time low < 0°C and day-time high > 0°C ● Rain on frozen ground: precipitation > 6 mm when no snow on ground and temperature <
0°C ● Rain on snow: snow pack > 10 mm, precipitation > 30 mm, and temperature > 0°C ● Rapid snow melt: snow melt > 10 cm in 3 hours ● Cool nights - TN10p: occurrence of minimum temperature < 10p ● Warm days - TX90p: occurrence of maximum temperature > 90p ● Cool days - TX10p: occurrence of maximum temperature < 10p ● Warm nights - TN90p: occurrence of minimum temperature > 90p ● Very wet day precipitation - R95pTOT: annual total precipitation when > 95p ● Extremely wet day precipitation - R99pTOT: annual total precipitation when > 99p ● Daily temperature range - DTR: diurnal temperature range ● Hottest day - TXx: monthly maximum value of daily maximum temperature ● Hottest night - TNx: monthly maximum value of daily minimum temperature ● Coldest day - TXn: monthly minimum value of daily maximum temperature ● Coldest night - TNn: monthly minimum value of daily minimum temperature ● Heaviest precipitation day - RX1day: monthly maximum 1-day precipitation ● Heaviest 5-day precipitation - RX5day: monthly maximum consecutive 5-day precipitation ● WSDI: warm spell duration index ● CSDI: cold spell duration index ● CDD: maximum length of dry spell ● CWD: maximum length of wet spell ● GSL: growing season length ● FD: number of frost free days ● SU: number of summer days ● ID: number of icing days ● TR: number of tropical nights ● PRCPTOT: annual total precipitation in wet days ● SDII: simple precipitation intensity index ● R10mm: annual count of days when precipitation >= 10mm ● R20mm: annual count of days when precipitation >= 20mm


![A Matrix Expander Chernoff Boundnikhil/mchernoff.pdf · Ankit Garg, Yin Tat Lee, Zhao Song, Nikhil Srivastava UC Berkeley. Vanilla Chernoff Bound Thm [Hoeffding, Chernoff]. If ...](https://static.fdocuments.net/doc/165x107/60da042c6c264c5d2f4a3bbf/a-matrix-expander-chernoff-bound-nikhilmchernoffpdf-ankit-garg-yin-tat-lee.jpg)


![Miistakis AR 05-06-v01 · Greg Chernoff, SPATIAL ANALYST Madalena Pinto, ADMINISTRATION ASSISTANT Samantha Managh, RESEARCH ASSOCIATE Board of Directors Staff [2] Miistakis Institute](https://static.fdocuments.net/doc/165x107/5ff995aa51066805c53fb4ac/miistakis-ar-05-06-greg-chernoff-spatial-analyst-madalena-pinto-administration.jpg)