Preparation of titanium diboride TiB2 by spark plasma - IOPscience
8
Science and Technology of Advanced Materials Preparation of titanium diboride TiB 2 by spark plasma sintering at slow heating rate To cite this article: Jürgen Schmidt et al 2007 Sci. Technol. Adv. Mater. 8 376 View the article online for updates and enhancements. You may also like Synthesis and properties of nanoscale titanium boride K A Efimova, G V Galevskiy and V V Rudneva - W – TiB 2 Composite Material for Electro- spark Deposition J Kováik, Š Emmer, J Kulasa et al. - Preparation of highly-dense TiB 2 ceramic with excellent mechanical properties by spark plasma sintering using hexagonal TiB 2 plates Tong Zhang, Shaolei Song, Chen Xie et al. - Recent citations Bulk high-entropy hexaborides Mingde Qin et al - Thermal Model and Numerical Simulation of Selective Laser Alloying Process of Elemental Ti and B Wenlin Ye et al - Precipitation and Distribution Behavior of In Situ-Formed TiB Whiskers in Ti64 Composites Fabricated by Selective Laser Melting Junko Umeda et al - This content was downloaded from IP address 78.142.233.252 on 01/12/2021 at 06:11
Transcript of Preparation of titanium diboride TiB2 by spark plasma - IOPscience

Science and Technology ofAdvanced Materials
Preparation of titanium diboride TiB2 by sparkplasma sintering at slow heating rateTo cite this article: Jürgen Schmidt et al 2007 Sci. Technol. Adv. Mater. 8 376
View the article online for updates and enhancements.
You may also likeSynthesis and properties of nanoscaletitanium borideK A Efimova, G V Galevskiy and V VRudneva
-
W – TiB2 Composite Material for Electro-spark DepositionJ Kováik, Š Emmer, J Kulasa et al.
-
Preparation of highly-dense TiB2 ceramicwith excellent mechanical properties byspark plasma sintering using hexagonalTiB2 platesTong Zhang, Shaolei Song, Chen Xie etal.
-
Recent citationsBulk high-entropy hexaboridesMingde Qin et al
-
Thermal Model and Numerical Simulationof Selective Laser Alloying Process ofElemental Ti and BWenlin Ye et al
-
Precipitation and Distribution Behavior ofIn Situ-Formed TiB Whiskers in Ti64Composites Fabricated by Selective LaserMeltingJunko Umeda et al
-
This content was downloaded from IP address 78.142.233.252 on 01/12/2021 at 06:11
ARTICLE IN PRESSThe STAM archive is now available from the IOP Publishing website http://www.iop.org/journals/STAM
1468-6996/$ - se
doi:10.1016/j.st
�CorrespondFertigungstechn
steil Dresden, W
Tel.: +49 0 351
E-mail addr
Science and Technology of Advanced Materials 8 (2007) 376–382
www.elsevier.com/locate/stam
Preparation of titanium diboride TiB2 by spark plasma sinteringat slow heating rate
Jurgen Schmidta,�, Marian Boehlingb, Ulrich Burkhardta, Yuri Grina
aMax-Planck-Institut fur Chemische Physik fester Stoffe, Nothnitzer StraX e 40, 01187 Dresden, GermanybTechnische Universitat Dresden, Rontgenographisches Speziallabor, 01069 Dresden, Germany
Received 13 April 2007; received in revised form 19 June 2007; accepted 22 June 2007
Available online 16 August 2007
Abstract
A systematic study of the spark plasma sintering of TiB2 starting from mixture of elemental powders was performed to investigate the
temperature distribution between pressing tool and sinter body. The reaction mechanism and time-dependant evolution of the sintering
behavior are established. The simultaneous application of pulsed high dc current and load leads to a microstructure with needle-shaped
grains. Electron backscattering diffraction analyses show the preferred orientation of small crystallites parallel to the pressing direction.
r 2007 NIMS and Elsevier Ltd. All rights reserved.
Keywords: Spark plasma sintering; Titanium diboride; Microstructure
1. Introduction
Titanium diboride (TiB2) is a refractory intermetalliccompound with excellent hardness, corrosion resistanceand electrical conductivity. It is difficult to sinter TiB2 bycommon methods because of its low self-diffusion rate.Therefore, we investigated the spark plasma sintering (SPS)route for obtaining TiB2.
The SPS system is a combination of a hot press and apulse current generator [1]. The technique has beendeveloped for compaction of various metals, ceramicsand composites. In the SPS process, dc current pulses withseveral hundred or thousand amperes and a duration ofabout 3ms passed through the green good, while mechan-ical pressure is applied. SPS is postulated to generatesparks between powder particles due to the pulsed current.The effects caused by the SPS are not yet understoodclearly. However, our experimental results show the
e front matter r 2007 NIMS and Elsevier Ltd. All rights rese
am.2007.06.009
ing author. Current address: Fraunhofer Institut fur
ik und Angewandte Materialforschung IFAM, Institut-
interbergstraXe 28, 01277 Dresden, Germany.
2537 324; fax: +49 0 351 2554 462.
ess: [email protected] (J. Schmidt).
activating effect of the pulsed current [2]. The temperaturemeasurement in the SPS system employed is typicallyperformed in two regions: a low-temperature regionbetween room temperature and 1200 1C, in which themeasurement is done by thermocouple inside the die wall.In the high-temperature region (600–2000 1C), the mea-surement of the surface temperature of the die wall is doneby a pyrometer.It is known that the temperature inside the sample is
mostly different from the temperature that is used tocontrol the process (temperature of the die or the die wallsurface, respectively). The difference depends on theheating rate, the electrical conductivity of tools andsample, the thermal insulation and other parameters.Many works have been done to simulate the temperaturedistribution with FEM methods [3,4] or to measurethe sample temperature by thermocouples [2,5–7].Most of these investigations show the temperaturedistribution while sintering at temperatures lower than1000 1C [6].In this study, the analysis of the temperature distribution
between sample and die was done during the SPS synthesisof TiB2. The reaction between titanium and boron isexothermic for the binary phases—titanium monoboride
rved.

ARTICLE IN PRESS
Fig. 1. Die and sample temperature and the punch displacement for SPS
treatment of the powder mixture Ti+2Bamorphous below 900 1C. Tempera-
ture measurement was done with thermocouples (cf. text).
J. Schmidt et al. / Science and Technology of Advanced Materials 8 (2007) 376–382 377
(TiB) and TiB2. Because of this, the reactions can be easilyobserved by temperature changes inside a sample.
2. Experimental
Commercial Ti powders (Chempur GmbH, 99.5%, -200mesh) and amorphous B (Alfa Aesar, 99.99%, 325 mesh)were used as starting materials. The powders were mixed ina molar ratio of Ti:B ¼ 1:2 and then treated in a swing mill(ZrO2 milling set, 25Hz, 30min).
The synthesis was carried out by using a SPS 515-Ssystem (Sumitomo Coal Mining Co., Ltd., Japan).To analyze the known occurrence of differences betweenthe temperatures measured on the surface of thegraphite die and the temperatures inside the die [8], ameasurement of the sample temperature with a secondthermocouple placed inside the die was performed. Thisthermocouple was plunged through the upper punch andfixed with zirkonia-based cement with the measurement tip4mm deep inside the sample. For the analysis of sampletemperatures lower than 1200K, K-type thermocoupleswere used. For higher temperatures, W 5% Re/W 26% Re-thermocouples with a flexible + ¼ 0.7mm Ta-mantle(THERMOCOAX GmbH, Germany) were used. Thesethermocouples can be used up to temperatures of about1850 1C.
The SPS preparation was carried out in dynamicvacuum. An uniaxial pressure of about 40MPa in the diewas applied during the entire process.
After the reaction, the bulk samples were ground andpolished to remove the thin surface layer (o 0.5mm),which had been in contact with the graphite die andpunches. After this procedure, parts of the samples weremilled and analyzed by X-ray powder diffraction (XRD)(HUBER Image plate Guinier camera G670, Cu Ka1radiation, l ¼ 1.54060 A, quartz monochromator, NISTstandard CeO2, a ¼ 5.4111(1) A).
DTA/TG-measurements were performed with the STA409C equipment (NETZSCH, Germany) in corundumcrucibles (Ar atmosphere, S-type thermocouple, heatingrate 10K/min).
Quality of the prepared samples was examined also byoptical metallography. Their compositions were verified ona Philips XL30 scanning electron microscope (SEM) withintegrated EDXS system and S-UTW-Si-(Li) detector. TheEPMA (WDXS) analysis was made with a CAMECASX100 system.
The orientation of single grains in the microstructurewas carried out by means of the electron backscatteringdiffraction (EBSD). These investigations were madewith the system INCA Crystal 300 (Oxford instruments),which is mounted to a SEM FEI XL 30 (formerlyPHILIPS). EBSD mapping was made at magnifi-cation 500. The step width of the measuring pointswas 1 mm. The measured maps were evaluated with regardto the grain size, grain shape and crystallographicorientation.
3. Results and discussion
3.1. Temperature behavior and chemical reactions
In the Ti–B binary system, following reactions may takeplace during heating of the mixture of the elementalpowders:
Tiþ B! TiB DGðR; 1000KÞ ¼ �157 kJ=mol; (1)
Tiþ TiB2! 2TiB DGðR; 1000KÞ ¼ �6; 3 kJ=mol; (2)
Tiþ 2B! TiB2 DGðR; 1000KÞ ¼ �308 kJ=mol: (3)
The Gibbs free energy DG of formation reactions (1)–(3)have been calculated using the thermodynamic data [9]. DG
values of all the three reactions are negative, whichindicates that all the reactions can take place. AlthoughDG of reaction (3) is the most negative, Ti and TiB2 canfurther react to form TiB due to the small negative value ofthe free energy of reaction (2). For this reason, TiB2 will beconverted to TiB as long as the average B concentration inthe reaction zone is less than 18 mass% [10].After milling, XRD powder patterns do not show
reaction between the powders. Subsequently, the pre-milledpowder mixture is SPS treated stepwise from roomtemperature to 900 1C with a heating rate of 20 1C/min(Fig. 1). The first strong compaction of the powder mixturebelow 200 1C is a result of the particle movement anddeformation due to applied pressure. Chemical reactionscannot be observed. Below 700 1C, powder XRD showedthe reflections of a-Ti and a strong amorphous back-ground. The sample temperature is slightly lower than thetemperature measured in the die. The origin of thisbehavior is the lower electrical conductivity of the powdermixture compared with the graphite material of the die.In the temperature region above 450 1C (measured in the
die), the densification rate increases again. While thisoccur, the sample temperature becomes higher in compar-ison with the die wall temperature (Fig. 1). The reason for

ARTICLE IN PRESS
Fig. 4. Die and sample temperature and the punch displacement for SPS
treatment of the powder mixture Ti+2Bamorphous below 1700 1C.
Temperature measurement was done with thermocouple (sample) and
pyrometer (die).
J. Schmidt et al. / Science and Technology of Advanced Materials 8 (2007) 376–382378
this is the additional heat of the exothermic reactions.Because of this, the second step of densification representsthe solid-state reactions between amorphous B and Ti toTiB2 (reaction (3)) and—in a second step, by excess of Ti—to TiB (reaction (2)). Above 700 1C reflections of TiB andTiB2 are visible in the powder XRD patterns (Fig. 2).
Independent of the high negative Gibbs free energy forreaction (3), there is no indication for a self-sustaining processunder the SPS conditions applied. The displacement/tempera-ture vs. time diagrams indicate a diffusion-controlled solid-state reaction, which can be deduced from comparison with theSPS processing of the elemental powder mixture of nickel withaluminium (Fig. 3). In this case, the mixed powders reactspontaneously within seconds. The temperature in the sampleincreases rapidly in comparison with the temperature in thedie. An important criterion for the classification of a reaction isthe value of the heating rate. Lower heating rates increase theconversion rate by solid-state reactions and inhibit solid–liquidprocesses that are necessary for self-sustaining interaction[11,12]. A self-sustaining reaction between Ti and amorphous
Fig. 2. Powder XRD pattern of Ti+2Bamorpous powders SPS-processed at
900 1C for 30min.
Fig. 3. Die and sample temperature for the SHS reaction (Ni+Al) while
Spark Plasma Sintering.
Fig. 5. Experimental and calculated XRD powder pattern of the SPS-
processed Ti+2Bamorpous mixture at 1300 1C for 30min.
Fig. 6. Densification behavior of the SPS-processed powders
Ti+2Bamorphous in the temperature range between 1500 and 1900 1C for
dwell time of 30min.

ARTICLE IN PRESSJ. Schmidt et al. / Science and Technology of Advanced Materials 8 (2007) 376–382 379
B within the SPS setup is possible at heating rates higher than100 1C/min. Under that conditions, reaction leads frequently tothe destruction of the pressing tool. Because of this, the heatingrate for further experiments in the high-temperature region waschosen to be always lower than 25 1C/min.
In the further experiments between 600 and 1900 1C, thetemperature measurements were done by a pyrometer on thesurface of the die. To minimize the thermal radiation, the diewas covered with graphite fleece. The measuring spot of thepyrometer was focused on the hole, which is normally used forthe thermocouple. The temperature increases while sinteringwith about 300 1C/min from room temperature to theminimum temperature for the pyrometer (570 1C). This stepneeds about 120 s. Higher temperatures were tuned with the
Fig. 7. Microstructure of Ti+2B powder mixtures SPS treated for 30min at 900
micrographs (a, c, d, g, h) and SEM images (BSE contrast: b, d; SE contrast
chosen heating rate. The temperatures given below (if notmentioned explicitly) are temperatures of the die.At about 930 1C, the displacement of the punches increases
strongly (Fig. 4). This compaction step extends over 400 1C.The temperature in the sample is close to the a/b-transitiontemperature of Ti (882 1C [13]). The allotropic phase transitionleads to the formation of Ti-metal surfaces without oxidelayers and, therefore, with a high reactivity. a-Ti is measurablein the powder XRD up to 900 1C (Fig. 2). This supports thechemical reactions (1)–(3) within the green hood. At tempera-tures higher than 1300 1C, TiB cannot be detected by XRD,the powder diffraction pattern showed only TiB2 (Fig. 5).During this step of reaction, the electrical behavior of the
powder mixture changes from insulating to electrical
1C (a, b), 1100 1C (c, d), 1500 1C (e, f), 1600 1C (g) and 1800 1C (h). Optical
e) are shown.
ARTICLE IN PRESSJ. Schmidt et al. / Science and Technology of Advanced Materials 8 (2007) 376–382380
conductivity. At temperatures below the onset of thereaction, the die temperature is higher than the tempera-ture in the sample. During the reaction, the sampletemperature increases faster than the die temperature,which is typical for materials with an electrical conductivitybetter than graphite. At about 1400 1C sample temperature,the displacement of the punches come close to zero.
At 1680 1C, the displacement increases again rapidly(Fig. 4). The sample temperature decreases temporarily atthe onset of the displacement step. This can be explained bythe formation of a liquid phase with a composition close tothe Ti-rich eutectic composition. The liquid phase reactswith the remaining amorphous B and TiB, forming thefinal product TiB2.
In contrast to some information in the literature [14], ahomogeneity range for TiB2 could not be detectedby measuring the unit-cell parameters on SPS-treatedsamples with the starting atomic composition TixB100�x
(27oxo45) at 1500 1C.By the use of die temperatures higher than 1700 and
1800 1C, the displacement of the punches can be under-stood by the thermal expansion of the pressing tool and thesample (Fig. 6). At higher temperatures an additionalcompaction of the sample is measurable. This shrinkage isoriginated in the re-crystallization and re-sintering of TiB2,which should start above 1900 1C [15].
Fig. 9. Position of the EBSD sections in respect to the pressure applied
during SPS.
3.2. Microstructure
Up to 900 1C, the microstructure consists of irregularlyshaped, often elongated particles that were loosely packed. Thesize of the single particle corresponds to the particle size of theused powders (Figs. 7a,b). The bright field images show twophases inside the metallic particles, with one of them having theneedle-like morphology (Figs. 7c,d). Electron probe micro-
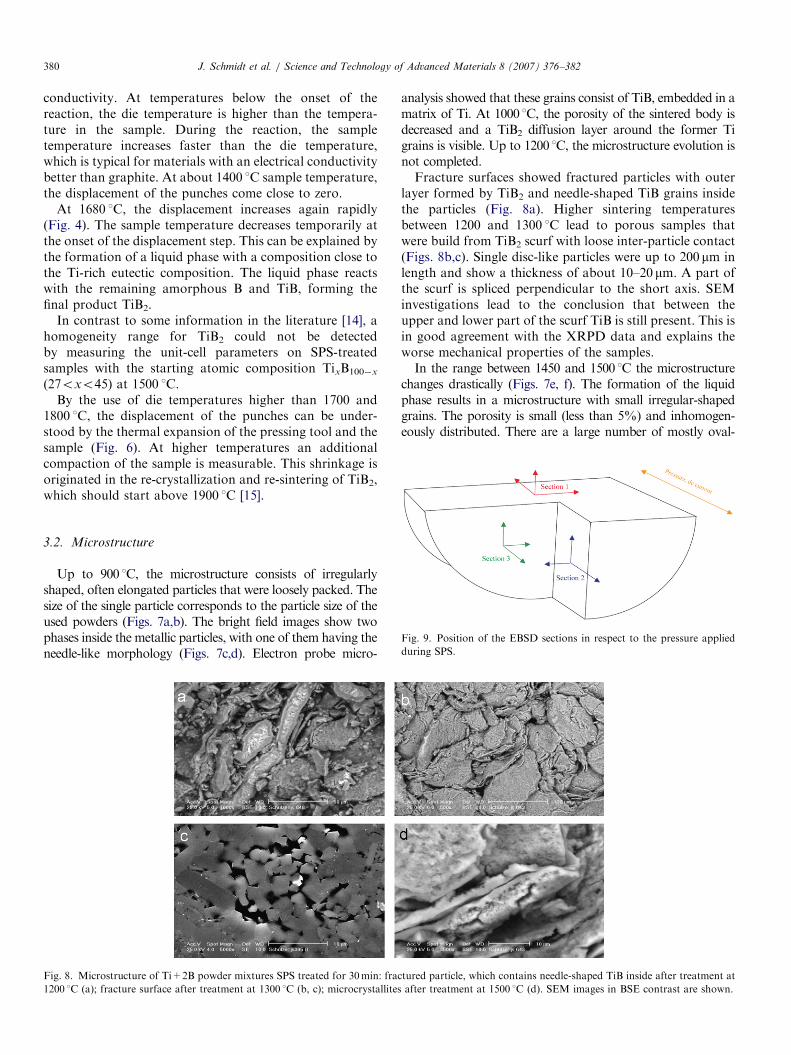
Fig. 8. Microstructure of Ti+2B powder mixtures SPS treated for 30min: frac
1200 1C (a); fracture surface after treatment at 1300 1C (b, c); microcrystallites
analysis showed that these grains consist of TiB, embedded in amatrix of Ti. At 1000 1C, the porosity of the sintered body isdecreased and a TiB2 diffusion layer around the former Tigrains is visible. Up to 1200 1C, the microstructure evolution isnot completed.Fracture surfaces showed fractured particles with outer
layer formed by TiB2 and needle-shaped TiB grains insidethe particles (Fig. 8a). Higher sintering temperaturesbetween 1200 and 1300 1C lead to porous samples thatwere build from TiB2 scurf with loose inter-particle contact(Figs. 8b,c). Single disc-like particles were up to 200 mm inlength and show a thickness of about 10–20 mm. A part ofthe scurf is spliced perpendicular to the short axis. SEMinvestigations lead to the conclusion that between theupper and lower part of the scurf TiB is still present. This isin good agreement with the XRPD data and explains theworse mechanical properties of the samples.In the range between 1450 and 1500 1C the microstructure
changes drastically (Figs. 7e, f). The formation of the liquidphase results in a microstructure with small irregular-shapedgrains. The porosity is small (less than 5%) and inhomogen-eously distributed. There are a large number of mostly oval-
tured particle, which contains needle-shaped TiB inside after treatment at
after treatment at 1500 1C (d). SEM images in BSE contrast are shown.
ARTICLE IN PRESSJ. Schmidt et al. / Science and Technology of Advanced Materials 8 (2007) 376–382 381
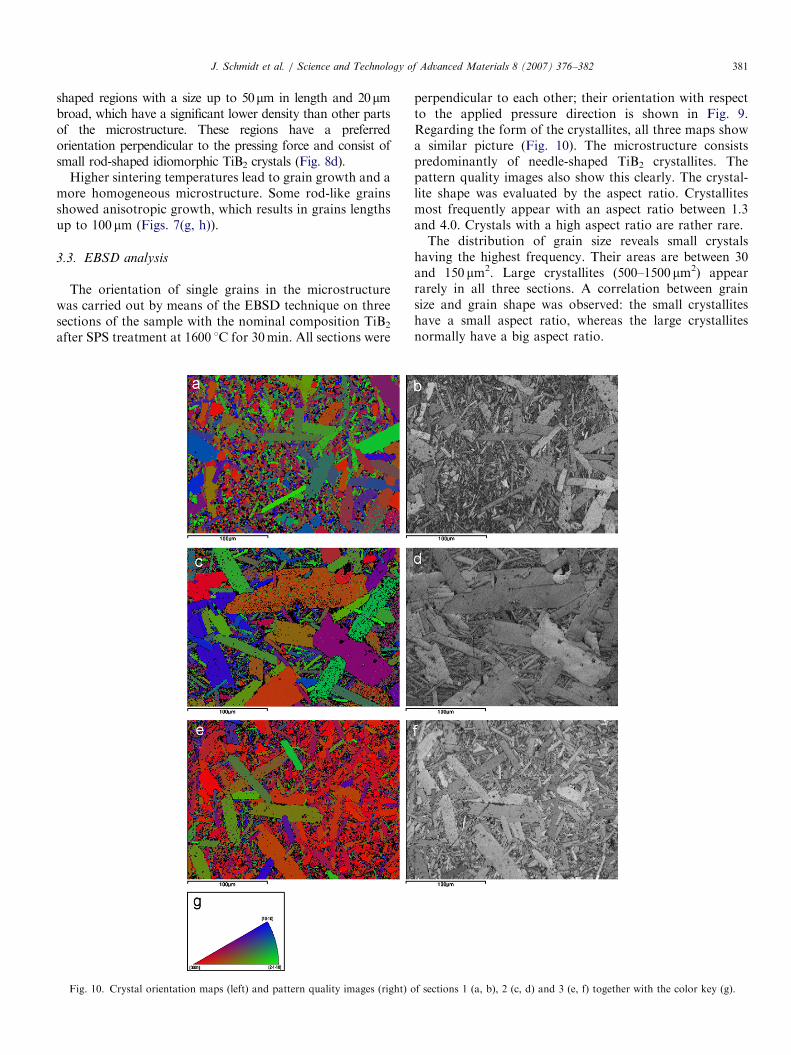
shaped regions with a size up to 50mm in length and 20mmbroad, which have a significant lower density than other partsof the microstructure. These regions have a preferredorientation perpendicular to the pressing force and consist ofsmall rod-shaped idiomorphic TiB2 crystals (Fig. 8d).
Higher sintering temperatures lead to grain growth and amore homogeneous microstructure. Some rod-like grainsshowed anisotropic growth, which results in grains lengthsup to 100 mm (Figs. 7(g, h)).
3.3. EBSD analysis
The orientation of single grains in the microstructurewas carried out by means of the EBSD technique on threesections of the sample with the nominal composition TiB2
after SPS treatment at 1600 1C for 30min. All sections were
Fig. 10. Crystal orientation maps (left) and pattern quality images (right) o
perpendicular to each other; their orientation with respectto the applied pressure direction is shown in Fig. 9.Regarding the form of the crystallites, all three maps showa similar picture (Fig. 10). The microstructure consistspredominantly of needle-shaped TiB2 crystallites. Thepattern quality images also show this clearly. The crystal-lite shape was evaluated by the aspect ratio. Crystallitesmost frequently appear with an aspect ratio between 1.3and 4.0. Crystals with a high aspect ratio are rather rare.The distribution of grain size reveals small crystals
having the highest frequency. Their areas are between 30and 150 mm2. Large crystallites (500–1500 mm2) appearrarely in all three sections. A correlation between grainsize and grain shape was observed: the small crystalliteshave a small aspect ratio, whereas the large crystallitesnormally have a big aspect ratio.
f sections 1 (a, b), 2 (c, d) and 3 (e, f) together with the color key (g).
ARTICLE IN PRESSJ. Schmidt et al. / Science and Technology of Advanced Materials 8 (2007) 376–382382
The grain orientation in the three sections investigated isvisualized with the crystal orientation maps (COM, Fig. 10).From the quality patterns a partial fiber-like texture may beimagined in all three sections. According to the COMs, thefiber axes are nearly parallel to the crystallographic [0 0 0 1]direction. A significant alignment of the [0 0 0 1] axes of thefiber-like crystallites along the pressure direction can berecognized from the COM of Section 3. The forcedorientation of the crystallites is probably caused by theinteraction of the magnetic field of the dc current during theSPS treatment with the crystal lattice of the TiB2 [16,17].
4. Conclusions
Starting from the powder mixture of elemental Ti andamorphous B, TiB2 was synthesized by spark plasmasintering by monitoring the temperature distributionbetween die and sample. The proposed temperaturemeasurement setup enables the analysis of the chemicalreactions during SPS treatment. The slow diffusion-controlled formation of TiB2 under low heating rate(20 1C/min) can be monitored by the change in theelectrical conductivity of the sample. The fast solid–liquidreaction completed the formation of TiB2. The micro-structure of the sintered samples above 1600 1C isdominated by needle-shaped crystallites with main axisparallel to the crystallographic [0 0 0 1] direction in thecrystal structure of TiB2. The crystallites are preferablyoriented to the direction of the pressure and DC current.
Acknowledgments
The authors would like to thank Mr. S. Huckmann forXRD measurements, Mrs. M. Eckert for metallographicpreparation and Mrs. K. Schulze for WDXS analyses.
References
[1] M. Tokita, Nyu Seramikkusu 10 (1997) 43.
[2] J. Schmidt, R. Niewa, M. Schmidt, Yu. Grin, J. Am. Ceram. Soc. 88
(2005) 1870.
[3] K. Vanmeensel, A. Laptev, J. Hennicke, J. Vleugels, O. Van der Biest,
Acta Materialia 53 (2005) 4379.
[4] A. Zavaliangos, J. Zhang, M. Kramer, J.R. Groza, Mater. Sci. Eng.
A 379 (2004) 218.
[5] H.T. Kim, M. Kawahara, M. Tokita, J. Jpn. Soc. Powder Powder
Metallurgy 47 (2000) 887.
[6] J. Schmidt, W. Schnelle, Yu. Grin, R. Kniep, Solid State Sci 5 (2003) 535.
[7] U. Anselmi-Tamburini, J.E. Garay, Z.A. Munir, Mater. Sci. Eng. A
407 (2005) 24.
[8] M. Nanko, T. Maruyama, H. Tomino, J. Jpn. Inst. Metals 63 (1999) 917.
[9] I. Barin, Thermochemical Data of Pure Substances, third ed, VCH,
Weinheim, 1995.
[10] H. Feng, Q. Meng, Y. Zhou, D. Jia, Mater. Sci. Eng. A 397 (2005) 92.
[11] Y. Zhang, G.C. Stangle, J. Mater. Res. 8 (1993) 1703.
[12] K.A. Philpot, Z.A. Munir, J.B. Holt, J. Mater. Sc. 22 (1987) 159.
[13] E.K. Molchanova, Phase Diagrams of Titanium Alloys, Israel
Program for Science Translation, Jerusalem, 1965.
[14] J.L. Murray, P.K. Liao, K.E. Spear, Bulletin of Alloy Phase
Diagrams 7 (1986) 550.
[15] G.V. Samsonov, M.S. Kovalchenko, Poroshkovaya Metallurgia 1
(1961) 20.
[16] F. Haarmann, Y. Prots, Z. Anorg. Allg. Chem. 632 (2006) 2135.
[17] F. Haarmann, M. Armbruster, Y. Prots, Chem. Mater. 19 (2007) 1147.