preparation, characterization and evaluation of optimal activated ...
50
PREPARATION, CHARACTERIZATION AND EVALUATION OF OPTIMAL ACTIVATED CARBONS DERIVED FROM PROSOPIS AFRICANA SEED HULLS FOR THE REMOVAL OF CHLOROPHENOLS FROM AQUEOUS SOLUTION by ZAHARADDEEN NASIRU GARBA Thesis submitted in fulfillment of the requirement for the degree of Doctor of Philosophy December 2015
-
Upload
hoangtuyen -
Category
Documents
-
view
226 -
download
1
Transcript of preparation, characterization and evaluation of optimal activated ...

PREPARATION, CHARACTERIZATION AND
EVALUATION OF OPTIMAL ACTIVATED
CARBONS DERIVED FROM PROSOPIS
AFRICANA SEED HULLS FOR THE REMOVAL
OF CHLOROPHENOLS FROM AQUEOUS
SOLUTION
by
ZAHARADDEEN NASIRU GARBA
Thesis submitted in fulfillment of the requirement
for the degree of
Doctor of Philosophy
December 2015

ii
ACKNOWLEDGEMENT
In the name of Allah, the Most Gracious and the Most Merciful
My utmost gratitude goes to Almighty Allah for sparing my life, granting me
good health, knowledge and understanding throughout the tumultuous period of this
research.
I owe gratitude and special appreciation to my supervisor
and mentor, Associate Prof. Dr. Afidah Abdul Rahim for her invaluable mentorship
and patient guidance, valuable suggestion and constructive comments throughout the
course of my research despite her tight schedule.
My prodigious thanks go to the entire community of Ahmadu Bello
University (ABU), Zaria, Nigeria for giving me the opportunity to come to Malaysia
(Truly Asia) and pursue my Doctoral degree. And I sincerely appreciate the financial
support of Universiti Sains Malaysia under the Research University Grant -
1001/PKIMIA/854002.
I would like to extend my gratitude to all the lecturers, technical and
administrative staff of School of Chemical Sciences, School of Chemical
Engineering and Archaeology Research Centre, USM, Penang for their kind
cooperation and helping hands.
My sincere appreciation goes to all my lab mates Dr. Hazwan, Affaiza,
Helen, Shikin and Ridhwan, my parents Alhaji Nasiru Garba Getso and Hajiya
Yahanasu Nasiru, my best friend, better half and beloved wife Mrs Sumayyah
Zaharaddeen and my son Nasiru Zaharaddeen; I must also say thank you to Dr.
Galadima, Dr. Batagarawa, Dr. Jaafar, Nuraddeen, Nafeesah, Aminat, Aisha, Sabiu,
Zuwaira, Haleemah, Fresh, Zakariyya, all members of my family and friends for
their prayers and support.
Zaharaddeen N. Garba
September, 2015
iii
TABLE OF CONTENT
Page
ACKNOWLEDGEMENT ii
TABLE OF CONTENTS iii
LIST OF TABLES viii
LIST OF FIGURES xii
LIST OF ABBREVIATIONS xviii
LIST OF SYMBOLS xxi
ABSTRAK xxiii
ABSTRACT xxv
CHAPTER ONE: INTRODUCTION
1.0 Research overview 1
1.1 Water pollution and industrial effluents 1
1.1.1 Chlorophenols and their sources 2
1.1.1.1 Paper industrial effluents 3
1.1.1.2 Textile industrial effluents 3
1.1.2 Properties of chlorophenols 4
1.1.3 Toxic effect of chlorophenols 4
1.1.4 Treatment of industrial effluents 6
1.2 Wastewater treatment methods 8
1.2.1 Biological method 8
1.2.2 Chemical method 9
1.2.3 Physical method 9
1.3 Adsorption 10
1.3.1 Activated carbon 11
1.3.1.1 Demand for activated carbon 11
1.3.1.2 Raw materials availability in Nigeria 12
1.3.1.3 Precursors for activated carbon 12

iv
1.3.1.4 Activated carbon preparation 14
1.3.2 Optimization of activated carbon preparation conditions 18
1.4 Adsorption isotherm 21
1.4.1 Langmuir adsorption isotherm 22
1.4.2 Freundlich adsorption isotherm 25
1.4.3 Temkin adsorption isotherm 25
1.5 Adsorption kinetic studies 27
1.5.1 Pseudo-first order model 27
1.5.2 Pseudo-second order (1 & 2) 27
1.5.3 Elovich kinetic model 28
1.5.4 Intraparticle diffusion study 29
1.5.5 Boyd model 30
1.6 Adsorption thermodynamics 30
1.7 Desorption and regeneration of spent activated carbons 31
1.7.1 Thermal regeneration 32
1.7.2 Biological regeneration 32
1.7.3 Chemical regeneration 33
1.8 Problem statement 34
1.9 Research Objectives 36
1.10 Scope of study 37
1.11 Thesis organization 38
CHAPTER TWO: MATERIALS AND METHODS
2.1 Materials 40
2.1.1 Precursors 40
2.1.2 Chemicals and instruments 41
2.1.3 Gas 42
2.1.4 Adsorbates 42
2.3 Experimental procedure 44
2.3.1 Experimental design for preparation of activated carbons 45
2.3.2 Activated carbon preparation 45
2.3.3 Carbonization/chemical activation of the precursor 45
2.4 Concentration analysis system 47
2.5 Adsorbent characterization 48
2.5.1 Proximate analysis 48
2.5.2 Nitrogen adsorption-desorption measurements 49

v
2.5.3 Scanning electron microscopy (SEM) 49
2.5.4 Elemental analysis 50
2.5.5 pH point of zero charge (pHpzc) 50
2.5.6 Determination of iodine number 50
2.5.7 Surface functional group analysis using FTIR 51
2.6 Batch equilibrium studies 51
2.6.1 Effect of solution pH on CPs adsorption 52
2.6.2 Effect of contact time and initial CPs concentration 52
2.6.3 Temperature effect on the CPs adsorption 52
2.6.4 Adsorption isotherm studies 53
2.7 Batch kinetic adsorption studies 53
2.7.1 Adsorption kinetics experiment 53
2.7.2 Analysis of kinetic data 54
2.8 Adsorption thermodynamics studies 54
2.9 Regeneration of adsorbents 54
CHAPTER THREE: RESULTS AND DISCUSSION
3.1 Optimized parameters of Prosopis africana seed hull 56
activated carbons (PASH-AC) using design of experiment
3.1.1 Potassium oxalate activated carbon (K2C2O4-AC) 56
3.1.1.1 Development of regression model equations for 57
K2C2O4-AC preparation
3.1.1.2 K2C2O4-AC preparation parameters optimization 68
3.1.2 Sodium acetate activated carbon (CH3COONa-AC) 68
3.1.2.1 Development of regression model equations for 70
CH3COONa-AC preparation
3.1.2.2 CH3COONa-AC preparation parameters 80
optimization
3.1.3 Potassium carbonate activated carbon (K2CO3-AC) 80
3.1.3.1 Development of regression model equations for 81
K2CO3-AC preparation
3.1.3.2 K2CO3-AC preparation parameters optimization 91
3.2 Adsorbents characterization 92
3.2.1 Morphological structure 92
3.2.2 Elemental analysis 96
3.2.3 Proximate analysis 97
3.2.4 Surface area and porosity of the adsorbents 98
vi
3.2.5 pH point of zero charge (pHpzc) and iodine number test 104
3.2.6 Surface functional groups analysis 104
3.3 Batch adsorption study 110
3.3.1 Effect of solution pH on the CPs adsorption 110
3.3.2 Effect of initial concentration and contact time on 113
CPs adsorption
3.3.2.1 Effect of initial concentration and contact time on 113
CPs adsorption onto K2C2O4-AC
3.3.2.2 Effect of initial concentration and contact 117
time on CPs adsorption onto CH3COONa-AC
3.3.2.3 Effect of initial concentration and contact 119
time on CPs adsorption onto K2CO3-AC
3.3.2.4 Effect of initial concentration and contact 121
time on CPs adsorption onto CAC
3.3.3 Effect of solution temperature on CPs adsorption 124
3.4 Adsorption isotherm 126
3.4.1 Isotherm model for the CPs adsorption on K2C2O4-AC 126
3.4.2 Isotherm model for the CPs adsorption on CH3COONa-AC 133
3.4.3 Isotherm model for the CPs adsorption on K2CO3-AC 137
3.4.4 Isotherm model for the CPs adsorption on CAC 141
3.5 Adsorption kinetics 147
3.5.1 Adsorption kinetics for the CPs adsorption on 147
K2C2O4-AC
3.5.2 Adsorption kinetics for the CPs adsorption on 159
CH3COONa-AC
3.5.3 Adsorption kinetics for the CPs adsorption on 170
K2CO3-AC
3.5.4 Adsorption kinetics for the CPs adsorption on CAC 181
3.6 Adsorption mechanism 194
3.6.1 Intra particle diffusion model 194
3.6.2 Boyd model 203
3.7 Adsorption thermodynamics 204
3.8 Regeneration of used activated carbons 206
3.9 Comparison of adsorbents 209
vii
CHAPTER FOUR: CONCLUSIONS AND RECOMMENDATIONS
4.1 Conclusions 211
4.2 Recommendations 213
References 215
APPENDICES 242
Appendix A Calibration curves 242
Appendix B Adsorption isotherms 244
Appendix C Boyd diffusion model plots 283
LIST OF PUBLICATIONS AND AWARD 289

viii
LIST OF TABLES
Page
1.1 Physical–chemical properties of chlorophenols 5
1.2 Properties of some raw materials used in ACs preparation 13
1.3 Agricultural wastes employed to prepare low cost adsorbents 14
1.4 Physical, chemical and physico-chemical methods of preparing 19
activated carbons
1.5 Optimum parameters for activated carbon preparation using 21
response surface methodology
1.6 Linear forms of Langmuir isotherm 24
1.7 Adsorption isotherm models of chlorophenols onto different 26
adsorbents
1.8 Adsorption kinetics of chlorophenols onto different adsorbents 28
2.1 List and description of chemicals used 41
2.2 List and description of instruments used 41
2.3 Chemical structure and properties of the adsorbates 43
2.4 Independent variables and their coded levels for the central 45
composite design of K2C2O4-AC, CH3COONa-AC and
K2CO3-AC preparation
3.1 Experimental design matrix for preparation of K2C2O4-AC 57
and responses
3.2 The ANOVA for response surface quadratic model of 61
K2C2O4-AC yield
3.3 ANOVA for response surface quadratic model of 4C2MP 63
adsorption by K2C2O4-AC
3.4 ANOVA for response surface quadratic model of 2,4,6-TCP 63
adsorption by K2C2O4-AC
3.5 ANOVA for response surface quadratic model of 2,4-DCP 64
adsorption by K2C2O4-AC
3.6 ANOVA for response surface quadratic model of 4CP adsorption 64
by K2C2O4-AC

ix
3.7 The K2C2O4-AC preparation parameters optimization 69
3.8 Experimental design matrix for preparation of CH3COONa-AC 70
and responses
3.9 The ANOVA for response surface quadratic model of 72
CH3COONa-AC yield
3.10 ANOVA for response surface quadratic model of 4C2MP 73
adsorption by CH3COONa-AC
3.11 ANOVA for response surface quadratic model of 4CP adsorption 73
by CH3COONa-AC
3.12 ANOVA for response surface quadratic model of 2,4-DCP 74
adsorption by CH3COONa-AC
3.13 ANOVA for response surface quadratic model of 2,4,6-TCP 74
adsorption by CH3COONa-AC
3.14 The CH3COONa-AC preparation parameters optimization 80
3.15 Experimental design matrix for preparation of K2CO3-AC 81
and responses
3.16 The ANOVA for response surface 2FI model of K2CO3-AC yield 83
3.17 ANOVA for response surface quadratic model of 4C2MP 85
adsorption by K2CO3-AC
3.18 ANOVA for response surface quadratic model of 2,4-DC 85
adsorption by K2CO3-AC
3.19 ANOVA for response surface quadratic model of 4CP adsorption 86
by K2CO3-AC
3.20 ANOVA for response surface quadratic model of 2,4,6-TCP 86
adsorption by K2CO3-AC
3.21 The K2CO3-AC preparation parameters optimization 91
3.22 Elemental composition of precursor and adsorbents 96
3.23 Proximate analysis of precursor and adsorbents 98
3.24 The surface area and porosity of adsorbents 103
3.25 Iodine number and pHpzc of adsorbents 104

x
3.26 Langmuir (1-5), Freundlich and Temkin’s isotherm models 129
parameters for CPs adsorption on K2C2O4-AC at 30 oC
3.27 Langmuir (1-5), Freundlich and Temkin’s isotherm models 130
parameters for CPs adsorption on K2C2O4-AC at 40 oC
3.28 Langmuir (1-5), Freundlich and Temkin’s isotherm models 131
parameters for CPs adsorption on K2C2O4-AC at 50 oC
3.29 Langmuir (1-5), Freundlich and Temkin’s isotherm models 134
parameters for CPs adsorption on on CH3COONa-AC at 30 oC
3.30 Langmuir (1-5), Freundlich and Temkin’s isotherm models 135
parameters for CPs adsorption on CH3COONa-AC at 40 oC
3.31 Langmuir (1-5), Freundlich and Temkin’s isotherm models 136
parameters for CPs adsorption on CH3COONa-AC at 50 oC
3.32 Langmuir (1-5), Freundlich and Temkin’s isotherm models 138
parameters for CPs adsorption on K2CO3-AC at 30 oC
3.33 Langmuir (1-5), Freundlich and Temkin’s isotherm models 139
parameters for CPs adsorption on K2CO3-AC at 40 oC
3.34 Langmuir (1-5), Freundlich and Temkin’s isotherm models 140
parameters for CPs adsorption on K2CO3-AC at 50 oC
3.35 Langmuir (1-5), Freundlich and Temkin’s isotherm models 142
parameters for CPs adsorption on CAC at 30 oC
3.36 Langmuir (1-5), Freundlich and Temkin’s isotherm models 143
parameters for CPs adsorption on CAC at 40 oC
3.37 Langmuir (1-5), Freundlich and Temkin’s isotherm models 144
parameters for CPs adsorption on CAC at 50 oC
3.38 Comparison of maximum monolayer adsorption capacities 145
of CPs on various adsorbents
3.39 Pseudo-first-order kinetic model parameters for CPs adsorption 156
on K2C2O4-AC at 30 oC
3.40 Pseudo-second-order 1 and pseudo-second-order 2 kinetic model 158
parameters for CPs adsorption on K2C2O4-AC at 30 oC.

xi
3.41 Elovich equation parameters for CPs adsorption on K2C2O4-AC 159
at 30 oC
3.42 Pseudo-first-order kinetic model parameters for CPs adsorption 162
on CH3COONa-AC at 30 oC
3.43 Pseudo-second-order 1 and pseudo-second-order 2 kinetic model 167
parameters for CPs adsorption on CH3COONa-AC at 30 oC.
3.44 Elovich equation parameters for CPs adsorption on 170
CH3COONa-AC at 30 oC
3.45 Pseudo-first-order kinetic model parameters for CPs adsorption 173
on K2CO3-AC at 30 oC
3.46 Pseudo-second-order 1 and pseudo-second-order 2 kinetic model 178
parameters for CPs adsorption on K2CO3-AC at 30 oC.
3.47 Elovich equation parameters for CPs adsorption on K2CO3-AC 181
at 30 oC
3.48 Pseudo-first-order kinetic model parameters for CPs adsorption 184
on CAC at 30 oC
3.49 Pseudo-second-order 1 and pseudo-second-order 2 kinetic model 190
parameters for CPs adsorption on CAC at 30 oC.
3.50 Elovich equation parameters for CPs adsorption on CAC at 30 oC 193
3.51 Intraparticle diffusion model parameters for the adsorption 195
of CPs onto K2C2O4-AC
3.52 Intraparticle diffusion model parameters for the adsorption 197
of CPs onto CH3COONa-AC
3.53 Intraparticle diffusion model parameters for the adsorption 199
of CPs onto K2CO3-AC
3.54 Intraparticle diffusion model parameters for the adsorption 201
of CPs onto CAC
3.55 Thermodynamic parameters for the adsorption of CPs 205
onto the prepared and commercial ACs
xii
LIST OF FIGURES
Page
1.1 Diagrammatic representation of isotherm classification 22
2.1 Prosopis africana seed hulls 40
2.2 Research activities flow diagram 44
2.3 Schematic diagram of preparation of activated carbon 46
experimental rig
3.1 Correlation between predicted and experimental data of 58
K2C2O4-AC yield
3.2 Correlation between predicted and experimental data for 59
(a) 4C2MP (b) 2,4,6-TCP (c) 2,4-DCP and (d) 4CP adsorption
by K2C2O4-AC
3.3 A 3-D response surface plots for the yield of K2C2O4-AC 62
Showing the effect of time and temperature of activation (IR = 2.10)
3.4 A 3-D response surface plot for effect of temperature 68
and impregnation ratio at fixed time (t=100 min) on adsorption of
(a) 4C2MP (b) 2,4,6-TCP (c) 2,4-DCP and (d) 4CP by K2C2O4-AC
3.5 A 3-D response surface plots for the yield of CH3COONa-AC 72
showing the effect of time and temperature of activation (IR = 2.10)
3.6 Correlation between predicted and experimental data of 75
CH3COONa-AC yield
3.7 Correlation between predicted and experimental data for 77
(a) 4C2MP (b) 4CP (c) 2,4-DCP and (d) 2,4,6-TCP adsorption
by CH3COONa-AC
3.8 A 3-D response surface plot for effect of temperature 79
and impregnation ratio at fixed time (t=100 min) on adsorption of
(a) 4C2MP (b) 4CP (c) 2,4-DCP and (d) 2,4,6-TCP by CH3COONa-AC
3.9 Correlation between predicted and experimental data of 82
K2CO3-AC yield
3.10 A 3-D response surface plots for the yield of K2CO3-AC 84
showing the effect of time and temperature of activation (IR = 2.10)
xiii
3.11 Correlation between predicted and experimental data for 88
(a) 4C2MP (b) 2,4-DCP (c) 4CP and (d) 2,4,6-TCP adsorption
by K2CO3-AC
3.12 A 3-D response surface plot for effect of temperature and 91
impregnation ratio at fixed time (t=100 min) on adsorption of
(a) 4C2MP (b) 2,4-DCP (c) 4CP and (d) 2,4,6-TCP by K2CO3-AC
3.13 The SEM micrograph of the raw PASH sample (5000 X) 93
3.14 The SEM micrograph of K2C2O4-AC (5000 X) 93
3.15 The SEM micrograph of CH3COONa-AC (5000 X) 94
3.16 The SEM micrograph of K2CO3-AC (5000 X) 95
3.17 The SEM micrograph of CAC (5000 X) 96
3.18 (a). N2 adsorption and desorption isotherms at 77 K 99
(b) BJH pore size distribution for the optimized K2C2O4-AC
3.19 (a). N2 adsorption and desorption isotherms at 77 K 100
(b) BJH pore size distribution for the optimized CH3COONa-AC
3.20 (a). N2 adsorption and desorption isotherms at 77 K 101
(b) BJH pore size distribution for the optimized K2CO3-AC
3.21 (a). N2 adsorption and desorption isotherms at 77 K 102
(b) BJH pore size distribution for the CAC
3.22 The FTIR spectrum of PASH precursor 105
3.23 The FTIR spectrum of K2C2O4-AC 106
3.24 The FTIR spectrum of CH3COONa-AC 107
3.25 The FTIR spectrum of K2CO3-AC 108
3.26 The FTIR spectrum of CAC 109
3.27 Effect of initial solution pH on CPs adsorption onto K2C2O4-AC 110
3.28 Effect of initial solution pH on CPs adsorption onto 111
CH3COONa-AC
3.29 Effect of initial solution pH on CPs adsorption onto K2CO3-AC 111

xiv
3.30 Effect of initial solution pH on CPs adsorption onto CAC 111
3.31 Effect of contact time on 4CP2MP adsorption onto K2C2O4-AC 113
at various initial concentrations (30–350 mg L-1) at 30 oC
3.32 Effect of contact time on 2,4,6-TCP adsorption onto K2C2O4-AC 114
at various initial concentrations (30–350 mg L-1) at 30 oC
3.33 Effect of contact time on 2,4-DCP adsorption onto K2C2O4-AC 114
at various initial concentrations (30–350 mg L-1) at 30 oC
3.34 Effect of contact time on 4CP adsorption onto K2C2O4-AC 115
at various initial concentrations (30–350 mg L-1) at 30 oC
3.35 Effect of contact time on 4CP2MP adsorption onto 117
CH3COONa-AC at various initial concentrations (30–350 mg L-1)
at 30 oC
3.36 Effect of contact time on 2,4,6-TCP adsorption onto 118
CH3COONa-AC at various initial concentrations (30–350 mg L-1)
at 30 oC
3.37 Effect of contact time on 2,4-DCP adsorption onto 118
CH3COONa-AC at various initial concentrations (30–350 mg L-1)
at 30 oC
3.38 Effect of contact time on 4CP adsorption onto CH3COONa-AC 119
at various initial concentrations (30–350 mg L-1) at 30 oC
3.39 Effect of contact time on 4CP2MP adsorption onto K2CO3-AC 120
at various initial concentrations (30–350 mg L-1) at 30 oC
3.40 Effect of contact time on 2,4,6-TCP adsorption onto K2CO3-AC 120
at various initial concentrations (30–350 mg L-1) at 30 oC
3.41 Effect of contact time on 2,4-DCP adsorption onto K2CO3-AC 121
at various initial concentrations (30–350 mg L-1) at 30 oC
3.42 Effect of contact time on 4CP adsorption onto K2CO3-AC 121
at various initial concentrations (30–350 mg L-1) at 30 oC
3.43 Effect of contact time on 4CP2MP adsorption onto CAC 122
at various initial concentrations (30–350 mg L-1) at 30 oC
xv
3.44 Effect of contact time on 2,4,6-TCP adsorption onto CAC 122
at various initial concentrations (30–350 mg L-1) at 30 oC
3.45 Effect of contact time on 2,4-DCP adsorption onto CAC 123
at various initial concentrations (30–350 mg L-1) at 30 oC
3.46 Effect of contact time on 4CP adsorption onto CAC 123
at various initial concentrations (30–350 mg L-1) at 30 oC
3.47 Effect of solution temperature on CPs adsorption onto 124
K2C2O4-AC
3.48 Effect of solution temperature on CPs adsorption onto 125
CH3COONa-AC
3.49 Effect of solution temperature on CPs adsorption onto K2CO3-AC 125
3.50 Effect of solution temperature on CPs adsorption onto CAC 125
3.51 Linearized plots of pseudo-first-order kinetic model for 149
(a) 4C2MP (b) 2,4,6-TCP (c) 2,4-DCP and (d) 4CP adsorption on
K2C2O4-AC at 30 oC
3.52 Linearized plots of pseudo-second-order 1 kinetic model for 151
(a) 4C2MP (b) 2,4,6-TCP (c) 2,4-DCP and (d) 4CP adsorption on
K2C2O4-AC at 30 oC
3.53 Linearized plots of pseudo-second-order 2 kinetic model for 153
(a) 4C2MP (b) 2,4,6-TCP (c) 2,4-DCP and (d) 4CP adsorption on
K2C2O4-AC at 30 oC
3.54 Linearized plots of Elovich equation kinetic model for 155
(a) 4C2MP (b) 2,4,6-TCP (c) 2,4-DCP and (d) 4CP adsorption on
K2C2O4-AC at 30 oC
3.55 Linearized plots of pseudo-first-order kinetic model for 161
(a) 4C2MP (b) 2,4,6-TCP (c) 2,4-DCP and (d) 4CP adsorption on
CH3COONa-AC at 30 oC
3.56 Linearized plots of pseudo-second-order 1 kinetic model for 164
(a) 4C2MP (b) 2,4,6-TCP (c) 2,4-DCP and (d) 4CP adsorption on
CH3COONa-AC at 30 oC
xvi
3.57 Linearized plots of pseudo-second-order 2 kinetic model for 166
(a) 4C2MP (b) 2,4,6-TCP (c) 2,4-DCP and (d) 4CP adsorption on
CH3COONa-AC at 30 oC
3.58 Linearized plots of Elovich equation kinetic model for 169
(a) 4C2MP (b) 2,4,6-TCP (c) 2,4-DCP and (d) 4CP adsorption on
CH3COONa-AC at 30 oC
3.59 Linearized plots of pseudo-first-order kinetic model for 172
(a) 4C2MP (b) 2,4,6-TCP (c) 2,4-DCP and (d) 4CP adsorption on
K2CO3-AC at 30 oC
3.60 Linearized plots of pseudo-second-order 1 kinetic model for 175
(a) 4C2MP (b) 2,4,6-TCP (c) 2,4-DCP and (d) 4CP adsorption on
K2CO3-AC at 30 oC
3.61 Linearized plots of pseudo-second-order 2 kinetic model for 177
(a) 4C2MP (b) 2,4,6-TCP (c) 2,4-DCP and (d) 4CP adsorption on
K2CO3-AC at 30 oC
3.62 Linearized plots of Elovich equation kinetic model for 180
(a) 4C2MP (b) 2,4,6-TCP (c) 2,4-DCP and (d) 4CP adsorption on
K2CO3-AC at 30 oC
3.63 Linearized plots of pseudo-first-order kinetic model for 183
(a) 4C2MP (b) 2,4,6-TCP (c) 2,4-DCP and (d) 4CP adsorption on
CAC at 30 oC
3.64 Linearized plots of pseudo-second-order 1 kinetic model for 186
(a) 4C2MP (b) 2,4,6-TCP (c) 2,4-DCP and (d) 4CP adsorption on
CAC at 30 oC
3.65 Linearized plots of pseudo-second-order 2 kinetic model for 188
(a) 4C2MP (b) 2,4,6-TCP (c) 2,4-DCP and (d) 4CP adsorption on
CAC at 30 oC
3.66 Linearized plots of Elovich equation kinetic model for 192
(a) 4C2MP (b) 2,4,6-TCP (c) 2,4-DCP and (d) 4CP adsorption on
CAC at 30 oC
3.67 Intraparticle diffusion model plot for (a) 4C2MP (b) 2,4,6-TCP 197
(c) 2,4-DCP and (d) 4CP adsorption on K2C2O4- AC at 30 oC

xvii
3.68 Intraparticle diffusion model plot for (a) 4C2MP (b) 2,4,6-TCP 199
(c) 2,4-DCP and (d) 4CP adsorption on CH3COONa-AC at 30 oC
3.69 Intraparticle diffusion model plot for (a) 4C2MP (b) 2,4,6-TCP 201
(c) 2,4-DCP and (d) 4CP adsorption on K2CO3- AC at 30 oC
3.70 Intraparticle diffusion model plot for (a) 4C2MP (b) 2,4,6-TCP 203
(c) 2,4-DCP and (d) 4CP adsorption on CAC at 30 oC
3.71 Regeneration of (a) K2C2O4-AC (b) CH3COONa-AC 209
(c) K2CO3-AC and (d) CAC

xviii
LIST OF ABBREVIATIONS
Symbol Description
AC Activated carbon
ACs Activated carbons
AGS Anaerobic granular sludge
ANOVA Analysis of variance
BET Brunauer-Emmett-Teller
BJH Barrett-Joyner-Halenda
CAC Commercial activated carbon
CBAC Corncob-based activated carbon
CCD Central composite design
CFAC Cattail fibre-based activated carbon
CH3COONa-AC Optimal activated carbon with sodium acetate
CSAC Coconut shell activated carbon
CHAC Coconut husk-based activated carbon
CP Chlorophenol
CPs Chlorophenols
CS-SA-CD Chemically modified chitosan
DOE Design of experiment
DS-AC Date stone activated carbon
FR Freundlich Isotherm
FTIR Fourier transmission infrared
GAC Granular activated carbon
HPO High pressure oxygen
xix
IR Impregnation ratio
IUPAC International Union of Pure and Applied Chemistry
K2CO3-AC Optimal activated carbon with potassium carbonate
K2C2O4-AC Optimal activated carbon with potassium oxalate
L1-L5 Langmuir adsorption isotherm (1-5)
LAC Loosestrife activated carbon
MPP Modified plantain peel
Np Number of points
OPEFB-AC Oil palm empty fruit bunch activated carbon
OPSAC Oil palm shell activated carbon
PASH Prosopis africana seed hull
PASH-AC Prosopis africana seed hull derived activated carbon
pHzpc Potency of hydrogen point of zero charge
PPC Palm pith carbon
rpm Revolution per minutes
RSBC Rice straw based carbon
RSD-AC Rattan sawdust based activated carbon
RSM Response surface methodology
RDW-AC Refused derived waste activated carbon
SEM Scanning electron spectroscopy
TGA Thermogravimetric analysis
TM Temkin Isotherm
USA United States of America
xx
Y Response
YPASH Percentage yield the activated carbon
Y4CP Percentage 4-Chlorophenol adsorption
YDCP Percentage 2,4-Dichlorophenol adsorption
YTCP Percentage 2,4,6-Trichlorophenol adsorption
Y4C2MP Percentage 4-chloro-2-methoxyphenol adsorption
2,4-DCP 2,4-Dichlorophenol
2,4,6-TCP 2,4,6-Trichlorophenol
2CP 2-Chlorophenol
2FI Two factor interaction
4C2MP 4-chloro-2-methoxyphenol
4CG 4-Chloroguaiacol
4CP 4-Chlorophenol

xxi
LIST OF SYMBOLS
Symbol Description Unit
A Temkin constant related to equilibrium binding energy L g-1
Ai Absorbance -
B Temkin constant related equilibrium heat of sorption J mol-1
bo Response model constant coefficients of design expert -
bii The quadratic coefficients -
bij The interaction coefficients -
bT Temkin constant related to heat of sorption J mol-1
Bt Boyd model constant -
c Solute or analyte concentration mg L-1
Cad Concentration adsorbed mg L-1
Cd Effluent sorbate concentration at minimum level mg L-1
Ce Chlorophenols concentration at equilibrium mg L-1
Ci Intraparticle diffusion model constant -
Co Chlorophenols concentration at equilibrium mg L-1
∆G Gibbs free energy kJ mol-1
∆H Enthalpy change kJ mol-1
KF Freundlich isotherm constant (mg1−n g−1Ln)
KL Energy of adsorption for Langmuir isotherm L mg-1
kip Diffusion rate constant mg g-1 h0.5
k1 Pseudo-first-order kinetic constant h-1
k2 Pseudo-second-order kinetic constant g mg-1 h-1
m Mass of adsorbent g
n Adsorption intensity related to Freundlich isotherm -
nc Number of center point -
N Number of data points -
xxii
p Path length of cell cm
𝑄𝑎0 Monolayer adsorption capacity related to Langmuir mg g-1
isotherm
qe Adsorption uptake at equilibrium mg g-1
qt Adsorption uptake at time t mg g-1
qcal Calculated adsorption capacity mg g-1
qexp Experimental adsorption capacity mg g-1
R Gas constant J mol-1 K
R2 Correlation coefficients -
RL Dimensionless separation factor -
∆S Entropy change J mol-1 K
t Time h
T Absolute temperature K
V Volume of solution L
W Mass of adsorbent g
xi, xj The coded values of the variables considered -
Y The predicted response -
Greek lette
α Distance of axial point from centre cm
χ2 Chi-square -
λ Wavelength cm
a Molar absorptivity L mg-1
cm-1
xxiii
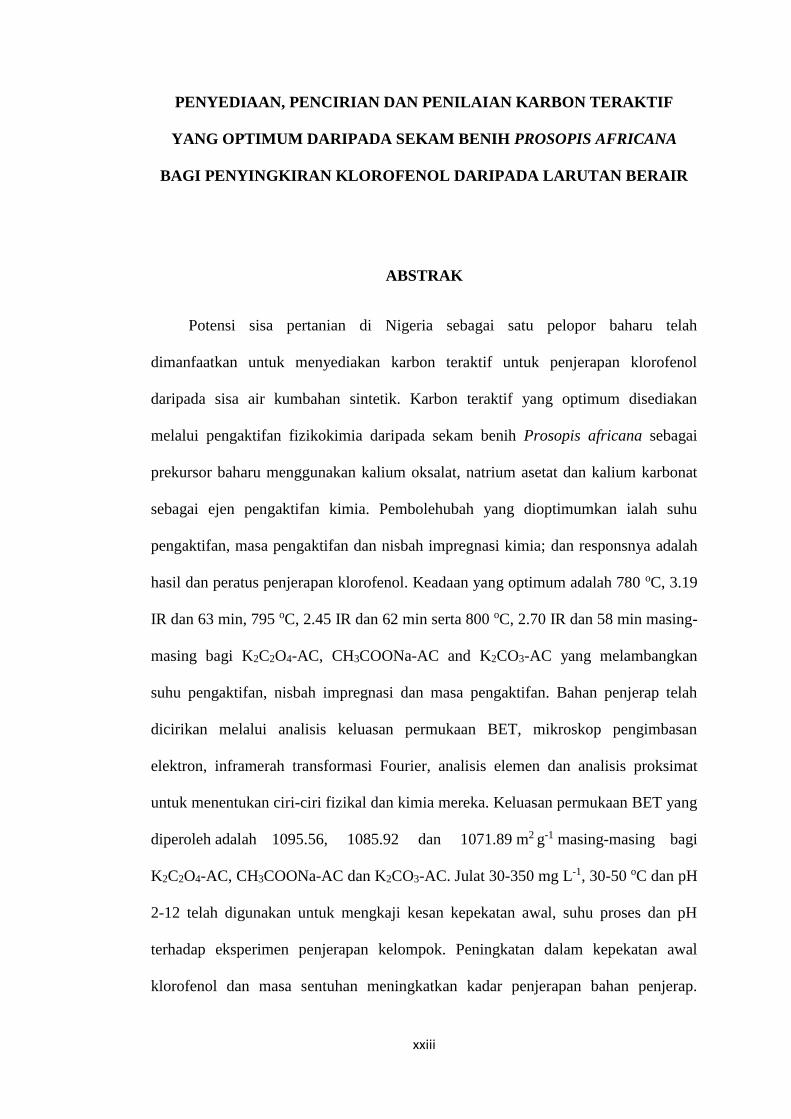
PENYEDIAAN, PENCIRIAN DAN PENILAIAN KARBON TERAKTIF
YANG OPTIMUM DARIPADA SEKAM BENIH PROSOPIS AFRICANA
BAGI PENYINGKIRAN KLOROFENOL DARIPADA LARUTAN BERAIR
ABSTRAK
Potensi sisa pertanian di Nigeria sebagai satu pelopor baharu telah
dimanfaatkan untuk menyediakan karbon teraktif untuk penjerapan klorofenol
daripada sisa air kumbahan sintetik. Karbon teraktif yang optimum disediakan
melalui pengaktifan fizikokimia daripada sekam benih Prosopis africana sebagai
prekursor baharu menggunakan kalium oksalat, natrium asetat dan kalium karbonat
sebagai ejen pengaktifan kimia. Pembolehubah yang dioptimumkan ialah suhu
pengaktifan, masa pengaktifan dan nisbah impregnasi kimia; dan responsnya adalah
hasil dan peratus penjerapan klorofenol. Keadaan yang optimum adalah 780 oC, 3.19
IR dan 63 min, 795 oC, 2.45 IR dan 62 min serta 800 oC, 2.70 IR dan 58 min masing-
masing bagi K2C2O4-AC, CH3COONa-AC and K2CO3-AC yang melambangkan
suhu pengaktifan, nisbah impregnasi dan masa pengaktifan. Bahan penjerap telah
dicirikan melalui analisis keluasan permukaan BET, mikroskop pengimbasan
elektron, inframerah transformasi Fourier, analisis elemen dan analisis proksimat
untuk menentukan ciri-ciri fizikal dan kimia mereka. Keluasan permukaan BET yang
diperoleh adalah 1095.56, 1085.92 dan 1071.89 m2 g-1 masing-masing bagi
K2C2O4-AC, CH3COONa-AC dan K2CO3-AC. Julat 30-350 mg L-1, 30-50 oC dan pH
2-12 telah digunakan untuk mengkaji kesan kepekatan awal, suhu proses dan pH
terhadap eksperimen penjerapan kelompok. Peningkatan dalam kepekatan awal
klorofenol dan masa sentuhan meningkatkan kadar penjerapan bahan penjerap.

xxiv
Kecekapan penyingkiran yang tertinggi bagi klorofenol ke atas bahan penjerap
adalah pada pH larutan awal yang rendah (pH ≤ 2) kerana kemudahan pengionan dan
variasi permukaan kimia yang dialami pada pH tersebut di atas pemukaan AC.
Isoterma keseimbangan kelompok dan maklumat kinetik telah dimodelkan,
mekanisme proses, termodinamik dan kajian penjanan semula telah dinilai.
Maklumat penjerapan keseimbangan telah dimodel dengan menggunakan lima jenis
bentuk persamaan Langmuir linear serta isoterma penjerapan Freundlich dan
Temkin. Dalam membandingkan kesepadanan setiap model isoterma, khi kuasa dua
(χ2) telah digabungkan dengan pekali korelasi (R2) untuk mewajarkan asas pemilihan
model penjerapan yang terbaik. Isoterma Langmuir-2>Freundlich>Temkin adalah
urutan yang terbaik yang menggambarkan maklumat penjerapan keseimbangan.
Model kinetic tertib-pseudo kedua adalah yang terbaik menggambarkan keseluruhan
proses penjerapan CP ke atas semua AC. Model peresapan intrapartikel juga telah
diaplikasikan untuk mengenal pasti mekanisme penjerapan tetapi daripada plot Boyd,
telah didapati bahawa penjerapan klorofenol ke atas semua AC kebanyakannya
ditentukan oleh peresapan zarah. Kajian penjerapan termodinamik mendedahkan
bahawa proses penjerapan adalah endotermik, spontan dan fizikal. Hasil penjanaan
semula menunjukkan bahawa bahan penjerap telah digunakan dengan jayanya untuk
lima kitaran penjerapan. Karbon teraktif komersial juga telah dikaji di bawah
keadaan yang sama untuk membandingkan kecekapan bahan penjerap yang telah
disediakan.
xxv
PREPARATION, CHARACTERIZATION AND EVALUATION OF
OPTIMAL ACTIVATED CARBONS DERIVED FROM PROSOPIS
AFRICANA SEED HULLS FOR THE REMOVAL OF CHLOROPHENOLS
FROM AQUEOUS SOLUTION
ABSTRACT
Potentials of an agricultural waste in Nigeria as a new precursor were
harnessed for preparation of activated carbon for the adsorption of chlorophenols
from synthetic wastewaters. Optimal activated carbons were prepared by
physicochemical activation from the seed hulls of Prosopis africana as a new
precursor using potassium oxalate, sodium acetate and potassium carbonate as the
chemical activating agents. The variables optimized were activation temperature,
activation time and chemical impregnation ratio (IR); and the responses were yield
and chlorophenols percentage adsorption. The optimal conditions were 780 oC, 3.19
IR and 63 min, 795 oC, 2.45 IR and 62 min as well as 800 oC, 2.70 IR and 58 mins
for K2C2O4-AC, CH3COONa-AC and K2CO3-AC respectively, denoting activation
temperature, impregnation ratio and activation time, respectively. The adsorbents
were characterized via BET surface area analysis, scanning electron microscopy,
Fourier transform infrared, elemental analysis and proximate analysis to determine
their physical and chemical characteristics. The BET surface
area of 1095.56, 1085.92 and 1071.89 m2 g-1 for K2C2O4-AC, CH3COONa-AC
and K2CO3-AC respectively were obtained. A range of 30-350 mg L-1, 30-50 oC and
pH 2-12 were used to study the effect of initial concentration, process temperature
and pH on the batch adsorption experiments. An increase in the initial concentration

xxvi
of the chlorophenols and contact time increased the adsorption uptake of the
adsorbents. Highest removal efficiency of the chlorophenols on to the adsorbents was
at lower initial solution pH (pH ≤ 2) attributed to ease of ionization and surface
chemistry variation experienced at that pH on surfaces of the ACs. Batch equilibrium
isotherms and kinetics data were modeled, the mechanism of the process,
thermodynamic and regeneration studies were evaluated. The equilibrium adsorption
data were modelled using five various forms of the linearized Langmuir equations as
well as Freundlich and Temkin adsorption isotherms. In comparing the suitability of
each isotherm model, chi square (χ2) was incorporated with the correlation
coefficient (R2) to justify the basis for selecting the best adsorption model.
Langmuir-2>Freundlich>Temkin isotherms was the best order that described the
equilibrium adsorption data. Pseudo-second-order kinetic model best described the
entire CPs adsorption processes on all the ACs. Intraparticle diffusion model was
also applied to identify the adsorption mechanism but from Boyd plot, it was found
that the chlorophenols adsorption on all the ACs was mainly governed by particle
diffusion. Adsorption thermodynamic studies revealed the adsorption processes to be
endothermic, spontaneous and physical. The regeneration results revealed that the
adsorbents were used successfully for five cycles of adsorption. Commercial
activated carbon was also studied under same condition to compare the efficiency of
the prepared adsorbents.

1
CHAPTER ONE
INTRODUCTION
1.0 Research overview
Presented in this chapter is an overview of the research background. The scope
covers the current scenario on water pollution and problems of industrial effluents
(mainly paper and textile) in Nigeria. The need to find more economical way of
effectively solving the problem was described focusing on adsorption by activated
carbons derived from agricultural by-products. Common factors affecting the
preparation of activated carbons are also reviewed. The problem statement and the
objectives of this research are also presented.
1.1 Water pollution and industrial effluents
Water is crucial to life, its availability is also essential for agriculture and
ensures the sustainable increase of grain yield as well (Lu et al., 2015). Apart from
drinking and agriculture, water is also the solvent used by nature in biological
chemistry (Ma et al., 2015). Although the greater part of earth is surrounded by
water, only a fraction of it is appropriate for drinking with only about one quarter of
the world’s population having access to hygienic drinking water according to world
health organization (WHO) estimation, with the problem more pronounced in
developing countries (Hamad et al., 2011).
Recently, one of the most troubling environmental challenges bedeviling
several developing countries is water pollution; with numerous streams and rivers
being polluted more often by natural and artificial activities. Water pollution

2
contaminates streams, bays, lakes or oceans by hazardous substances that have direct
effect on living species (Galadima et al., 2011).
Most of the customary sources for fresh water are revealed to be polluted in
Nigeria, leading to fatal outbreak of diseases. As reported by previous researchers,
about 19 % of the whole Nigerian population is affected, with some rural
communities having up to 50 % occurrence (Umeh et al., 2004).
Significant consideration was given with regard to the recycle and reuse of
wastewater as a result of the increasing water demand. Thousands of chemical
contaminants have been found in the wastewater with many of them having organic
origin (Annadurai et al., 2000). Chlorophenols belong to a class of those
contaminants with organic origin, widely used in producing wood preservatives,
biocides as well as pesticides (Bae et al., 2002).
1.1.1 Chlorophenols and their sources
Chlorophenols (CPs) are a group of organochlorides of phenol containing one
or more covalently bonded chlorine atoms, which can be divided into five groups
namely; mono-chlorophenols (2-CP, 3-CP, 4-CP), dichlorophenols (DCPs),
trichlorophenols (TCPs), tetrachlophenols (TeCPs) and pentachlorophenols (PCPs)
(Fan et al., 2015). They pose severe health hazard by affecting human nervous as
well as respiratory systems. They also have strong odor, not readily biodegradable,
persistent in the environment as well as toxic and carcinogenic features (Armenante
et al., 1999; Tan et al., 2009). Sources of these compounds include waste water as a
result of industrial activities such as pharmaceutical, petrochemical, plastic, wood
preserving, pesticide, iron, steel, textile as well as paper industries (Fattahi et al.,
2007; Hamad et al., 2010). Additional sources of chlorophenols in the environs are;
3
combustion of organic matters (Al-Thani et al., 2007), burning of urban waste (El-
Sayed et al., 2009) as well as biodegradation of pesticides (Czaplicka, 2004).
Due to the increase in industrialization and agriculture in Nigeria, considerable
amount of pollution to many rivers in the country also increased tremendously
especially from textile and paper industries.
1.1.1.1 Paper Industrial Effluents
Paper and pulp mills are among the major sources of industrial pollution
worldwide. Pulping is synonymous to the process of treating wood raw materials
either chemically or mechanically in order to separate hemicelluloses and cellulose
fiber and at same time improve paper quality. A large number of organic pollutants
including chlorophenols that are very toxic and undesirable are present in waste
waters generated from the pulp and paper mills (Lawrence & Yang, 2006).
Brightening and whitening of the pulp (by removing residual lignin) involve different
stages with bleaching among the processes employed. Toxicity arises from the
bleaching process where chlorine and other chlorinated compounds are widely used
(Sharma et al., 1996). Some chlorinated phenolic compounds like guaiacols,
catechols, phenols and vanillin were identified in pulp mill bleaching effluents
(Sharma & Kumar, 1999).
1.1.1.2 Textile industrial effluents
Another source of water pollution by chlorophenols and other toxic substances
are textile industries; with Nigeria witnessing a considerable development in these
industries. Phenolic compounds are common contaminants found in the water
streams of textile industry. These hazardous wastes are also released by industries

4
such as chemicals, petrochemicals, petroleum refineries, pharmaceuticals as well as
phenolic resins (Gao & Wang, 2007). Presence of these phenolic compounds can be
a hindrance to the use of water (Ioannidou & Zabaniotou, 2007) with them being
mutagenic, carcinogenic and resistant to biodegradation (Wang & Zhu, 2007).
1.1.2 Properties of chlorophenols
With the exception of 2-chlorophenol, other chlorophenols are solids, with
their water solubility decreasing with increase in the amount of chlorine atoms. Their
acidity is weak, yielding salts that are highly soluble in water when reacted with
alkaline metals such as sodium and potassium (Czaplicka, 2004). Some
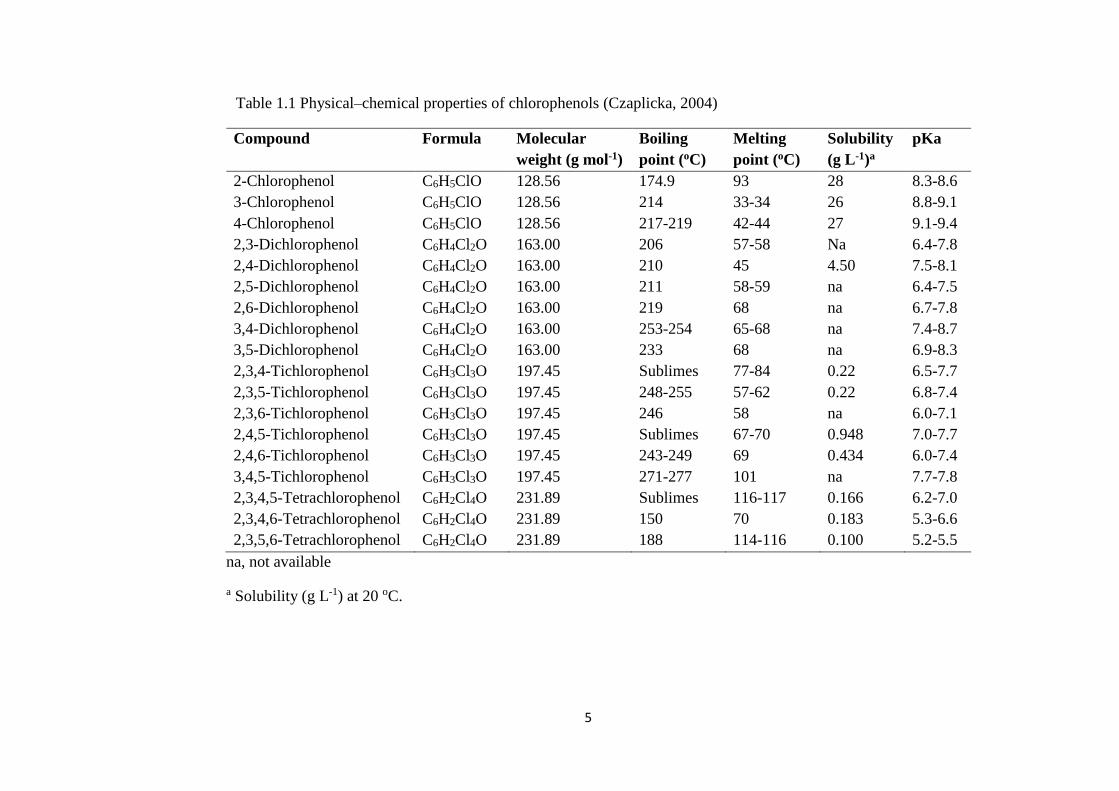
chlorophenols properties are described in Table 1.1.
1.1.3 Toxic effect of chlorophenols
Toxicity of chlorophenols is the extent to which they inhibit a chemical
reaction or pollute water, land and/or air severely. The chlorophenols toxicity was
influenced by the extent of chlorination as well as chlorine atoms location relative to
the hydroxyl groups (Czaplicka, 2004).
It was reported that chlorophenols with chlorine atoms at the positions 2- or
2,6- relative to the hydroxyl group were less immune to microbial degradation than
their isomers with chlorine atoms at positions 3- or 3,5- (Liu et al., 1982; Saito et al.,
1991). Chlorophenols with the chlorine atom at the position 2- were also reported to
be less toxic than other chlorophenols (Czaplicka, 2004).
5
Table 1.1 Physical–chemical properties of chlorophenols (Czaplicka, 2004)
Compound Formula Molecular
weight (g mol-1)
Boiling
point (oC)
Melting
point (oC)
Solubility
(g L-1)a
pKa
2-Chlorophenol C6H5ClO 128.56 174.9 93 28 8.3-8.6
3-Chlorophenol C6H5ClO 128.56 214 33-34 26 8.8-9.1
4-Chlorophenol C6H5ClO 128.56 217-219 42-44 27 9.1-9.4
2,3-Dichlorophenol C6H4Cl2O 163.00 206 57-58 Na 6.4-7.8
2,4-Dichlorophenol C6H4Cl2O 163.00 210 45 4.50 7.5-8.1
2,5-Dichlorophenol C6H4Cl2O 163.00 211 58-59 na 6.4-7.5
2,6-Dichlorophenol C6H4Cl2O 163.00 219 68 na 6.7-7.8
3,4-Dichlorophenol C6H4Cl2O 163.00 253-254 65-68 na 7.4-8.7
3,5-Dichlorophenol C6H4Cl2O 163.00 233 68 na 6.9-8.3
2,3,4-Tichlorophenol C6H3Cl3O 197.45 Sublimes 77-84 0.22 6.5-7.7
2,3,5-Tichlorophenol C6H3Cl3O 197.45 248-255 57-62 0.22 6.8-7.4
2,3,6-Tichlorophenol C6H3Cl3O 197.45 246 58 na 6.0-7.1
2,4,5-Tichlorophenol C6H3Cl3O 197.45 Sublimes 67-70 0.948 7.0-7.7
2,4,6-Tichlorophenol C6H3Cl3O 197.45 243-249 69 0.434 6.0-7.4
3,4,5-Tichlorophenol C6H3Cl3O 197.45 271-277 101 na 7.7-7.8
2,3,4,5-Tetrachlorophenol C6H2Cl4O 231.89 Sublimes 116-117 0.166 6.2-7.0
2,3,4,6-Tetrachlorophenol C6H2Cl4O 231.89 150 70 0.183 5.3-6.6
2,3,5,6-Tetrachlorophenol C6H2Cl4O 231.89 188 114-116 0.100 5.2-5.5
na, not available
a Solubility (g L-1) at 20 oC.
6
1.1.4 Treatment of industrial effluents
The contamination of water by organic pollutants is a world-wide problem that
still seeks an effective solution (Tomei et al., 2015). The development of effective
treatment processes over a wide diversity of industrial wastewaters containing highly
toxic chlorinated organic pollutants is gaining a growing interest (Puyol et al., 2015).
Processes such as membrane separation (Amini et al., 2011), photo-Fenton
degradation (Ayodele et al., 2012), sonochemical degradation (Abbasi & Asl, 2008),
electrochemical degradation (Fan et al., 2008), coagulation, among others have been
applied, but adsorption on activated carbon surpassed all of them as the best process
in wastewater treatment due to its simplicity in design and applicability, fast
adsorption kinetics, effectiveness and universal nature (Ali et al., 2012). It can be
applied to remove both soluble and insoluble organic pollutants with about 99.9%
efficiency but the high price of commercial activated carbon calls for search to
alternatives or substitutes for the adsorbent (Al-Degs et al., 2009).
Nigeria and many parts of the world are blessed with abundance of minerals
and organic resources that are lying fallow and most often regarded and disposed off
as wastes (El-Hendawy, 2005). These include agricultural and industrial byproducts;
research has shown that these agricultural wastes have the potentials to be
transformed into good and useful adsorbents for effective wastewater treatment
(Halim et al., 2012).
Adsorption process though predominantly a physical process has often
exhibited chemisorptions capability, depending on the forces involved. Physical
adsorption is non-specific (any adsorbate-adsorbent interaction) and takes place at
enthalpy between 10 to 20 kJ mol-1 while specific chemisorptions occurs between

7
enthalpy of 40 to 400 kJ mol-1 (Kołodyńska et al., 2012; Saha et al., 2010).
Adsorption process is effective, easy to use, and its treated wastewater is reusable but
the expensive commercial activated carbon used as adsorbent is its major
disadvantage.
Activated carbon is majorly an amorphous (with little microcrystalline
structure) carbon material exhibiting high porosity and extended internal surface
area. It can be prepared by either physical or chemical activation (or both) through
pyrolysis of carbonaceous material in an inert atmosphere. The preparation entails
elimination of non-carbon materials such as sulfur, hydrogen, oxygen and nitrogen as
vapor leaving mainly carbon atoms; before the completion of the activation process,
the rearranged carbon atoms are developed into porous material with high and
extended surface area (Rambabu et al., 2013). Activated carbons are obtained mainly
in powder (small internal surface area) and granular (larger internal surface area)
forms; which are associated with large and smaller pores, respectively. It has wide
applicability which includes its use in wastewater treatment, pharmaceutical
industries, paper and pulp mill, automobile industries, hydrometallurgy, medicine,
food and oil industries.
Despite their prolific use, certain problems with the high costs of commercial
activated carbons have limited their applications. The high production cost is largely
due to non-renewability and expensiveness of the starting materials such as
bituminous coal, lignite and petroleum coke which prompted increasing research
interest in utilizing low cost materials such as agricultural and industrial byproducts
for the production of activated carbons.
8
1.2 Wastewater treatment methods
Water pollution irrespective of the source (ocean, lakes, rivers and
underground reservoirs) is caused by the presence of chemicals, particulate or
bacterial matter that degrades its purity and quality limiting the availability of pure
water for agricultural, domestic, industrial, public and other uses; therefore,
protecting clean surface water has become a security issue as it is imperative for the
custodian of natural resources (Cheng & Jia, 2010; Werner et al., 2012).
Since no particular technique is universally suitable in all pollutant removal,
it is therefore crucial to understand the wastewater source, typical wastewater
composition and the process of generating the waste within the facility so as to know
the pretreatment ramifications as well as the method that will be suitable (Ali et al.,
2012).
Biological, chemical and physical are among the numerous techniques engaged
for the removal of contaminants from wastewaters (Ghoreishi & Haghighi, 2003).
1.2.1 Biological Method
This technique has long been employed in the chemical industries for
wastewater treatment with bacteria and some microorganisms being employed for
biological treatments through assimilation to remove pollutants. These bacteria have
ability to provide the required energy needed for microbial metabolism and building
block for cell synthesis through the use of diverse wastewater constituents. Through
this metabolic activity, pollutants are removed as by products, raw materials for the
metabolism and as generated products in chemical processing industries. This
technique requires low capital and operating costs when compared with chemical and
physical techniques, degrades or destroys organic pollutants and reduces aquatic

9
toxicity. However, the method is not flexible in operation and design, may require
large areas of land for the operation (Fayidh et al., 2011) and anaerobic breakdown
yields methane and hydrogen sulphide.
1.2.2 Chemical method
Chemical treatment methods improve water quality through reactions which
require certain chemicals (Sabur et al., 2012). Some of the chemical treatment
processes include coagulation, flocculation, ozonation and electrochemical
destruction which are very effective in treating many industrial wastewaters but
might generate waste (sludge) which will further pose a disposal problem. The need
for some chemical reagents (chlorine, aluminum sulfate-alum, lime etc.) and energy
for the reaction often incur costs in the process which makes it unattractive (Hassan
et al., 2009).
1.2.3 Physical method
Physical method of wastewater treatment consists of processes that do not
require rigorous biological or chemical changes but predominantly physical
phenomena to upgrade wastewater quality. Adsorption by activated carbon,
membrane filtration, ion exchange, irradiation and electrokinetic coagulation are
some of the physical treatment methods with adsorption being the most superior
compared to other methods because of its cheapness, high efficiency, simplicity in
design, ability to treat pollutants in more concentrated form and ease of operation
(Anbia et al., 2010 ; Li et al., 2011a). Another advantage of adsorption is, it does not
lead to the formation of toxic substances (Crini, 2006). Adsorption process became a
major industrial separation technique due to the advent of cheaper, effective and

10
efficient precursors that can serve as an option to the high price of commercial
activated carbon (Crini, 2006).
1.3. Adsorption
The accumulation of material at the boundary between two phases (gas–solid
or liquid–solid boundary) is referred to as adsorption. Adsorbate is the material that
accumulates at the interface while the solid on which adsorption takes place is
termed as adsorbent (Dabrowski, 2001). Two key forms of adsorption are physical
and chemical. Chemical adsorption or chemisorption is mainly described by being
irreversible as well as the development of a strong chemical connections between
adsorbates ions or molecules to the surface of adsorbent, which is mainly due to
swapping of electrons, physical adsorption or physisorption on the other hand is
characterized by being reversible in most cases as well as weaker van der Waals
bond between adsorbent and adsorbate (Allen & Koumanova, 2005).
pH as well as ionic strength are among the key factors impacting the phenolic
compounds adsorption. At lower pH, the uptake of phenolic compounds by different
adsorbents is intensified due to the phenols being undissociated (Caqueret et al.,
2008; Dargaville et al., 1996; García-Araya et al., 2003; Grant & King, 1990; Mohan
& Karthikeyan, 1997). Hydrogen may play an important role (Bretag et al., 2009;
Chanda et al., 1983; Grohmann et al., 1999; Kammerer et al., 2010a; Ku & Lee,
2000; Liu et al., 2010a; Navarro et al., 2008; Pompeu et al., 2010). Adsorption
decreases at higher pH due to occurrence of hydroxyl and carboxyl groups
dissociation (Fu et al., 2005; Yoon et al., 1997). Adsorbate characteristics also have
impact on adsorption (Brune et al., 1999; Cheng et al., 2006; Geng et al., 2009; Li et
al., 2009; Pan et al., 2005).

11
1.3.1 Activated carbon
An amorphous high porous carbonaceous material is generally termed as
activated carbon. Its materials are very well known for their versatile surface
characteristics with an extended inter particulate surface area, possessing small
hydrophobic graphite layers (María et al., 2011) thus making it useful for both
adsorption and catalytic applications (Bansal & Goyal, 2005; Kazmierczak-Razna et
al., 2015). Activated carbon is prepared by partial combustion or pyrolysis of
carbonaceous materials (wood, coal char, almond, coconut, or walnut shells etc.). To
date, it has been the most prevalent adsorbent material (Li et al., 2015) with popular
applications in industrial and wastewater treatment (Bhatnagar & Sillanpää, 2010;
Cheng et al., 2015), air pollution remediation (Chen et al., 2012), pharmaceuticals
(Delgado et al., 2012), oil and gas industry (Ali et al., 2012) and food processing
(Nasehi et al., 2012). Powder and granular are the two most common and widely
used physical forms of activated carbon. Fiber is another form that is attracting
increasing attention, mostly attained from petroleum pitch, isotropic coal as well as
cloths (Rodriguez-Reinoso et al., 1995).
1.3.1.1 Demand for activated carbon
As at 2003, the global consumption of activated carbon was put at 350,000 tons
with an estimated rise of 7 % annually (Maroto-Valer et al., 2003). An estimated
600,000 tons was predicted to be in demand for consumption in the year 2015 based
on that yearly 7 % annual rise in consumption. This rapid rise in world demand
reflects the enormous increase in the applications found for activated carbon. The
demand is also on the increase in developing countries like Nigeria. In Ghana for
instance, about 4,681,866 kg of activated carbon valued at 12,706,290,390 c was
12
imported for use between 1992 and 1997 (Lartey & Acquah, 1999). There are strong
indications that Nigeria, South Africa and a few other African countries have statistic
of importation similar to Ghana if not more because of the several industries in those
places that require the use of ACs.
1.3.1.2 Raw materials availability in Nigeria
Nigeria is one country blessed with abundant human, mineral and agricultural
resources. The country is rich in oil but before the advent of oil, the economy was
being sustained by agriculture. Among the agricultural produce is Prosopis africana.
Others include palm kernel, cocoa, cotton, rubber and groundnuts being produced all
over the country. Presently, the use of agricultural by-products for activated carbon
production has been noticed by many researchers (Yahya et al., 2015) for adsorption
of heavy metals and other contaminants. Prosopis africana is one of the many
agricultural by-products that are very abundant in Nigeria and other Savannah
regions of West Africa.
1.3.1.3 Precursors for activated carbon
Almost all the precursors that can be used for the ACs preparation are
carbonaceous materials. Features of some materials and the type of ACs usually
produced from them are shown in Table 1.2.

13
Table 1.2 Properties of some raw materials used in ACs preparation (Streat et al., 1995)
Raw
material
Carbon
(mass %)
Volatiles
(mass %)
Density
(cm3 g-1)
Ash
(mass %)
Texture of activated
carbon
Soft wood 40-45 55-60 0.4-0.5 0.3-1.1 Soft, large pore volume
Hard wood 40-42 55-60 0.55-0.8 0.3-1.2 Soft, large pore volume
Lignin 35-40 58-60 0.3-0.4 - Soft, large pore volume
Nutshells 40-45 55-60 1.40 - Hard, large micropore
volume
Lignite 55-70 25-40 1.0-1.35 5-6 Hard, small pore volume
Soft coal 65-80 20-30 1.25-1.5 2-12 Medium hard, medium
pore volume
Petroleum
coke
70-85 15-20 1.35 0.5-0.7 Medium hard, medium
pore volume
Semi-hard
coal
70-75 10-15 1.45 5-15 Hard, large pore volume
Hard coal 85-95 5-15 1.5-1.8 2-15 Hard, large pore volume
Since carbon is the major component of activated carbon, the fixed carbon
content, volatile component and ash content of the material are of great importance;
also the carbon material should have high abrasion resistance, non hazardous, cheap
and readily available. The nature of the carbon material determines the type of
activated carbon produced (Kılıç et al., 2012). The seed hulls of Prosopis africana
were revealed to have high carbon and low inorganic contents qualifying it to be a
good precursor for AC preparation as adsorbent.
Commercial activated carbons are mostly expensive due to high cost and non-
renewable starting materials such as bituminous coal, lignite and petroleum coke
(Gao et al., 2015). To augment for those shortcomings, other potential raw-materials
that are renewable and of commercial capability have been found and utilized as
precursors for AC production as shown in Table 1.3.
14
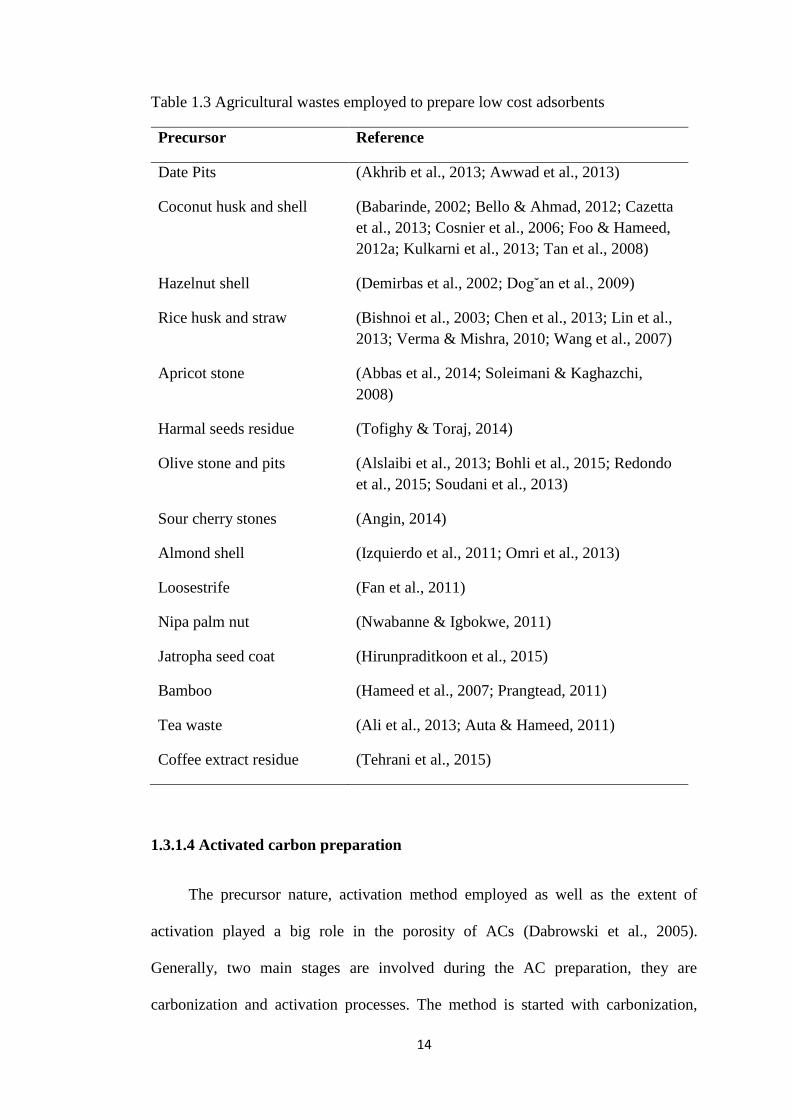
Table 1.3 Agricultural wastes employed to prepare low cost adsorbents
Precursor Reference
Date Pits (Akhrib et al., 2013; Awwad et al., 2013)
Coconut husk and shell (Babarinde, 2002; Bello & Ahmad, 2012; Cazetta
et al., 2013; Cosnier et al., 2006; Foo & Hameed,
2012a; Kulkarni et al., 2013; Tan et al., 2008)
Hazelnut shell
Rice husk and straw
(Demirbas et al., 2002; Dog˘an et al., 2009)
(Bishnoi et al., 2003; Chen et al., 2013; Lin et al.,
2013; Verma & Mishra, 2010; Wang et al., 2007)
Apricot stone (Abbas et al., 2014; Soleimani & Kaghazchi,
2008)
Harmal seeds residue (Tofighy & Toraj, 2014)
Olive stone and pits (Alslaibi et al., 2013; Bohli et al., 2015; Redondo
et al., 2015; Soudani et al., 2013)
Sour cherry stones (Angin, 2014)
Almond shell (Izquierdo et al., 2011; Omri et al., 2013)
Loosestrife (Fan et al., 2011)
Nipa palm nut (Nwabanne & Igbokwe, 2011)
Jatropha seed coat (Hirunpraditkoon et al., 2015)
Bamboo (Hameed et al., 2007; Prangtead, 2011)
Tea waste (Ali et al., 2013; Auta & Hameed, 2011)
Coffee extract residue (Tehrani et al., 2015)
1.3.1.4 Activated carbon preparation
The precursor nature, activation method employed as well as the extent of
activation played a big role in the porosity of ACs (Dabrowski et al., 2005).
Generally, two main stages are involved during the AC preparation, they are
carbonization and activation processes. The method is started with carbonization,

15
aimed at lessening the lignocellulosic precursors of impurities by volatilizing the
non-carbonaceous portion in a specifically designed furnace, at temperature usually
lower than 800 oC without oxygen so as to enhance the quality of the resulting char
(Cagnon et al., 2009; Daud et al., 2003; Lua et al., 2006; Sun & Jiang, 2010; Tsai et
al., 1998). After carbonization, the next process is activation; Activation process
refers to the preparation of the active site by the use of a gas such as CO2 in order to
develop the ACs pore volume as well as its surface area.
Carbonization
This involves removal of moisture content, volatile organic materials
(alcohols, carboxylic acid, and phenol) or non carbon elements like sulfur, nitrogen,
oxygen and hydrogen from the precursor through pyrolysis in an atmosphere that is
static. Heating of the furnace may be controlled for higher yield and better quality of
char produced; from room temperature to 200 oC, then to 400-500 oC (Lozano-
Castelló et al., 2001; Wereko-Brobby & Hagan, 1996; Yuen & Hameed, 2009). The
resulting char undergoes irregular arrangement of its residual aromatic sheets
resulting to interstices between the carbon materials (Bansal & Goyal, 2005). In
order to obtain low volatilization and a high char yield, low heating rates (10–15 oC
min-1) are used. Char has a high fixed carbon content which is important for
producing activated carbon (Norhusna et al., 2013). Lower heating rate will increase
dehydration and improve the stabilization of the polymeric components (Ioannidou
& Zabaniotou, 2007; Suhas et al., 2007). However, the microporosity of char has
been found to be independent of the precursor composition and the carbonization
heating rate (Suhas et al., 2007).

16
Activation
The activation process is about enhancing the pore volume, enlarging the
diameter of pores and increasing the porosity of activated carbon (Norhusna et al.,
2013). It involves the conversion of carbon materials (char) into porous substance
with increased surface area by clearing the char pore blockages through a
gasification process with carbon dioxide or steam as activating agents or their
mixture. The temperature of the gasification usually ranges from 800-1200 oC
depending on the precursor used (Crini, 2006; Gupta & Suhas, 2009; Rambabu et al.,
2013). Activation process can be physical, chemical or physiochemical (a
combination of physical and chemical activation).
Physical activation constitute partial gasification of char (resulting from raw
material carbonization in a static atmosphere) with steam, CO2 or their mixture
(Rodriguez-Reinoso et al., 1995). During physical activation, the oxidizing agents
react with the carbon materials, which is favorable at a very high temperature (>900
oC) (Yuen & Hameed, 2009). The process is environmentally benign due to non
production of waste products since gaseous agents are used, although the process is
slow with high energy demand and carbon yield (Arami-Niya et al., 2011). For
physical activation, steam is more effective than CO2, because activated carbon with
a relatively higher surface area can be produced (Norhusna et al., 2013). The smaller
molecule size of water is responsible in effectively facilitating diffusion within the
char’s porous structure (Cagnon et al., 2009; Mak et al., 2009). Steam activation is
also reported to be two or three times faster than CO2 at the same degree of
conversion (Nowicki et al., 2010; Plaza et al., 2010).

17
But when the precursor is permeated or impregnated with a chemical
compound, it is referred to as chemical activation; the permeated product is then
pyrolysed and later washed with distilled water in order to get rid of the activating
agent. H3PO4, KOH, NaOH, K2CO3 and ZnCl2 are some of the most popular
activating agents (Yahya et al., 2015). These chemical agents develop the porosity
and inhibit tar formation through their influence on decomposition as they serve as
dehydrating agents (Dabrowski et al., 2005; Norhusna et al., 2013). Generally,
chemical activation (300–500 oC) takes place at lower temperature than physical
activation (Bhadusha & Ananthabaskaran, 2011; Sayan, 2006; Sumathi et al., 2010).
This improves the development of pore in carbon structure due to the effect of
chemical agent (Sudaryanto et al., 2006).
The chemical activation process produces an excellent rigid matrix carbon
adsorbent (not easily volatilized or contracted) material at lower temperature than
physical activation (Deng et al., 2009). The yield of physical activation is usually
lower than that of chemical activation process by up to about 30 % (Dabrowski et al.,
2005). Other merits of chemical activation process in comparison to physical
activation include easiness (as there no need of carbonizing the precursor), lesser
activation temperatures as well as superiority in porosity development (Dabrowski et
al., 2005).
In the case of physico-chemical activation process, both physical together
with chemical activation processes are concurrently run together. Therefore,
oxidizing agents (CO2, steam, air or their mixture) and dehydrating agents (NaOH or
KOH or K2CO3 etc) are used for porosity and surface area development through
gasification in a temperature range of 600-850 (±1) oC (Arami-Niya et al., 2011).
This dual advantage of having two processes incorporated as one is producing high

18
quality activated carbon with low ash content, high porosity and surface area
(Azevedo et al., 2007)
Quite a number of researches have been carried out using these three methods
for ACs production; Table 1.4 presents a brief summary of such methods.
1.3.2 Optimization of activated carbon preparation conditions
Proficient and effective adsorbents are prepared with the aid of experimental
design which helps in reducing cost of design and labor, achieving optimal output,
identifying the significant factors (input), improving process or product robustness,
reducing variability and minimizing process variation (Dutta et al., 2011; Gómez
Pacheco et al., 2012). The experimental design comprises of the factors (process
input), levels (the settings or magnitude of individual factor to be studied) and the
response (expected experimental output).
Response surface methodology (RSM) is the statistical technique that has
been used by many researchers to determine equations of regression model under
certain operating conditions (Ahmad & Alrozi, 2010a; Auta & Hameed, 2011). It
involves using statistical techniques to model and analyze experiments that are
influenced by many variables towards achieving a set goal or response. The RSM
comprises of design methods like box-behnken, 3-level factorial, central composite,
hybrid, pentagonal, hexagonal, D-optima, distance-based, modified distance, user
deformed and historical data.

19
Table 1.4 Physical, chemical and physico-chemical methods of preparing activated carbons
Method of activation Raw Materials Agents used Reference
Physical activation
Durian peel CO2 (Nuithitikul et al., 2010)
Almond shell CO2 (Marcilla et al., 2000)
Rubber-seed shell Steam (Sun & Jiang, 2010)
Coconut shell Steam (Cosnier et al., 2006)
Chemical activation
Durian shell KOH (Chandra et al., 2007)
Plum stones KOH (Nowicki et al., 2010)
Corn cob ZnCl2 (Tsai et al., 1998)
Euphorbia rigida ZnCl2, K2CO3, NaOH, H3PO4 (Kılıç et al., 2012)
Physico-chemical activation
Pistachio nut shell KOH, Steam, (Yang & Lua, 2003)
Fluid petroleum coke KOH, H3PO4, Steam, CO2 (Rambabu et al., 2013)
Pistachio nut shell NaOH, CO2 (Lua & Yang, 2009)
Palm shell NaOH, CO2 (Hamad et al., 2010)
Walnut shell KOH, CO2 (Plaza et al., 2010)

20
Among the RSM subsets, central composite design (CCD) technique is the
most widely used second-order model by scientists and engineers due to its
suitability in analyzing interaction between preparation parameters as well as
validating a quadratic surface (Ahmad & Alrozi, 2010a). It also requires the least
quantity of experimental trials to optimize the parameters influence, either singly or
through parameters interaction (Auta & Hameed, 2011). 2n axial, 2n factorial and six
center runs (nc) comprises the CCD, with the amount of factors denoted as n. The
total number of experiments can be evaluated using equation (1.1):
Total number of experiments = 2n + 2n + nc (1.1)
Experimental error and data reproducibility can be determined using center
points with +1 and -1 representing two-level independent variables for maximum and
minimum values respectively, representing the eight factorial points. The six
replicates location is at the center (0, 0, 0) and (±α, 0,0), (0, ±α, 0) and (0,0, ±α) were
describing the axial points. The distance of the axial point from center is represented
by alpha (α), taken as α=1. 682. It can be obtained using equation 1.2 below (Auta &
Hameed, 2011):
α = Np
14⁄
(1.2)
where number of points in the cube portion of the design is described by Np=2k while
k is the variables amount. The prime response or output function for the single and
multiple effects of the factors involved either separately or through interaction
between them is expressed as:
Y = bo + ∑ biixi ni=1 + (∑ biixi
ni=1 )2 + ∑ ∑ bijxixj
nj=i+1
n−1i=1 (1.3)

21
where Y is the response predicted, bo stands for the constant coefficients-
experimental error (measurement error on the response and unaccounted variations),
bii and bij are the quadratic as well as the interaction coefficients respectively. The
variables coded values are xi and xj.
Design Expert software can be applied to assess the model fitting and
statistical analysis in order to fit response function developed as well as evaluate
statistical significance of the function. Significance and adequacy of the CCD
quadratic models generated is carried out using F-test method of analysis of variance
(ANOVA). Response surface methodology has been applied by researchers in the
preparation of activated carbons, a brief summary of such studies are presented in
Table 1.5.
Table 1.5 Optimum parameters for activated carbon preparation using response
surface methodology
Activated carbon precursor Parameters optimized Reference
Borassus aethiopum shells 780 oC, 1.05 h, 3.19 IR (Garba et al., 2014)
Biological sludge 700 oC, 3 h, 0.5 IR (Gómez Pacheco et al., 2012)
Mangosteen peel 828 oC, 1 h, 3.0 IR (Ahmad & Alrozi, 2010a)
Date stone 707 oC, 1.27 h, 1.6 IR (Theydan & Ahmed, 2012)
Palm oil fronds 750 oC, 2 h, 2.38 IR (Salman, 2014)
Oil palm empty fruit bunch 814 oC, 1.9 h, 2.8 IR (Hameed et al., 2009)
Tea waste 800 oC, 2 h, 1.4 IR (Auta & Hameed, 2011)
1.4 Adsorption isotherm
Isotherms are functions relating the adsorbate amount on the adsorbent with its
pressure in the case of gas or its concentration if liquid at fixed temperature. It can be
used to study and explain the whole adsorption and desorption processes. A clue of
the nature of adsorption process is gained by inspecting the isotherm shape. Based on
the Brunauer-Emmett-Teller (BET) classification, all adsorption isotherms fit into

22
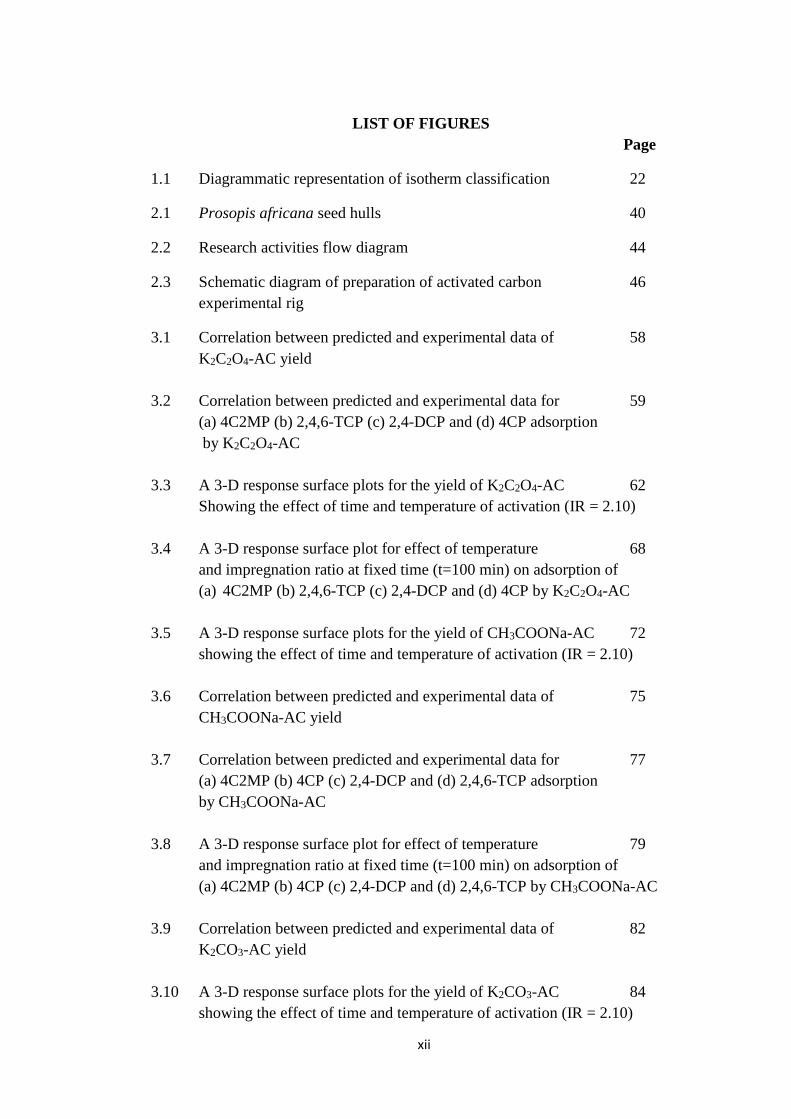
one of the five (5) types shown in Figure 1.1. Characteristics of the isotherm types
are listed below.
Fig 1.1 Diagrammatic representation of isotherm classification (Sing et al., 1985).
Type I happened when adsorption is restricted to monolayer as observed in
chemisorption. Pores are indicated to be microporous by the physical type of
adsorption that generates the Type I isotherm with the uncovered surface located
almost solely inside the micropores, which once packed with adsorbates, leave little
or no external surface for additional adsorption.
Type II is encountered more recurrently when adsorption takes place on adsorbents
that are nonporous or adsorbent with pore diameter larger than micropores. The
inflection point normally happens near the completion of the first adsorbed
monolayer and with upsurge in relative pressure.

23
Type III isotherms are principally illustrated by heat of adsorption that is less than
adsorbate heat of liquefaction. Thus, as adsorption proceeds, interaction with an
adsorbed layer is greater than the interaction with adsorbent surface.
Type IV occurs on adsorbents that are porous, having pores in the range of
1.5-100 nm. The slope shows increased uptake of adsorbate as pores become filled,
at higher pressures. The inflection point normally occurs near completion of the first
monolayer.
Type V occurs as a result of interaction between adsorbate and adsorbent potential
similar to the type III at low pressure. However, Type V is also related with pores in
the range as those of Type IV isotherm.
Generally, Type I, IV and V are associated with porosity, while Type I usually
corresponds to micro porosity, Type IV and V are associated with pores ranging
from about 1.5 to 100 nm. Each of these types is observed in practice but by far the
most common are Type I, II and IV (Thomas & Crittenden, 1998).
Isotherm models gave an indication on how the interaction between
adsorbent-adsorbate occurs. Three most relevant models applied in this work are
Langmuir isotherm, Freundlich isotherm and Temkin isotherm equations.
1.4.1. Langmuir adsorption isotherm
Langmuir isotherm equation describes an adsorption process that occurs upon a
homogeneous surface where the adsorbate is distributed in monolayers (Kumar et al.,
2010). The model is given as (Langmuir, 1916):
qe = KLQa
0Ce
1+KLCe (1.4)
24
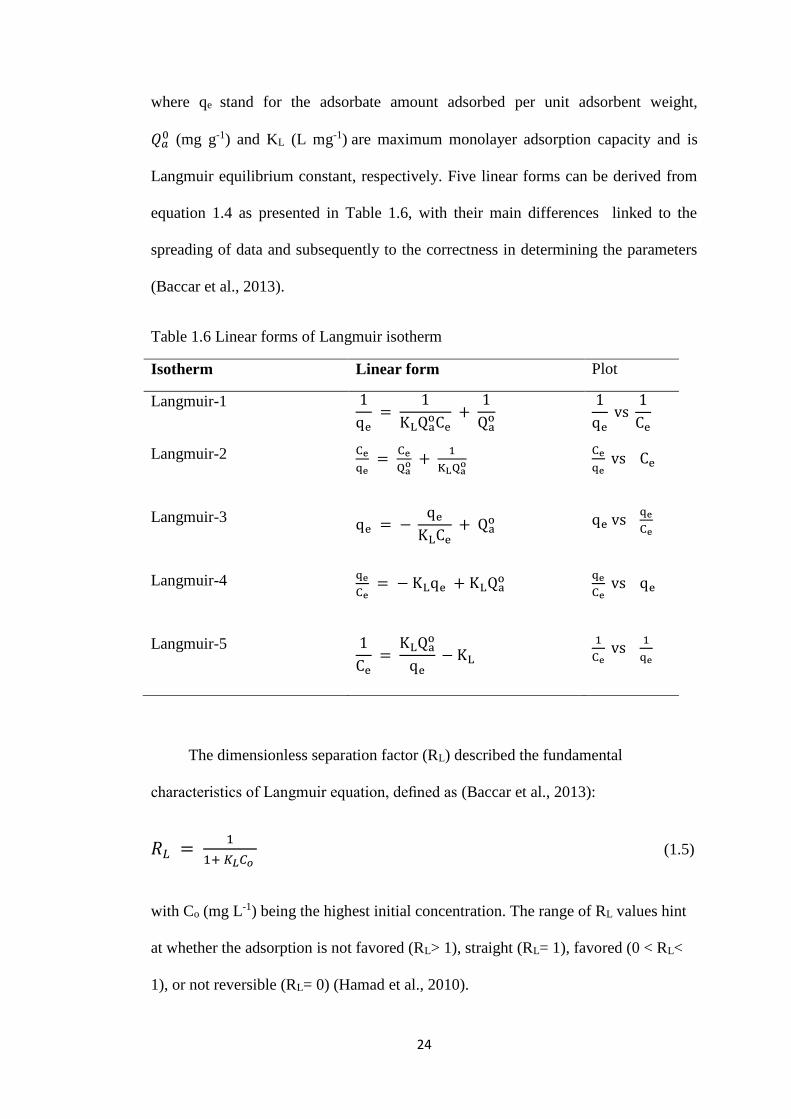
where qe stand for the adsorbate amount adsorbed per unit adsorbent weight,
𝑄𝑎0 (mg g-1) and KL (L mg-1) are maximum monolayer adsorption capacity and is
Langmuir equilibrium constant, respectively. Five linear forms can be derived from
equation 1.4 as presented in Table 1.6, with their main differences linked to the
spreading of data and subsequently to the correctness in determining the parameters
(Baccar et al., 2013).
Table 1.6 Linear forms of Langmuir isotherm
Isotherm Linear form Plot
Langmuir-1 1
qe =
1
KLQaoCe
+ 1
Qao
1
qe vs
1
Ce
Langmuir-2
Ce
qe =
Ce
Qao +
1
KLQao
Ce
qe vs Ce
Langmuir-3
qe = − qe
KLCe + Qa
o qe vs qe
Ce
Langmuir-4
qe
Ce = − KLqe + KLQa
o qe
Ce vs qe
Langmuir-5 1
Ce =
KLQao
qe − KL
1
Ce vs
1
qe
The dimensionless separation factor (RL) described the fundamental
characteristics of Langmuir equation, defined as (Baccar et al., 2013):
𝑅𝐿 = 1
1+ 𝐾𝐿𝐶𝑜 (1.5)
with Co (mg L-1) being the highest initial concentration. The range of RL values hint
at whether the adsorption is not favored (RL> 1), straight (RL= 1), favored (0 < RL<
1), or not reversible (RL= 0) (Hamad et al., 2010).