PREPARATION AND CHARACTERIZATION OF … AND CHARACTERIZATION OF CHICKEN SKIN GELATIN AS AN...
34
0 PREPARATION AND CHARACTERIZATION OF CHICKEN SKIN GELATIN AS AN ALTERNATIVE TO MAMMALIAN GELATIN Norizah Mhd Sarbon 1, 2 , Farah Badii 1 and Nazlin K Howell 1 * 1. Faculty of Health and Medical Sciences, University of Surrey, Guildford, Surrey, GU2 7XH, UK. 2. Present address: Department of Food Science, Faculty of Agrotechnology and Food Science, Universiti Malaysia Terengganu, 21030, Kuala Terengganu, Terengganu, Malaysia. *Corresponding author. Tel.: 0044 1483 686448 Fax: 0044 1483 686401 E-mail address: [email protected]
Transcript of PREPARATION AND CHARACTERIZATION OF … AND CHARACTERIZATION OF CHICKEN SKIN GELATIN AS AN...

0
PREPARATION AND CHARACTERIZATION OF CHICKEN SKIN
GELATIN AS AN ALTERNATIVE TO MAMMALIAN GELATIN
Norizah Mhd Sarbon
1, 2, Farah Badii
1 and Nazlin K Howell
1*
1. Faculty of Health and Medical Sciences, University of Surrey, Guildford, Surrey, GU2 7XH,
UK.
2. Present address: Department of Food Science, Faculty of Agrotechnology and Food Science,
Universiti Malaysia Terengganu, 21030, Kuala Terengganu, Terengganu, Malaysia.
*Corresponding author. Tel.: 0044 1483 686448
Fax: 0044 1483 686401
E-mail address: [email protected]

1
Abstract
The aims of this study were to report for the first time, the extraction and physico-
chemical properties of chicken skin gelatin compared to bovine gelatin. Extracted chicken skin
gelatin 6.67 % (w/v) had a higher bloom value (355 ± 1.48 g) than bovine gelatin (259 ± 0.71 g).
The dynamic viscoelastic profile of chicken gelatin exhibited higher viscous and elastic modulus
values compared to bovine gelatin for a range of concentrations and frequencies. Thermal
properties studied by differential scanning calorimetry (DSC) showed that the melting
temperature of 6.67 %, chicken skin gelatin was significantly greater (p <0.05) than that of
bovine gelatin, indicating lower stability of bovine gelatin compared to chicken skin gelatin.
Results obtained in this study showed that Gly (33.70 %), Pro (13.42 %), H.Pro (12.13 %) and
Ala (10.08 %) were the most dominant amino acids in chicken skin gelatin which contributed to
the higher gel strength and stability. Raman spectra of chicken skin and bovine gelatin were
similar and displayed typical protein spectra. Chicken gelatin showed strong hydrogen bonding
compared to bovine gelatin as the tyrosine doublet ratio (I 855/I 830) of chicken gelatin was
significantly lower than that of bovine gelatin. Significantly, the alpha helix and β-sheet type
structures were higher for chicken skin gelatin compared with bovine gelatin. The average
molecular weight of chicken gelatin was 285,000 Da. These findings, obtained for the first time
for chicken skin gelatin, show that it has high potential for application as an alternative to
commercial gelatin.
Keywords: Chicken skin gelatin, gel strength, viscoelasticity, differential scanning calorimetry,
Raman spectroscopy

2
1. INTRODUCTION
Gelatin is a polypeptide produced by partial hydrolysis of collagen derived from animal
skin, connective tissue and bones (Morrison et al., 1999). Gelatin is a special hydrocolloid,
serving multiple functions with a wide range of applications in the food, pharmaceutical,
photographic and cosmetic industries. The uniqueness of the gelatin is its ability to form thermo-
reversible gels with a melting temperature close to body temperature and its solublity in water
(Zhou et al., 2006). In addition to gelation properties, gelatin also has applications as a colloid
stabilizer, foaming agent and emulsifier (McClements, 2005). The estimated world usage of
gelatin is reported at about 200,000 metric tonnes per year (Choi & Regeinstein, 2000). Most
available gelatins are manufactured from mammalian resources such as pig skin, cattle bones and
cattle hide. However, other sources of gelatin are becoming increasing relevant, such as fish
bone, scales and skin.
Gel strength or bloom value including low (< 150), medium (150-220) and high bloom
(220-300) determines the quality of gelatin and viscoelastic properties such as gelling and
melting. Rheological data are required for the analysis of flow conditions in different food
processing operations and the measurement of texture (Binsi et al., 2009). Johnston-Bank, (1990)
stated that the quality of gelatin depends on its physico-chemical properties, which are greatly
influenced, not only by the species or tissue from which it is extracted, but also by the severity of
the manufacturing method. The rheological properties of thermo-reversible gelatin gels are
primarily a function of temperature and the concentration of gelatin for a given gelatin type.
The development of gelatin alternatives has gained importance in recent years as the
demand for non-bovine and non-porcine gelatin has increased due to the BSE (bovine spongiform
encephalopathy) crisis and for religious and social reasons. Since then, there has been much
concern about using gelatin derived from possibly infected animal parts. Pig skin gelatin is not
acceptable for Judaism and Islam and beef gelatin is acceptable only if it has been prepared
according to religious requirements (Badii & Howell, 2006). Therefore, the development of
gelatin alternatives is highly desirable to food processors as the global market for food certified
halal is growing rapidly (Karim & Bhat, 2009).

3
To date however, few alternatives for mammalian gelatin are available. A number of
studies on developing gelatin alternatives to mammalian gelatin have been reported including
from cod skin (Gudmundsson & Hafsteinsson, 1997), horse mackerel skin (Badii & Howell,
2006), sin croaker and shortfin scad skin (Cheow et al., 2007), black and red tilapia skin (Jamilah
& Harvinder, 2002), hake skin (Gomez-Guillen et al., 2002), yellowfin tuna (Chiou et al., 2006),
harp seal (Arnesen & Gildberg, 2007), and cat fish (Yang et al., 2007). Similarly, in South
Korea investigations on the feasibility of using chicken feet to replace cowhides for jokpyun
(traditional Korean gel-type food) have been undertaken (Jun et al., 2000). Additionally, there is
growing interest in developing alternative substitutes of raw materials such as chicken bone and
fishery by-products (Lim et al., 2001). To our knowledge, there are no reported studies on the
production of gelatin from chicken skin and detailed physicochemical and rheological studies. As
skin is a wasted by-product of poultry processing, it may be possible to replace mammalian
sources of gelatin with gelatin extracted from chicken skin.
Therefore, the objectives of the present study were to prepare gelatin from chicken skin
and to compare the physicochemical, thermal and rheological properties, of the extracted gelatin
with commercially available bovine gelatin. The hypothesis is that avian gelatin may have
comparable properties to mammalian gelatin based on the imino acids, secondary structure and
molecular weight, that are important indicators for high bloom strength. Moreover, this novel
research would also lead to maximizing the usage of under-utilised resources and industrial
waste.
2 MATERIAL AND METHODS
2.1 Materials
Fresh chicken skins were obtained from a local market, Guildford, Surrey, UK and chilled
in ice while transporting them to the laboratory, Faculty of Health and Medical Sciences,
University of Surrey, Guildford, Surrey, UK. Upon arrival at the laboratory, the visible fat was
mechanically removed, the skin was washed and weighed (wet weight) before storage at -80 °C
until used for further experiments. Chemicals for amino acids analysis including acetonitrile

4
HPLC grade (BDH), sodium acetate, mixed resin (amberlite MB-6113), sodium hydroxide,
sulphuric acid and Bloom jars (SCHOTTGLAS Mainz. Bloom test vessel, product no. 2112501)
were obtained from Fisher Scientific, Loughborough, UK. Triethylamine (TEA),
phenylisothiocyanate (PITC), amino acid standards for food analysis, silicone oil, citric acid, and
commercial bovine gelatin (Type B) from bovine skin were obtained from Sigma–Aldrich
Company Ltd, Poole, Dorset, UK. All reagents used were analytical grade.
2.2 Methods
2.2.1 Chicken skin preparation
Frozen chicken skins were thawed in a cold room (4-5 °C) overnight. After thoroughly
rinsing in excessive water to remove impurities, the skins were cut into 2-3 cm pieces and freeze-
dried for about 4-5 days. Completely dry skins were ground before being defatted using the
Soxhlet method (AOAC, 2006).
2.2.2 Gelatin extraction
Gelatin was extracted from chicken skin according to the method of Badii and Howell
(2006) with slight modification. To extract gelatin, 14 g defatted dried chicken skin was mixed
with 200 ml sodium hydroxide (0.15 % w/v). The mixture was shaken well and slowly stirred at
room temperature (22 oC) for 40 min before centrifuging at 3500 x g for 10 min. This step was
repeated three times. The alkaline solution was changed every 40 min to remove non-collagenous
proteins and pigments. The alkaline treated pellets were rinsed with distilled water. The resulting
pellets were then mixed with 200 ml sulphuric acid 0.15 % (v/v). Again, the resulting pellets
were mixed with 200 ml of citric acid solution 0.7 % (w/v). The mixture was shaken well and
stirred gently at room temperature for 40 min before centrifuging at 3500 x g for 10 min. The
acid solution was changed every 40 min to denature the collagen in the chicken skin matrix. Each
treatment was repeated three times and each treatment took about 2 h to complete. The pellets
were then subjected to a final wash with distilled water to remove any residual salts followed by
centrifuging at 3500 x g for 15 min. The final extraction was carried out in distilled water at

5
controlled temperature (45 ˚C) for overnight without stirring. The resultant mixture was filtered
in a Büchner funnel with a Whatman filter paper (no.4) and deionised, using an Amberlite mixed
bed resin (M B-6113) according to the GME Monograph Version 2000 (GME, 2000). The
solution ionic strength was checked with a conductivity meter to obtain 50 µ Siemens/cm. The
pH was adjusted to 6.0 with 0.1 M sulphuric acid. The volume was reduced to 1/10 by
evaporation under vacuum (using a rotary evaporator) at 45 ˚C and then kept in the freezer
overnight before freeze-drying. The dry matter was referred to as ‘gelatin powder’.
2.2.3 Characterisation of gelatin
2.2.3.1 Proximate analysis
The moisture, ash and fat content of extracted gelatin were determined according to the
methods described by AOAC (2006). The crude protein content was determined by estimating its
total nitrogen content by the Kjeldahl method (AOAC, 2006). A factor of 5.55 was used to
convert the nitrogen value to gelatin protein. The yield of gelatin was calculated based on dry
weight of fresh skin using the following formula:
Yield of gelatin (%) = Weight of freeze-dried gelatin x 100
Weight of dried skin
2.2.3.2 Determination of bloom strength of gelatin gels
Bloom value was determined according to the method described by the Gelatin
Manufacturers of Europe Monograph version 1 July 2000. Gelatin (7.5 g) was weighed into a
Bloom jar (SCHOTTGLAS Mainz. Bloom test vessel, product no. 2112501) to which 105 ml
deionised water was added. The solution (6.67 %) was swirled with a glass rod, covered and
allowed to stand at room temperature for 3 h to allow the gelatin to swell. The Bloom jars were
then transferred and heated in a beaker of water at 60 ºC, on a magnetic heater stirrer for 20 min
to dissolve the gelatin completely. The jar was covered and allowed to cool for 15 min at room

6
temperature. Bloom jars were kept in a refrigerated water bath at 10 ± 0.1 ºC over night (16-18 h)
for gel maturation and tested on a TA-XT2 texture analyzer (Stable Microsystem, Godalming,
UK) by penetration with a standard radius cylinder (P/0.5R) probe, to a depth of 4 mm at
0.5mm/s. The standard glass Bloom jar was placed centrally under the plunger and the maximum
force reading (the resistance to penetration) was obtained and is the Bloom strength (g) of the gel.
The analysis was undertaken in triplicate and bloom value of chicken skin gelatin was compared
to that of a commercial bovine gelatin.
2.2.4 Amino acid analysis
2.2.4.1 Preparation of samples and standards
The amino acid content of chicken muscle hydrolysate was determined by the method of
Bidlingmeyer et al., (1987); Badii and Howell, (2001) using HPLC (Waters: Alliance, Waters,
UK, Hertfordshire, UK) with an integrated detector (Dual ʎ absorbance-Waters 2487) and
separation module (Waters 2695). Chicken skin gelatin and commercial bovine gelatin were
hydrolysed to yield free amino acids by placing 2.0 g of each sample in screw cap tubes with the
addition of 15 ml 6 N HCl. The tubes were then closed under nitrogen and heated in an oven at
110 °C for 24 h. The hydrolysed samples and amino acid standards (20 µl) were derivatized with
phenylisothiocyanate (PITC) and analysed as described below.
2.2.4.2 Derivatisation of amino acids with phenylisothiocyanate (PITC)
Hydrolysed gelatin solution as well as amino acid standards (20 µl), were placed in tubes
and dried under vacuum for 20 min. Then, 20 µl of drying solution containing 200 µl methanol,
200 µl 1M sodium acetate and 100 µl triethylamine (TEA) (2:2:1), was added to the residues and
the resulting solutions were vacuum-dried again for 10 min. The derivatization reagent was
freshly prepared by mixing 50 µl PITC (kept at -20 °C, under nitrogen to prevent degradation),
350 µl methanol (HPLC grade), 50 µl TEA, and 50 µl milli-Q water. The derivatization reagent
(20 µl) was added to each tube and the tubes were vortex-mixed and left at room temperature for

7
20 min. The reagent was then removed under vacuum for 20 min. The derivatized samples were
vacuum-dried and dissolved in 100 µl of sample buffer (Eluent A, prepared by dissolving 19 g of
sodium acetate trihydrate in 1 L Milli-Q water, followed by the addition of 0.5 ml TEA, adjusted
to pH 6.4 and filtered). To 940 ml of this solution was added 60 ml acetonitrile. The hydrolysed
gelatin solutions as well as amino acids standards were analyzed, in triplicate, by HPLC.
2.2.5 Small deformation oscillatory measurements
Small deformation oscillatory measurements of different concentrations of chicken skin and
bovine gelatin (3-10 % (w/v) in distilled water) were performed on a Rheometrics (Leatherhead,
Surrey, UK) controlled stress 200 rheometer using 40 mm parallel plate geometry with a 0.3 mm
gap. The sample was applied and silicone oil (Sigma cat. no 14615-3) was spread over the outer
edge of the sample to prevent evaporation during heating using temperature sweeps and
frequency sweeps. The two main parameters determined in a dynamic rheological test are the
storage or elastic modulus (G') describing the amount of energy that is stored elastically in the
structure and the viscous or loss modulus (G") indicating the amount of energy loss or the viscous
response.
2.2.5.1 Temperature sweeps
A dynamic temperature sweep rheological test was used to determine the gelation and
melting temperature of the gelatin samples. The stress and frequency used were 0.1 Pa and 1
rad/s respectively. For gelation, the sample was initially maintained at a temperature of 40 °C for
10 min to allow for equilibration. Gelatin samples were cooled on a Peltier plate from 40 °C to 10
°C and heated back to 40 °C both at a scanning rate of 2 °C/min. The gelation temperature was
taken to be the temperature at which the elastic modulus began to dramatically increase in value.
The temperature at which the G'/G" cross over occurred during cooling is close to the sol-gel
transition or the gel formation point (Ross-Murphy, 1991; Gudmundsson, 2002). The test for
determining melting temperature immediately followed after the gelation test. After the sample
reached 10 °C, the temperature was raised back to 40 °C. Melting occurred when the elastic

8
modulus (G') began to decrease and loss modulus (G") began to increase in value. Changes in the
elastic or storage modulus (G') and loss modulus (G") were determined as a function of
temperature and were recorded.
2.2.5.2. Frequency sweeps
A dynamic frequency sweep was performed at 10 °C to characterize the cross-linking
behaviour of the gelatin. Stress was held at 319.7 Pa and frequency was oscillated from 0.1 -100
rad/s. All tests were performed within the identified linear viscoelastic region at the temperature
tested. Changes in elastic (G') and loss modulus (G") were obtained as a function of frequency
and were recorded. Samples were measured at 3, 5, 7 and 10 % (w/v) concentration in triplicate.
2.2.6 Differential scanning calorimetry (DSC) measurements
Thermal properties of gelatin were investigated using a differential scanning calorimeter
(DSC) VII (Setaram, Lyon, France). Samples and water as reference of approximately 500 mg
were weighed using a precision balance, Metler Toledo (AL 204), Mettler-Toledo Ltd.,
Beaumont Leys Leicester, UK., in a hermetic aluminium containers and scanned from 8 to 90 °C
at a heating rate of 0.5 °C/min. Samples were measured at 3, 5, 7 and 10 % (w/v) concentration.
The helix-coil transition temperature (Tm) was calculated as the temperature where the
endothermic peak occurs. The temperature reached when half of the gelatin is denatured was
measured as the tip of the peak. The total energy required for denaturing the protein, the
enthalphy change (ΔH), was measured by integrating the area under the peak (Setaram DSC
handbook and setsoft software). The endothermic peak was selected as the melting temperature
of gelatin gels and the reading was the average of three determinations.
2.2.7 FT-Raman spectroscopy
For the Raman spectroscopy study, gelatin samples were examined in 7 ml glass
containers (FBG-Anchor, Cricklewood, London) on a Perkin-Elmer System 2000 FT-Raman
spectrophotometer with excitation from a Nd:YAG laser at 1064 nm. Frequency calibration of the

9
instrument was performed using the sulphur line at 217 cm-1
. Triplicate sets of the sample were
prepared and analysed using laser power 1785 mW. The spectra were an average of 125 scans
which were baseline corrected and normalised to the intensity of the phenylalanine band at 1004
cm-1
(Howell et al., 1999; Badii & Howell, 2003). The recorded spectra were analyzed using
Grams 32 software (Galactic Industries Corp., Salem, NH). Bands in the spectra were assigned to
the protein vibrational modes, based on the literature (Howell & Saeed, 1999; Li-Chan, 1996;
Badii & Howell, 2002).
2.2.8 Molecular weight by size-exclusion high-performance liquid chromatography (SE-
HPLC) coupled to multi-angle laser light scattering (MALLS) and differential pressure
viscometry (DPV)
Analytical fractionation of the gelatins was carried out very kindly at the University of
Nottingham by Prof S. Harding and Dr Gordon Morris, using two SE 7.8 x 300 mm columns
(TTSK G6000PW and G4000PW, (Tosoh Bioscience, Tokyo, Japan) and protected by a similar 6
x 40 mm guard column. Chromatograms were acquired on-line with UV (Cecil 1100 series,
Cambridge, UK), MALLS (DAWN HELEOS II, Wyatt Technology, Santa Barbara, CA), DPV
(Viscostar II, Wyatt Technology) and differential refractive index (Optilab rEX, Wyatt
Technology) sequentially placed detectors. The eluent (PBS) was pumped at 0.8 ml min-1
(the
pump was PU-2080, Jasco Corporation, Great Dunmow, UK), and the samples were manually
injected,100 µl for each sample, using a Beckman Altex 210A valve with a 500 ll PEEK loop.
Samples were centrifuged for 5 min at 10,000 x g before injection, and a 0.1 µm on-line filter was
placed after the columns was used to reduce particulate and improve the MALLS detectors’
signal-to-noise ratio. The runs were made at room temperature (28 oC), without thermostating of
the columns and of the UV and MALLS cells (K5 type); the temperature was monitored and
recorded by the ASTRA (Version 5.3.2.17) collection and analysis software (Wyatt Technology)
controlling the DAWN HELEOS II, Viscostar II, and Optilab rEX instruments. The DPV
capillaries and RI cell were kept at 20.0 oC. Weight average molar masses ‹M›w, absolute rms
(root mean square) z-average radii of gyration (‹R2
g›z) 1/2
, and weight-average intrinsic viscosities
h[g]iw were calculated using the ASTRA software (Cardinali et al, 2010).

10
2.3 Statistical analysis
Statistical tests were performed by using the SPSS package version 16 to analyze the data
in this study. One way analysis of variance (ANOVA) was carried out. Differences between pairs
of means were assessed on the basis of confidence intervals by using Least Significant Difference
(LSD) test, followed by the t-test. The level of significance was considered at (p < 0.05).
3 RESULTS AND DISCUSSION
3.1 Characterisation of extracted chicken skin gelatin
3.1.1 Extraction of gelatin
The yield of extracted chicken skin gelatin was 16 % based on dry weight basis (Table 1).
However, the recovery values obtained based on the wet weight basis of this study (data not
shown) was lower (2.16 %) compared to extracted fish gelatin (on a wet weight basis) which
yielded 14 % from cod skin (Gudmundsson & Hafsteinsson, 1997), 7.81 % and 5.39 % yields of
gelatin from red and black tilapia respectively (Jamilah & Havinder, 2002), 14.3 % and 7.25 %
yields from sin croaker and shortfin scad respectively (Cheow et al., 2007). These results
indicated that the extraction procedure using a mixed acid and alkali process may not be optimal
for chicken skin in terms of yield and improvements may be possible in future studies. The lower
yield may be due to the loss of extracted collagen through leaching during the series of washing
steps or due to the incomplete hydrolysis of the collagen (Jamilah & Harvinder, 2002).
The aim of akali/acid pre-treatment is to weaken the collagen structure, solubilise the non-
collagen proteins and hydrolyse some of the peptide bonds, but keeping the consistency of the
collagen fibres (Ward & Court, 1977). During the final step in the conversion of collagen to
gelatin, the extraction temperature was 40-45 °C to achieve controlled partial hydrolysis of the
cross-links and peptide bonds of the original collagen structure, and to obtain the ideal molecular
weight distribution of gelatin. The yield at 50 °C is reported to be better than at 40 °C but the
quality is lower (Cho et al., 2006).

11
3.1.2 Proximate composition of gelatin
The proximate composition of chicken skin and bovine gelatin are presented in Table 1. The
protein content of freeze-dried chicken skin gelatin was 80.76 % while moisture and ash content
was 9.81 and 0.37 % respectively. The similarities in proximate composition between chicken
skin and bovine skin thus relate to chicken skin being a potential alternative gelatine source.
3.1.3 Gel strength
Gel strength of chicken gelatin (6.67 % (w/v) in distilled water) prepared in the present
study provided significantly higher bloom value of 355 ± 1.48 g compared with bovine gelatin
(229 ± 0.71 g) probably due to the intrinsic characteristics such as protein chain composition,
molecular weight distribution, amino acid content and type of extraction treatment as well as the
properties of collagen. Compared to other alternative sources like fish gelatin, chicken gelatin
showed higher gel strength than for tilapia (181 g and 263 g bloom) as reported by Jamilah and
Harvinder, (2002) and Grossman and Bergman (1992), respectively; horse mackerel (280 g
bloom) by Badii and Howell (2006), sin croaker and shortfin scad (125 and 177 g, respectively)
by Cheow et al., (2007). The low hydroxyproline content of fish skin gelatin was a major reason
for the low gel strength of the gelatin (Arnesen and Gildberg, 2002). It is well established that
proline and hydroxyproline are responsible for the stability of the triple-helix of collagen
structure through hydrogen bonding between free water molecules and hydroxyl group of the
hydroxyproline in gelatin (Fernandez- Diaz et al., 2003; Badii and Howell, 2006). In addition,
gelatin bloom strength is also dependent on other factors such as the chemical treatment of raw
collagen materials, type and concentration of the gelatin and the time/temperature history of the
sample (Babin & Dickinson, 2001; Kolodziejska et al., 2004). Additionally, the higher bloom
value contributes to the higher melting and gelling point and shorter gelling time of the final
product.

12
3.2 Amino acid composition
Table 2 presents the amino acid composition of chicken skin and bovine gelatin. As
expected, glycine content was high, 33.70 and 37.05 % for chicken skin and bovine gelatin,
respectively. Imino acid Pro and hydroxyproline were higher for chicken gelatin (13.42 % and
12.13 %, respectively) compared with bovine gelatin (12.66 and 10.67 % respectively). The
higher content of the imino acids (Pro + H.Pro) and also Ala in chicken skin gelatin may
contribute to its higher viscoelastic properties by promoting triple helix formation and
stabilization of gelatin at low temperature.
3.3 Rheological properties of gelatin gels
3.3.1 Temperature sweeps
The gelling and melting temperatures and the dynamic viscoelastic profile of chicken and
bovine gelatin at a concentration of 6.67 % (w/v) are presented in Table 3. The maximum values
of elastic (G') and loss (G") modulus of chicken gelatin (8273; 6639 Pa, respectively) were
significantly higher than for bovine gelatin (4330; 4122 Pa respectively) (p <0.05). Although the
melting temperature of chicken gelatin (33.57 ºC) was significantly higher (p <0.05) than that of
bovine gelatin (31.55 ºC), there was no significance difference (p <0.05) for both chicken and
bovine gelatin in the gelling temperature which was similar (24°C).
Figures 1 and 2 compare the dynamic viscoelastic profile of chicken skin and bovine
gelatin during both cooling from 40 to 10 ºC and heating from 10 to 40 ºC at constant rate of 2
ºC/ min. During cooling, G' values increased sharply due to an increase in the amount of energy
that is elastically stored, which indicates rapid formation of junction zones and a strong
reinforcement of the gel network. There was no significant difference (p >0.05) for both chicken
and bovine gelatin in the gelling temperature (24 ºC). The gelling temperature is the temperature
at which the G'/G" cross-over occurred on cooling and is close to the sol-gel transition (Ross-
Murphy, 1991; Gudmundsson, 2002).

13
Chicken gelatin showed higher elastic modulus (G') values at low temperature indicative
of enhanced ability to refold into a triple helix (Gomez Guillen et al., 2002). The higher elastic
modulus (G') of chicken gelatin showed that a higher thermal transition was required compared to
the bovine gelatin both during cooling and heating, which indicates that it was more heat stable.
These higher rheological properties and thermo-stability are typical of mammalian gelatin
(Leunberger, 1991; Gilsenam and Ross-Murphy, 2000b) and are mainly related to imino acid
composition, with hydroxyproline playing a unique role in stabilizing the triple helix. Gomez-
Guillen et al., (2002) correlated the thermal stability of gelatin to the number and stability of Pro
rich regions in collagen and gelatin molecules, which are high in mammalian species and fresh
warm water fish (Kasankala et al., 2007).
3.3.1.1 Effect of concentration on gelling and melting properties
Figure 3 compares the effects of gelatin concentrations on the gelling temperature (ºC) of
chicken and bovine gelatin during cooling. Gelling temperatures for both chicken and bovine
gelatin were concentration (3, 5, 7 and 10 % (w/v)) dependent and increased with increase in
concentration due to increased cross-linking by hydrogen bonding. Chicken gelatin showed
higher gelling temperatures at all concentrations compared to bovine gelatin (p <0.05). Gel
formation (G'/G" cross-over point) occurred at 21.02, 23.34, 24.44 and 27.19 ºC for chicken
gelatin and 18.47, 21.40, 22.85 and 24.60 ºC for bovine gelatin at 3, 5, 7 and 10 % (w/v) gelatin
in distilled water, respectively. The difference in the gelling ability of chicken compared with
bovine gelatin may due to the intrinsic difference in the protein structure as well as the different
pre-treatments used in gelatin production.
Similarly, chicken gelatin melted at a higher temperature (p <0.05) than bovine gelatin as
shown in Figure 4. The melting temperature of chicken (32.67, 32.82, 33.53 and 36.02 ºC) and
bovine (30.03, 30.68, 31.35 and 32.27 ºC) gelatin were obtained at 3, 5, 7, and 10 % (w/v) gelatin
solutions respectively at 10-40 ºC. The melting temperatures of chicken gelatin were resulted
from the decrease of storage modulus due to the loss of network structure. Previous studies
(Gomez et al., 2002; Simon et al., 2003) showed that the concentration of helical structures

14
decreased during melting. The difference in thermostability between chicken and bovine gelatin
may be attributed to the difference in the proline and hydroxyproline content of each gelatin.
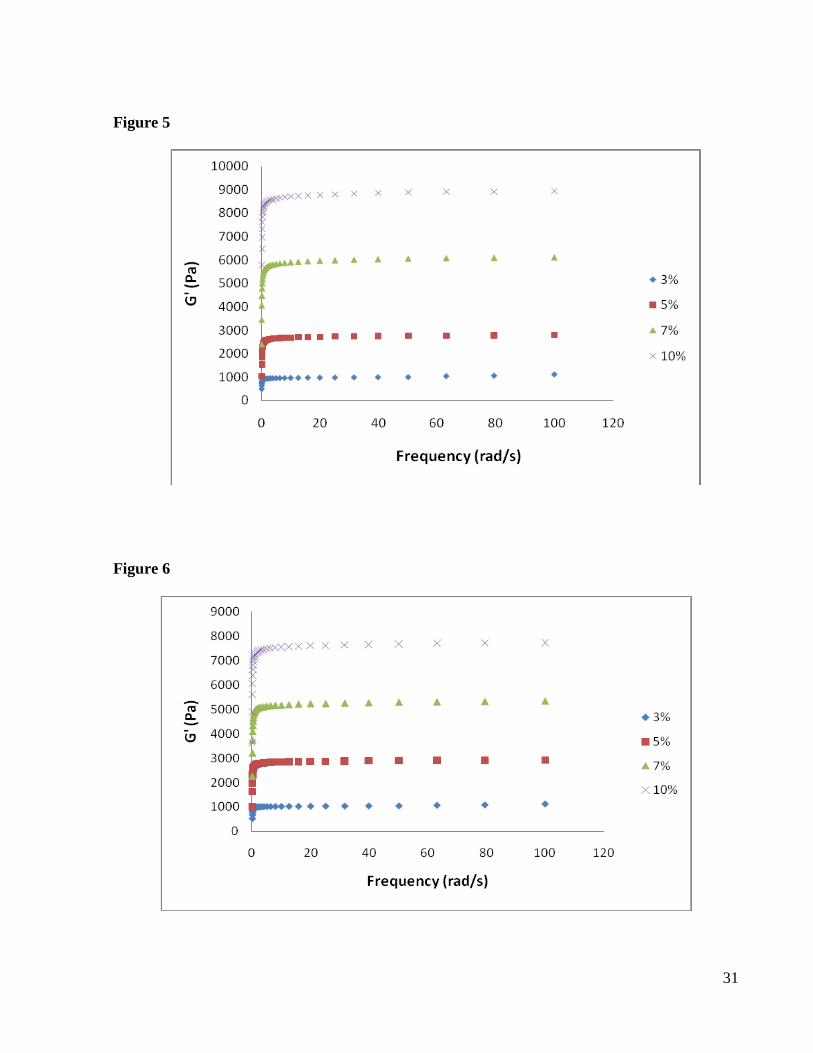
3.3.2 Effect of concentration on frequency sweeps
A dynamic rheological test at constant temperature (10 °C) was used to characterize the
cross-linking behaviour of chicken (Figure 5) and bovine (Figure 6) gelatin at different
concentrations (3, 5, 7 and 10 % (w/v)) respectively. At 10 ºC, both chicken and bovine gelatins
reached their gelling point resulting in network formation and higher G' values. The linearly
increasing storage modulus (G') with frequency is indicative of a higher stability of the gel
network in the given frequency range. The lower tan δ values obtained in this study (data not
shown) during a frequency sweep is indicative of a good gel network (Hudson et al., 2000).
Fig 7 shows that the G' values were higher than G" at all concentrations. The G' values for
chicken gelatin were higher than those of bovine gelatin at all concentrations, indicating that the
intermolecular interaction of bovine gelatin is weaker than that of chicken gelatin. Both chicken
and bovine gelatin gels at a concentration of 3 % (w/v) showed a slight frequency dependence of
G' (Figure 7 a), while at concentration 5, 7 and 10 % (w/v) gelatin gels were nearly independent
of frequency for both chicken and bovine gelatin respectively (Figure 7 b, c and d). This was in
good agreement with the study of cod skin gelatin gels by Gilsenan and Ross-Murphy (2000a)
which also showed a slight dependence of G' on frequency that became less obvious as the
gelatin concentration increased. Increasing the protein concentration resulted in an increased
storage modulus (G') as more energy from the deformation material was stored elastically in the
gel network with an increased number of intermolecular cross-links thus resulting in a more
integral matrix (Comfort & Howell, 2002; Chiou et al., 2006).
3.4 Differential scanning calorimetry (DSC)
As shown in Figure 8, the DSC scans of chicken and bovine gelatin both showed a single
endothermic peak. Melting temperature was observed from the maximum of the endothermic
peak. The melting temperature of chicken gelatin was significantly higher than that of bovine

15
gelatin gel (p <0.05). The lower melting temperature (Tm) of bovine gelatin gel (26.14 °C)
compared to chicken gelatin gel (31.18 °C) indicates that the structural stability of bovine gelatin
is weaker than that of chicken gelatin. Chicken gelatin had a higher enthalpy value (0.42, J/g)
than that of bovine gelatin (0.36, J/g) (Table 4). The stability of the collagen structure in chicken
gelatin resulting in higher enthalpy values involves in the breakage of hydrogen bonds and helix-
coil transition between the adjacent polypeptide chains of collagen molecules in the denaturation
process.
3.4.1 Effect of concentration on denaturation temperature of gelatin gel
Table 4 compares the denaturation temperature (Tm) and the enthalpy change (ΔH) of
chicken skin and bovine gelatin solutions at concentrations of 3, 5, 7 and 10 % (w/v) in distilled
water respectively. The denaturation temperatures of both gelatins increased with the increases in
concentration. Chicken skin gelatin showed significantly higher values (p <0.05) of denaturation
temperature compared to bovine gelatin at all concentrations. The denaturation temperature of
chicken skin gelatin were 30.99 ± 0.14, 30.73 ± 0.18, 31.08 ± 0.40 and 31.16 ± 0.35 ºC while for
bovine gelatin they were 25.91 ± 0.53, 25.97 ± 1.25, 26.41 ± 0.41and 27.57 ± 2.00 ºC at 3, 5, 7
and 10 % (w/v) concentration respectively. However, there was no significant difference
(p>0.05) in the denaturation temperature between chicken skin and bovine gelatin at a
concentration of 10 %. Similarly, the enthalpy change (ΔH) values of chicken skin gelatin were
higher than the bovine gelatin at all concentration (p<0.05). The enthalpy change (ΔH) values of
chicken gelatin were 0.36, 0.50, 0.60 and 0.88 J/g while for bovine gelatin they were 0.13, 0.14,
0.31 and 0.75 J/g at 3, 5, 7 and 10 % (w/v) concentration respectively. Results showed that the
enthalpy change (ΔH) values of both gelatins increased with concentration increase. However
there was no significant difference in (ΔH) values (p >0.05) between the concentration of 3 and 5
% for bovine gelatin. It is generally accepted that the endothermic process of collagenous
materials involves rupture of hydrogen bonds and a rearrangement of the triple helix into a
random configuration (Achet & He, 1995; Tanioka et al., 1976). At high gelatin concentration,
the junction zones concentration increases and the average distance between junction zones
decreases and high energy is needed to break hydrogen bonds and for helix to coil transitions.

16
The observed denaturation temperature of the gelatin gels was in the form of heat flow
detected by DSC which corresponded to the energy absorbed by gelatin gels to achieve the helix-
to-coil conformation through melting of the junction zones (Michon et al., 1997), however the
denaturation temperatures (Tm) of chicken gelatin were only slightly affected by the gelatin
concentration. In addition, the denaturation enthalpy depends on the imino acid content which is
related to the stabilization of the collagen structure. The amino acid composition especially imino
acids proline and hydroxyproline are believed to influence the rigidity of gelatin through
hydrogen bonding that stabilizes the triple-helix structure (Norziah, et al., 2008, Badii & Howell,
2006).
3.5 Raman spectroscopy
Table 5 shows the relative peak intensity of the spectral bands of chicken and bovine
gelatin powders as mean ± standard deviation of three replicates. The spectra (Figure not shown)
were baseline corrected, smoothed and normalised to the intensity of the aromatic amino acid
phenylalanine band at 1004 cm-1
which is not affected by the microenvironment or external
factors (Tu, 1986). There was no significant difference (p>0.05) between bovine and chicken
gelatin in the spectra which corresponds to the amino acid composition except for the band 990
cm-1
which indicated that chicken gelatin contained higher β sheet-type structure compared to
bovine gelatin (p<0.05).
Table 5 shows that the tyrosine doublet intensity ratio (I855/I 830) of chicken gelatin (0.87)
was lower than bovine gelatin (0.92). The involvement of tyrosine residues in the gelation of
gelatin was indicated by a decrease in the intensity ratio I855/I 830, which could be interpreted as an
increase in the role of phenolic hydroxyl groups as strong hydrogen bond donor, or an increase in
buriedness of the tyrosine residues within the gel network (Nonaka & Li-Chan, 1993). The results
obtained are in good agreement with previous research (Tu, 1986; Howell & Li-Chan, 1996) as a
high ratio (I 855/I 830) indicates that the tyrosine residue is exposed whereas a low ratio indicates
strong hydrogen bonding. Therefore, evidence of stronger hydrogen bonding of chicken gelatin is
reflected in the higher Bloom value compared to bovine gelatin.

17
Besides the tyrosine doublet (855 and 830 cm-1
) and aliphatic hydrophobic (C-H bending
and C-H stretching), information about protein tertiary structure is also provided by local
environments such as tryptophan. The bands at 760 and 1554 cm-1
that correspond to the indole
ring vibrations of the trytophan residues showed relative intensity values of (0.21, 0.22) and
(0.18, 0.25) for chicken and bovine gelatin respectively. The buried or exposed state of
tryptophan residue to the polar solvent or exposure of the tryptophan hydrophobic residues may
decrease the tryptophan intensity of bands near 760 1554 cm-1
bands.
Results for both gelatins showed strong bands at 1425 cm-1
which are 1.24 and 1.68 for
chicken and bovine gelatin respectively (p <0.05). The band around 1425 cm-1
is assigned to the
COO- symmetric stretch of the ionized carboxyl group vibration for aspartic and glutamic acid
residues (shoulder) and side chain vibrations of the imidazole ring of histidine (Howell & Li-
Chan, 1996; Li-Chan & Qin, 1998). Tu (1986) indicated that the carboxyl group vibrational
bands can be used to monitor the state of ionization since the ionized group (COO-) exhibits a
band at 1400-1420 cm-1
while the undissociated form (COOH) exhibits bands at 1700-1750 cm-1
.
C-H deformation (bending and stretching) mode of aliphatic amino acids residues appear
in the 1400-1500 cm-1
and 2800-3000 cm-1
region respectively. The intensity values of CH–
bending at 1451 cm-1
which was assigned as an aliphatic hydrophobic (CH2 and CH3 bending
vibration) was 3.77 and 4.93 for chicken and bovine gelatin, respectively. Li-Chan et al., (1994)
have reported that the changes in C-H bending band intensity are a function of polarity of the
solvent or microenvironment, suggesting its possible application to monitor hydrophobic
interaction between aliphatic residues. The C-H stretching vibrational bands of aliphatic amino
acid residues at 2940 cm-1
(CH2 asymmetric stretching vibration) were 14.63 and 13.61
respectively for chicken and bovine gelatin which are not significantly different (p>0.05). Similar
to the C-H bending, a shift in the location of the C-H stretching band near 2940 cm-1
to higher
wavenumbers may suggest sensitivity of this band to the polarity of the microenvironment and to
protein denaturation (Arteaga, 1994). There was no clear role of hydrophobic amino acids in the
differences in the rheological properties of chicken and bovine gelatins in the present study.
18
Moreover, the amide I and III bands are very useful for the investigation of secondary
structure of the amide (peptide) bond of proteins with several distinct vibrational modes (Tu,
1986; Susi & Byler, 1988; William, 1986). The Raman bands for amide I is 1645-1685 cm-1
and
for amide III is 1200-1350 cm-1
. The amide I band arises primarily from in-plane peptide C=O
stretching vibrations and partly from in-plane N-H bending vibrations. The exact location of the
amide I band in the Raman spectrum depends on hydrogen bonding and conformation of the
polypeptide or protein molecule. Generally, proteins with high α-helix, ß-sheet, and random coil
show an amide I band centred at 1645-1657 cm-1
, 1665-1680 cm-1
and 1660cm-1
respectively.
Amide I bands often shows several components or shoulders in the region because most proteins
have mixed secondary structure (Li Chan et al., 1994; Ngarize et al., 2004). In this study
however, most peaks were centred around 1660 cm-1
; there was a significant difference (p< 0.05)
between chicken (3.36) and bovine (3.90) gelatin (Table 5).
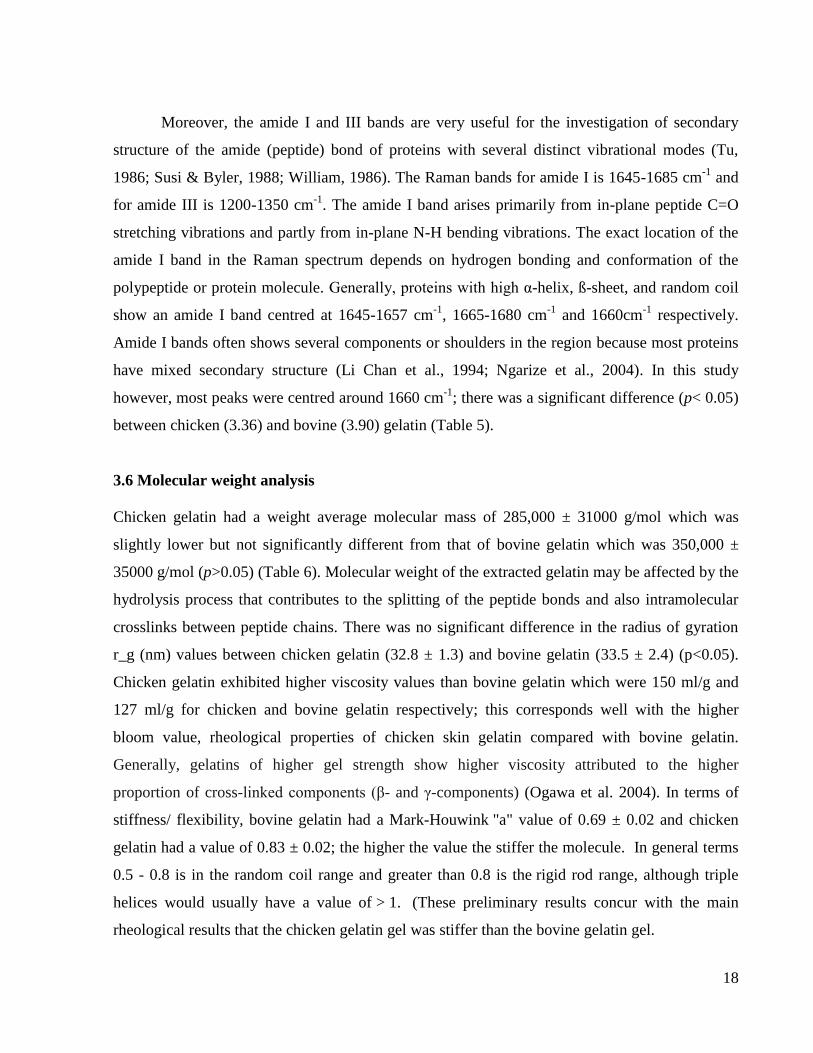
3.6 Molecular weight analysis
Chicken gelatin had a weight average molecular mass of 285,000 ± 31000 g/mol which was
slightly lower but not significantly different from that of bovine gelatin which was 350,000 ±
35000 g/mol (p>0.05) (Table 6). Molecular weight of the extracted gelatin may be affected by the
hydrolysis process that contributes to the splitting of the peptide bonds and also intramolecular
crosslinks between peptide chains. There was no significant difference in the radius of gyration
r_g (nm) values between chicken gelatin (32.8 ± 1.3) and bovine gelatin (33.5 ± 2.4) (p<0.05).
Chicken gelatin exhibited higher viscosity values than bovine gelatin which were 150 ml/g and
127 ml/g for chicken and bovine gelatin respectively; this corresponds well with the higher
bloom value, rheological properties of chicken skin gelatin compared with bovine gelatin.
Generally, gelatins of higher gel strength show higher viscosity attributed to the higher
proportion of cross-linked components (β- and γ-components) (Ogawa et al. 2004). In terms of
stiffness/ flexibility, bovine gelatin had a Mark-Houwink "a" value of 0.69 ± 0.02 and chicken
gelatin had a value of 0.83 ± 0.02; the higher the value the stiffer the molecule. In general terms
0.5 - 0.8 is in the random coil range and greater than 0.8 is the rigid rod range, although triple
helices would usually have a value of > 1. (These preliminary results concur with the main
rheological results that the chicken gelatin gel was stiffer than the bovine gelatin gel.

19
4. Conclusions
Chicken gelatin from skin waste by-product can provide an alternative source of gelatin.
as it shows similar chemical composition to bovine gelatin and better physicochemical properties
compared with reported fish gelatins. The bloom strength of chicken gelatin (355 ± 1.48 g) was
significantly higher than bovine gelatin (229 ± 0.71 g) but both formed stable structures on
cooling. Chicken gelatin indicated higher gelling and melting properties, showing greater
increases in the G', G" and maximum values with increase in the concentration compared to
bovine gelatin. The strength of gelatin gel, measured as a function of the frequency sweeps
showed that G' of chicken gelatin was higher than that of bovine gelatin at all concentrations
tested and stable in the frequency range tested.
The higher DSC thermal transition values and higher enthalpy change (ΔH), on cooling
and heating, shown by all concentrations of chicken gelatin compared with bovine gelatin,
indicate that chicken gelatin was more heat stable probably due to the higher imino acids (Pro
and H.Pro) content. FT-Raman analysis indicated a lower tyrosine doublet ratio and therefore
more hydrogen bonding, as well as higher β-sheet type structure values, typical of stronger gels,
by chicken gelatin compared with bovine gelatin. Both gelatins had high MW that was not
significantly different; thus MW does not appear to be the main reason for differences in gel
strength in this study. Although, the different origin and extraction processes can influence the
properties of gelatins obtained, results from this study show that chicken skin gelatin has high
potential to be an alternative to commercial gelatin.
ACKNOWLEDGEMENTS
The authors gratefully acknowledge funding received from the Malaysian Government for
Norizah Mhd Sarbon’s PhD studentship. We would also like to thank Professor Steve Harding
and Dr Gordon Morris, University of Nottingham, Sutton Bonington for analysing the gelatin
samples for molecular weight by SEC-MALLS and differential pressure viscometry.

20
5. REFERENCES
Achet, D. & He, X.W. (1995). Determination of the renaturation level in gelatin films. Polymer;
(36): 787-791.
AOAC. (2006). Official methods of analysis of AOAC international (18th
ed.). Virginia, USA:
Association of Official and Analytical Chemists International.
Arnesen, J.A., & Gildberg, A., (2002). Preparation and characterisation of gelatin from the skin
of harp seal (Phoca groendlandica). Bioresource Tech. 82, 191–194.
Arnesen, J. A., & Gildberg, A. (2007). Extraction and characterization of gelatin from Atlantic
salmon (Salmo salar) skin. Bioresource Technology, 98, 53–57.
Arteaga, G.E. (1994). Assessment of protein surface hydro-phobicity by spectroscopic methods
and its relation to emulsifying properties of proteins. In: Ph.D. thesis, Department of Food
Science, The University of British Columbia, Vancouver, B. C., Canada.
Babin, H., & Dickinson, E. (2001). Influence of transglutaminase treatment on the
thermoreversible gelation of gelatin. Food Hydocolloids, 15(3), 271–276.
Badii, F., & Howell, N. K. (2002). Changes in the texture and structure of cod (Gadus morhua)
and haddock (Melanogrammus aeglefinus) during frozen storage. Journal of Science of Food and
Agriculture, 82 87-97.
Badii, F., & Howell, N. K. (2003). Elucidation of the effect of formaldehyde and lipids on frozen
stored cod collagen by FT-Raman spectroscopy and differential scanning calorimetry. J. Agric.
Food Chem. 51, 1440-1446
Badii, F., & Howell, N. K. (2006). Fish gelatin: Structure, gelling properties and interaction with
egg albumen proteins. Food Hydrocolloids, 20, 630–640.
Binsi, P.K., Shamasundara, B.A., Dileepa, A.O., Badii, F., & Howell, N.K. (2009). Rheological
and functional properties of gelatin from the skin of Bigeye snapper (Priacanthus hamrur) fish:
Influence of gelatin on the gel-forming ability of fish mince. Food Hydrocolloids 23, 132–145.
British Standard Institution (BSI), (1975). Methods for sampling and testing gelatins (physical
and chemical methods).London:BSI.
Cardinali, B., Profumo, A., Aprile, A., Byron, O., Morris, G., Harding, S.E., Stafford, W.F. &
Rocco, M. (2010). Hydrodynamic and mass spectrometry analysis of nearly-intact human
fibrinogen, chicken fibrinogen, and of a substantially monodisperse human fibrinogen fragment
X. Archives of Biochemistry and Biophysics, 493, 157–168.

21
Cheow, C.S., Norizah, M.S., Kyaw, Z.Y., & Howell, N.K. (2007). Preparation and
characterisation of gelatins from the skins of sin croaker (Johnius dussumieri)and shortfin scad
(Decapterus macrosoma). Food Chemistry, 101(2007), 386–391.
Chiou, B.S., Avena-Bustillos, R.J., Shey, J., Yee, E., Bechtel, P.J., Imam, S.H., Glenn, G.M. &
Orts, W.J. (2006). Rheological and mechanical properties of cross-linked fish gelatins. Polymer
47, 6379-6386.
Choi, S.S., & Regenstein, J.M. (2000). Physico-chemical and sensory characteristics of fish
gelatin. Journal of Food Science, 65, 194–199.
Cho, S., Jahncke, M.L., Chin, K., & Eun, J. (2006). The effect of processing conditions on the
properties of gelatin from skate (Raja Kenojei) skins. Food Hydrocolloids, 20(6), 810–816.
Comfort, S., & Howell, N.K. (2002). Gelation properties of soya and whey protein isolate
mixtures. Food Hyrocolloids, 16, 661–672.
Fernandez-Diaz, M.D., Gomez-Guillen, M.C., & Montero, P., (2003). Effect of freezing fish skin
on molecular and rheological properties of extracted gelatine. Food Hydrocoll 17, 281–286.
Gelatin Manufacturers of Europe (GME), (2000). Standardised methods for the testing of edible
gelatin. Gelatin Monograph, version July 2000.
Gilsenan, P.M., & Ross-Murphy, S.B. (2000a). Rheological characterisation of gelatins from
mammalian and marine sources. Food Hydrocolloids, 14, 191–195.
Gilsenan, P.M., & Ross-Murphy, S.B. (2000b). Viscoelasticity of thermoreversible gelatin gels
from mammalian and piscine collagens. Journal of Rheology, 44(4), 871–883.
Go´ mez-Guille´ n, M.C., Turnay, J., Fernandez-Diaz, M. D., Ulmo, N., Lizarbe, M. A., &
Montero, P. (2002). Structural and physical properties of gelatin extracted from different marine
species: a comparative study. Food Hydrocolloids, 16, 25–34.
Gudmundsson. (2002). Rheological properties of fish gelatin. Journal of Food Science, 67, 2172–
2176.
Gudmundsson, M. & Hafsteinsson, H. (1997). Gelation from cod skins as affected by chemical
treatments. J. Food Sci., 62, 37-47.
Grossman, S., & Bergman, M., (1992). Process for the production of gelatin from the fish skins.
US Patent 5,093,474.

22
Howell, N.K., Arteaga, G., Nakai, S., & Li-Chan, E.C.Y. (1999). Raman spectral analysis in the
C-H stretching region of proteins and amino acids for investigation of hydrophobic interactions.
J. Agric. Food Chem. 1999, 47, 924-933.
Howell, N. K., & Li-Chan, E. C. Y. (1996). Elucidation of interactions of lysozyme with whey
proteins by Raman spectroscopy. International Journal of Food Science and Technology, 31,
439–451.
Howell, N.K. & Saeed, S. (1999). The effect of antioxidants on the production of lipid oxidation
products and transfer of free radicals in oxidised lipid-protein systems. In: Antioxidants in
Human Health and Disease (Chapter 4) (edited by T.K. Basu, N.J. Temple & M.L. Garg). Pp. 43–
54. Wallingford: CABI Publishers.
Hudson, H.M., Daubert, C.R. & Foegeding, E.A. (2000). Rheological and physical properties of
derivatized whey protein isolate powders. Journal of Agricultural and Food Chemistry, 48,
3112–3119.
Jamilah, B., & Harvinder, K. G. (2002). Properties of gelatins from skins of fish-black tilapia
(Oreochromis mossambicus) and red tilapia (Oreochromis nilotica). Food Chemistry, 77, 81–84.
Johnston-Banks, F. A. (1990). Gelatine. In P. Harris (Ed.), Food gels (pp. 233–285). London:
Elsevier Applied Science.
Jun, M., Lee, J.M., Lee, K.S., & Kim, K.O. (2000). The effect of preparation conditions on the
properties of Jokpyun (traditional Korean gel type food) model system. Food Science and
Biotechnology, 9(27), 27–31.
Karim, A.A. & Bhat, R. (2009). Fish gelatin: properties, challenges, and prospects as an
alternative to mammalian gelatins, Food Hydrocolloids 23, 563–576.
Kasankala, L. M., Xue, Y., Weilong, Y., Hong, S. D., & He, Q. (2007). Optimization of gelatine
extraction from grass carp (Catenopharyngodon idella) fish skin by response surface
methodology. Bioresource Technology, 98, 3338–3343.
Kolodziejska, I., Kaczorowski, K., Piotrowska, B., & Sadowska, M., (2004). Modification of the
properties of gelatine from skins of Baltic cod (Gadus morhua) with transglutaminase. Food
Chem. 86, 203–209.
Leuenberger, B.H. (1991). Investigations of viscosity and gelation properties of different
mammalian and fish gelatins. Food Hydrocolloids 5:353-361.
Li-Chan, E., & Qin, L. (1998). Application of Raman spectroscopy to the structural analysis of
food protein networks. In D. J. Sessa, and J. L. Willett (Eds.), Paradigm for successful utilisation
of renewable resources (pp. 123–137). Illinois, USA: AOCS Press.

23
Li-Chan, E., Nakai, S., and Hirotsuka, M. (1994). Raman spectroscopy as a probe of protein
structure in food systems. Ch.8. In Protein Structure-Function Relationships in Foods, R.Y.Yada,
R.L., Jackman and J.L. Smith (Eds.) p. 163-197. Blackie Academic & Profesional, Chapman &
Hall Inc., London , England.
Lim, J.Y., Oh, S.S., & Kim, K.O. (2001). The effects of processing conditions on the properties
of chicken feet gelatin. Food Science and Biotechnology, 10(6), 638–645.
Michon, C., Cuvelier, G., Launay, B., & Parker, A. (1997). Interactions in mixture of gelatin and
i-carrageenan. In E. Dickinson and B. Bergenstahl, Food colloids. Proteins, lipids and
polysaccharides (pp. 316–325). Cambridge: The Royal Society of Chemistry.
McClements, D.J. (2005). Food emulsions: Principles, practice and techniques. Boca Raton,
FL:CRC Press.
Morrison, N. A., Clark, R. C., Chen, Y. L., Talashek, T., & Sworn, G. (1999). Gelatin
alternatives for the food industry. In K. Nishinari, F. Kremer, and G. Lagaly (Eds.), Physical
chemistry and industrial application of gellan gum (pp. 127e131). Heidelberg: Springer Verlag.
Ngarize, S., Adams, A., & Howell, N. (2004). Studies on egg albumen and whey protein
interactions by FT-Raman spectroscopy and rheology. Food Hydrocolloids, 18, 49–59.
Nonaka, M. & Li-Chan, E. (1993). Raman spectroscopic study of thermally induced gelation of
whey proteins. Journal of Agricultural Food Chemistry, 41, 1176–1181.
Norziah, M.H., Al-Hassan, A., Khairulnizam, A.B., Mordi, M.N. &Norita M. (2008).
Characterization of fish gelatin from surimi processing wastes: Thermal analysis and effect of
transglutaminase on gel properties. Food Hydrocolloids, 23, 1610–1616.
Ogawa, M., Portier, R.J., Moody, M.W., Bell, J., Schexnayder, M.A. & Losso J.N. (2004).
Biochemical properties of bone and scale collagens isolated from the subtropical fish black drum
(Pogonia cromis) and sheepshead seabream (Archosargus probatocephalus), Food Chemistry 88,
495–501.
Ross-Murphy, S. B. (1991). Incipient behaviour of gelatin gels. Rheologica Acta, 30, 401–411.
Rother, J. (1995). Edible gelatin types, use and application in the food industry. Food Technology
Europe , 32–42.
Simon, A., Grohens, Y., Vandanjon, L., Bourseau, P., Balnois, E., & Levesque, G. (2003). A
comparative study of the rheological and structural properties of gelatin gels of mammalian and
fish origins. Macromolecular Symposia, 203, 331–338.
Susi, H. & Byler, D.M. (1988) ‘Fourier Deconvolution of the amide I Raman band of proteins as
related to conformation’ in Appl. Spectrosc. 42, 819-826

24
Tanioka, A., Miyasaka, K. & Ishikawa, K. (1976). Reconstitution of collagen fold structure with
stretching gelatin film. Biopolymers; (15): 1505-1511.
Tu, A.T. (1986). Peptide backbone conformat ion and microenvironment of protein side-chains.
In R. J. H. Clark, & R. E. Hester (Eds.), Spectroscopy of biological systems (pp. 47–112). New
York: Wiley.
Ward, A.G. & A. Courts, (1977). The science and technology of gelatin. London: Academic Press
inc. LTd.
Williams, R.W. (1986). ‘Protein secondary structure analysis using Raman amide I and amide
IIISpectra’ in Methods Enzymol. 130, 311-331.
Yang, H., Wang, Y., Jiang, M., Oh, J. H., Herring, J., & Zhou, P. (2007). 2-step optimization of
the extraction and subsequent physical properties of channel catfish (Ictalurus punctatus) skin
gelatin. Journal of Food Science, 72, C188–C195.
Zhou, P., Mulvaney, S. J., & Regenstein, J. M. (2006). Properties of Alaska pollock skin gelatin:
a comparison with Tilapia and pork skin gelatins. Journal of Food Science, 71, C313–C321.

25
Table 1 Proximate composition of chicken skin and bovine gelatin
Composition Chicken
skin gelatin (%)
Bovine
gelatin (%)
Yield 16 % ± 0.91 -
Moisture 9.81 ± 0.05 9.68 ± 0.06
Protein 80.76 ± 0.30 81.75 ± 0.50
Ash 0.37 ± 0.02 1.06 ± 0.00
Values are the means ± standard deviation of three replicates.
Table 2 Amino acid composition of chicken skin and bovine gelatin
Amino acids
Chicken skin gelatin
(%)
Bovine gelatin
(%)
Asp 2.11 ± 0.02 3.29 ± 0.01
Glu 5.84 ± 0.01 5.43 ± 0.03
H.Pro 12.13 ± 0.02 10.67 ± 0.11
Ser 2.20 ± 0.00 2.93 ± 0.08
Gly 33.70 ± 0.02 37.05 ± 0.11
His 0.30 ± 0.01 -
Arg 5.57 ± 0.00 5.09 ± 0.04
Thr 1.01 ± 0.00 0.82 ± 0.03
Ala 10.08 ± 0.02 8.41 ± 0.10
Pro 13.42 ± 0.01 12.66 ± 0.14
Tyr 1.22 ± 0.01 1.16 ± 0.01
Val 1.94 ± 0.02 2.07 ± 0.02
Met 0.07 ± 0.00 0.22 ± 0.13
Cys 0.16 ± 0.00 0.47 ± 0.00
Ileu 1.15 ± 0.00 1.01 ± 0.01
Leu 2.63 ± 0.00 1.89 ± 0.01
Phe 1.77 ± 0.00 1.60 ± 0.02
Trp 0.04 ± 0.00 0.48 ± 0.00
Lys 4.66 ± 0.00 4.86 ± 0.05
Values are means ± SD of three determinations.

26
Table 3. Rheological properties of 6.67 % (w/v) chicken and bovine gelatin including
gelling and melting temperature, and elastic (G') and loss (G") modulus values after
heating to 40oC and cooling to 10
oC.
Values are means ± SD of three determinations.
a–b Mean within a row with different letters are significantly difference (p < 0.05).
Table 4: Denaturation temperature(Tm) and enthalpy value (ΔH) of chicken and bovine
gelatin at different concentrations in distilled water.
Conc. (%) Tm (°C) Enthalpy (ΔH, J/g)
Chicken Bovine Chicken Bovine
10 31.16 ± 0.35a 27.57 ± 2.00a 0.88 ± 0.05aA 0.75 ± 0.00cB
7 31.08 ± 0.40a 26.41 ± 0.41b 0.60 ± 0.02bA 0.31 ± 0.02bB
5 30.73 ± 0.18a 25.97 ± 1.25b 0.50 ± 0.01cA 0.14 ± 0.03aB
3 30.99 ± 0.14a 25.91 ± 0.53b 0.36 ± 0.01dA 0.13 ± 0.01aB
Each value is a mean of triplicate determinations and is reported with its standard deviation.
a–b Means within a column with different letters are significantly different (p< 0.05) on Tm and
a–d Means within a row with different letters are significantly different (p < 0.05) on ΔH and
A-B Means within a column with different letters are significantly different (p < 0.05) on ΔH.
Analyses were carried out by using ANOVA followed by LSD test.
Gelatin
Gelling
Temp.(ºC)
Melting
Temp. (ºC)
Maximum value after cooling
6.67 (%) G' [ Pa] G" [ Pa]
Chicken 24.88 ± 0.27a 33.57 ± 0.52a 8273 ± 1016a 6639 ± 1192a
Bovine 24.43 ± 0.91a 31.55 ± 0.04b 4330 ± 31b 4121 ± 59b

27
Table 5. Relative peak intensity of Raman spectra of chicken and bovine gelatin.
Peak assignment (wavenumbers (cm -1
) Relative peak intensity of gelatin
Chicken Bovine
Trp (760) 0.21 ± 0.02 a 0.22 ± 0.03 a
Tyr (830) 0.82 ± 0.08 a 0.98 ± 0.06 a
Tyr (855) 0.72 ± 0.05 a 0.91 ± 0.04 a
Tyr (855/830) 0.87 ± 0.05 a 0.92 ± 0.01 a
α-Helix C-C Stretch, CH3 symmetric stretch (920) 1.02 ± 0.03 a 1.36 ± 0.02 a
β -Sheet like structure (990) 0.07 ± 0.00 a 0.02 ± 0.00 b
Phe, ring band (1034) 0.76 ± 0.02 a 0.90 ± 0.11 a
Isopropyl anti symmetric stretch CH stretch back bone
(1128)
0.25 ± 0.04 a 0.25 ± 0.01 a
CH3 anti symmetric (aliphatic), CH3 rock (aromatic) (1160) 0.53 ± 0.08 a 0.65 ± 0.05 a
Amide III - β -Sheet type structure (1239) 2.55 ± 0.20 a 3.20 ± 0.10 a
Amide II (1320) 1.43 ± 0.19 a 1.86 ± 0.05 a
H band doublet from Trp (1340) 0.94 ± 0.14 a 1.36 ± 0.05 a
(Sh*, residue vibration) asp, glu, lys (1425) 1.24 ± 0.03 a 1.68 ± 0.03 b
Aliphatic groups CH bend (1451) 3.77 ± 0.22 a 4.93 ± 0.15 b
Trp (1554) 0.18 ± 0.02 a 0.25 ± 0.07 a
Amide I (1660) 3.36 ± 0.18 a 3.90 ± 0.14 a
CH stretch, aliphatic (2940) 14.63 ± 1.06 a 13.61 ± 0.42a
shoulder (2888) 5.49 ± 0.34 a 4.97 ± 0.15 a
shoulder (2976) (2969) 9.48 ± 0.73 a 8.84 ± 0.29 a
Each value is a mean of three replicate determinations and is reported with its standard deviation.
a–b Means within a column with different letters are significantly different (p< 0.05).
Sh* Shoulder.
Table 6. Weight average molecular mass‹M›w, intrinsic viscosity [] and radius of
gyration r_g (nm) of extracted chicken skin gelatin compared to bovine gelatin.
Gelatin Mw (g/mol) [] (ml/g)
r_g (nm)
Chicken skin 285,000 ± 31000 150 ± 18
32.8 ± 1.3
Bovine 350,000 ± 35000 127 ± 9
33.5 ± 2.4
Each value is a mean of three replicate determinations and is reported with its standard deviation.
28
List of figure headings
Figure 1. Viscoelastic properties upon cooling and heating of gelatin preparations. Changes in G'
and G" values of bovine gelatin (6.67 %) were monitored during cooling from 40 to 10˚C and
subsequent heating from 10 to 40˚C.
Figure 2. Viscoelastic properties upon cooling and heating of gelatin preparations. Changes in G'
and G" values of chicken gelatin (6.67 %) were monitored during cooling from 40 to 10˚C and
subsequent heating from 10 to 40˚C.
Figure 3. The effect of gelatin concentration on the gelling temperature (°C) of bovine and
chicken gelatin during cooling from 40 to 10˚C.
Figure 4. The effect of gelatin concentrations on the melting temperature (°C) of a) bovine and b)
chicken gelatin during heating from 10 to 40˚C.
Figure 5. Elastic modulus (G') in the frequency sweep of different concentrations (3, 5, 7 and10%
(w/v)) of chicken gelatin at 10 ºC.
Figure 6. Elastic modulus (G') in the frequency sweep with different concentrations (3, 5, 7 and
10% (w/v)) of bovine gelatin at 10ºC.
Figure 7. Dynamic storage (G') and loss (G") modulus in frequency sweeps of bovine (BG) and
chicken gelatin (CG) with various concentrations: a) 3 %, b) 5 %, c) 7 % and d) 10 % (w/v).
Figure 8. DSC thermogram of denaturation temperature for bovine and chicken gelatin at
concentration of 6.67 % which heated from 10 to 90 °C.

29
Figure 1
Figure 2

30
Figure 3
Figure 4
31
Figure 5
Figure 6

32
Figure 7
a) b)
c) d)

33
Figure 8