PREPA 2018-2019 IRP Stakeholder Meeting · PREPA 2018-2019 IRP Stakeholder Meeting MARCH 2019...
54
PREPA 2018-2019 IRP Stakeholder Meeting MARCH 2019 Siemens PTI Confidential & Proprietary © Siemens Industry, Inc. 2018 DRAFT
Transcript of PREPA 2018-2019 IRP Stakeholder Meeting · PREPA 2018-2019 IRP Stakeholder Meeting MARCH 2019...
PREPA 2018-2019 IRP
Stakeholder MeetingMARCH 2019
Siemens PTIConfidential & Proprietary ©
Siemens Industry, Inc. 2018
DRAFT
Page 2 Unrestricted © Siemens Industry, Inc. 2018
AGENDA
▪ Objectives
▪ Design Concepts
▪ Scenarios / Sensitivities
▪ Results of the Long Term Capacity Expansion Plans
▪ Resource Action Plan
▪ Questions & Answers
Objectives
WWW.Siemens.comUnrestricted
Page 4 Unrestricted © Siemens Industry, Inc. 2018
PRIMARY STRATEGIC OBJECTIVES
From the stakeholder process and Board Vision the following central objectives were
considered: Economic Growth Engine:
▪ Resiliency: The IRP has to result in a resilient system that is able to prepare, manage and
timely recovery from extreme weather events like hurricane Maria.
▪ Financially Viable: the plan has to minimize the cost of supply and drastically reduce the
dependence on imported fuels and the associated volatility
▪ Sustainable: The Puerto Rico electric system has to transition from one centered on fossil fuels
to one in which renewable resources play a central, if not, the predominant role.
▪ Customer-Centric: Costumer participation via energy efficiency, customer side energy
resources (distributed generation) and demand response have a predominant role in the supply
and consumption matrix of Puerto Rico. Customers are empowered to participate and take
ownership on their energy security and affordability
▪ Economic Growth Engine: promote and support the economy of Puerto Rico.
Page 5 Unrestricted © Siemens Industry, Inc. 2018
TACTICAL OBJECTIVES
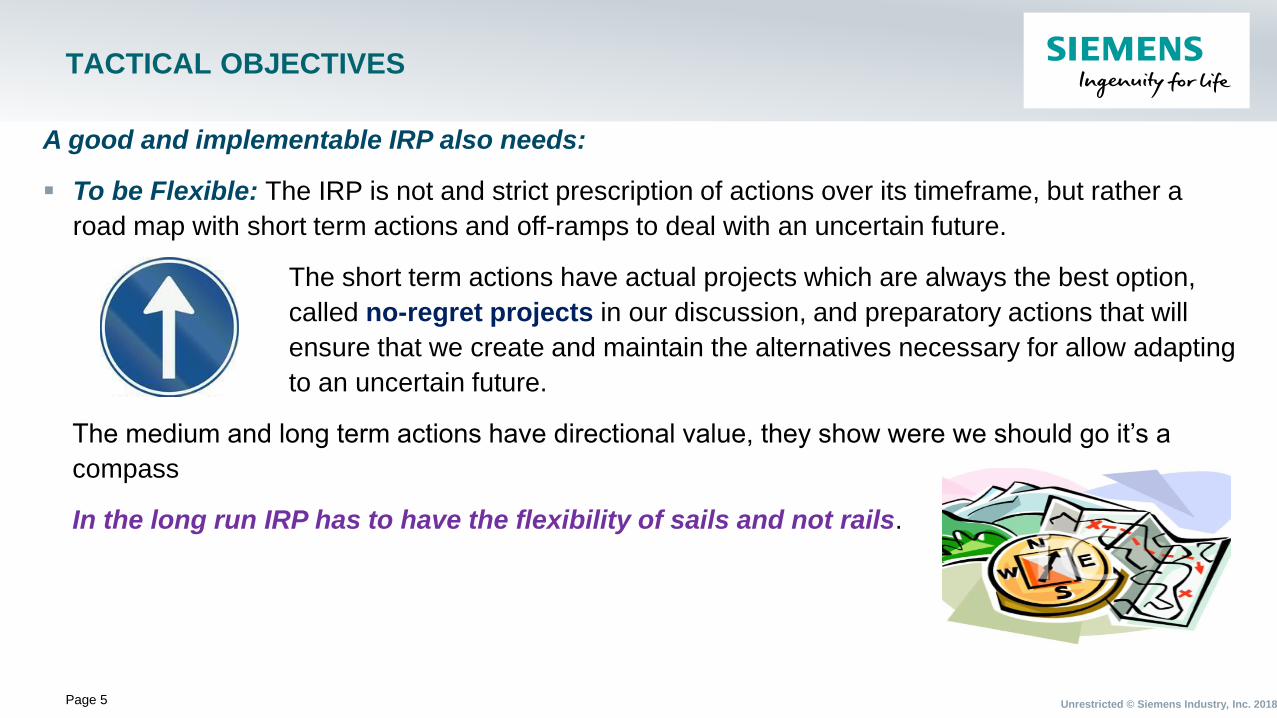
A good and implementable IRP also needs:
▪ To be Flexible: The IRP is not and strict prescription of actions over its timeframe, but rather a
road map with short term actions and off-ramps to deal with an uncertain future.
The short term actions have actual projects which are always the best option,
called no-regret projects in our discussion, and preparatory actions that will
ensure that we create and maintain the alternatives necessary for allow adapting
to an uncertain future.
The medium and long term actions have directional value, they show were we should go it’s a
compass
In the long run IRP has to have the flexibility of sails and not rails.
This Photo by Unknown Author is licensed under CC BY-SA
Page 6 Unrestricted © Siemens Industry, Inc. 2018
TACTICAL OBJECTIVES
A good and implementable IRP also needs:
▪ To be Practical: the plan must be implementable and account for
physical limitations on number of projects that can be carried out in
parallel, without compromising the reliability of the system and the ability
to manage them
▪ To be Pragmatic: While forward looking and based on the use of new
technologies as storage, the technical risks must be managed and the
adoption measured, particularly as we are moving towards drastic
departure from the way the system is being operated.
The IRP will change the system but it must be done prudently.
This Photo by Unknown Author is licensed under CC BY-SA
Design Concepts
WWW.Siemens.comUnrestricted
Page 8 Unrestricted © Siemens Industry, Inc. 2018
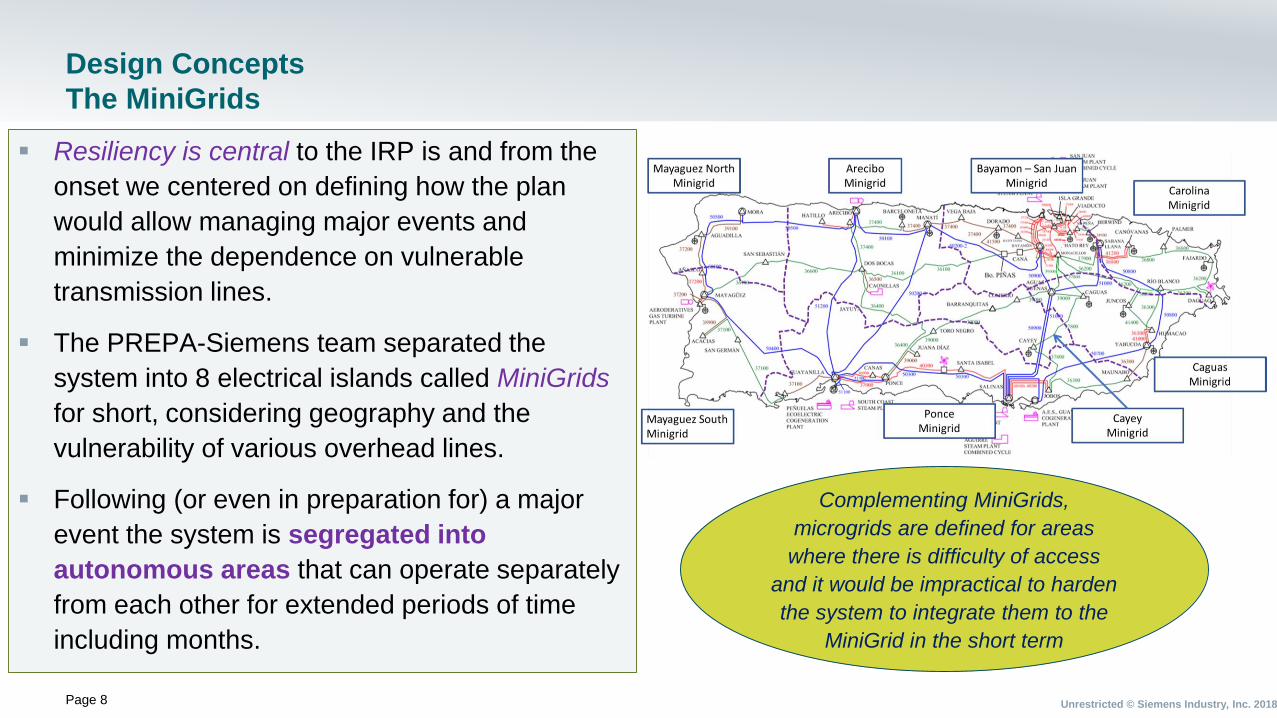
Design Concepts
The MiniGrids
▪ Resiliency is central to the IRP is and from the
onset we centered on defining how the plan
would allow managing major events and
minimize the dependence on vulnerable
transmission lines.
▪ The PREPA-Siemens team separated the
system into 8 electrical islands called MiniGrids
for short, considering geography and the
vulnerability of various overhead lines.
▪ Following (or even in preparation for) a major
event the system is segregated into
autonomous areas that can operate separately
from each other for extended periods of time
including months.
Complementing MiniGrids,
microgrids are defined for areas
where there is difficulty of access
and it would be impractical to harden
the system to integrate them to the
MiniGrid in the short term
Page 9 Unrestricted © Siemens Industry, Inc. 2018
Design Concept
The MiniGrids
The MiniGrids (and microgrids) are designed with a dual approach:
Generation Resource Selection:
▪ Critical loads be served by thermal resources only; full coverage right after the
event.
▪ Priority loads to be served by a combination of thermal resources and PV +
Storage as assigned by the IRP.
▪ Balance of loads to be served by a combination of thermal resources and PV
+ Storage and on grid isolated mode some level of load shed is accepted, but
should be minimized.
Transmission / Distribution design:
▪ Hardening / new underground facilities to create a MiniGrid backbone to which
the generation is connected and loads are served from.
▪ Building underground facilities for interconnection of critical loads
▪ New underground reliable facilities for the Interconnection of MiniGrids and
faster consolidation ‘
▪ Hardening of the existing infrastructure as complementary to the above.
The IRP Resource Plan
must be focused on
distributed resources
Transmission &
Distribution Investments
are critical for the
relation of the plan
benefits
Page 10 Unrestricted © Siemens Industry, Inc. 2018
Design Concepts
Customer Initiatives
The IRP includes a number of customers initiatives :
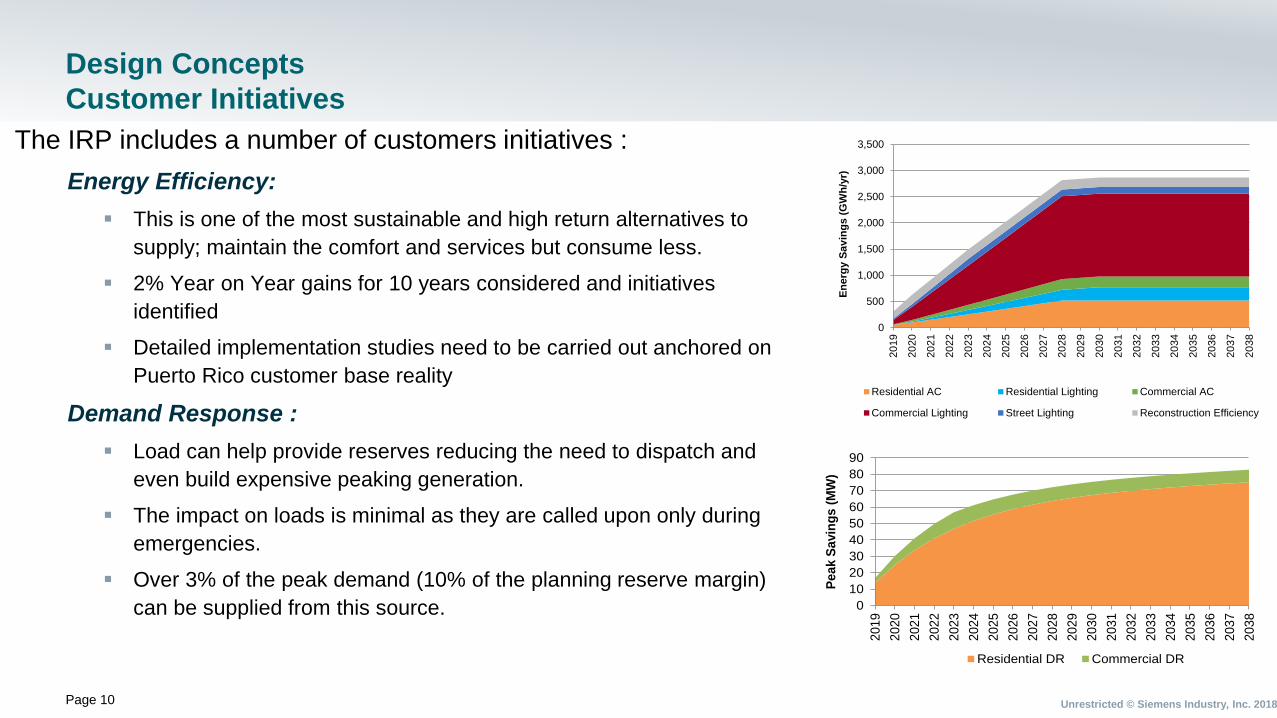
Energy Efficiency:
▪ This is one of the most sustainable and high return alternatives to
supply; maintain the comfort and services but consume less.
▪ 2% Year on Year gains for 10 years considered and initiatives
identified
▪ Detailed implementation studies need to be carried out anchored on
Puerto Rico customer base reality
Demand Response :
▪ Load can help provide reserves reducing the need to dispatch and
even build expensive peaking generation.
▪ The impact on loads is minimal as they are called upon only during
emergencies.
▪ Over 3% of the peak demand (10% of the planning reserve margin)
can be supplied from this source.
0
500
1,000
1,500
2,000
2,500
3,000
3,500
20
19
20
20
20
21
20
22
20
23
20
24
20
25
20
26
20
27
20
28
20
29
20
30
20
31
20
32
20
33
20
34
20
35
20
36
20
37
20
38
En
erg
y S
av
ing
s (
GW
h/y
r)
Residential AC Residential Lighting Commercial AC
Commercial Lighting Street Lighting Reconstruction Efficiency
0
10
20
30
40
50
60
70
80
90
201
9
202
0
202
1
202
2
202
3
2024
202
5
202
6
2027
202
8
202
9
203
0
203
1
203
2
203
3
203
4
2035
203
6
203
7
2038
Pe
ak
Sa
vin
gs (
MW
)
Residential DR Commercial DR
Page 11 Unrestricted © Siemens Industry, Inc. 2018
The IRP includes a number of customers initiatives :
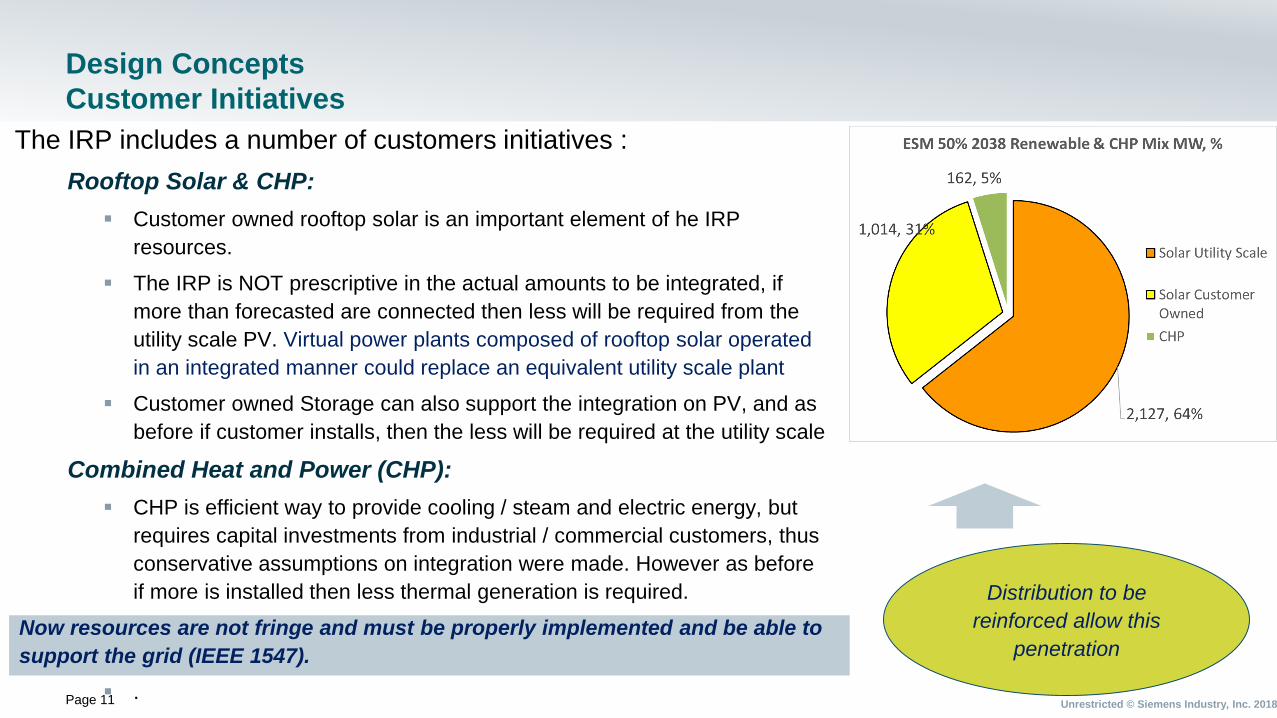
Rooftop Solar & CHP:
▪ Customer owned rooftop solar is an important element of he IRP
resources.
▪ The IRP is NOT prescriptive in the actual amounts to be integrated, if
more than forecasted are connected then less will be required from the
utility scale PV. Virtual power plants composed of rooftop solar operated
in an integrated manner could replace an equivalent utility scale plant
▪ Customer owned Storage can also support the integration on PV, and as
before if customer installs, then the less will be required at the utility scale
Combined Heat and Power (CHP):
▪ CHP is efficient way to provide cooling / steam and electric energy, but
requires capital investments from industrial / commercial customers, thus
conservative assumptions on integration were made. However as before
if more is installed then less thermal generation is required.
Now resources are not fringe and must be properly implemented and be able to
support the grid (IEEE 1547).
▪ .
Design Concepts
Customer Initiatives
Distribution to be
reinforced allow this
penetration
Page 12 Unrestricted © Siemens Industry, Inc. 2018
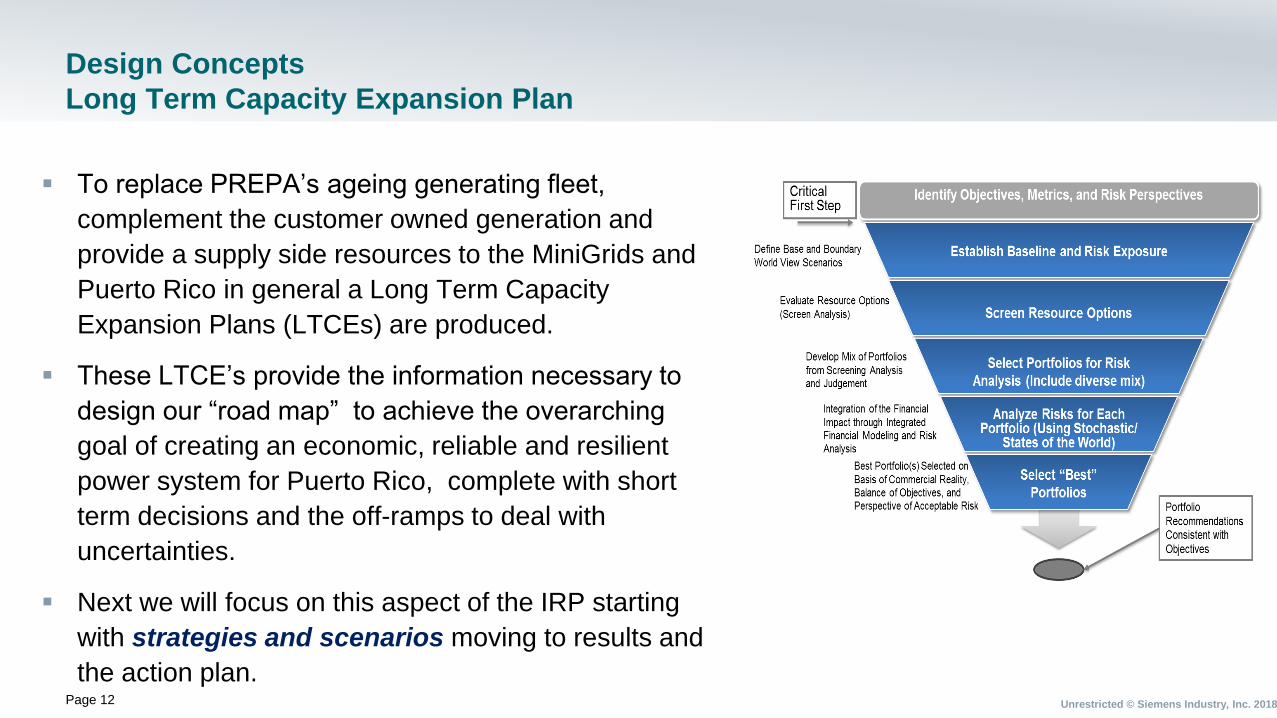
Design Concepts
Long Term Capacity Expansion Plan
▪ To replace PREPA’s ageing generating fleet,
complement the customer owned generation and
provide a supply side resources to the MiniGrids and
Puerto Rico in general a Long Term Capacity
Expansion Plans (LTCEs) are produced.
▪ These LTCE’s provide the information necessary to
design our “road map” to achieve the overarching
goal of creating an economic, reliable and resilient
power system for Puerto Rico, complete with short
term decisions and the off-ramps to deal with
uncertainties.
▪ Next we will focus on this aspect of the IRP starting
with strategies and scenarios moving to results and
the action plan.
Long Term Capacity
Expansion Plans (LTCE’s)
WWW.Siemens.comRestricted
Page 14 Unrestricted © Siemens Industry, Inc. 2018
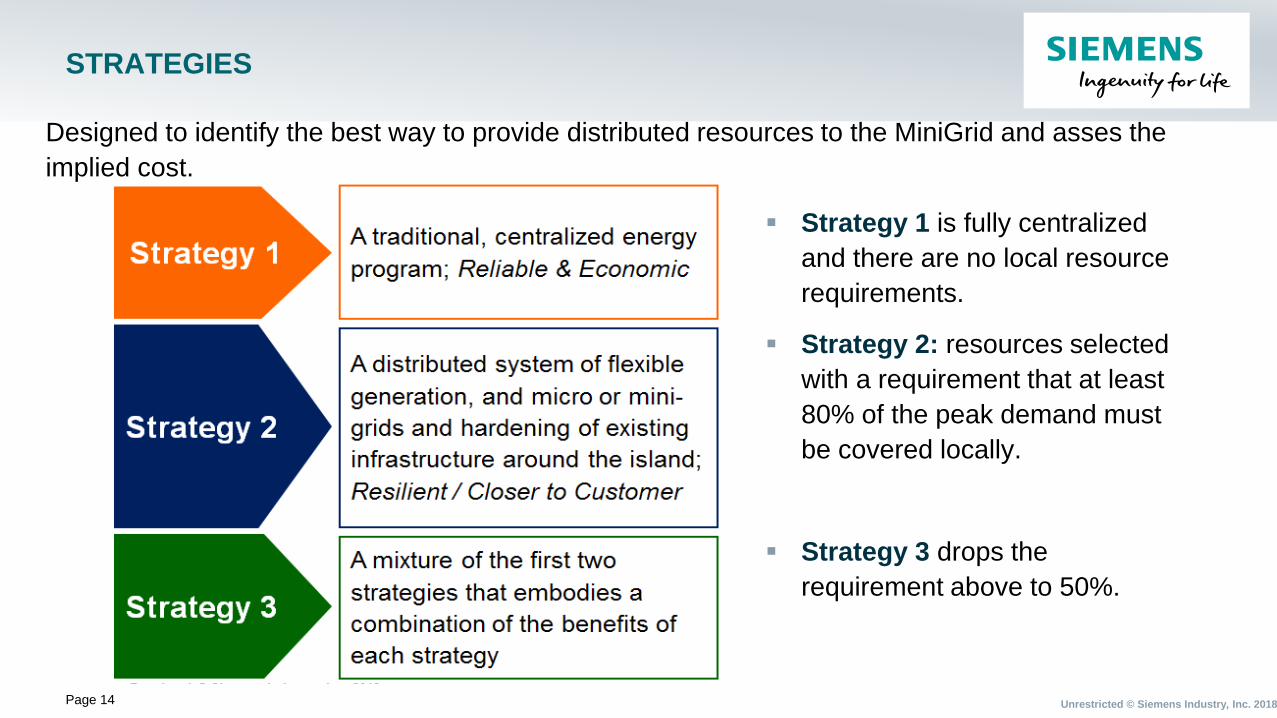
STRATEGIES
▪ Strategy 1 is fully centralized
and there are no local resource
requirements.
▪ Strategy 2: resources selected
with a requirement that at least
80% of the peak demand must
be covered locally.
▪ Strategy 3 drops the
requirement above to 50%.
Designed to identify the best way to provide distributed resources to the MiniGrid and asses the
implied cost.
Page 15 Unrestricted © Siemens Industry, Inc. 2018
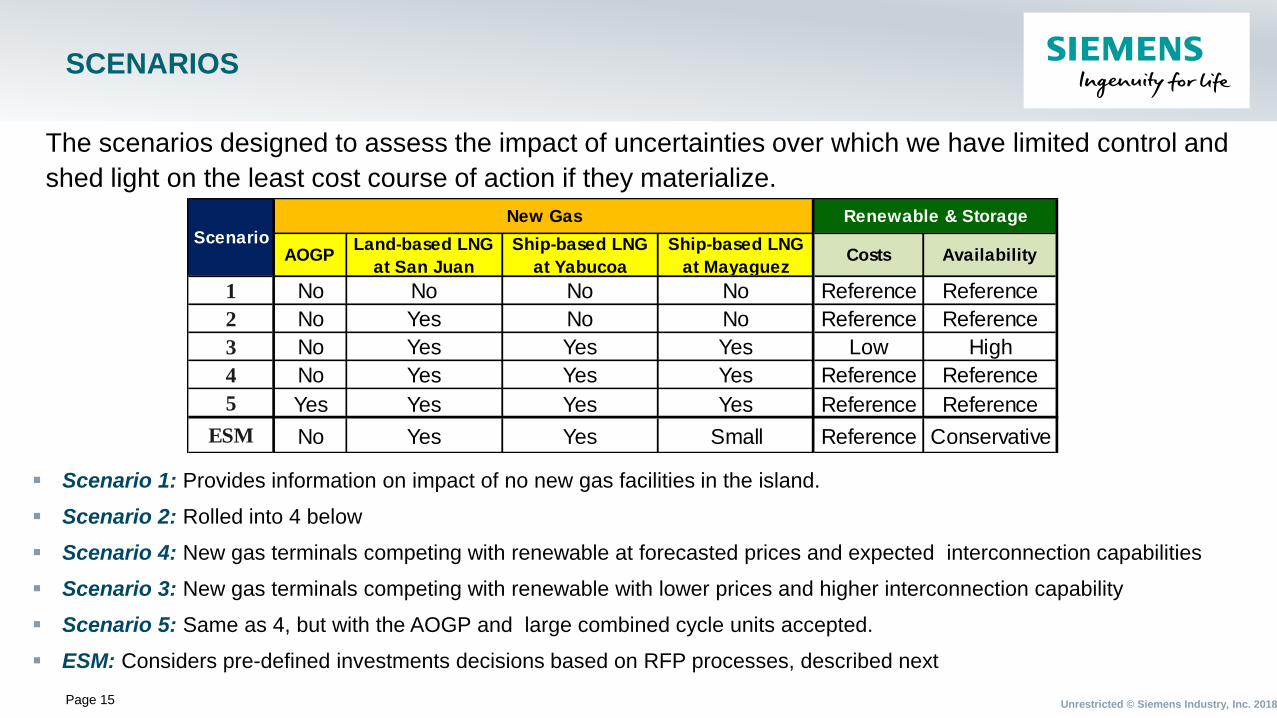
SCENARIOS
▪ Scenario 1: Provides information on impact of no new gas facilities in the island.
▪ Scenario 2: Rolled into 4 below
▪ Scenario 4: New gas terminals competing with renewable at forecasted prices and expected interconnection capabilities
▪ Scenario 3: New gas terminals competing with renewable with lower prices and higher interconnection capability
▪ Scenario 5: Same as 4, but with the AOGP and large combined cycle units accepted.
▪ ESM: Considers pre-defined investments decisions based on RFP processes, described next
The scenarios designed to assess the impact of uncertainties over which we have limited control and
shed light on the least cost course of action if they materialize.
AOGPLand-based LNG
at San Juan
Ship-based LNG
at Yabucoa
Ship-based LNG
at MayaguezCosts Availability
1 No No No No Reference Reference
2 No Yes No No Reference Reference
3 No Yes Yes Yes Low High
4 No Yes Yes Yes Reference Reference
5 Yes Yes Yes Yes Reference Reference
ESM No Yes Yes Small Reference Conservative
Scenario
New Gas Renewable & Storage
Page 16 Unrestricted © Siemens Industry, Inc. 2018
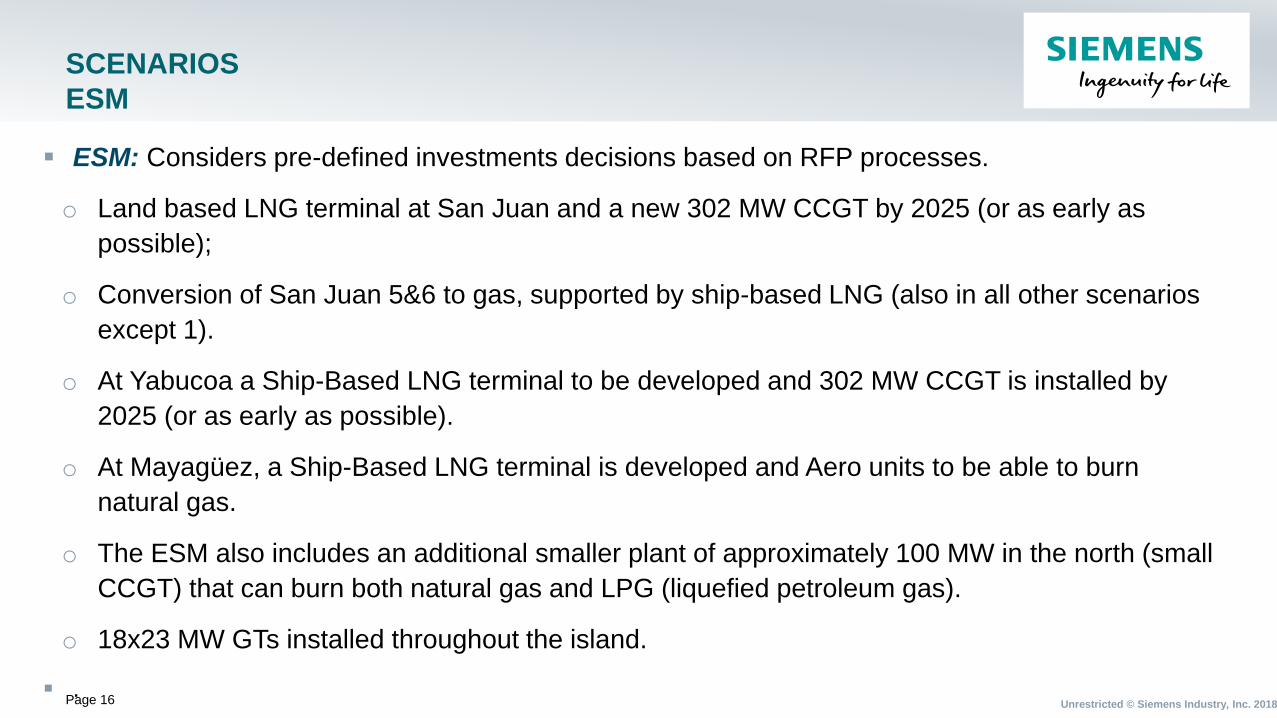
SCENARIOS
ESM
▪ ESM: Considers pre-defined investments decisions based on RFP processes.
o Land based LNG terminal at San Juan and a new 302 MW CCGT by 2025 (or as early as
possible);
o Conversion of San Juan 5&6 to gas, supported by ship-based LNG (also in all other scenarios
except 1).
o At Yabucoa a Ship-Based LNG terminal to be developed and 302 MW CCGT is installed by
2025 (or as early as possible).
o At Mayagüez, a Ship-Based LNG terminal is developed and Aero units to be able to burn
natural gas.
o The ESM also includes an additional smaller plant of approximately 100 MW in the north (small
CCGT) that can burn both natural gas and LPG (liquefied petroleum gas).
o 18x23 MW GTs installed throughout the island.
▪ .
Page 17 Unrestricted © Siemens Industry, Inc. 2018
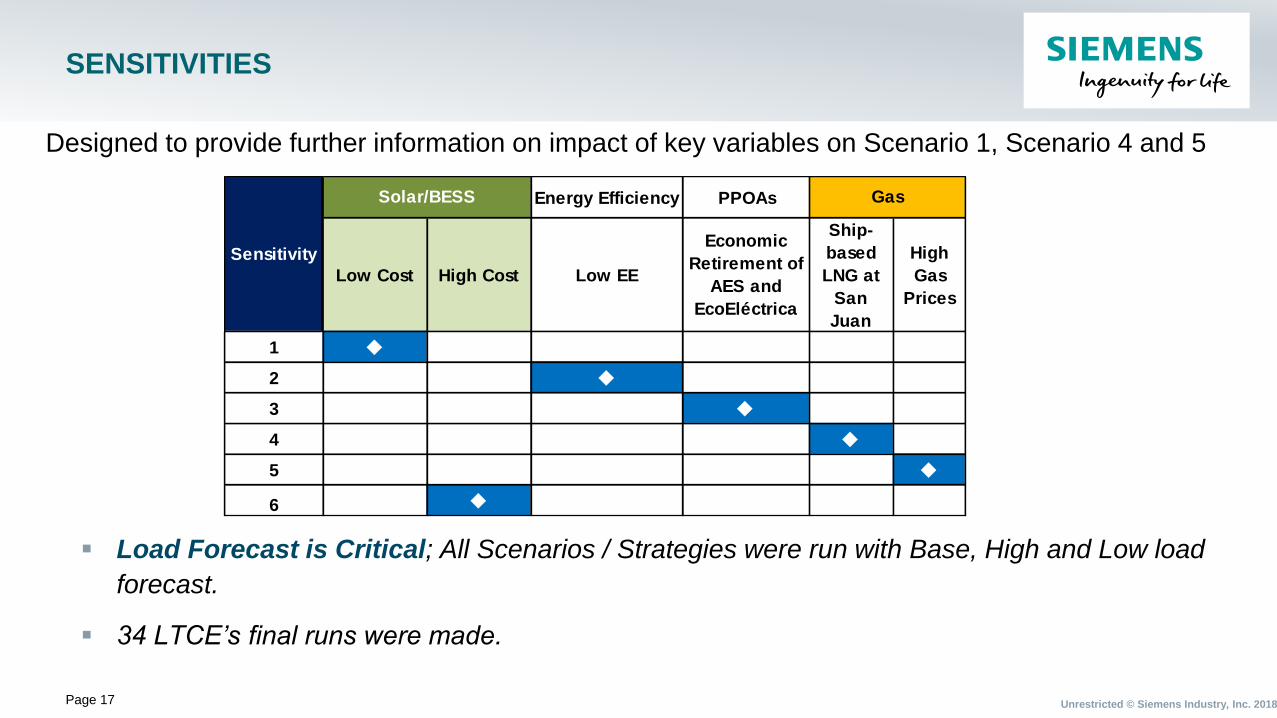
SENSITIVITIES
▪ Load Forecast is Critical; All Scenarios / Strategies were run with Base, High and Low load
forecast.
▪ 34 LTCE’s final runs were made.
Energy Efficiency PPOAs
Low Cost High Cost Low EE
Economic
Retirement of
AES and
EcoEléctrica
Ship-
based
LNG at
San
Juan
High
Gas
Prices
1 ◆
2 ◆
3 ◆
4 ◆
5 ◆
6 ◆
Sensitivity
GasSolar/BESS
Designed to provide further information on impact of key variables on Scenario 1, Scenario 4 and 5
Page 18 Unrestricted © Siemens Industry, Inc. 2018
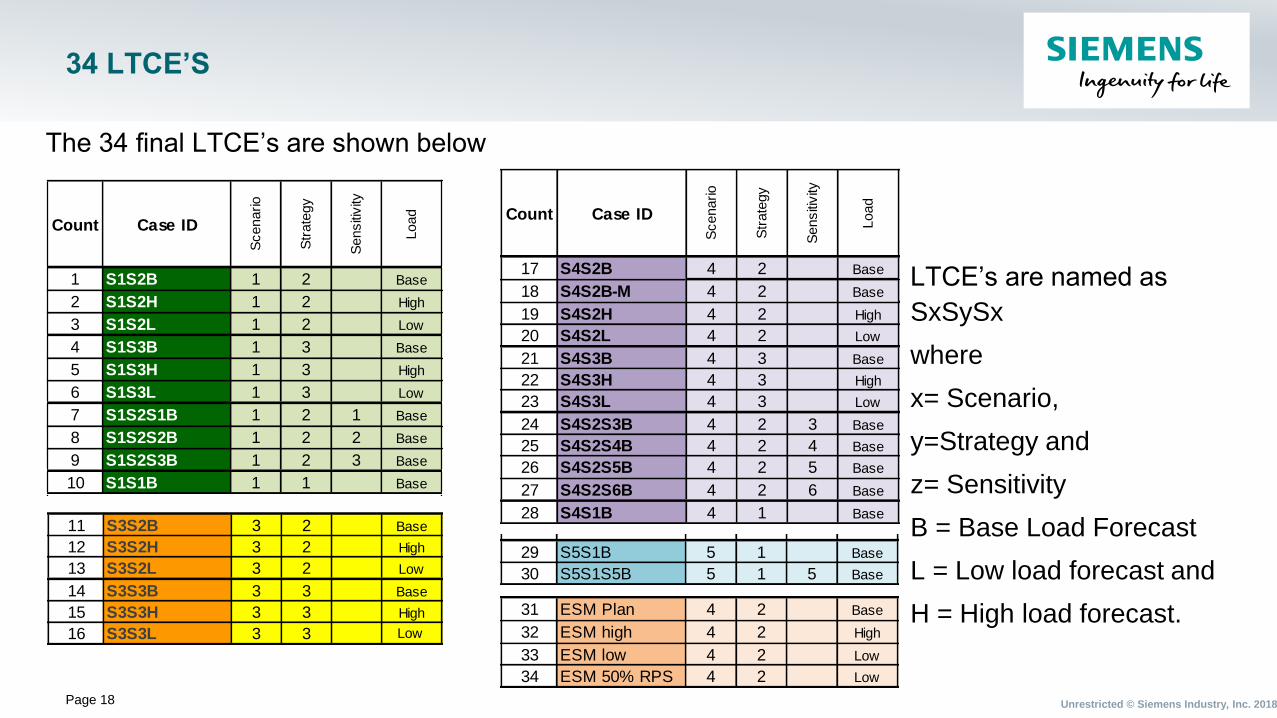
34 LTCE’S
The 34 final LTCE’s are shown below
Count Case ID
Scenario
Str
ate
gy
Sensiti
vity
Load
1 S1S2B 1 2 Base
2 S1S2H 1 2 High
3 S1S2L 1 2 Low
4 S1S3B 1 3 Base
5 S1S3H 1 3 High
6 S1S3L 1 3 Low
7 S1S2S1B 1 2 1 Base
8 S1S2S2B 1 2 2 Base
9 S1S2S3B 1 2 3 Base
10 S1S1B 1 1 BasePriority Count Case ID
Scenario
Str
ate
gy
Sensiti
vity
Load
1 11 S3S2B 3 2 Base
3 12 S3S2H 3 2 High
3 13 S3S2L 3 2 Low
3 14 S3S3B 3 3 Base
3 15 S3S3H 3 3 High
3 16 S3S3L 3 3 Low
Priority Count Case ID
Scenario
Str
ate
gy
Sensiti
vity
Load
1 17 S4S2B 4 2 Base
1 18 S4S2B-M 4 2 Base
1 19 S4S2H 4 2 High
1 20 S4S2L 4 2 Low
1 21 S4S3B 4 3 Base
1 22 S4S3H 4 3 High
1 23 S4S3L 4 3 Low
3 24 S4S2S3B 4 2 3 Base
2i 25 S4S2S4B 4 2 4 Base
3 26 S4S2S5B 4 2 5 Base
1 27 S4S2S6B 4 2 6 Base
1 28 S4S1B 4 1 BasePriority Count Case ID
Scenario
Str
ate
gy
Sensiti
vity
Load
2i 29 S5S1B 5 1 Base
3 30 S5S1S5B 5 1 5 Base
1 31 ESM Plan 4 2 Base
1 32 ESM high 4 2 High
1 33 ESM low 4 2 Low
1 34 ESM 50% RPS 4 2 Low
Priority Count Case ID
Scenario
Str
ate
gy
Sensiti
vity
Load
2i 29 S5S1B 5 1 Base
3 30 S5S1S5B 5 1 5 Base
1 31 ESM Plan 4 2 Base
1 32 ESM high 4 2 High
1 33 ESM low 4 2 Low
1 34 ESM 50% RPS 4 2 Low
LTCE’s are named as
SxSySx
where
x= Scenario,
y=Strategy and
z= Sensitivity
B = Base Load Forecast
L = Low load forecast and
H = High load forecast.
Scenario ESM
WWW.Siemens.comRestricted
Page 20 Unrestricted © Siemens Industry, Inc. 2018
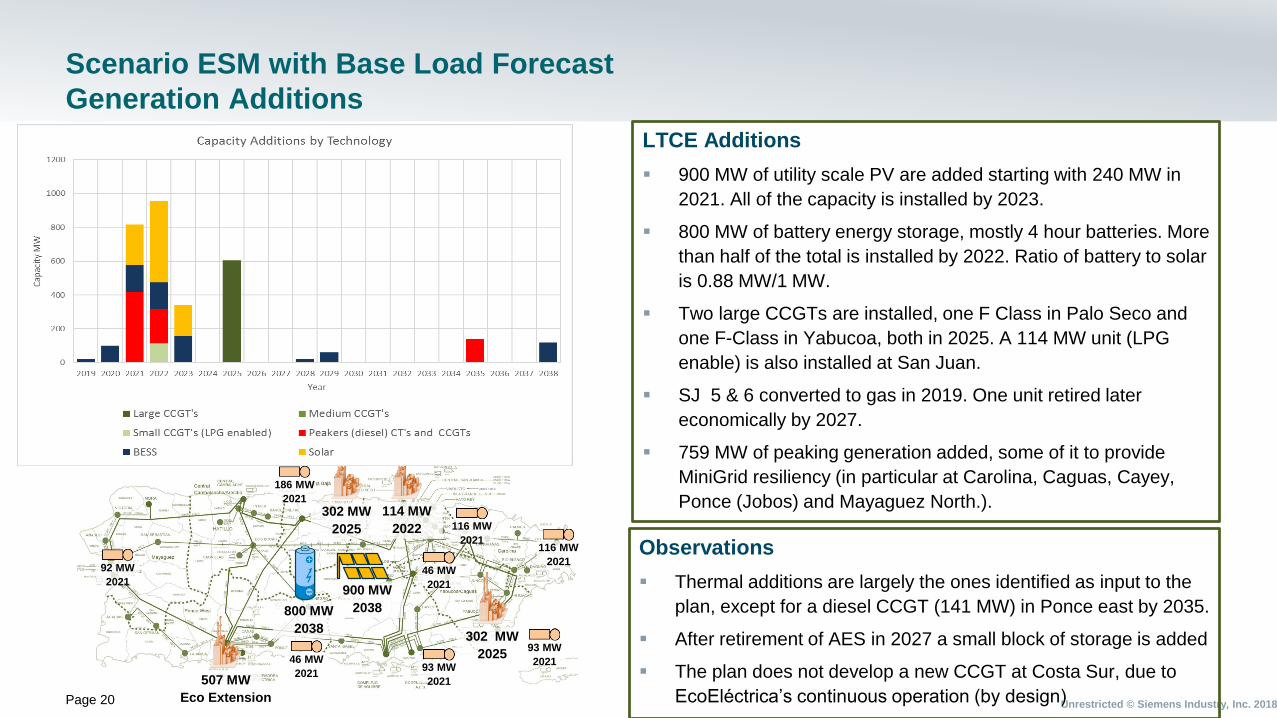
Scenario ESM with Base Load Forecast
Generation Additions
LTCE Additions
▪ 900 MW of utility scale PV are added starting with 240 MW in
2021. All of the capacity is installed by 2023.
▪ 800 MW of battery energy storage, mostly 4 hour batteries. More
than half of the total is installed by 2022. Ratio of battery to solar
is 0.88 MW/1 MW.
▪ Two large CCGTs are installed, one F Class in Palo Seco and
one F-Class in Yabucoa, both in 2025. A 114 MW unit (LPG
enable) is also installed at San Juan.
▪ SJ 5 & 6 converted to gas in 2019. One unit retired later
economically by 2027.
▪ 759 MW of peaking generation added, some of it to provide
MiniGrid resiliency (in particular at Carolina, Caguas, Cayey,
Ponce (Jobos) and Mayaguez North.).
507 MW
Eco Extension
900 MW
2038800 MW
2038
Observations
▪ Thermal additions are largely the ones identified as input to the
plan, except for a diesel CCGT (141 MW) in Ponce east by 2035.
▪ After retirement of AES in 2027 a small block of storage is added
▪ The plan does not develop a new CCGT at Costa Sur, due to
EcoEléctrica’s continuous operation (by design)
302 MW
2025
114 MW
2022
302 MW
2025
93 MW
2021
186 MW
2021
116 MW
2021
92 MW
2021
46 MW
202193 MW
2021
116 MW
202146 MW
2021
Page 21 Unrestricted © Siemens Industry, Inc. 2018
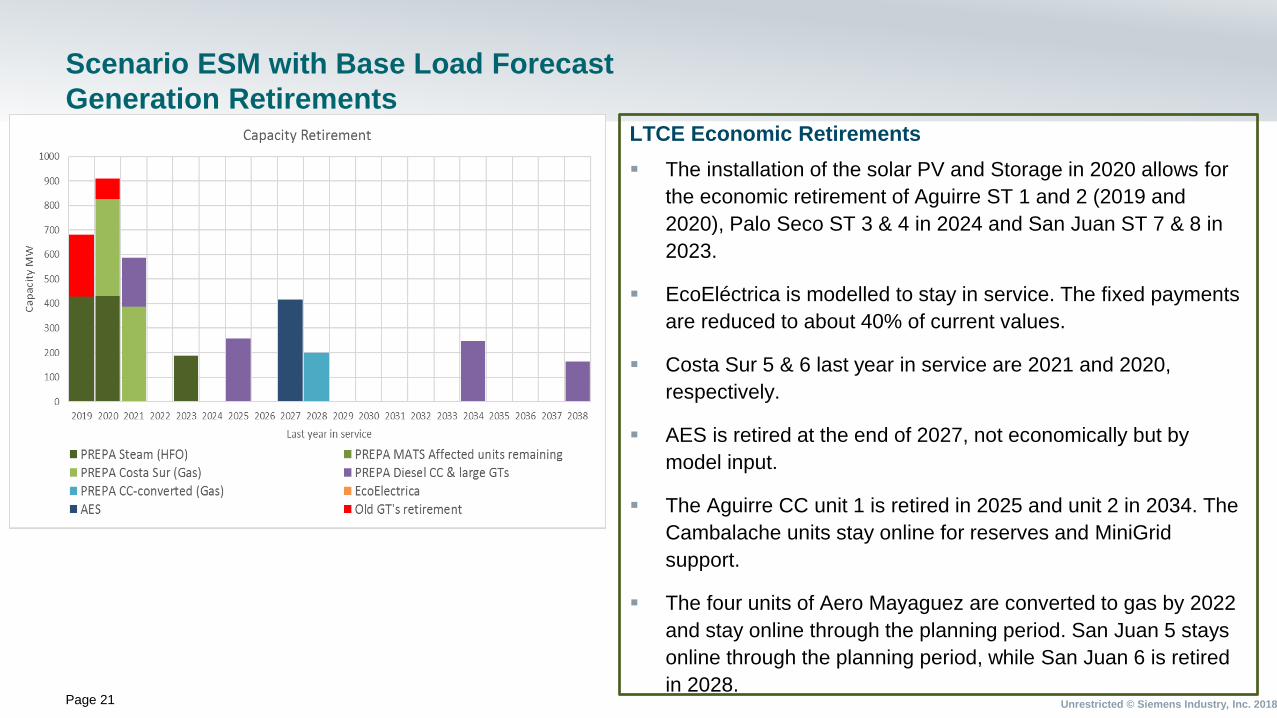
Scenario ESM with Base Load Forecast
Generation RetirementsLTCE Economic Retirements
▪ The installation of the solar PV and Storage in 2020 allows for
the economic retirement of Aguirre ST 1 and 2 (2019 and
2020), Palo Seco ST 3 & 4 in 2024 and San Juan ST 7 & 8 in
2023.
▪ EcoEléctrica is modelled to stay in service. The fixed payments
are reduced to about 40% of current values.
▪ Costa Sur 5 & 6 last year in service are 2021 and 2020,
respectively.
▪ AES is retired at the end of 2027, not economically but by
model input.
▪ The Aguirre CC unit 1 is retired in 2025 and unit 2 in 2034. The
Cambalache units stay online for reserves and MiniGrid
support.
▪ The four units of Aero Mayaguez are converted to gas by 2022
and stay online through the planning period. San Juan 5 stays
online through the planning period, while San Juan 6 is retired
in 2028.
Page 22 Unrestricted © Siemens Industry, Inc. 2018
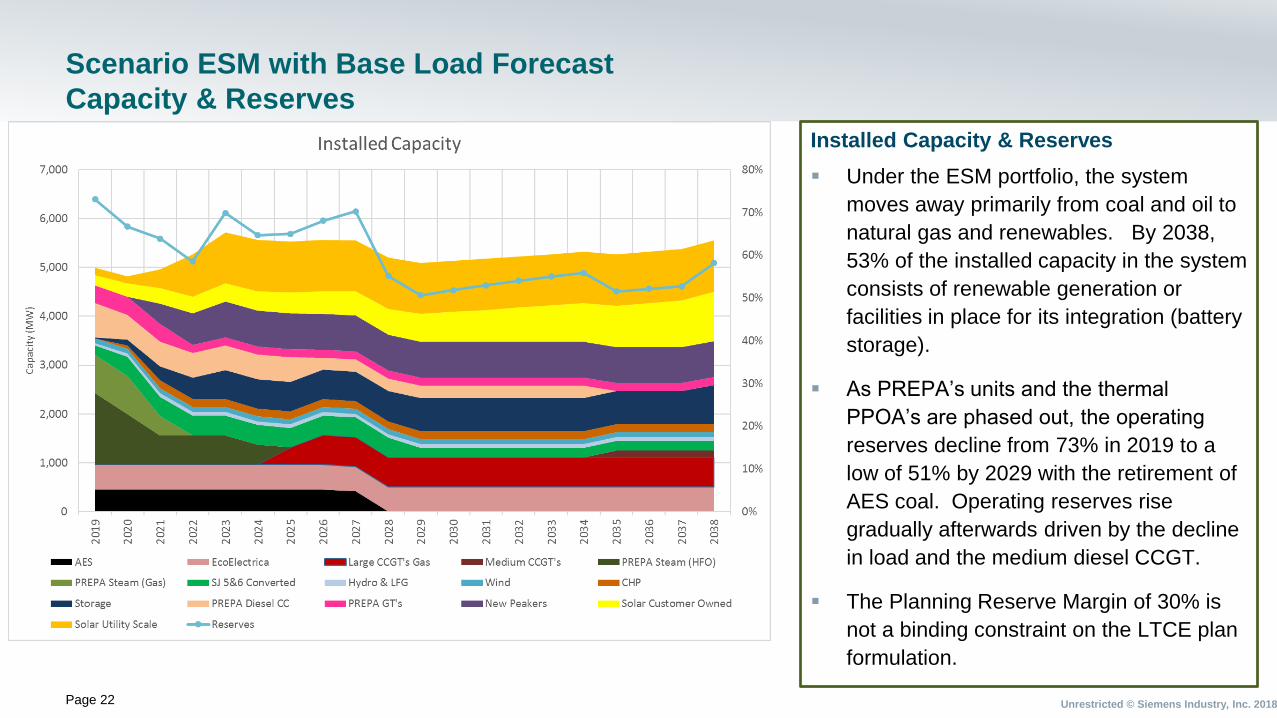
Scenario ESM with Base Load Forecast
Capacity & Reserves
Installed Capacity & Reserves
▪ Under the ESM portfolio, the system
moves away primarily from coal and oil to
natural gas and renewables. By 2038,
53% of the installed capacity in the system
consists of renewable generation or
facilities in place for its integration (battery
storage).
▪ As PREPA’s units and the thermal
PPOA’s are phased out, the operating
reserves decline from 73% in 2019 to a
low of 51% by 2029 with the retirement of
AES coal. Operating reserves rise
gradually afterwards driven by the decline
in load and the medium diesel CCGT.
▪ The Planning Reserve Margin of 30% is
not a binding constraint on the LTCE plan
formulation.
Page 23 Unrestricted © Siemens Industry, Inc. 2018
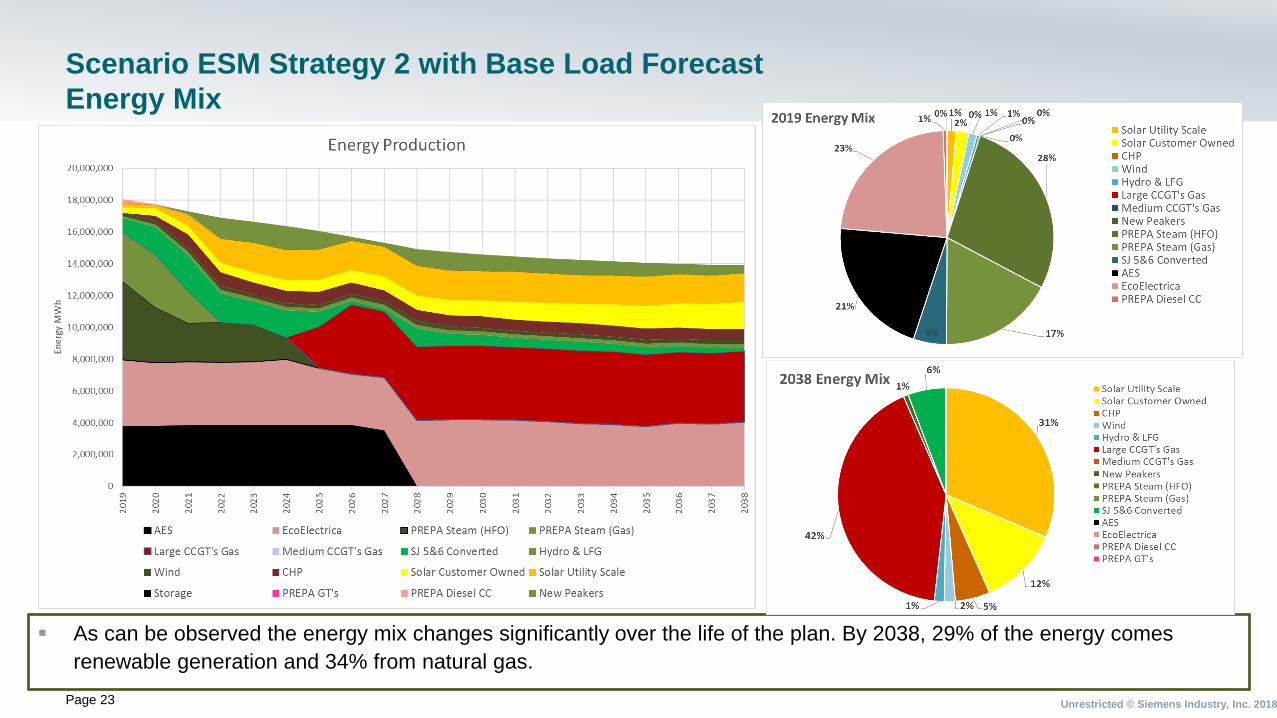
Scenario ESM Strategy 2 with Base Load Forecast
Energy Mix
▪ As can be observed the energy mix changes significantly over the life of the plan. By 2038, 29% of the energy comes
renewable generation and 34% from natural gas.
Page 24 Unrestricted © Siemens Industry, Inc. 2018
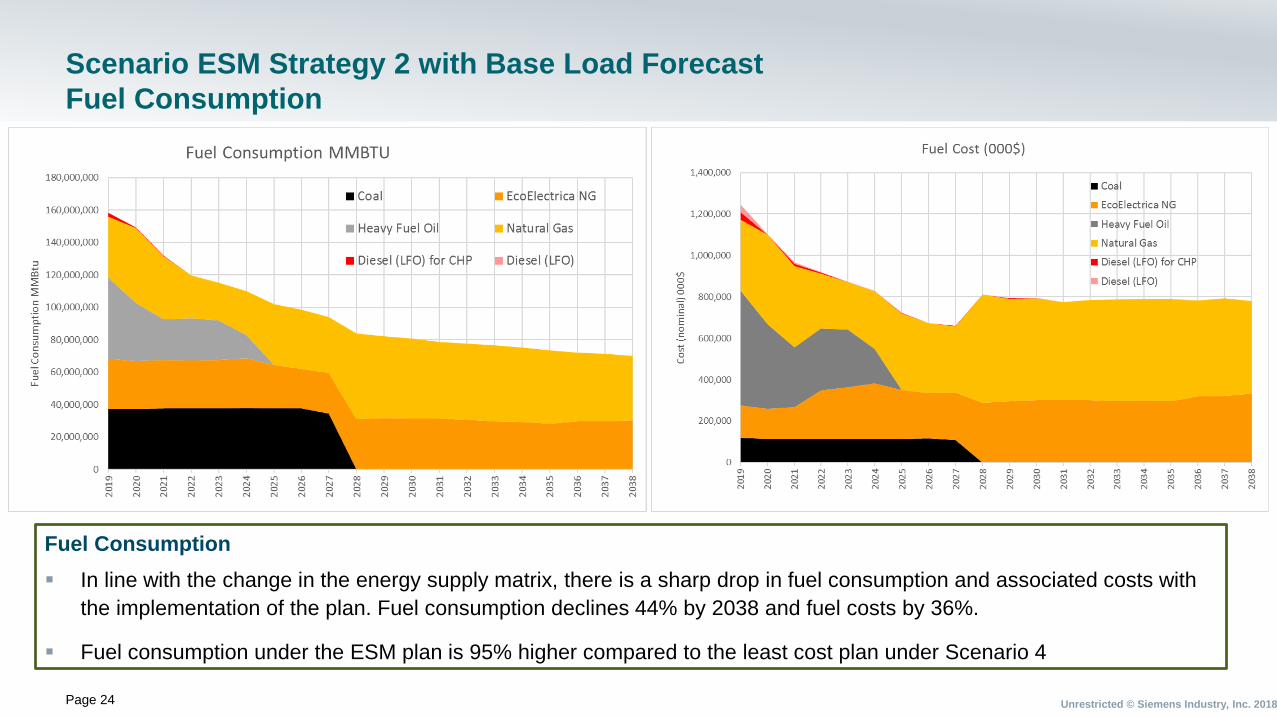
Scenario ESM Strategy 2 with Base Load Forecast
Fuel Consumption
Fuel Consumption
▪ In line with the change in the energy supply matrix, there is a sharp drop in fuel consumption and associated costs with
the implementation of the plan. Fuel consumption declines 44% by 2038 and fuel costs by 36%.
▪ Fuel consumption under the ESM plan is 95% higher compared to the least cost plan under Scenario 4

Page 25 Unrestricted © Siemens Industry, Inc. 2018
Scenario ESM Strategy 2 with Base Load Forecast
Total Cost of Supply
Total Cost of Supply
▪ The total cost of supply in real dollars including annualized capital costs, fuel costs and fixed and variable O&M is
expected to decline with the implementation of the plan in 2022 onwards from 100.4/MWh in 2021 (real $2017) to
$91.5/MWh by 2027, prior to AES Coal retirement in 2028. The costs increased in 2028 with AES retirement and remains
largely flat near $95/MWh in the long-term.
Page 26 Unrestricted © Siemens Industry, Inc. 2018
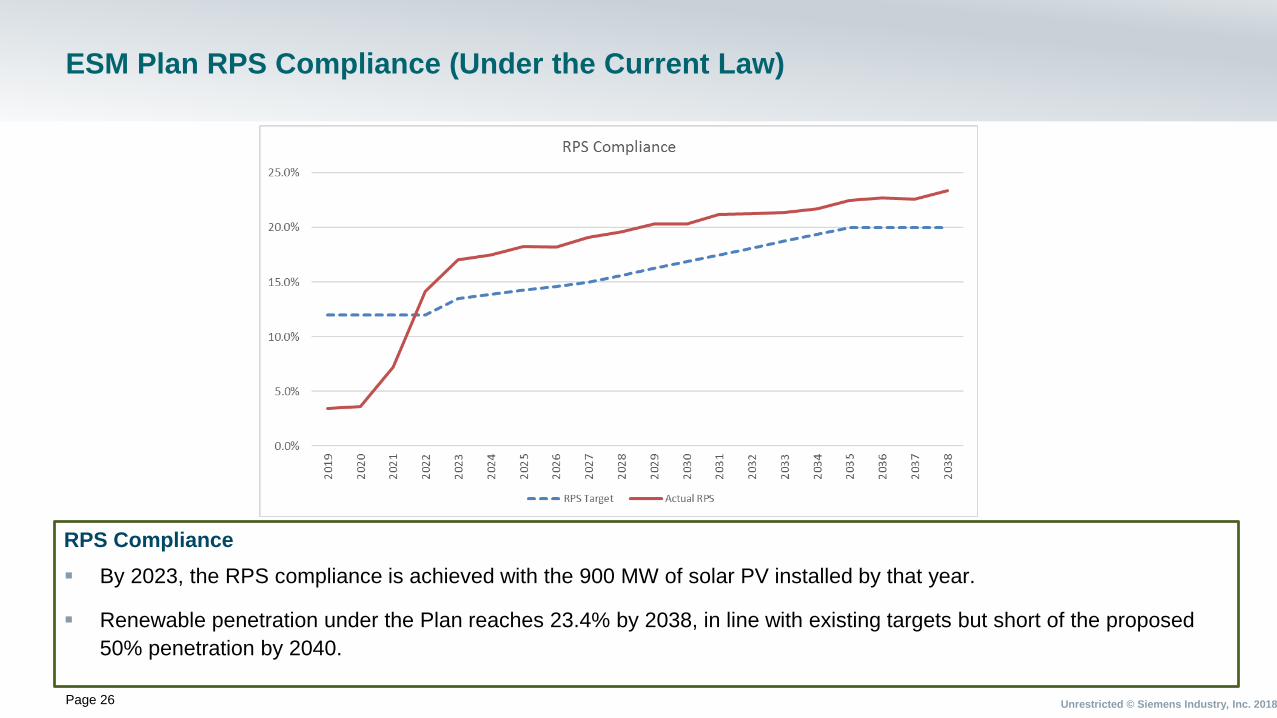
ESM Plan RPS Compliance (Under the Current Law)
RPS Compliance
▪ By 2023, the RPS compliance is achieved with the 900 MW of solar PV installed by that year.
▪ Renewable penetration under the Plan reaches 23.4% by 2038, in line with existing targets but short of the proposed
50% penetration by 2040.
Scenario 4 Strategy 2
Under Base Load
WWW.Siemens.comRestricted
Page 28 Unrestricted © Siemens Industry, Inc. 2018
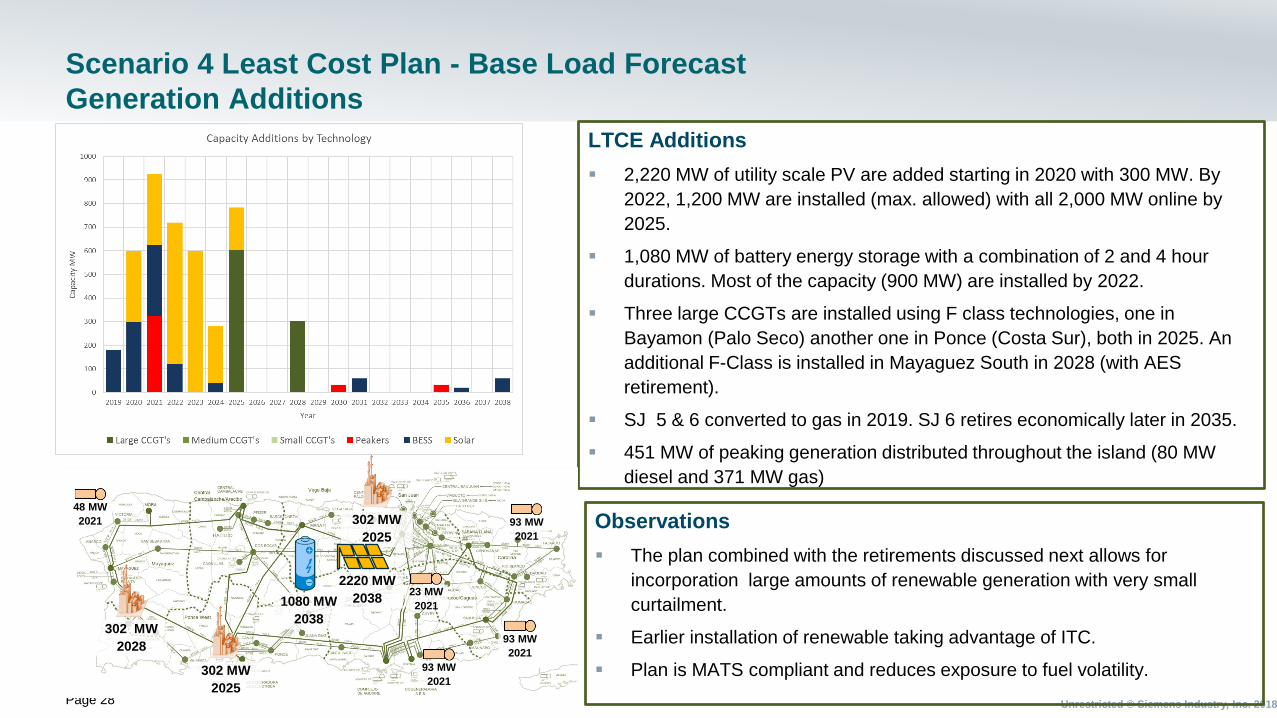
Scenario 4 Least Cost Plan - Base Load Forecast
Generation Additions
LTCE Additions
▪ 2,220 MW of utility scale PV are added starting in 2020 with 300 MW. By
2022, 1,200 MW are installed (max. allowed) with all 2,000 MW online by
2025.
▪ 1,080 MW of battery energy storage with a combination of 2 and 4 hour
durations. Most of the capacity (900 MW) are installed by 2022.
▪ Three large CCGTs are installed using F class technologies, one in
Bayamon (Palo Seco) another one in Ponce (Costa Sur), both in 2025. An
additional F-Class is installed in Mayaguez South in 2028 (with AES
retirement).
▪ SJ 5 & 6 converted to gas in 2019. SJ 6 retires economically later in 2035.
▪ 451 MW of peaking generation distributed throughout the island (80 MW
diesel and 371 MW gas)
302 MW
2025
302 MW
2025
2220 MW
20381080 MW
2038
Observations
▪ The plan combined with the retirements discussed next allows for
incorporation large amounts of renewable generation with very small
curtailment.
▪ Earlier installation of renewable taking advantage of ITC.
▪ Plan is MATS compliant and reduces exposure to fuel volatility.
302 MW
202893 MW
2021
93 MW
2021
48 MW
2021
93 MW
2021
23 MW
2021
Page 29 Unrestricted © Siemens Industry, Inc. 2018
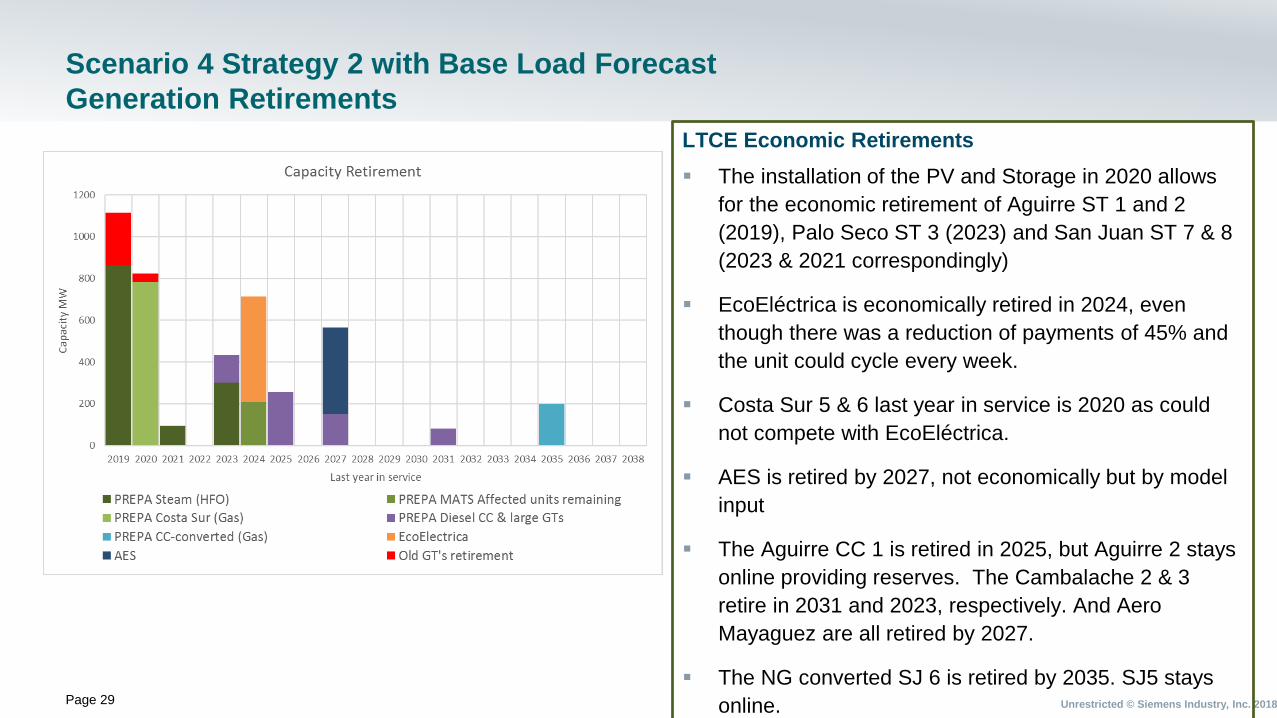
Scenario 4 Strategy 2 with Base Load Forecast
Generation Retirements
LTCE Economic Retirements
▪ The installation of the PV and Storage in 2020 allows
for the economic retirement of Aguirre ST 1 and 2
(2019), Palo Seco ST 3 (2023) and San Juan ST 7 & 8
(2023 & 2021 correspondingly)
▪ EcoEléctrica is economically retired in 2024, even
though there was a reduction of payments of 45% and
the unit could cycle every week.
▪ Costa Sur 5 & 6 last year in service is 2020 as could
not compete with EcoEléctrica.
▪ AES is retired by 2027, not economically but by model
input
▪ The Aguirre CC 1 is retired in 2025, but Aguirre 2 stays
online providing reserves. The Cambalache 2 & 3
retire in 2031 and 2023, respectively. And Aero
Mayaguez are all retired by 2027.
▪ The NG converted SJ 6 is retired by 2035. SJ5 stays
online.
Page 30 Unrestricted © Siemens Industry, Inc. 2018
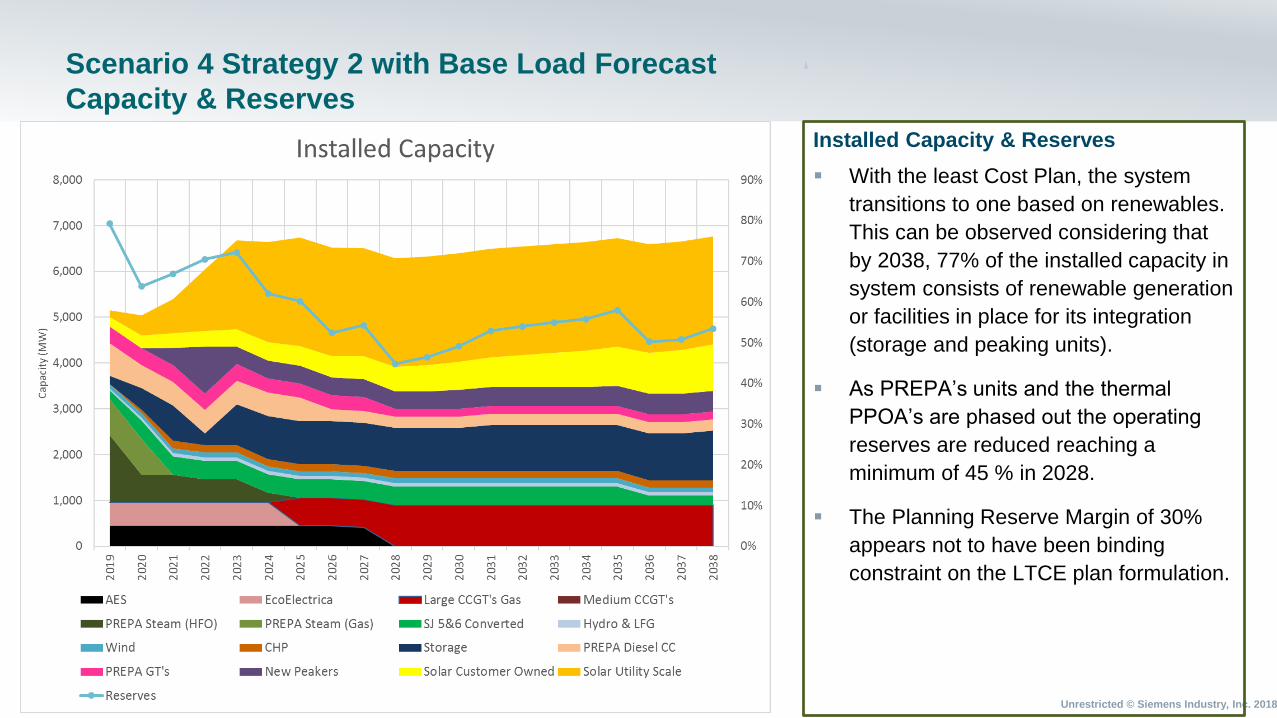
Scenario 4 Strategy 2 with Base Load Forecast
Capacity & Reserves
Installed Capacity & Reserves
▪ With the least Cost Plan, the system
transitions to one based on renewables.
This can be observed considering that
by 2038, 77% of the installed capacity in
system consists of renewable generation
or facilities in place for its integration
(storage and peaking units).
▪ As PREPA’s units and the thermal
PPOA’s are phased out the operating
reserves are reduced reaching a
minimum of 45 % in 2028.
▪ The Planning Reserve Margin of 30%
appears not to have been binding
constraint on the LTCE plan formulation.
Page 31 Unrestricted © Siemens Industry, Inc. 2018
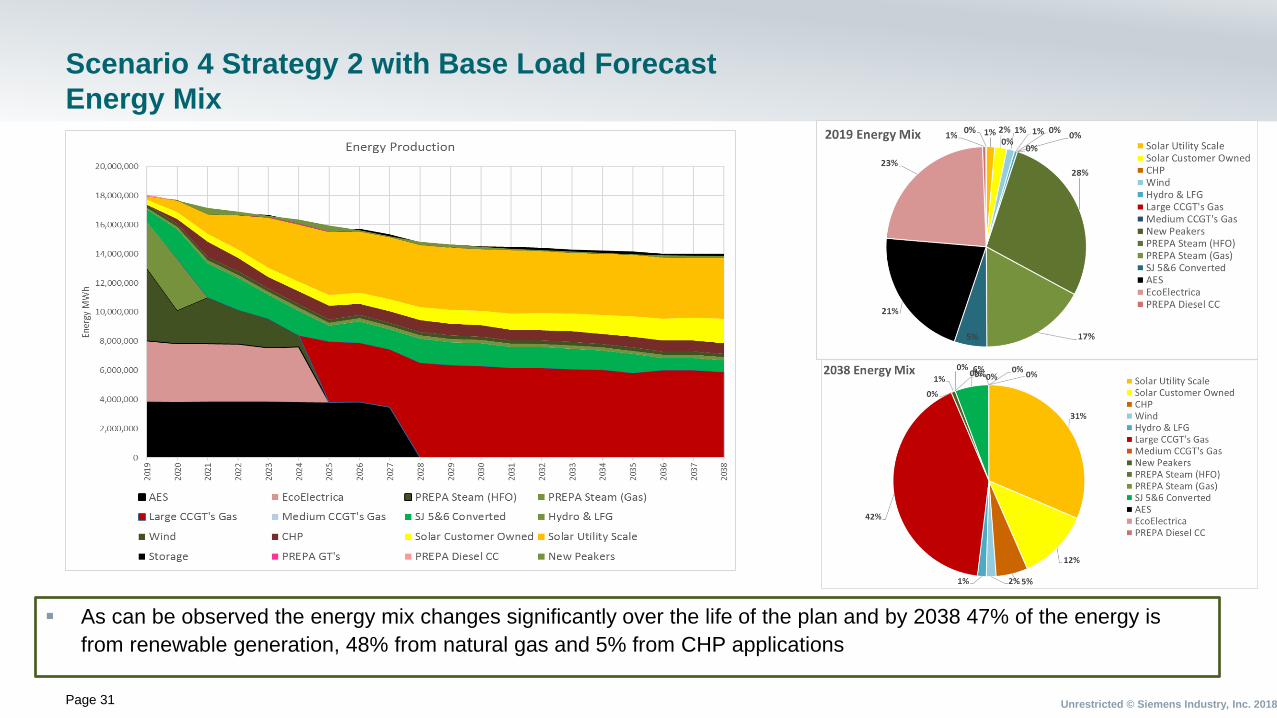
Scenario 4 Strategy 2 with Base Load Forecast
Energy Mix
▪ As can be observed the energy mix changes significantly over the life of the plan and by 2038 47% of the energy is
from renewable generation, 48% from natural gas and 5% from CHP applications
Page 32 Unrestricted © Siemens Industry, Inc. 2018
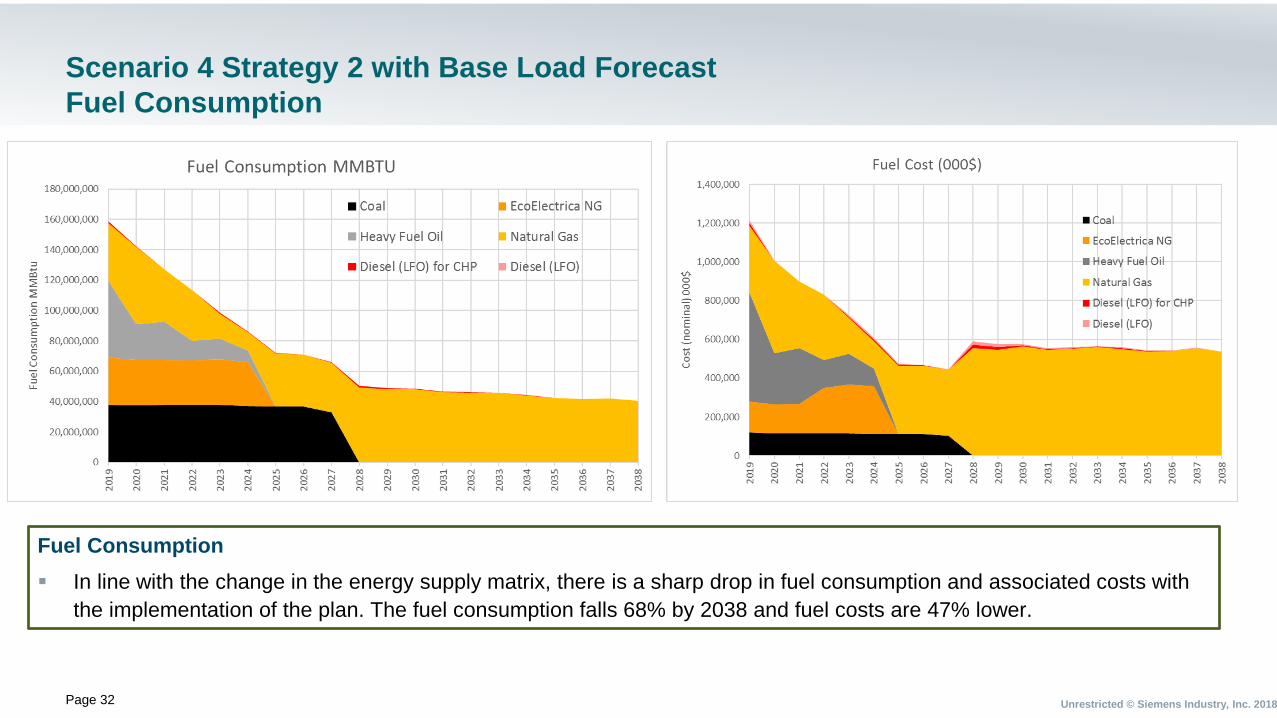
Scenario 4 Strategy 2 with Base Load Forecast
Fuel Consumption
Fuel Consumption
▪ In line with the change in the energy supply matrix, there is a sharp drop in fuel consumption and associated costs with
the implementation of the plan. The fuel consumption falls 68% by 2038 and fuel costs are 47% lower.
Page 33 Unrestricted © Siemens Industry, Inc. 2018
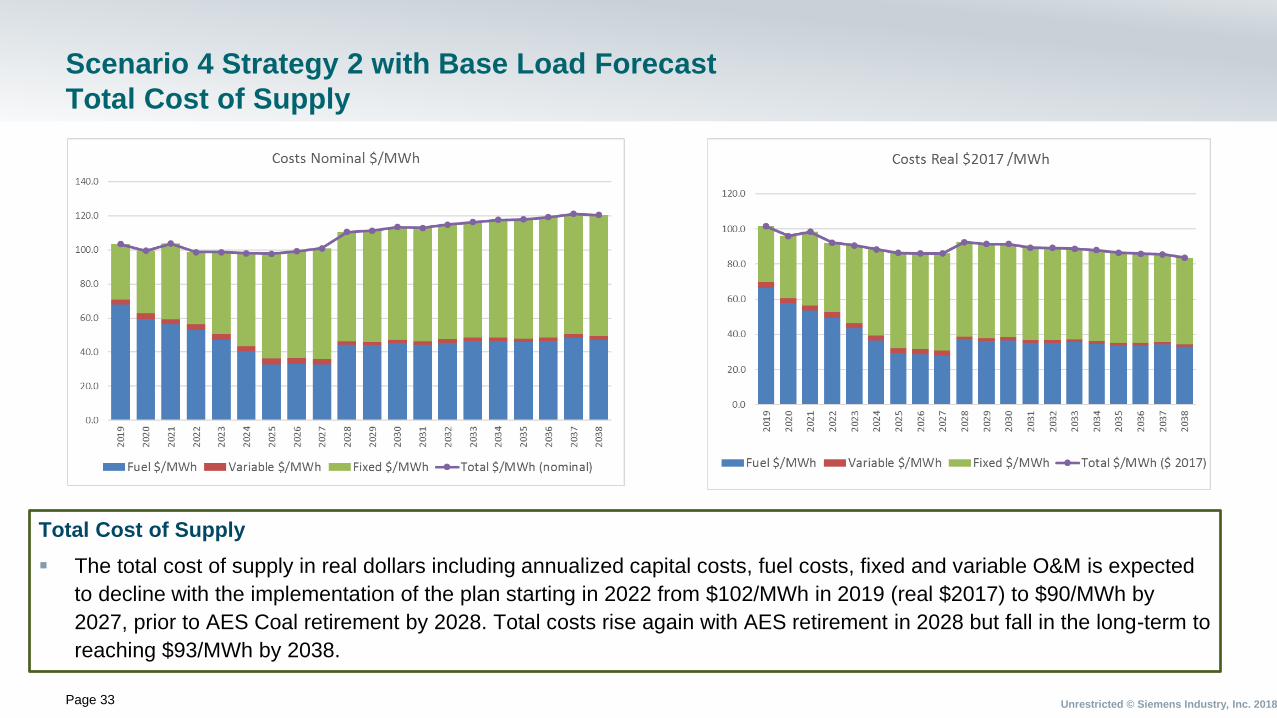
Scenario 4 Strategy 2 with Base Load Forecast
Total Cost of Supply
Total Cost of Supply
▪ The total cost of supply in real dollars including annualized capital costs, fuel costs, fixed and variable O&M is expected
to decline with the implementation of the plan starting in 2022 from $102/MWh in 2019 (real $2017) to $90/MWh by
2027, prior to AES Coal retirement by 2028. Total costs rise again with AES retirement in 2028 but fall in the long-term to
reaching $93/MWh by 2038.
Page 34 Unrestricted © Siemens Industry, Inc. 2018
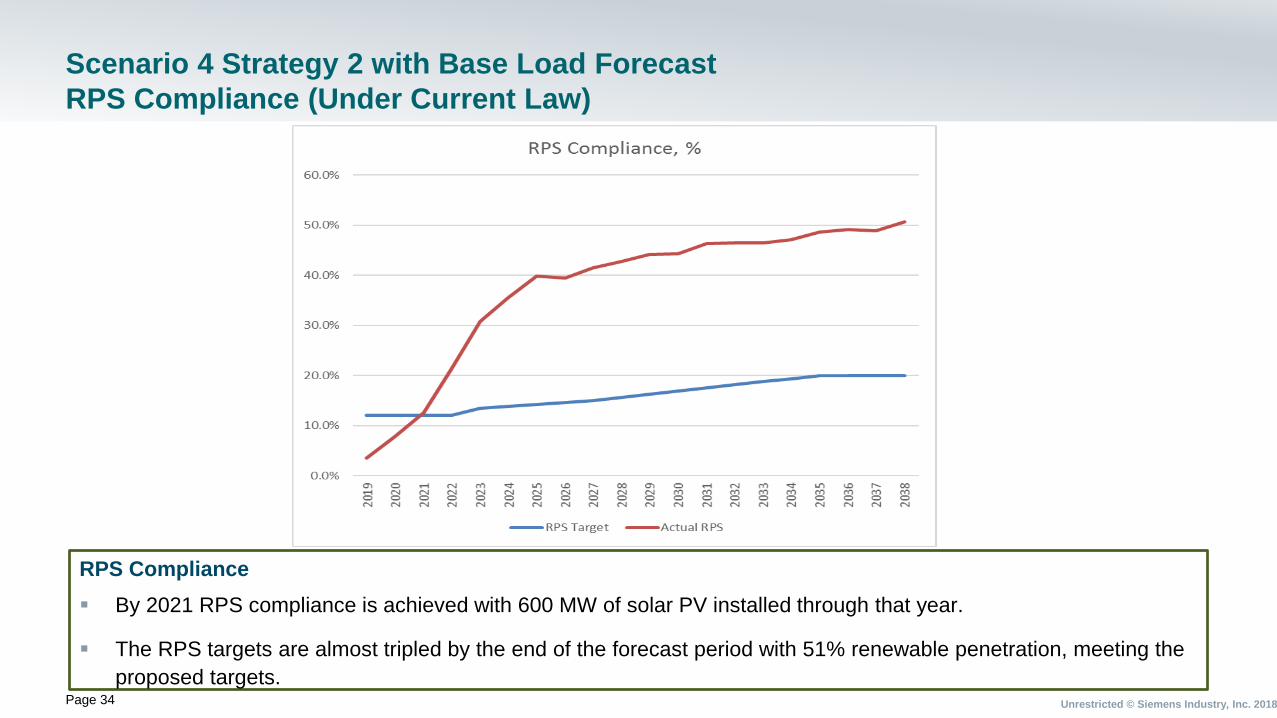
Scenario 4 Strategy 2 with Base Load Forecast
RPS Compliance (Under Current Law)
RPS Compliance
▪ By 2021 RPS compliance is achieved with 600 MW of solar PV installed through that year.
▪ The RPS targets are almost tripled by the end of the forecast period with 51% renewable penetration, meeting the
proposed targets.
34 LTCE’s
Recommendations
WWW.Siemens.comRestricted
Page 36 Unrestricted © Siemens Industry, Inc. 2018
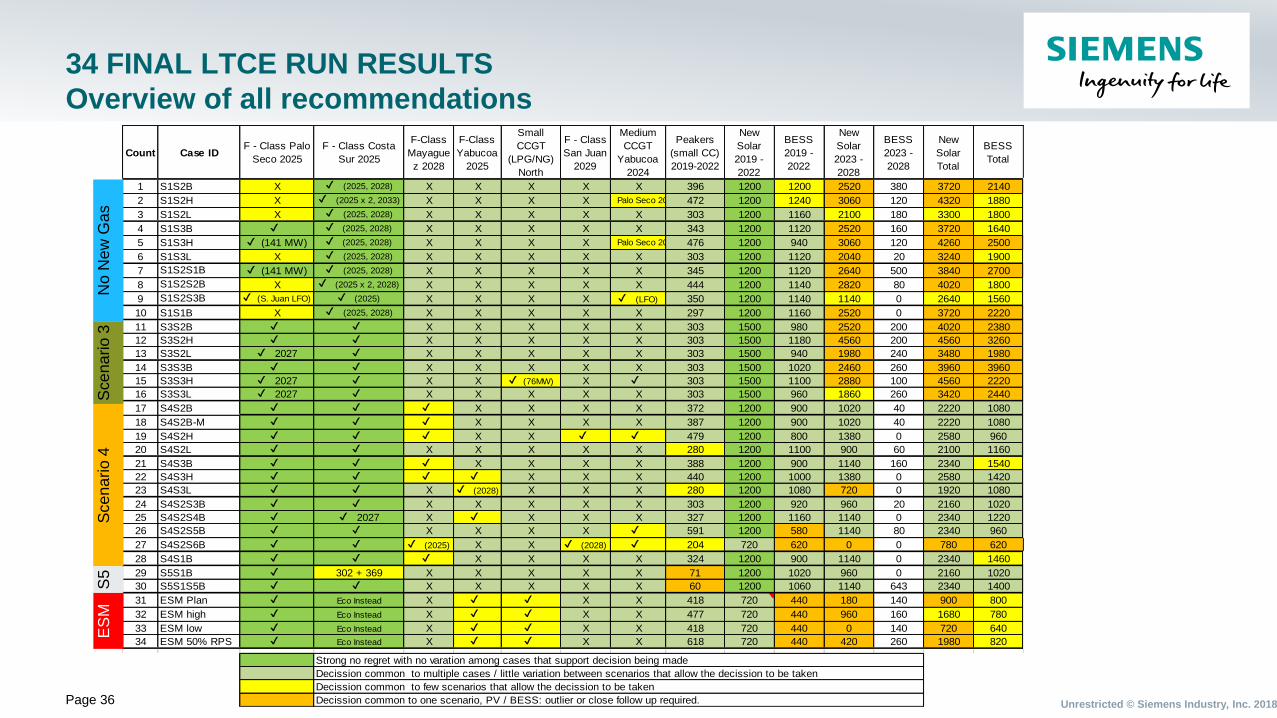
34 FINAL LTCE RUN RESULTS
Overview of all recommendations
Count Case IDF - Class Palo
Seco 2025
F - Class Costa
Sur 2025
F-Class
Mayague
z 2028
F-Class
Yabucoa
2025
Small
CCGT
(LPG/NG)
North
F - Class
San Juan
2029
Medium
CCGT
Yabucoa
2024
Peakers
(small CC)
2019-2022
New
Solar
2019 -
2022
BESS
2019 -
2022
New
Solar
2023 -
2028
BESS
2023 -
2028
New
Solar
Total
BESS
Total
1 S1S2B X ✔ (2025, 2028) X X X X X 396 1200 1200 2520 380 3720 2140
2 S1S2H X ✔ (2025 x 2, 2033) X X X X ✔ Palo Seco 2027 472 1200 1240 3060 120 4320 1880
3 S1S2L X ✔ (2025, 2028) X X X X X 303 1200 1160 2100 180 3300 1800
4 S1S3B ✔ ✔ (2025, 2028) X X X X X 343 1200 1120 2520 160 3720 1640
5 S1S3H ✔ (141 MW) ✔ (2025, 2028) X X X X ✔ Palo Seco 2027 476 1200 940 3060 120 4260 2500
6 S1S3L X ✔ (2025, 2028) X X X X X 303 1200 1120 2040 20 3240 1900
7 S1S2S1B ✔ (141 MW) ✔ (2025, 2028) X X X X X 345 1200 1120 2640 500 3840 2700
8 S1S2S2B X ✔ (2025 x 2, 2028) X X X X X 444 1200 1140 2820 80 4020 1800
9 S1S2S3B ✔ (S. Juan LFO) ✔ (2025) X X X X ✔ (LFO) 350 1200 1140 1140 0 2640 1560
10 S1S1B X ✔ (2025, 2028) X X X X X 297 1200 1160 2520 0 3720 2220
11 S3S2B ✔ ✔ X X X X X 303 1500 980 2520 200 4020 2380
12 S3S2H ✔ ✔ X X X X X 303 1500 1180 4560 200 4560 3260
13 S3S2L ✔ 2027 ✔ X X X X X 303 1500 940 1980 240 3480 1980
14 S3S3B ✔ ✔ X X X X X 303 1500 1020 2460 260 3960 3960
15 S3S3H ✔ 2027 ✔ X X ✔ (76MW) X ✔ 303 1500 1100 2880 100 4560 2220
16 S3S3L ✔ 2027 ✔ X X X X X 303 1500 960 1860 260 3420 2440
17 S4S2B ✔ ✔ ✔ X X X X 372 1200 900 1020 40 2220 1080
18 S4S2B-M ✔ ✔ ✔ X X X X 387 1200 900 1020 40 2220 1080
19 S4S2H ✔ ✔ ✔ X X ✔ ✔ 479 1200 800 1380 0 2580 960
20 S4S2L ✔ ✔ X X X X X 280 1200 1100 900 60 2100 1160
21 S4S3B ✔ ✔ ✔ X X X X 388 1200 900 1140 160 2340 1540
22 S4S3H ✔ ✔ ✔ ✔ X X X 440 1200 1000 1380 0 2580 1420
23 S4S3L ✔ ✔ X ✔ (2028) X X X 280 1200 1080 720 0 1920 1080
24 S4S2S3B ✔ ✔ X X X X X 303 1200 920 960 20 2160 1020
25 S4S2S4B ✔ ✔ 2027 X ✔ X X X 327 1200 1160 1140 0 2340 1220
26 S4S2S5B ✔ ✔ X X X X ✔ 591 1200 580 1140 80 2340 960
27 S4S2S6B ✔ ✔ ✔ (2025) X X ✔ (2028) ✔ 204 720 620 0 0 780 620
28 S4S1B ✔ ✔ ✔ X X X X 324 1200 900 1140 0 2340 1460
29 S5S1B ✔ 302 + 369 X X X X X 71 1200 1020 960 0 2160 1020
30 S5S1S5B ✔ ✔ X X X X X 60 1200 1060 1140 643 2340 1400
31 ESM Plan ✔ Eco Instead X ✔ ✔ X X 418 720 440 180 140 900 800
32 ESM high ✔ Eco Instead X ✔ ✔ X X 477 720 440 960 160 1680 780
33 ESM low ✔ Eco Instead X ✔ ✔ X X 418 720 440 0 140 720 640
34 ESM 50% RPS ✔ Eco Instead X ✔ ✔ X X 618 720 440 420 260 1980 820
Strong no regret with no varation among cases that support decision being made
Decission common to multiple cases / little variation between scenarios that allow the decission to be taken
Decission common to few scenarios that allow the decission to be taken
Decission common to one scenario, PV / BESS: outlier or close follow up required.
No N
ew
Ga
sS
ce
na
rio
3S
ce
na
rio
4E
SM
S5
Page 37 Unrestricted © Siemens Industry, Inc. 2018
COMMON ELEMENTS OF 34 LTCE RUNS –
No Regret / Minimum Regret Decisions
The LTCE’s had a number of no-regret / minimum regret decisions as identified by commonalities
of outcomes and these are:
1. Maximize the rate of installation of solar photovoltaic (PV) generation for the first four
years (2019 to 2022) of the plan.
▪ Early installation benefit from the Investment Tax Credit
▪ Declining demand favors early installations to maximize the life benefit
▪ The LTCE always hit the allowable practical limits of interconnection
2. Install between 440 MW to 900 MW of Battery Energy Storage in the first four years of
the plan.
▪ Early installation support the integration of PV and provides reserves
▪ Declining demand favors early installation to supply greater initial load
▪ Differences as basically driven by the assumed practical limits of interconnection
Page 38 Unrestricted © Siemens Industry, Inc. 2018
COMMON ELEMENTS OF 34 LTCE RUNS –
No Regret / Minimum Regret Decisions
3. Convert San Juan 5&6 Combined Cycle (CC) to burn natural gas
▪ Whenever offered it was chosen by the LTCE
▪ Since it became a committed project it was built in the IRP for all scenarios but Scenario1
4. Develop a land-based LNG terminal in San Juan to supply a new 302 MW CCGT at Palo
Seco and the existing San Juan 5&6 CCGT
▪ Whenever offered it was chosen by the LTCE
▪ The land-based LNG allow developing flexible and economic resources close to the loads
5. A new 300 MW CCGT at Costa Sur or extend a renegotiated contract with EcoEléctrica
▪ A new 303 MW CCGT always displaces EcoEléctrica if the current contract fixed
payments are maintained.
▪ It is possible to adjust the fixed payments for EcoEléctrica so that there is a breakeven
costs compared to a new CCGT.
Page 39 Unrestricted © Siemens Industry, Inc. 2018
COMMON ELEMENTS OF 34 LTCE RUNS –
No Regret / Minimum Regret Decisions
6. Add smaller Gas Turbines (GTs) capable of burning containerized natural gas (18 GTs
x 23 MW).
▪ Provide the required minimal thermal supply to the MiniGrids in the short term.
▪ Together with storage to manage the integration of solar PV
7. Ship-Based LNG terminal at Mayagüez to supply the 4x50 MW Aeros and possibly a
new 300 MW CCGT.
▪ Together with the CCGT at Yabucoa provides a least cost solution
▪ If the Yabucoa CCGT cannot be developed, it’s the next best alternative to that CCGT.
▪ Under a high load growth case, developing a CCGT here together with Yabucoa is a least
cost option
▪ Plans should be made for this terminal as a minimum regret strategy
Page 40 Unrestricted © Siemens Industry, Inc. 2018
COMMON ELEMENTS OF 34 LTCE RUNS –
No Regret / Minimum Regret Decisions
8. Develop a Ship-Based LNG terminal at Yabucoa with a new 300 MW CCGT
▪ Together with the conversion of the GTs at Mayaguez is a least cost solution
▪ It is also a least cost solution under; a) high load growth, together with a CCGT at
Mayaguez or b) the land based LNG terminal at San Juan cannot be developed
▪ Plans should be made for this terminal as a minimum regret strategy
9. Monitor Renewable (PV) and storage prices as well as integration technologies
▪ With low renewable prices and high adoption, lower costs of supply can be achieved.
▪ Volumes are very high and may stretch the ability to operate the system, but
technology is improving fast, this may become partical in the future.
▪ This is one case that we need to keep flexibility and be able to change our course.
34 LTCE’s Metrics and
Results
WWW.Siemens.comRestricted
Page 42 Unrestricted © Siemens Industry, Inc. 2018
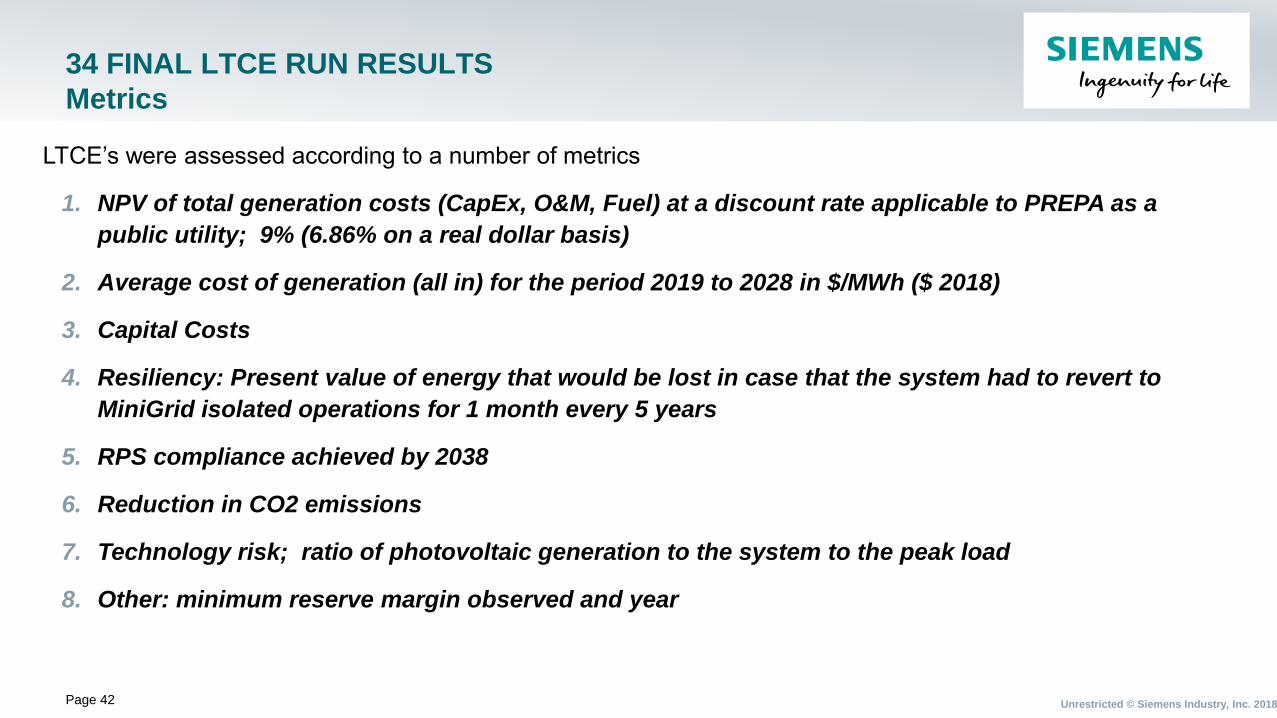
34 FINAL LTCE RUN RESULTS
Metrics
LTCE’s were assessed according to a number of metrics
1. NPV of total generation costs (CapEx, O&M, Fuel) at a discount rate applicable to PREPA as a
public utility; 9% (6.86% on a real dollar basis)
2. Average cost of generation (all in) for the period 2019 to 2028 in $/MWh ($ 2018)
3. Capital Costs
4. Resiliency: Present value of energy that would be lost in case that the system had to revert to
MiniGrid isolated operations for 1 month every 5 years
5. RPS compliance achieved by 2038
6. Reduction in CO2 emissions
7. Technology risk; ratio of photovoltaic generation to the system to the peak load
8. Other: minimum reserve margin observed and year
Page 43 Unrestricted © Siemens Industry, Inc. 2018
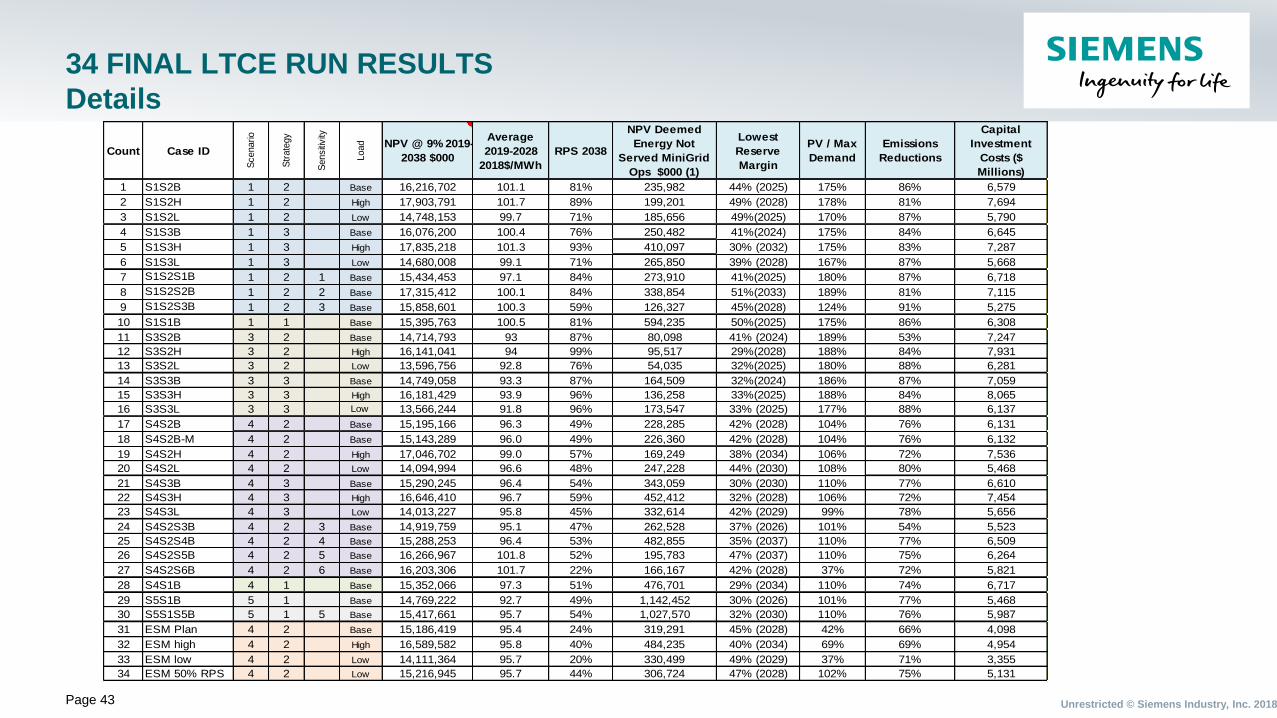
34 FINAL LTCE RUN RESULTS
Details
Count Case ID
Scenario
Str
ate
gy
Sensiti
vity
Load
NPV @ 9% 2019-
2038 $000
Average
2019-2028
2018$/MWh
RPS 2038
NPV Deemed
Energy Not
Served MiniGrid
Ops $000 (1)
Lowest
Reserve
Margin
PV / Max
Demand
Emissions
Reductions
Capital
Investment
Costs ($
Millions)
1 S1S2B 1 2 Base 16,216,702 101.1 81% 235,982 44% (2025) 175% 86% 6,579
2 S1S2H 1 2 High 17,903,791 101.7 89% 199,201 49% (2028) 178% 81% 7,694
3 S1S2L 1 2 Low 14,748,153 99.7 71% 185,656 49%(2025) 170% 87% 5,790
4 S1S3B 1 3 Base 16,076,200 100.4 76% 250,482 41%(2024) 175% 84% 6,645
5 S1S3H 1 3 High 17,835,218 101.3 93% 410,097 30% (2032) 175% 83% 7,287
6 S1S3L 1 3 Low 14,680,008 99.1 71% 265,850 39% (2028) 167% 87% 5,668
7 S1S2S1B 1 2 1 Base 15,434,453 97.1 84% 273,910 41%(2025) 180% 87% 6,718
8 S1S2S2B 1 2 2 Base 17,315,412 100.1 84% 338,854 51%(2033) 189% 81% 7,115
9 S1S2S3B 1 2 3 Base 15,858,601 100.3 59% 126,327 45%(2028) 124% 91% 5,275
10 S1S1B 1 1 Base 15,395,763 100.5 81% 594,235 50%(2025) 175% 86% 6,308
11 S3S2B 3 2 Base 14,714,793 93 87% 80,098 41% (2024) 189% 53% 7,247
12 S3S2H 3 2 High 16,141,041 94 99% 95,517 29%(2028) 188% 84% 7,931
13 S3S2L 3 2 Low 13,596,756 92.8 76% 54,035 32%(2025) 180% 88% 6,281
14 S3S3B 3 3 Base 14,749,058 93.3 87% 164,509 32%(2024) 186% 87% 7,059
15 S3S3H 3 3 High 16,181,429 93.9 96% 136,258 33%(2025) 188% 84% 8,065
16 S3S3L 3 3 Low 13,566,244 91.8 96% 173,547 33% (2025) 177% 88% 6,137
17 S4S2B 4 2 Base 15,195,166 96.3 49% 228,285 42% (2028) 104% 76% 6,131
18 S4S2B-M 4 2 Base 15,143,289 96.0 49% 226,360 42% (2028) 104% 76% 6,132
19 S4S2H 4 2 High 17,046,702 99.0 57% 169,249 38% (2034) 106% 72% 7,536
20 S4S2L 4 2 Low 14,094,994 96.6 48% 247,228 44% (2030) 108% 80% 5,468
21 S4S3B 4 3 Base 15,290,245 96.4 54% 343,059 30% (2030) 110% 77% 6,610
22 S4S3H 4 3 High 16,646,410 96.7 59% 452,412 32% (2028) 106% 72% 7,454
23 S4S3L 4 3 Low 14,013,227 95.8 45% 332,614 42% (2029) 99% 78% 5,656
24 S4S2S3B 4 2 3 Base 14,919,759 95.1 47% 262,528 37% (2026) 101% 54% 5,523
25 S4S2S4B 4 2 4 Base 15,288,253 96.4 53% 482,855 35% (2037) 110% 77% 6,509
26 S4S2S5B 4 2 5 Base 16,266,967 101.8 52% 195,783 47% (2037) 110% 75% 6,264
27 S4S2S6B 4 2 6 Base 16,203,306 101.7 22% 166,167 42% (2028) 37% 72% 5,821
28 S4S1B 4 1 Base 15,352,066 97.3 51% 476,701 29% (2034) 110% 74% 6,717
29 S5S1B 5 1 Base 14,769,222 92.7 49% 1,142,452 30% (2026) 101% 77% 5,468
30 S5S1S5B 5 1 5 Base 15,417,661 95.7 54% 1,027,570 32% (2030) 110% 76% 5,987
31 ESM Plan 4 2 Base 15,186,419 95.4 24% 319,291 45% (2028) 42% 66% 4,098
32 ESM high 4 2 High 16,589,582 95.8 40% 484,235 40% (2034) 69% 69% 4,954
33 ESM low 4 2 Low 14,111,364 95.7 20% 330,499 49% (2029) 37% 71% 3,355
34 ESM 50% RPS 4 2 Low 15,216,945 95.7 44% 306,724 47% (2028) 102% 75% 5,131
Page 44 Unrestricted © Siemens Industry, Inc. 2018
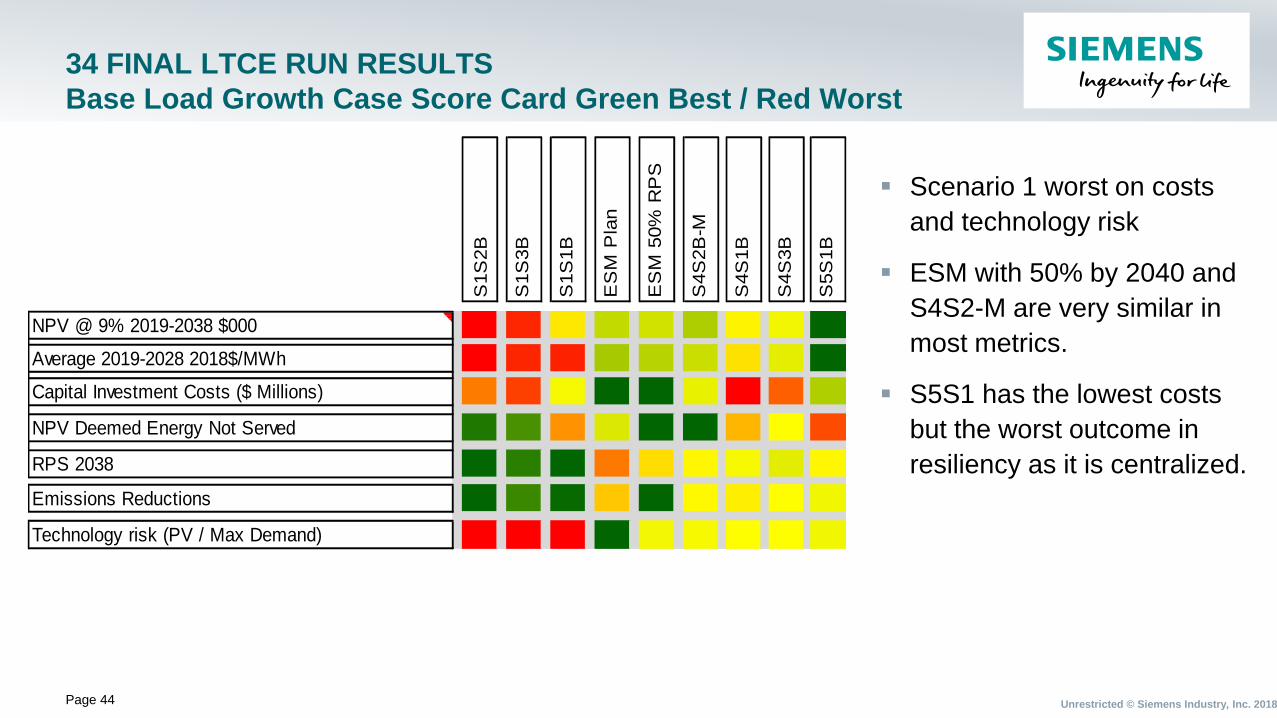
34 FINAL LTCE RUN RESULTS
Base Load Growth Case Score Card Green Best / Red Worst
S1S
2B
S1S
3B
S1S
1B
ES
M P
lan
ES
M 5
0%
RP
S
S4S
2B
-M
S4S
1B
S4S
3B
S5S
1B
NPV @ 9% 2019-2038 $000
Average 2019-2028 2018$/MWh
Capital Investment Costs ($ Millions)
NPV Deemed Energy Not Served
RPS 2038
Emissions Reductions
Technology risk (PV / Max Demand)
▪ Scenario 1 worst on costs
and technology risk
▪ ESM with 50% by 2040 and
S4S2-M are very similar in
most metrics.
▪ S5S1 has the lowest costs
but the worst outcome in
resiliency as it is centralized.
Page 45 Unrestricted © Siemens Industry, Inc. 2018
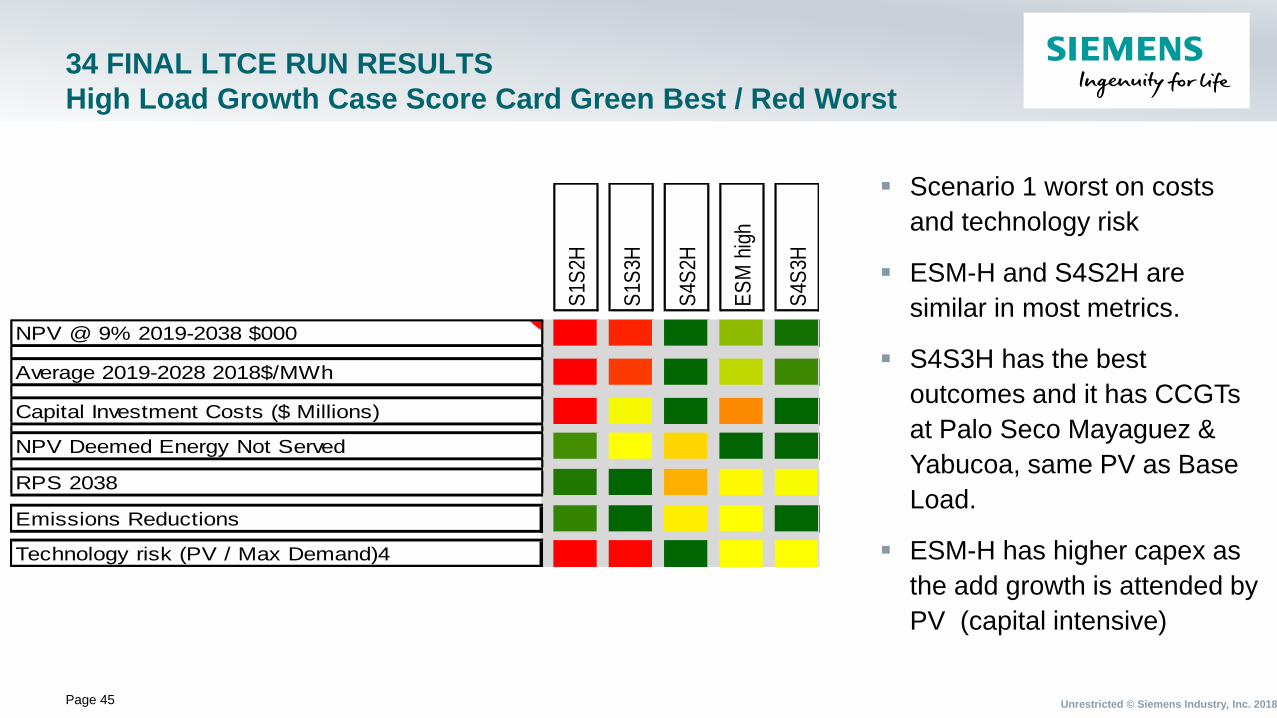
34 FINAL LTCE RUN RESULTS
High Load Growth Case Score Card Green Best / Red Worst
▪ Scenario 1 worst on costs
and technology risk
▪ ESM-H and S4S2H are
similar in most metrics.
▪ S4S3H has the best
outcomes and it has CCGTs
at Palo Seco Mayaguez &
Yabucoa, same PV as Base
Load.
▪ ESM-H has higher capex as
the add growth is attended by
PV (capital intensive)
S1S
2H
S1S
3H
S4S
2H
ES
M h
igh
S4S
3H
NPV @ 9% 2019-2038 $000
Average 2019-2028 2018$/MWh
Capital Investment Costs ($ Millions)
NPV Deemed Energy Not Served
RPS 2038
Emissions Reductions
Technology risk (PV / Max Demand)4
Page 46 Unrestricted © Siemens Industry, Inc. 2018
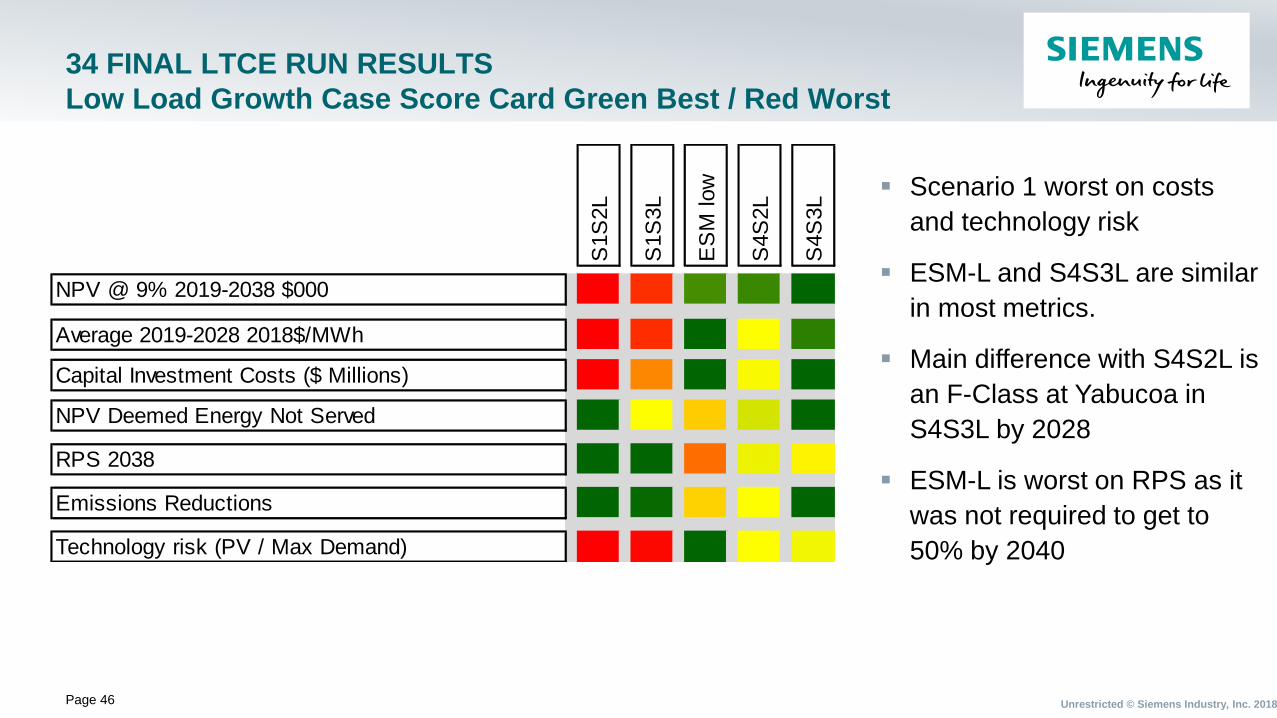
34 FINAL LTCE RUN RESULTS
Low Load Growth Case Score Card Green Best / Red Worst
▪ Scenario 1 worst on costs
and technology risk
▪ ESM-L and S4S3L are similar
in most metrics.
▪ Main difference with S4S2L is
an F-Class at Yabucoa in
S4S3L by 2028
▪ ESM-L is worst on RPS as it
was not required to get to
50% by 2040
S1S
2L
S1S
3L
ES
M low
S4S
2L
S4S
3L
NPV @ 9% 2019-2038 $000
Average 2019-2028 2018$/MWh
Capital Investment Costs ($ Millions)
NPV Deemed Energy Not Served
RPS 2038
Emissions Reductions
Technology risk (PV / Max Demand)
Page 47 Unrestricted © Siemens Industry, Inc. 2018
34 FINAL LTCE RUN RESULTS
NPV view
▪ Scenario 3 has the lowest NPV but
assumes high rate of
interconnection of renewable and
deeper drop in costs. It highlights
an opportunity to be aware if the
underlying assumptions
materialize.
▪ Scenario 5 has the lowest NPV but
as indicated earlier is the least
resilient. Same observation with
Scenario 4 Strategy 1.
▪ .
11,000
12,000
13,000
14,000
15,000
16,000
17,000
18,000
S1S1 S1S2 S1S3 S3S2 S3S3 S4S1 S4S2 S4S2-M S4S3 ESM S5S1
Net
Pre
sent
Val
ue ($
M o
f 201
8$)
Base Load Forecast High Load Forecast Low Load Forecast
Action Plan 5 years
WWW.Siemens.comRestricted
Page 49 Unrestricted © Siemens Industry, Inc. 2018
ACTION PLAN
▪ Solar Photovoltaics (install 900 MW to 1800 MW) ESM & S4S2
▪ Battery Energy Storage (install 600 MW to 900 MW) ESM & S4S2
2019 2020 2021 2022 2023
Solar PV Additions (MW) 0 0 240 480 180
Cumulative Additions (MW) 0 0 240 720 900
Capital Expenditures ($M) - - $343 $678 $251
2019 2020 2021 2022 2023
Solar PV Additions (MW) 0 300 300 600 600
Cumulative Additions (MW) 0 300 600 1200 1800
Capital Expenditures ($M) - $452 $428 $848 $837
2019 2020 2021 2022 2023
BESS Additions (MW) 20 100 160 160 160
Cumulative Additions (MW) 20 120 280 440 600
Capital Expenditures ($M) $24 $109 $163 $153 $147
2019 2020 2021 2022 2023
BESS Additions (MW) 180 300 300 120 0
Cumulative Additions (MW) 180 480 780 900 900
Capital Expenditures ($M) $216 $328 $308 $115 -
ESM
S4S2B
ESM
S4S2B
Page 50 Unrestricted © Siemens Industry, Inc. 2018
ACTION PLAN; NEXT 5 YEARS
▪ San Juan 5&6 Combined Cycle (CC) Conversion to Natural Gas (2x200MW) by 2019
▪ Mayagüez 1, 2, 3, 4 Peaker Conversion to LNG Natural Gas (4x50MW) by 2022 supported by a Ship-
Based LNG
▪ EcoEléctrica Contract Renegotiation and Extension with a CCGT as the basis
▪ San Juan Generator Conversions to Synchronous Condensers for PV integration
▪ Palo Seco CCGT (302 MW F-Class) by 2025 supported by a Land-Based LNG
▪ Costa Sur CCGT (302 MW F-Class) by 2025 if contract negotiation unsuccessful
▪ Yabucoa CCGT (302 MW F-Class) by 2025 supported by a Ship-Based LNG
▪ Mayagüez CCGT (302 MW F-Class) if Yabucoa is not built supported by a Ship-Based LNG
▪ San Juan Small CCGT – LPG/NG (3x38MW) as an option against delays / early failure of units,
supported by a Ship-Based LNG and with LPG as an option.
Page 51 Unrestricted © Siemens Industry, Inc. 2018
ACTION PLAN
▪ Mobile Gas Turbine Peaking Units (18x23 MW) for resiliency.
Location Number of Units
Jobos 2
Mayagüez North 4
Carolina (Daguao) 5
Caguas (Yabucoa) 5
Cayey 2
Total 18
Page 52 Unrestricted © Siemens Industry, Inc. 2018
ACTION PLAN
▪ Retirements of Existing units are based on:
o The realization of forecasted load reductions
o The real implementation and effectiveness of Energy Efficiency and Demand Response Programs
o The installation and commissioning of the large scale solar and battery storage resources
o The installation and commissioning of the new conventional generation units.
o Effective maintenance and availability of PREPA’s remaining units
o Actual zero dispatch experience of the units to be shut down
Unit Last Year in Service
Frame 5 Peakers 2019 to 2021
Aguirre ST 1 2019
Aguirre ST 2 2020
Costa Sur 6 2020
Costa Sur 5 2021
San Juan 7&8 2023
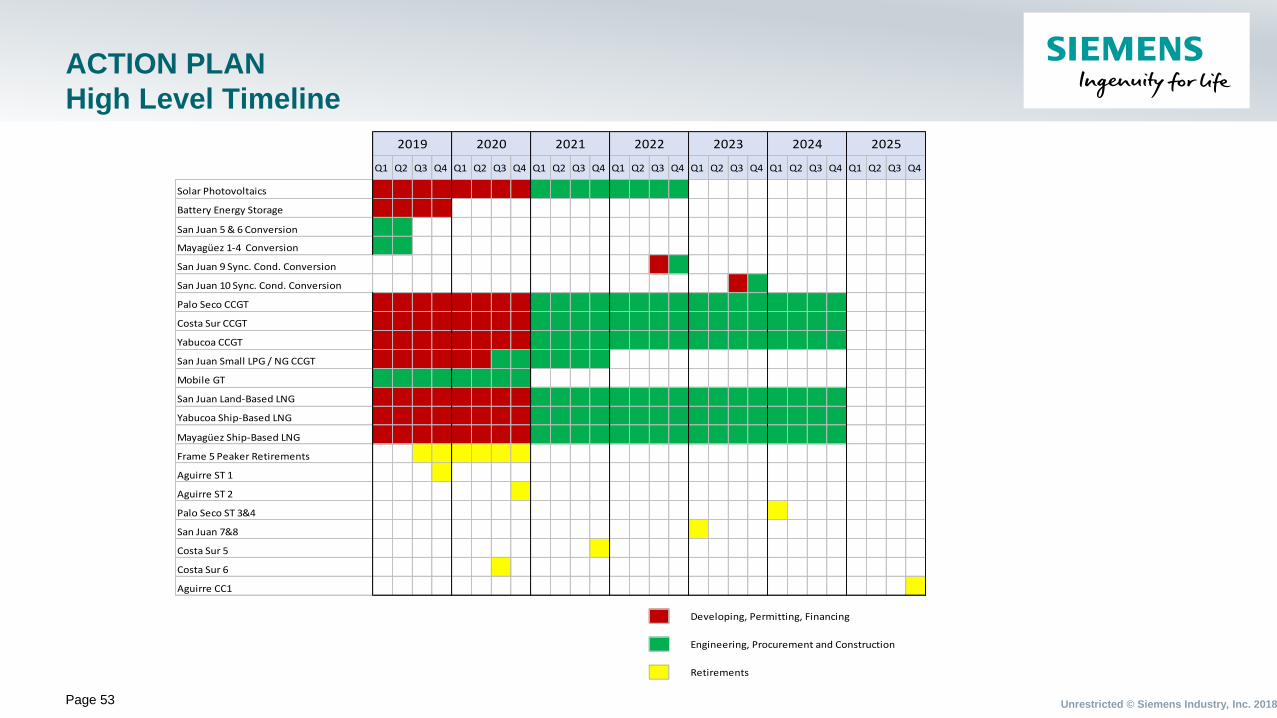
Page 53 Unrestricted © Siemens Industry, Inc. 2018
ACTION PLAN
High Level Timeline
Q1 Q2 Q3 Q4 Q1 Q2 Q3 Q4 Q1 Q2 Q3 Q4 Q1 Q2 Q3 Q4 Q1 Q2 Q3 Q4 Q1 Q2 Q3 Q4 Q1 Q2 Q3 Q4
Solar Photovoltaics
Battery Energy Storage
San Juan 5 & 6 Conversion
Mayagüez 1-4 Conversion
San Juan 9 Sync. Cond. Conversion
San Juan 10 Sync. Cond. Conversion
Palo Seco CCGT
Costa Sur CCGT
Yabucoa CCGT
San Juan Small LPG / NG CCGT
Mobile GT
San Juan Land-Based LNG
Yabucoa Ship-Based LNG
Mayagüez Ship-Based LNG
Frame 5 Peaker Retirements
Aguirre ST 1
Aguirre ST 2
Palo Seco ST 3&4
San Juan 7&8
Costa Sur 5
Costa Sur 6
Aguirre CC1
Developing, Permitting, Financing
Engineering, Procurement and Construction
Retirements
2024 20252019 2020 2021 2022 2023
Page 54 Unrestricted © Siemens Industry, Inc. 2018
REFERENCES
▪ The IRP full documents can be found at.
o https://aeepr.com/es-pr/QuienesSomos/Paginas/ley57/Plan-Integrado-de-Recursos.aspx


