Premium MANUAL Rates - WSIB€¦ · setting, along with responsible management actions, will ensure...
594
2011 Premium Rates MANUAL SECTION 1 Introduction SECTION 2 Definition of 2010 Premium Rate Components SECTION 3 Summary of Allocation Rules SECTION 4 2010 Premium Rates For Each Rate Group, by Class SECTION 5 For Each Classification Unit, by Class SECTION 6 Supporting Documentation for Each Class Class A – Forest Products Class B – Mining and Related Industries Class C – Other Primary Industries Class D – Manufacturing Class E –Transportation and Storage Class F – Retail and WholesaleTrades Class G – Construction Class H – Government and Related Services Class I – Other Services SECTION 7 Supporting Documentation for Schedule 1 SECTION 8 Classification Scheme Changes SECTION 9 Non-Credible Rate Groups SECTION 10 Glossary of Acronyms SECTION 11 Contact Information ISSN 1492-0050 (Online) ISBN 978-1-4435-5443-5 (PDF, 2011 ed.) ISSN 1492-0042 (Print) ISBN 978-1-4435-5442-8 (Print, 2011 ed.)
Transcript of Premium MANUAL Rates - WSIB€¦ · setting, along with responsible management actions, will ensure...

2011Premium Rates M
ANUAL
SECTION 1 Introduction
SECTION 2 Definitionof2010PremiumRateComponents
SECTION 3 SummaryofAllocationRules
SECTION 4 2010PremiumRatesForEachRateGroup,byClass
SECTION 5 ForEachClassificationUnit,byClass
SECTION 6 SupportingDocumentationforEachClass
ClassA–ForestProducts
ClassB–MiningandRelatedIndustries
ClassC–OtherPrimaryIndustries
ClassD–Manufacturing
ClassE–TransportationandStorage
ClassF–RetailandWholesaleTrades
ClassG–Construction
ClassH–GovernmentandRelatedServices
ClassI–OtherServices
SECTION 7 SupportingDocumentationforSchedule1
SECTION 8 ClassificationSchemeChanges
SECTION 9 Non-CredibleRateGroups
SECTION 10 GlossaryofAcronyms
SECTION 11 ContactInformation
ISSN1492-0050(Online)ISBN978-1-4435-5443-5(PDF,2011ed.)
ISSN1492-0042(Print)
ISBN978-1-4435-5442-8(Print,2011ed.)

SECTION 1Introduction
2011Premium Rates M
ANUAL

INTRODUCTION
a. 2011 Premium Rates Summary
To create stable and competitive premium rates for the future, the WSIB Board of
Directors has decided that modest increases to the average premium rate of 2 per cent
for 2011 and 2012 are required, with the additional condition that no rate group’s
premium rates will be decreased. The Board of Directors has acknowledged an
immediate need for modest premium rate increases, along with action from within the
WSIB to slow the growth of the unfunded liability (UFL) and ensure premium revenue
covers the full cost of benefits for workers. A financially prudent approach to rate-
setting, along with responsible management actions, will ensure the long-term financial
sustainability of the workplace safety and insurance system.
As noted in the Auditor General’s 2010 Annual Report, the rate increases for 2011 and
2012 represent a necessary first step toward addressing the WSIB’s UFL over time. The
increases, along with legislative amendments and a major funding review being led by
Professor Harry Arthurs, should help to ultimately reduce premiums by achieving a
sufficiently funded system.
The UFL is now more than $12 billion, and its rise can be attributed to artificially low
premium rates and increasing benefit costs. Benefit costs have outpaced premium
revenue increases by five per cent each year since 1999.
Between 1996 and 2009, premium rates have actually fallen by 25 per cent in
absolute terms. The WSIB needs to improve its financial situation by eliminating the
UFL and moving towards a sufficiently funded system. Full funding is the standard for
most other Canadian workers’ compensation systems. With a sufficiently funded
system, future benefits are secure and employer premiums are lower.
The average premium rate is determined through an actuarial process, and is used as a
base number to create individual rate group rates through the application of rate-group-
specific claims frequency and cost information. It is not an average of the 154 rate
group premium rates. Almost half of all registered employers will see no premium rate
increase for 2011, while other employers with a history of costly injury claims may see
increases of up to 1.0% of their payroll costs.
b. The Role of the Workplace Safety and Insurance Board (WSIB)
The WSIB helps workers deal with the consequences of workplace injuries and illnesses
– providing a comprehensive bundle of insurance benefits and helping them recover
and return to work.
Section 1 - ©WSIB Ontario 1

The WSIB:
Promotes health and safety in workplaces to prevent and reduce the occurrence of
workplace injuries and occupational diseases
Assists in the return to work and recovery of injured and ill workers
Provides benefits to injured and ill workers and to the dependants of workers who
have died as a result of a workplace injury or illness
The WSIB is a statutory corporation created by an Act of the Ontario Legislature in
1914. The WSIB is responsible for administering the Workplace Safety and Insurance
Act, 1997 (WSIA). The Ministry of Labour is responsible for administering the
Occupational Health and Safety Act.
The WSIB receives no government funding. WSIB premium revenue must cover all
costs associated with both new and existing claims. Revenue is also raised through
returns on invested assets and revenue in excess of 7% is available to reduce the UFL.
Employers covered by the WSIA, are divided into two groups, referred to as “Schedule
1” and “Schedule 2.” Schedule 1 employers are insured under a “collective liability”
system, and are required to contribute to the WSIB Insurance Fund. Schedule 2
employers are “self-insured,” and are individually liable for the full costs of their
workers’ WSIB claims. The WSIB pays insurance benefits for Schedule 2 workers and is
reimbursed by Schedule 2 employers for costs (including administrative costs) of the
claims.
This Premium Rates Manual pertains to Schedule 1 employers only.
c. Funding Review
The WSIB is moving forward with a Funding Review to ensure the long-term financial
stability of the WSIB. The Funding Review will be chaired by Professor Harry Arthurs,
former Dean of Osgoode Hall Law School and President Emeritus of York University.
By engaging in a third-party review of the system, the WSIB is dedicated to being open
and transparent about the review process and its findings.
The WSIB’s projected UFL – the difference between payments for future benefits to
workers and funding received from business – has risen due to low premiums, rising
claims and health care costs and declining investment returns following the recent
economic downturn. Right now, the fund is only large enough to cover about half of the
projected costs in the system.
Section 1 - ©WSIB Ontario 2

The goal of the funding review is to establish a dialogue and seek input from employers
of all sizes, from workers and unions, and from other interested parties on a range of
public policy issues relating to the WSIB’s financial future. This includes appropriate
funding levels for the WSIB, a timeline for eliminating the UFL, and the current
premium-rate-setting methodology.
Through this dialogue and evaluation of alternatives, the Funding Review is intended to
work towards building a consensus around the best path to follow and to inform WSIB
strategies moving forward. This consultation is expected to conclude in November
2011.
d. Derivation of the 2011 Premium Rates
The Schedule 1 costs of the workers’ compensation system are funded through
premium rates, which are applied to the payroll of Schedule 1 employers. All Schedule
1 employers are not charged the same rate. Rather, for the purpose of charging them
on an equitable basis, employers are classified into rate groups. Rate groups are
defined in a classification scheme and each rate group has a different premium rate,
reflecting the inherent risk of the specific business activities of industries insured within
that group.
The classification scheme divides business activities into nine broad classes, which are
further subdivided into 154 rate groups based on similarity of business activity and
relative risk. Information about changes to the WSIB classification scheme can be
found in Section 8 of this manual. Additional details about the classification scheme
itself can be obtained from the WSIB’s Employer Classification Manual (ECM) on the
WSIB website, www.wsib.on.ca.
For each of the classes and rate groups defined in the classification scheme, the WSIB
derives a premium rate to cover expected costs relating to the upcoming 2011
premium year. These costs include:
a) The expected future lifetime costs to pay benefits and claims-related administrative
expenses associated with all new claims for the premium year;
b) The WSIB’s expenses to administer the WSIA, the Ministry of Labour’s expenses to
administer the Occupational Health and Safety Act, the Workplace Safety and
Insurance Appeals Tribunal, Offices of the Employer Advisor and the Worker Advisor,
and the expenses of the Safe Workplace Associations and research; and
Section 1 - ©WSIB Ontario 3

c) Past claims cost, including charges:
- to retire the WSIB’s unfunded liability;
- for gains and losses, which take into account the actual claims cost experience
of a class, as compared to what was originally priced for specific injury years. For
the 2011 premium rates, the gains and losses component reflects actual
experience for injury years 2004 through 2009; and
- to cover bad debts expense. This is recognition by class of uncollectible
premiums on employer accounts, after all avenues for collection have been
exhausted.
Premium rates are determined annually. Rates are expressed as a dollar amount per
$100 of insurable earnings, and the change from 2010 as a percentage of payroll
costs.
An annual maximum ceiling for average earnings used for determining benefits and
premiums is set each year according to the Workplace Safety and Insurance Act. The
ceiling for the premium rate year (2011) is based on 175% of the average industrial
wage for Ontario from the most recent published Statistics Canada earnings data
available on July 1st of the previous year (2010). The 2011 maximum insurable
earnings ceiling is $79,600, an increase of 2.6% over the 2010 ceiling of $77,600.
Although many rate groups had their 2011 premium rates remain the same as in
2010, the nine industry classes play a significant role in rate setting. The class level is
where certain costs are projected using data and assumptions particular to each class.
After the class estimates have been determined, estimates are derived for the rate
groups of each class. The 2011 premium rates are based on a projection of claims
experience and insurable earnings data from the most recent six years – that is, for the
period from 2004 through 2009 inclusive.
There are many assumptions used when determining premium rates for the classes,
including assumptions that relate to the economy. For instance, changes in the level of
employment and earnings of a class are two factors that can influence the insurable
earnings estimate for the class. The WSIB bases its assumptions of future insurable
earnings on sector-specific information received from organizations such as
Informetrica*, modified with input from other WSIB sources.
* Informetrica is a privately-owned Canadian company specializing in quantitative economic research. Its
products and services provide comprehensive coverage of Canadian economic prospects and public policy.
Section 1 - ©WSIB Ontario 4

The WSIB’s class-by-class forecast economic assumptions (as determined in March
2010) are shown below.
Economic Assumptions Supporting the 2011 Premium Rates
Class
Earnings
Growth
2009-2010
Earnings
Growth
2010-2011
Employment
Growth
2009-2010
Employment
Growth
2010-2011
Class A: Forest Products 0.48% 1.34% -2.87% -2.34%
Class B: Mining and Related Industries -0.24% 0.84% 0.99% 0.90%
Class C: Other Primary Industries 1.60% 1.40% 0.84% 0.70%
Class D: Manufacturing 2.42% 1.17% -0.03% 0.43%
Class E: Transportation and Storage 1.76% 1.14% -1.51% 0.69%
Class F: Retail and Wholesale Trades 2.31% 2.54% 0.67% 0.88%
Class G: Construction 1.64% 1.22% 2.59% 2.39%
Class H: Government and Related Services 3.64% 2.54% 2.55% 1.69%
Class I: Other Services 2.53% 2.29% 0.81% 0.87%
Schedule 1 2.60% 2.00% 0.90% 1.00%
e. Classification Scheme and Data Sources
Schedule 1 employers are divided into nine classes (denoted by class codes A through
I). Employers within each class are then subdivided into rate groups. The grouping of
employers within a single rate group is based on similarity of business activities and/or
relative risk. The number of rate groups in each class varies according to the size of the
economic sector covered by each class. For example, Class B: Mining and Related
Industries, contains four rate groups, whereas Class D: Manufacturing, contains 73 rate
groups.
Rate groups are further divided into classification units. Classification units are used as
a means of tracking the relative experience of various employer subgroups. Firms in a
classification unit share similar business activities, risks or other characteristics. All
employers within a single rate group, no matter which classification unit they belong to
or their payroll size, are charged the same premium rate (before any merit adjustments
or experience rating). Premium rates are not calculated for classification units.
Section 1 - ©WSIB Ontario 5

The classes referred to in this manual should not be confused with industry sectors,
which is another categorization used by the WSIB to compare common business
practices and approaches.
The figures shown in the Supporting Documentation sections of this manual are based
on the data available as of June 2010. Employers may obtain more recent information
by contacting the WSIB (see Section 11 of this manual for contact information).
f. Realignment of Safe Workplace Associations
To align prevention partner efforts and achieve improved outcomes, the Occupational
Health & Safety Council of Ontario (OHSCO) initiated a Roles Review and Realignment
project in the spring of 2008. The Safe Workplace Associations (SWAs), WSIB and
Ministry of Labour recognized the need to create a future “system that responds in a
flexible, active way to emerging problems.” The new prevention system would be
marked by:
- A streamlined SWA model;
- The maintenance and enhancement of sector-specificity in the front lines;
- Integrated planning;
- Consolidated “strategic services”; and
- One website (a common system access point) and one integrated and
aligned communication and marketing plan.
As a result of streamlining, the 12 existing SWAs have been amalgamated into four
new ones:
Former New
SWAs Description SWAs Description
CSAO Construction Safety Association of Ontario IHSA Infrastructure Health and Safety Association
ESAO Education Safety Association of Ontario PSHSA Public Services Health and Safety Association
EUSA Electrical & Utilities Safety Association WSN Workplace Safety North
FSA Farm Safety Association WSPS Workplace Safety & Prevention Services
IAPA Industrial Accident Prevention Association
MASHA Mines and Aggregates Safety and Health Association
MHSA Municipal Health and Safety Association
OFSWA Ontario Forestry Safe Workplace Association
OSACH Ontario Safety Association for Community & Healthcare
OSSA Ontario Service Safety Alliance
PPHSA Pulp and Paper Health and Safety Association
THSAO Transportation Health & Safety Association of Ontario
Section 1 - ©WSIB Ontario 6

In terms of industry coverage, IHSA primarily encompasses employers in the
construction, transportation, and electrical industries, PSHSA focuses on the education,
health care, and municipal sectors, with a critical mass of Schedule 2 employers, WSN
covers forestry, mining, and pulp/paper industries, and WSPS includes the farming,
manufacturing, and service sectors.
The 2011 premium rates reflect the SWA realignment in that a rate group pays a share
of the Schedule 1 expenses for one of the four new SWAs instead of for one of the 12
former SWAs.
Section 1 - ©WSIB Ontario 7

2011Premium Rates M
ANUAL
SECTION 2Definition of 2010
Premium Rate Components

DEFINITION OF
2011 PREMIUM RATE COMPONENTS
A. New Claims Cost
1. New Claims Cost The estimated full cost of new claims for injuries
expected to occur during 2011
B. Overhead Expenses
1. Administrative Expenses Expenses of the WSIB estimated for the year
2011, to administer the WSIA
2. Legislative Obligations Expenses the WSIB is required to fund under the
Occupational Health and Safety Act, the
Workplace Safety and Insurance Appeals
Tribunal, Office of the Employer Advisor, Office of
the Worker Advisor, and research
3. Prevention Expenses for the Safe Workplace Associations
(SWAs) estimated
4. Total Overhead Expenses Total of Administrative, Legislative Obligations,
and Prevention expenses
C. Past Claims Cost
1. Unfunded Liability Payment required to retire the unfunded liability
2. (Gain)/Loss Adjustment reflecting the difference in actual vs.
expected claims cost experience for injury years
2004 through 2009
3. Bad Debts Charge to cover bad debts due to uncollectible
premiums owing on employer accounts
4. Total Past Claims Cost Total of Unfunded Liability, (Gain)/Loss, and Bad
Debts
D. Premium Rate Total cost per $100 of insurable earnings
required to fund new claims, overhead, and past
claims
Section 2 - ©WSIB Ontario 8

2011Premium Rates M
ANUAL
SECTION 3Summary of Allocation Rules

SUMMARY OF ALLOCATION RULES
FOR 2011 PREMIUM RATES
A. New Claims Cost
New claims costs are determined at the class level. However, rate groups belonging
to a class pay them.
The share of the class new claims cost charged to a member rate group is based on
the expected number of claims, the average cost of a claim expected for that rate
group and a loading for future claims administrative costs of new claims for the
premium year.
The average cost of a claim for a rate group is determined via a Cost Index, which
indicates the relative costliness of an average claim for the rate group as compared
to the cost for its class.
B. Overhead Expenses
Overhead expenses are allocated to rate groups in proportion to their new claims
cost and insurable earnings.
Rate groups covered by a particular Safe Workplace Association (SWA) pay a
proportionate share of the expenses of that SWA.
C. Past Claims Cost
1. Unfunded Liability
The Unfunded Liability (UFL) charge is determined for Schedule 1 as a collective
whole. However, rate groups pay it.
The share of the UFL charge paid by rate groups is in proportion to their new
claims cost.
Section 3 - ©WSIB Ontario 9

2. (Gain)/Loss
Gains and losses are determined at the class level and spread over a period of
six years. If the actual claims cost experience of a class was better than its
expected experience then a gain is generated for that class. Conversely, when
the actual experience was worse than expected, there is a loss. For the 2011
premium rates, gains and losses are based on injury years 2004 through 2009.
A gain results in a reduction in premium rates while a loss results in an increase.
The gain or loss of a class is allocated to its rate groups in proportion to their
new claims cost.
3. Bad Debts
Bad Debts charges are determined at the class level based on experience from
the five years 2005 to 2009.
The share of the Bad Debts charge paid by rate groups is in proportion to their
premium.
Section 3 - ©WSIB Ontario 10

2011Premium Rates M
ANUAL
SECTION 42010 Premium Rates for Each Rate Group, by Class

Rate
Group Description
2011
Premium
Rate
($)
030 LOGGING 12.47
033 MILL PRODUCTS AND FORESTRY SERVICES 8.42
036 VENEERS, PLYWOOD AND WOOD PRESERVATION 5.14
039 PULP, NEWSPRINT AND SPECIALTY PAPERS 2.80
041 CORRUGATED BOXES 3.10
CLASS A : FOREST PRODUCTS 4.71
Section 4 - ©WSIB Ontario 11

Rate
Group Description
2011
Premium
Rate
($)
110 GOLD MINES 7.79
113 NICKEL MINES 4.98
119 OTHER MINES 6.40
134 AGGREGATES 6.24
CLASS B : MINING AND RELATED INDUSTRIES 6.29
Section 4 - ©WSIB Ontario 12

Rate
Group Description
2011
Premium
Rate
($)
159 LIVESTOCK FARMS 6.78
167 FIELD CROP, FRUIT AND VEGETABLE FARMS 2.72
174 TOBACCO AND MUSHROOM FARMS 4.93
181 FISHING AND MISCELLANEOUS FARMING 3.51
184 POULTRY FARMS AND AGRICULTURAL SERVICES 3.13
190 LANDSCAPING AND RELATED SERVICES 4.72
CLASS C : OTHER PRIMARY INDUSTRIES 4.01
Section 4 - ©WSIB Ontario 13

Rate
Group Description
2011
Premium
Rate
($)
207 MEAT AND FISH PRODUCTS 4.46
210 POULTRY PRODUCTS 3.35
214 FRUIT AND VEGETABLE PRODUCTS 2.57
216 DAIRY PRODUCTS 2.17
220 OTHER BAKERY PRODUCTS 3.83
222 CONFECTIONERY 1.73
223 BISCUITS, SNACK FOODS AND OTHER FOOD PRODUCTS 2.68
226 CRUSHED AND GROUND FOODS 1.62
230 ALCOHOLIC BEVERAGES 1.49
231 SOFT DRINKS 3.43
238 OTHER RUBBER PRODUCTS 3.95
258 FOAMED AND EXPANDED PLASTIC PRODUCTS 2.79
261 PLASTIC FILM AND SHEETING 2.35
263 OTHER PLASTIC PRODUCTS 3.09
289 CLOTH, CARPETS AND TEXTILE PRODUCTS 3.55
301 CLOTHING, FIBRE AND YARN 2.32
308 MILLWORK AND OTHER WOOD INDUSTRIES 5.33
311 WOODEN CABINETS 3.98
312 WOODEN BOXES AND PALLETS 6.83
322 UPHOLSTERED FURNITURE 3.20
323 METAL FURNITURE 2.24
325 WOODEN AND OTHER NON-METAL FURNITURE 4.12
328 FURNITURE PARTS AND FIXTURES 3.99
333 PRINTING, PLATEMAKING AND BINDING 1.68
335 PUBLISHING 0.54
338 FOLDING CARTONS 2.54
341 PAPER PRODUCTS 3.05
352 STEEL AND OTHER SMELTING AND REFINING INDUSTRIES 2.51
358 FOUNDRIES 4.11
361 NON-FERROUS METAL INDUSTRIES 3.44
374 DOORS AND WINDOWS 3.41
375 STRUCTURAL AND ARCHITECTURAL PRODUCTS 4.51
377 COATING OF METAL PRODUCTS 4.01
379 HARDWARE, TOOLS AND CUTLERY 2.63
382 METAL DIES, MOULDS AND PATTERNS 2.13
383 HEATING, REFRIGERATION AND AIR CONDITIONING EQUIPMENT 2.67
385 MACHINE SHOPS 2.50
Section 4 - ©WSIB Ontario 14

Rate
Group Description
2011
Premium
Rate
($)
387 OTHER METAL FABRICATING INDUSTRIES 3.52
389 METAL CLOSURES AND CONTAINERS 2.48
390 OTHER STAMPED AND PRESSED METAL PRODUCTS 3.44
393 WIRE PRODUCTS 3.23
402 MAJOR APPLIANCES AND TRANSMISSION EQUIPMENT 2.23
403 OTHER MACHINERY AND EQUIPMENT 1.67
406 ELEVATORS AND ESCALATORS 2.59
408 BOILERS, PUMPS AND FANS 2.35
411 AGRICULTURAL, CONSTRUCTION AND MINING MACHINERY 2.76
417 AIRCRAFT MANUFACTURING 1.50
419 MOTOR VEHICLE ASSEMBLY 3.44
420 MOTOR VEHICLE ENGINE MANUFACTURING 1.81
421 OTHER MOTOR VEHICLE PARTS AND EQUIPMENT 3.44
424 MOTOR VEHICLE STAMPINGS 3.44
425 MOTOR VEHICLE WHEELS AND BRAKES 3.44
428 MOTOR VEHICLE FABRIC ACCESSORIES 4.38
432 TRUCKS, BUSES AND TRAILERS 4.21
442 RAILROAD ROLLING STOCK 2.63
460 LIGHTING AND SMALL ELECTRICAL APPLIANCES 2.54
466 COMMUNICATION AND ENERGY WIRE PRODUCTS 2.34
468 ELECTRONIC EQUIPMENT & OTHER COMMUNICATION DEVICES 0.39
477 INDUSTRIAL ELECTRICAL EQUIPMENT 1.49
485 BRICKS, CERAMICS AND ABRASIVES 4.34
496 CONCRETE PRODUCTS 5.19
497 READY-MIX CONCRETE 3.76
501 NON-METALLIC MINERAL PRODUCTS 2.87
502 GLASS PRODUCTS 2.92
507 PETROLEUM AND COAL PRODUCTS 1.13
512 RESINS, PAINT, INK AND ADHESIVES 1.68
514 PHARMACEUTICALS AND MEDICINES 0.92
517 SOAP AND TOILETRIES 1.61
524 CHEMICAL INDUSTRIES 1.88
529 JEWELRY AND INSTRUMENTS 0.98
533 SIGNS AND DISPLAYS 3.06
538 SPORTING GOODS AND TOYS 4.10
542 OTHER MANUFACTURED PRODUCTS 2.04
CLASS D : MANUFACTURING 2.41
Section 4 - ©WSIB Ontario 15

Rate
Group Description
2011
Premium
Rate
($)
551 AIR TRANSPORT INDUSTRIES 2.00
553 AIR TRANSPORT SERVICES 1.85
560 WAREHOUSING 3.28
570 GENERAL TRUCKING 6.43
577 COURIER SERVICES 2.89
580 MISCELLANEOUS TRANSPORT INDUSTRIES 4.89
584 SCHOOL BUSES 2.91
590 AMBULANCE SERVICES 6.18
CLASS E : TRANSPORTATION AND STORAGE 4.83
Section 4 - ©WSIB Ontario 16

Rate
Group Description
2011
Premium
Rate
($)
604 FOOD, SALES 2.43
606 GROCERY AND CONVENIENCE STORES 2.11
607 SPECIALTY FOOD STORES 3.57
608 BEER STORES 3.99
612 AGRICULTURAL PRODUCTS, SALES 2.37
630 VEHICLE SERVICES AND REPAIRS 3.39
633 PETROLEUM PRODUCTS, SALES 2.49
636 OTHER SALES 1.40
638 PHARMACIES 0.68
641 CLOTHING STORES 1.53
657 AUTOMOBILE AND TRUCK DEALERS 0.78
668 COMPUTER, ELECTRONIC AND ELECTRICAL EQUIPMENT, SALES 0.48
670 MACHINERY AND OTHER VEHICLES, SALES 1.76
681 LUMBER AND BUILDERS SUPPLY 2.88
685 METAL PRODUCTS, WHOLESALE 3.11
689 WASTE MATERIALS RECYCLING 5.90
CLASS F : RETAIL AND WHOLESALE TRADES 1.74
Section 4 - ©WSIB Ontario 17

Rate
Group Description
2011
Premium
Rate
($)
704 ELECTRICAL AND INCIDENTAL CONSTRUCTION SERVICES 3.53
707 MECHANICAL AND SHEET METAL WORK 3.98
711 ROADBUILDING AND EXCAVATING 5.06
719 INSIDE FINISHING 7.19
723 INDUSTRIAL, COMMERCIAL & INSTITUTIONAL CONSTRUCTION 4.35
728 ROOFING 14.16
732 HEAVY CIVIL CONSTRUCTION 6.73
737 MILLWRIGHTING AND WELDING 6.60
741 MASONRY 12.15
748 FORM WORK AND DEMOLITION 17.51
751 SIDING AND OUTSIDE FINISHING 9.80
764 HOMEBUILDING 8.71
CLASS G : CONSTRUCTION 6.36
Section 4 - ©WSIB Ontario 18

Rate
Group Description
2011
Premium
Rate
($)
810 SCHOOL BOARDS 0.78
817 EDUCATIONAL FACILITIES 0.36
830 POWER AND TELECOMMUNICATION LINES 4.25
833 ELECTRIC POWER GENERATION 0.76
835 OIL, POWER AND WATER DISTRIBUTION 1.03
838 NATURAL GAS DISTRIBUTION 0.67
845 LOCAL GOVERNMENT SERVICES 2.15
851 HOMES FOR NURSING CARE 3.15
852 HOMES FOR RESIDENTIAL CARE 3.16
853 HOSPITALS 1.06
857 NURSING SERVICES 3.17
858 GROUP HOMES 3.01
861 TREATMENT CLINICS AND SPECIALIZED SERVICES 1.06
875 PROFESSIONAL OFFICES AND AGENCIES 0.71
CLASS H : GOVERNMENT AND RELATED SERVICES 1.30
Section 4 - ©WSIB Ontario 19

Rate
Group Description
2011
Premium
Rate
($)
905 APARTMENT AND CONDOMINIUM SERVICES 2.91
908 OTHER REAL ESTATE SERVICES 1.25
911 SECURITY AND INVESTIGATION SERVICES 1.67
919 RESTAURANTS AND CATERING 1.65
921 HOTELS, MOTELS AND CAMPING 2.97
923 JANITORIAL SERVICES 3.57
929 SUPPLY OF NON-CLERICAL LABOUR 4.83
933 EQUIPMENT RENTAL AND REPAIR SERVICES 2.95
937 RECREATIONAL SERVICES AND FACILITIES 2.10
944 PERSONAL SERVICES 3.12
956 LEGAL AND FINANCIAL SERVICES 0.21
958 TECHNICAL AND BUSINESS SERVICES 0.38
962 ADVERTISING AND ENTERTAINMENT 1.05
975 LINEN AND LAUNDRY SERVICES 3.94
981 MEMBERSHIP ORGANIZATIONS 0.77
983 COMMUNICATIONS INDUSTRIES 0.37
CLASS I : OTHER SERVICES 1.25
001 SCHEDULE 1 2.35
Section 4 - ©WSIB Ontario 20

2011Premium Rates M
ANUAL
SECTION 5For Each Classification Unit, by Class

2011 PREMIUM RATES2011
Classification Rate Premium
Unit Description Class Group Rate
($)
0411-099 Logging Operations A 30 12.47
0511-001 Reforestation Services A 33 8.42
0511-002 Other Forestry Services A 33 8.42
2511-000 Shingles and Shakes A 33 8.42
2512-000 Sawmill and Planing Mill Products A 33 8.42
2521-099 Veneer and Plywood Operations A 36 5.14
2591-000 Wood Preservation A 36 5.14
2592-000 Particle Board A 36 5.14
2593-000 Wafer Board A 36 5.14
2711-099 Pulp and Newsprint Operations A 39 2.80
2713-000 Paperboard A 39 2.80
2714-000 Building Board A 39 2.80
2719-000 Specialty Paper Operations A 39 2.80
2733-000 Paper Bags A 39 2.80
2793-000 Paper Consumer Products A 39 2.80
2732-000 Corrugated Box Operations A 41 3.10
Section 5 - ©WSIB Ontario 21

2011 PREMIUM RATES2011
Classification Rate Premium
Unit Description Class Group Rate
($)
0611-000 Gold Mine Operations B 110 7.79
0921-100 Gold Mines, Contracting B 110 7.79
0613-000 Nickel Mine Operations B 113 4.98
0921-200 Nickel Mines, Contracting B 113 4.98
0612-000 Copper and Copper-Zinc Mines B 119 6.40
0614-000 Silver Mines B 119 6.40
0615-000 Molybdenum Mines B 119 6.40
0617-000 Iron Mines B 119 6.40
0619-000 Other Metal Mines B 119 6.40
0621-000 Asbestos Mines B 119 6.40
0622-000 Peat Operations B 119 6.40
0623-000 Gypsum Mines B 119 6.40
0624-000 Potash Mines B 119 6.40
0625-000 Salt Mines B 119 6.40
0629-000 Other Non-Metal Mines B 119 6.40
0631-099 Coal Mines B 119 6.40
0711-099 Crude Oil and Natural Gas B 119 6.40
0911-000 Contract Drilling, Oil and Gas B 119 6.40
0919-000 Other Services Incidental to Crude Oil B 119 6.40
0921-300 Other Mines, Contracting B 119 6.40
0929-001 Other Services Incidental to Mining B 119 6.40
0811-000 Granite Quarries B 134 6.24
0812-000 Limestone Quarries B 134 6.24
0813-000 Marble Quarries B 134 6.24
0814-000 Sandstone Quarries B 134 6.24
0815-000 Shale Quarries B 134 6.24
0821-000 Sand and Gravel Pit Operations B 134 6.24
Section 5 - ©WSIB Ontario 22

2011 PREMIUM RATES2011
Classification Rate Premium
Unit Description Class Group Rate
($)
0111-000 Dairy Farms C 159 6.78
0112-000 Cattle Farms C 159 6.78
0113-000 Hog Farms C 159 6.78
0115-000 Sheep and Goat Farms C 159 6.78
0119-000 Livestock Combination Farms C 159 6.78
0122-000 Horse and Other Equine Farms C 159 6.78
0239-002 Barn Cleaning C 159 6.78
0131-000 Wheat Farms C 167 2.72
0132-000 Small-Grain Farms C 167 2.72
0133-000 Oilseed Farms C 167 2.72
0134-000 Grain Corn Farms C 167 2.72
0135-000 Forage, Seed, and Hay Farms C 167 2.72
0136-000 Dry Field Pea and Bean Farms C 167 2.72
0138-000 Potato Farms C 167 2.72
0139-000 Other Field Crop Farms C 167 2.72
0141-000 Field Crop Combination Farms C 167 2.72
0151-001 Fruit Farms C 167 2.72
0151-002 Grape Growers C 167 2.72
0152-000 Other Vegetable Farms C 167 2.72
0159-000 Fruit and Vegetable Combination Farms C 167 2.72
0171-000 Livestock, Field Crop, and Horticultural Combination Farms C 167 2.72
0137-000 Tobacco Farm Operations C 174 4.93
0161-000 Mushroom Farm Operations C 174 4.93
0121-000 Honey and Other Apiary Product Farms C 181 3.51
0123-000 Furs and Skins, Ranch C 181 3.51
0129-000 Other Animal Specialty Farms C 181 3.51
0162-000 Greenhouses C 181 3.51
0163-000 Plant Nurseries C 181 3.51
0169-000 Other Horticultural Specialties C 181 3.51
0311-099 Fishing C 181 3.51
0331-099 Furs, Skins, and Other Trapping C 181 3.51
Section 5 - ©WSIB Ontario 23

2011 PREMIUM RATES2011
Classification Rate Premium
Unit Description Class Group Rate
($)
0114-000 Poultry and Egg Farm Operations C 184 3.13
0211-000 Veterinary Services C 184 3.13
0212-000 Farm Animal Breeding Services C 184 3.13
0213-000 Poultry Services C 184 3.13
0219-000 Other Services Incidental to Livestock Specialties C 184 3.13
0221-000 Soil Preparation, Planting, and Cultivating Services C 184 3.13
0222-000 Crop Dusting and Spraying Services C 184 3.13
0223-000 Harvesting, Baling, and Threshing Services C 184 3.13
0239-001 Other Services Incidental to Agriculture C 184 3.13
0321-000 Services Incidental to Fishing C 184 3.13
8372-002 Wildlife Preservation and Research C 184 3.13
0229-002 Tree Surgery and Removal C 190 4.72
4212-000 Water Well Drilling C 190 4.72
4219-000 Landscaping and Interlocking Brick C 190 4.72
9959-002 Lawn Maintenance Services C 190 4.72
Section 5 - ©WSIB Ontario 24

2011 PREMIUM RATES2011
Classification Rate Premium
Unit Description Class Group Rate
($)
1011-001 Meat and Meat Products D 207 4.46
1011-002 Deadstock D 207 4.46
1021-000 Fish Products D 207 4.46
1012-000 Poultry Operations D 210 3.35
1031-000 Canned and Preserved Fruits and Vegetables D 214 2.57
1032-000 Frozen Fruits and Vegetables D 214 2.57
1041-000 Fluid Milk D 216 2.17
1049-000 Other Dairy Products D 216 2.17
1072-000 Other Bakery Operations D 220 3.83
1082-000 Chewing Gum D 222 1.73
1083-000 Sugar and Chocolate Confectionery D 222 1.73
1071-000 Biscuit Operations D 223 2.68
1092-000 Dry Pasta Products D 223 2.68
1093-000 Snack Food Operations D 223 2.68
1099-000 Other Food Operations D 223 2.68
1051-000 Cereal Grain Flour D 226 1.62
1052-000 Prepared Flour Mixes and Cereal Foods D 226 1.62
1053-000 Feed Operations D 226 1.62
1061-000 Vegetable Oil Mills D 226 1.62
1081-000 Cane and Beet Sugar D 226 1.62
1091-000 Tea and Coffee D 226 1.62
1211-000 Leaf Tobacco D 226 1.62
1221-000 Tobacco Products D 226 1.62
1094-000 Malt and Malt Flour D 230 1.49
1121-000 Distillery Products D 230 1.49
1131-001 Brewery Products D 230 1.49
1131-002 Home Brewing Centres D 230 1.49
1141-000 Wine D 230 1.49
Section 5 - ©WSIB Ontario 25

2011 PREMIUM RATES2011
Classification Rate Premium
Unit Description Class Group Rate
($)
1111-000 Soft Drinks D 231 3.43
1511-000 Tire and Tube Operations D 238 3.95
5521-002 Tire Vulcanizing and Retreading D 238 3.95
1521-000 Rubber Hose and Belting D 238 3.95
1599-000 Other Rubber Operations D 238 3.95
1611-000 Foamed and Expanded Plastic Product Operations D 258 2.79
1631-000 Plastic Film and Sheeting Operations D 261 2.35
3993-001 Fabric Coating Operations D 261 2.35
1621-000 Plastic Pipe and Fitting Operations D 263 3.09
1691-000 Plastic Bag Operations D 263 3.09
1699-000 Other Plastic Product Operations D 263 3.09
1711-000 Leather Tanneries D 289 3.55
1712-000 Footwear D 289 3.55
1713-000 Luggage, Purses and Handbags D 289 3.55
1719-000 Other Leather and Allied Products D 289 3.55
1821-000 Wool Yarn and Woven Cloth D 289 3.55
1829-000 Other Spun Yarn and Woven Cloth Operations D 289 3.55
1831-000 Broad Knitted Fabrics D 289 3.55
1911-000 Natural Fibres Processing and Felt Products D 289 3.55
1921-000 Carpet, Mat, and Rug Operations D 289 3.55
1931-000 Canvas and Related Products D 289 3.55
1991-000 Narrow Fabrics D 289 3.55
1992-000 Contract Textile Dyeing and Finishing D 289 3.55
1993-000 Household Products of Textile Materials D 289 3.55
1994-000 Hygiene Products of Textile Materials D 289 3.55
1995-000 Tire and Cord Fabric D 289 3.55
1999-000 Other Processed Textile Products D 289 3.55
2495-000 Fur Goods D 289 3.55
Section 5 - ©WSIB Ontario 26

2011 PREMIUM RATES2011
Classification Rate Premium
Unit Description Class Group Rate
($)
1811-000 Fibre and Filament Yarn Operations D 301 2.32
2431-099 Men's and Boys' Clothing D 301 2.32
2441-099 Women's Clothing D 301 2.32
2445-000 Clothing Contractors D 301 2.32
2451-000 Children's Clothing D 301 2.32
2491-000 Sweaters D 301 2.32
2492-000 Occupational Clothing D 301 2.32
2493-000 Gloves D 301 2.32
2494-000 Hosiery D 301 2.32
2496-000 Foundation Garments D 301 2.32
2499-000 Other Clothing and Apparel Operations D 301 2.32
2541-000 Prefabricated Wooden Buildings D 308 5.33
2549-000 Other Millwork Products D 308 5.33
2599-000 Other Wood Operations D 308 5.33
2542-000 Wooden Cabinet Operations D 311 3.98
2561-000 Wooden Box and Pallet Operations D 312 6.83
2612-000 Upholstered Household Furniture D 322 3.20
6213-000 Furniture Refinishing and Repair Shops D 322 3.20
2619-000 Metal Household Furniture D 323 2.24
2641-099 Metal Office and Institutional Furniture and Fixtures D 323 2.24
2581-000 Coffins and Caskets D 325 4.12
2611-000 Wooden Household Furniture D 325 4.12
2649-099 Non-Metal Office and Institutional Furniture and Fixtures D 325 4.12
2691-000 Bed Springs and Mattresses D 328 3.99
2699-000 Other Furniture Parts and Fixtures D 328 3.99
2811-000 Business Forms Printing D 333 1.68
Section 5 - ©WSIB Ontario 27

2011 PREMIUM RATES2011
Classification Rate Premium
Unit Description Class Group Rate
($)
2819-000 Other Commercial Printing D 333 1.68
2821-001 Platemaking, Typesetting, and Binding Operations D 333 1.68
2831-000 Book Publishing D 335 0.54
2839-000 Other Publishing Operations D 335 0.54
2841-000 Newspapers, Magazines, and Periodicals D 335 0.54
2849-000 Other Combined Publishing and Printing Operations D 335 0.54
2731-000 Paperboard Folding Cartons D 338 2.54
2791-000 Coated and Treated Products D 341 3.05
2792-000 Stationery Products D 341 3.05
2799-000 Other Converted Paper Products D 341 3.05
2919-000 Other Primary Steel Operations D 352 2.51
2921-000 Steel Pipe and Tube Operations D 352 2.51
2959-000 Other Primary Smelting and Refining Operations D 352 2.51
2911-000 Ferro-Alloys D 358 4.11
2912-000 Steel Foundries D 358 4.11
2941-000 Iron Foundry Operations D 358 4.11
2951-000 Primary Production of Aluminum D 361 3.44
2961-000 Aluminum Rolling, Casting, and Extruding D 361 3.44
2971-000 Copper and Copper Alloy Rolling, Casting, and Extruding D 361 3.44
2999-000 Other Rolled, Cast, and Extruded Non-Ferrous Metal Products D 361 3.44
2543-000 Wooden Door and Window Operations D 374 3.41
3031-000 Other Door and Window Operations D 374 3.41
3021-000 Metal Tank Operations D 375 4.51
3022-000 Plate Work D 375 4.51
3023-000 Pre-Engineered Metal Buildings D 375 4.51
3029-000 Other Fabricated Structural Metal Products D 375 4.51
3032-000 Portable and Other Prefabricated Metal Buildings D 375 4.51
Section 5 - ©WSIB Ontario 28

2011 PREMIUM RATES2011
Classification Rate Premium
Unit Description Class Group Rate
($)
3039-000 Other Ornamental and Architectural Metal Products D 375 4.51
3244-000 Mobile Buildings D 375 4.51
3271-099 Metal Boat and Ship Building Operations D 375 4.51
3041-001 Other Metal Coating D 377 4.01
3041-002 Powder Painting D 377 4.01
3061-000 Basic Hardware D 379 2.63
3063-000 Hand Tools and Implements D 379 2.63
3069-000 Other Hardware, Tools, and Cutlery D 379 2.63
3062-000 Metal Die, Mould, and Pattern Operations D 382 2.13
3071-000 Heating Equipment D 383 2.67
3121-000 Commercial Refrigeration and Air Conditioning Equipment D 383 2.67
3081-001 General Machine Shops D 385 2.50
3081-002 Automotive Machine Shops D 385 2.50
3091-000 Metal Plumbing Fixtures and Fittings D 387 3.52
3092-000 Metal Valves D 387 3.52
3099-001 Other Metal Fabricating Operations D 387 3.52
3099-002 Metal Heat Treating D 387 3.52
3099-003 Metal Service Centres, Processing D 387 3.52
3042-000 Metal Closure and Container Operations D 389 2.48
3049-000 Other Stamped and Pressed Metal Product Operations D 390 3.44
3051-000 Upholstery and Coil Springs D 393 3.23
3052-000 Wire and Wire Rope D 393 3.23
3053-000 Industrial Fasteners D 393 3.23
3059-000 Other Wire Products D 393 3.23
3992-000 Buttons, Buckles, and Clothes Fasteners D 393 3.23
Section 5 - ©WSIB Ontario 29

2011 PREMIUM RATES2011
Classification Rate Premium
Unit Description Class Group Rate
($)
3194-000 Turbine and Mechanical Power Transmission Equipment D 402 2.23
3321-000 Major Appliance Operations D 402 2.23
3371-000 Electrical Transformer Operations D 402 2.23
3193-000 Sawmill and Woodworking Machinery D 403 1.67
3199-000 Other Machinery and Equipment Operations D 403 1.67
3192-002 Elevator and Escalator and Parts Manufacturing D 406 2.59
4291-001 Elevator and Escalator Installation, Service, and Repair D 406 2.59
3011-000 Power Boiler and Heat Exchanger Operations D 408 2.35
3191-000 Compressor, Pump, and Industrial Fan Operations D 408 2.35
3111-000 Agricultural Implement Operations D 411 2.76
3192-001 Industrial Machinery Operations D 411 2.76
3211-000 Aircraft and Aerospace Manufacturing D 417 1.50
3231-000 Motor Vehicle Assembly Operations D 419 3.44
3251-000 Motor Vehicle Engine and Parts Operations D 420 1.81
3252-001 Motor Vehicle Electrical Parts D 420 1.81
3391-000 Battery Operations D 420 1.81
3243-000 Recreational Vehicle and Trailer Operations D 421 3.44
3254-000 Motor Vehicle Steering and Suspension Parts D 421 3.44
3256-000 Motor Vehicle Plastic Parts D 421 3.44
3259-001 Other Motor Vehicle Accessories, Parts, and Assemblies D 421 3.44
3259-002 Powder Metallurgy Products D 421 3.44
3259-003 Motor Vehicle Air Conditioners D 421 3.44
3299-000 Other Transportation Equipment D 421 3.44
3253-000 Motor Vehicle Stamping Operations D 424 3.44
3255-000 Motor Vehicle Wheel and Brake Operations D 425 3.44
Section 5 - ©WSIB Ontario 30

2011 PREMIUM RATES2011
Classification Rate Premium
Unit Description Class Group Rate
($)
3257-000 Motor Vehicle Fabric Accessory Operations D 428 4.38
3241-000 Truck and Bus Body Operations D 432 4.21
3242-000 Commercial Trailer Operations D 432 4.21
3261-000 Railroad Rolling Stock Operations D 442 2.63
3311-001 Small Electrical Appliance Operations D 460 2.54
3311-002 Vacuum Cleaners and Systems D 460 2.54
3331-000 Lighting Fixtures D 460 2.54
3332-000 Lamps and Shades D 460 2.54
3333-000 Electric Lamps (Bulbs and Tubes) D 460 2.54
3252-002 Wiring Harnesses D 466 2.34
3341-000 Compact Disc Players, Radios, and Television Receivers D 466 2.34
3381-000 Communication and Energy Wire and Cable Products D 466 2.34
3351-000 Telecommunication Equipment D 468 0.39
3352-001 Electronic Parts and Components D 468 0.39
3352-002 Precision Miniature Metal Products D 468 0.39
3359-000 Other Communication and Electronic Equipment D 468 0.39
3361-000 Electronic Computing and Peripheral Equipment D 468 0.39
3362-000 Electronic Office, Store, and Business Machines D 468 0.39
3369-000 Other Office, Store, and Business Machines D 468 0.39
3994-001 Musical Instruments D 468 0.39
3994-002 Magnetic and Optical Media D 468 0.39
3372-000 Electrical Switchgear and Protective Equipment D 477 1.49
3379-000 Industrial Electrical Equipment Operations D 477 1.49
3392-000 Non-Current-Carrying Wiring Devices D 477 1.49
3399-000 Other Electrical Products D 477 1.49
3511-000 Bricks, Tiles, and Clay Products D 485 4.34
3512-000 Ceramic, Porcelain, and China Operations D 485 4.34
Section 5 - ©WSIB Ontario 31

2011 PREMIUM RATES2011
Classification Rate Premium
Unit Description Class Group Rate
($)
3571-000 Abrasives Operations D 485 4.34
3591-000 Refractories D 485 4.34
3541-000 Concrete Pipe D 496 5.19
3542-000 Structural Concrete Products D 496 5.19
3549-000 Other Concrete Products D 496 5.19
3551-000 Ready-Mix Concrete Operations D 497 3.76
3521-000 Hydraulic Cement D 501 2.87
3581-000 Lime Operations D 501 2.87
3592-000 Asbestos Products D 501 2.87
3593-000 Gypsum Products D 501 2.87
3594-000 Non-Metallic Mineral Insulating Material Operations D 501 2.87
3599-000 Other Non-Metallic Mineral Products D 501 2.87
3561-000 Primary Glass and Glass Container Operations D 502 2.92
3562-000 Other Glass Products D 502 2.92
2721-000 Asphalt Roofing D 507 1.13
3611-000 Refined Petroleum Products D 507 1.13
3612-000 Lubricating Oil and Grease D 507 1.13
3699-000 Other Petroleum and Coal Products D 507 1.13
3731-000 Plastic and Synthetic Resin Operations D 512 1.68
3751-000 Paint and Varnish D 512 1.68
3791-000 Printing Ink D 512 1.68
3792-000 Adhesives D 512 1.68
3741-000 Pharmaceutical and Medicine Operations D 514 0.92
3761-000 Soap and Cleaning Compound Operations D 517 1.61
3771-000 Toiletry Operations D 517 1.61
Section 5 - ©WSIB Ontario 32

2011 PREMIUM RATES2011
Classification Rate Premium
Unit Description Class Group Rate
($)
3711-001 Industrial Inorganic Chemicals D 524 1.88
3711-002 Compressed Gas D 524 1.88
3712-000 Industrial Organic Chemicals D 524 1.88
3721-000 Chemical Fertilizer and Fertilizer Materials D 524 1.88
3722-000 Mixed Fertilizers D 524 1.88
3729-000 Other Agricultural Chemicals D 524 1.88
3799-001 Other Chemical Products D 524 1.88
3799-002 Explosives D 524 1.88
3911-000 Indicating, Recording, and Controlling Instruments D 529 0.98
3912-000 Other Instruments D 529 0.98
3913-000 Clocks and Watches D 529 0.98
3914-000 Ophthalmic Goods D 529 0.98
3921-001 Jewelry and Silverware Operations D 529 0.98
3921-002 Arts and Crafts D 529 0.98
3922-000 Precious Metal Secondary Refining D 529 0.98
3999-002 Dental Laboratories D 529 0.98
3999-003 Other Medical Products D 529 0.98
3999-004 Art Supplies D 529 0.98
9999-003 Artists D 529 0.98
3971-000 Sign and Display Operations D 533 3.06
3931-000 Sporting Goods Operations D 538 4.10
3932-000 Toys and Games D 538 4.10
3991-000 Brooms, Brushes, and Mops D 538 4.10
3999-001 Other Manufacturing Operations D 542 2.04
Section 5 - ©WSIB Ontario 33

2011 PREMIUM RATES2011
Classification Rate Premium
Unit Description Class Group Rate
($)
4511-000 Scheduled Air Transport E 551 2.00
4512-000 Non-Scheduled Chartered Air Transport E 551 2.00
4513-000 Non-Scheduled Specialty Air Transport E 551 2.00
4521-001 Airport Operations E 553 1.85
4521-002 Private Airfields E 553 1.85
4522-000 Aircraft Rental and Leasing E 553 1.85
4523-000 Aircraft Servicing and Maintenance E 553 1.85
4529-000 Other Services Incidental to Air Transport E 553 1.85
4551-001 Marine Cargo Handling E 560 3.28
4592-002 Freight Forwarders (Warehousing) E 560 3.28
4791-000 Refrigerated Warehousing E 560 3.28
4799-000 Other Storage and Warehousing Operations E 560 3.28
4561-000 General Freight Trucking E 570 6.43
4562-000 Used Goods Moving E 570 6.43
4563-000 Bulk Liquids Trucking E 570 6.43
4564-000 Dry Bulk Materials Trucking E 570 6.43
4565-000 Forest Products Trucking E 570 6.43
4569-000 Other Truck Transport Operations E 570 6.43
4591-001 Highway, Street, and Bridge Maintenance E 570 6.43
4599-001 Other Services Incidental to Transportation E 570 6.43
4599-002 Supply of Drivers and Helpers E 570 6.43
4999-001 Waste Management Services E 570 6.43
4999-003 Radioactive Waste Recovery and Disposal E 570 6.43
4999-004 Chemical Waste Recovery and Disposal E 570 6.43
5919-003 Other Liquid Waste Recovery and Disposal E 570 6.43
6399-002 Towing Services E 570 6.43
4841-001 Rural Mail Delivery E 577 2.89
4841-002 Postal Services E 577 2.89
4842-000 Courier Service Operations E 577 2.89
Section 5 - ©WSIB Ontario 34

2011 PREMIUM RATES2011
Classification Rate Premium
Unit Description Class Group Rate
($)
4531-000 Railway Transport E 580 4.89
4532-000 Services Incidental to Railway Transport E 580 4.89
4541-000 Freight and Passenger Water Transport E 580 4.89
4542-000 Ferry Operations E 580 4.89
4543-001 Marine Towing E 580 4.89
4543-002 Towing Logs (Marine) E 580 4.89
4544-000 Ship Chartering E 580 4.89
4549-000 Other Water Transport Operations E 580 4.89
4552-000 Harbour and Port Operations E 580 4.89
4553-000 Marine Salvage E 580 4.89
4554-000 Piloting Services (water transport) E 580 4.89
4559-001 Other Services Incidental to Water Transport E 580 4.89
4559-002 Cleaning of Ships' Holds and Tanks E 580 4.89
4571-001 Urban Transit Systems E 580 4.89
4571-002 Bus Services E 580 4.89
4572-000 Interurban and Rural Transit Systems E 580 4.89
4574-099 Charter, Tour, and Sightseeing Bus Services E 580 4.89
4575-000 Limousine Services E 580 4.89
4581-001 Taxicabs E 580 4.89
4582-000 Non-Emergency Patient Transfer Services E 580 4.89
4589-000 Other Transportation Operations E 580 4.89
4573-000 School Bus Operations E 584 2.91
8631-000 Ambulance Operations E 590 6.18
Section 5 - ©WSIB Ontario 35

2011 PREMIUM RATES2011
Classification Rate Premium
Unit Description Class Group Rate
($)
5211-099 Wholesale Foods F 604 2.43
5221-000 Non-Alcoholic Beverages, Wholesale F 604 2.43
5222-000 Alcoholic Beverages, Wholesale F 604 2.43
6011-000 Supermarkets F 604 2.43
6011-100 Bulk Retail/Wholesale Stores F 604 2.43
6016-000 Meat Stores F 604 2.43
6012-001 Grocery Stores F 606 2.11
6012-002 Convenience and Variety Stores F 606 2.11
6021-001 Liquor Stores F 606 2.11
6021-002 Duty Free Shops F 606 2.11
6022-000 Wine Stores F 606 2.11
6013-000 Bakery Product Stores F 607 3.57
6015-000 Fruit and Vegetable Stores F 607 3.57
6019-000 Other Specialty Food Stores F 607 3.57
6023-000 Beer Store Operations F 608 3.99
4711-001 Terminal Grain Elevator Services F 612 2.37
4711-002 Country Grain Elevator Services F 612 2.37
5011-000 Livestock Dealers F 612 2.37
5012-000 Grain Dealers F 612 2.37
5019-000 Farm Products, Wholesale F 612 2.37
5214-000 Poultry and Eggs, Wholesale F 612 2.37
5931-000 Agricultural Feed, Wholesale F 612 2.37
5932-000 Seeds, Wholesale F 612 2.37
5939-000 Agricultural Chemicals and Other Farm Supplies F 612 2.37
5911-000 Automotive Salvaging F 630 3.39
6331-002 Lubricating Services F 630 3.39
6351-000 Garages (General Repairs) F 630 3.39
6352-000 Paint and Body Repair Shops F 630 3.39
6353-000 Muffler Replacement Shops F 630 3.39
6354-000 Motor Vehicle Glass Replacement Shops F 630 3.39
Section 5 - ©WSIB Ontario 36

2011 PREMIUM RATES2011
Classification Rate Premium
Unit Description Class Group Rate
($)
6355-000 Motor Vehicle Transmission Repair and Replacement Shops F 630 3.39
6359-000 Other Motor Vehicle Repair Shops F 630 3.39
6391-000 Car Washes F 630 3.39
6399-001 Other Motor Vehicle Services F 630 3.39
5111-000 Other Petroleum Products, Sales F 633 2.49
6331-001 Gas Bars F 633 2.49
5241-000 Tobacco Products, Wholesale F 636 1.40
5311-099 Apparel, Wholesale F 636 1.40
5321-099 Dry Goods, Wholesale F 636 1.40
5411-099 Household Furniture and Appliances, Wholesale F 636 1.40
5431-099 Household Furnishings, Wholesale F 636 1.40
5521-001 Tires and Tubes, Wholesale F 636 1.40
5529-000 Other Motor Vehicle Parts and Accessories, Wholesale F 636 1.40
5621-000 Hardware, Wholesale F 636 1.40
5622-000 Plumbing, Heating, and Air Conditioning Equipment, Sales F 636 1.40
5632-000 Paint, Glass, and Wallpaper, Wholesale F 636 1.40
5731-002 Welding Equipment and Supplies F 636 1.40
5793-000 Professional Machinery, Equipment, and Supplies, Wholesale F 636 1.40
5799-000 Other Machinery, Equipment, and Supplies, Wholesale F 636 1.40
5921-099 Paper and Paper Products, Wholesale F 636 1.40
5941-099 Toys, Amusements, and Sporting Goods, Wholesale F 636 1.40
5951-000 Photographic Equipment and Supplies, Wholesale F 636 1.40
5952-000 Musical Instruments and Accessories, Wholesale F 636 1.40
5961-000 Jewelry and Watches, Wholesale F 636 1.40
5971-000 Industrial and Household Compounds, Wholesale F 636 1.40
5981-000 General Merchandise, Wholesale F 636 1.40
5991-000 Books, Periodicals, and Newspapers, Wholesale F 636 1.40
5992-000 Second-Hand Goods, Wholesale F 636 1.40
5999-000 Other Wholesale Product Operations F 636 1.40
6211-099 Household Furniture, Appliances, Television, and Stereo Stores F 636 1.40
6223-000 Appliance, Television, Radio, and Stereo Repair F 636 1.40
6231-000 Floor Covering Stores F 636 1.40
6232-000 Drapery Stores F 636 1.40
Section 5 - ©WSIB Ontario 37

2011 PREMIUM RATES2011
Classification Rate Premium
Unit Description Class Group Rate
($)
6341-000 Home and Auto Supply Stores F 636 1.40
6342-000 Tire, Battery, Parts, and Accessories Stores F 636 1.40
6411-000 Department Stores F 636 1.40
6412-099 Other General Merchandise Stores F 636 1.40
6511-000 Book and Stationery Stores F 636 1.40
6521-000 Florist Shops F 636 1.40
6522-000 Lawn and Garden Centres F 636 1.40
6531-000 Hardware Stores F 636 1.40
6532-000 Paint, Glass, and Wallpaper Stores F 636 1.40
6541-099 Sporting Goods and Bicycle Shops F 636 1.40
6551-000 Musical Instrument Stores F 636 1.40
6552-000 Audio and Video Products, Sales F 636 1.40
6561-099 Jewelry and Watch Stores F 636 1.40
6571-000 Camera and Photographic Supply Stores F 636 1.40
6581-000 Toy and Hobby Stores F 636 1.40
6582-000 Gift, Novelty, and Souvenir Stores F 636 1.40
6591-000 Second-Hand Merchandise Stores F 636 1.40
6593-000 Art Galleries and Artists' Supply Stores F 636 1.40
6594-000 Luggage and Leather Goods Stores F 636 1.40
6595-000 Monument and Tombstone Dealers F 636 1.40
6596-000 Pet Stores F 636 1.40
6597-000 Coin and Stamp Dealers F 636 1.40
6599-000 Other Retail Stores F 636 1.40
6911-000 Vending Machine Operators F 636 1.40
6921-000 Mail Order Houses F 636 1.40
5231-099 Drugs and Toiletries, Wholesale F 638 0.68
6031-001 Pharmacy Operations F 638 0.68
6031-002 Large Drugstores F 638 0.68
6032-000 Patent Medicine and Toiletry Stores F 638 0.68
6592-000 Opticians' Shops F 638 0.68
6111-000 Shoe Stores F 641 1.53
6121-000 Men's Clothing Stores F 641 1.53
6131-000 Women's Clothing Stores F 641 1.53
Section 5 - ©WSIB Ontario 38

2011 PREMIUM RATES2011
Classification Rate Premium
Unit Description Class Group Rate
($)
6141-000 Children's Clothing Stores F 641 1.53
6142-000 Fur Stores F 641 1.53
6149-000 Other Clothing Stores F 641 1.53
6151-000 Fabric and Yarn Stores F 641 1.53
6239-000 Other Household Furnishing Stores F 641 1.53
5511-000 Automobile Importers F 657 0.78
5512-000 Other Motor Vehicle Importers F 657 0.78
6311-000 Automobiles and Trucks (New), Sales F 657 0.78
6312-000 Automobiles and Trucks (used), Sales F 657 0.78
9921-000 Automobile and Truck Rental and Leasing F 657 0.78
5741-099 Electrical and Electronic Equipment, Sales Operations F 668 0.48
5744-000 Computer and Related Equipment, Sales F 668 0.48
5791-000 Office and Store Equipment, Sales F 668 0.48
5519-000 Other Motor Vehicles and Trailers, Wholesale F 670 1.76
5711-000 Farm Machinery and Equipment, Sales Operations F 670 1.76
5721-000 Construction and Forestry Machinery and Supplies, Sales F 670 1.76
5722-000 Mining Machinery and Supplies, Sales F 670 1.76
5731-001 Industrial Machinery and Supplies, Sales F 670 1.76
5792-000 Service Machinery and Supplies, Sales F 670 1.76
6321-000 Motor Home and Travel Trailer Dealers F 670 1.76
6322-099 Marine Equipment, Sales and Rentals F 670 1.76
6323-099 Other Recreational Vehicle Dealers F 670 1.76
6598-000 Mobile Home Dealers F 670 1.76
9911-000 Industrial Machinery and Equipment Rental and Leasing F 670 1.76
5631-001 Lumber, Plywood, and Millwork, Sales F 681 2.88
5631-002 Self-Serve Retail Building Supplies F 681 2.88
5639-000 Other Building Materials, Sales F 681 2.88
5993-000 Forest Products, Wholesale F 681 2.88
5611-000 Metal Products, Wholesale F 685 3.11
5919-001 Other Waste Materials Recycling F 689 5.90
5919-002 Metal Waste Materials Recycling F 689 5.90
Section 5 - ©WSIB Ontario 39

2011 PREMIUM RATES2011
Classification Rate Premium
Unit Description Class Group Rate
($)
4261-000 Electrical Work G 704 3.53
4499-001 Other Services Incidental to Construction G 704 3.53
7799-012 Office Furniture Installation G 704 3.53
4241-002 Drain Contractors G 707 3.98
4241-099 Plumbing, Heating, and Air Conditioning, Installation G 707 3.98
4244-000 Sheet Metal and Other Duct Work G 707 3.98
4256-000 Thermal Insulation Work G 707 3.98
4259-000 Industrial Maintenance and Repair Contracting G 707 3.98
4113-002 Gas Distribution Lines G 711 5.06
4121-001 Highways, Streets, and Small Bridges G 711 5.06
4129-002 Park Grounds and Recreational Open Space G 711 5.06
4213-000 Septic System Installation G 711 5.06
4214-000 Excavating and Grading G 711 5.06
4215-000 Equipment Rental (With Operator) G 711 5.06
4216-000 Asphalt Paving G 711 5.06
4217-000 Fencing and Deck Installation G 711 5.06
4293-000 Swimming Pool Installation G 711 5.06
4234-001 Insulation Work G 719 7.19
4271-099 Plaster, Drywall, and Acoustical Work G 719 7.19
4275-001 Painting and Decorating G 719 7.19
4276-000 Terrazzo and Tile Work G 719 7.19
4277-099 Carpeting and Flooring G 719 7.19
7799-002 Interior Designing Services G 719 7.19
4012-000 Apartment and Condominium Construction G 723 4.35
4021-099 Industrial, Commercial, and Institutional Construction G 723 4.35
4111-099 Heavy Engineering Construction G 723 4.35
4211-002 Non-Structural Interior Demolition G 723 4.35
4234-003 Asbestos Abatement G 723 4.35
4411-000 Construction Project Management G 723 4.35
4235-000 Roof Shingling G 728 14.16
4236-000 Sheet Metal and Built-Up Roofing G 728 14.16
Section 5 - ©WSIB Ontario 40

2011 PREMIUM RATES2011
Classification Rate Premium
Unit Description Class Group Rate
($)
4113-001 Gas and Oil Pipelines, Construction G 732 6.73
4121-002 Large Bridge Construction G 732 6.73
4122-000 Waterworks and Sewage Systems G 732 6.73
4129-001 Other Heavy Construction G 732 6.73
4221-000 Piledriving Work G 732 6.73
4255-000 Millwright and Rigging Work G 737 6.60
4292-000 Ornamental and Fabricated Metal Installation G 737 6.60
4299-000 Other Trade Work G 737 6.60
9942-000 Custom Welding Services G 737 6.60
4231-000 Masonry Operations G 741 12.15
4211-001 Wrecking and Structural Demolition G 748 17.51
4222-001 Form Work (High-Rise) G 748 17.51
4225-000 Precast Concrete Installation G 748 17.51
4227-000 Structural Steel Erection G 748 17.51
4229-000 Other Structural Work G 748 17.51
4275-002 Painting of Structures G 748 17.51
9952-001 Above Ground Window Cleaning G 748 17.51
9959-001 Other Services to Buildings and Dwellings G 748 17.51
4223-000 Steel Reinforcing G 751 9.80
4224-001 Concrete Finishing G 751 9.80
4224-002 Concrete Cutting and Drilling G 751 9.80
4224-003 Concrete Sealing G 751 9.80
4232-000 Siding Work G 751 9.80
4233-000 Glass and Glazing Work G 751 9.80
4239-000 Caulking and Weatherstripping G 751 9.80
4011-099 Homebuilding Operations G 764 8.71
4222-002 Form Work (Low-Rise) G 764 8.71
4226-000 Rough and Framing Carpentry G 764 8.71
4274-000 Finish Carpentry G 764 8.71
4491-000 Land Developers G 764 8.71
4499-002 House Raising/Moving G 764 8.71
7712-002 Supply of Labour, Construction G 764 8.71
Section 5 - ©WSIB Ontario 41

2011 PREMIUM RATES2011
Classification Rate Premium
Unit Description Class Group Rate
($)
8511-001 Elementary and Secondary School Boards H 810 0.78
8511-002 Private Schools H 810 0.78
8521-000 Post-Secondary Non-University Education Operations H 817 0.36
8531-000 University Education H 817 0.36
8541-000 Library Services H 817 0.36
8551-000 Museums and Archives H 817 0.36
8599-001 Other Educational Services H 817 0.36
8599-002 Driving Schools H 817 0.36
4124-001 Power and Telecommunication Transmission Lines H 830 4.25
4124-002 Cable Television Contractors H 830 4.25
4911-002 Cleaning of Electrical Power Systems Equipment H 830 4.25
4911-003 Generation of Electric Power H 833 0.76
4612-000 Crude Oil Pipeline Transport H 835 1.03
4619-000 Other Pipeline Transport Operations H 835 1.03
4911-001 Electric Power Transmission and Distribution H 835 1.03
4931-000 Water Systems H 835 1.03
4999-002 Operation of Steam Plants H 835 1.03
4611-000 Natural Gas Pipeline Transport H 838 0.67
4921-000 Gas Distribution Systems H 838 0.67
7799-013 Other Services Incidental to Government H 845 2.15
8321-099 General Municipal/Regional Operations H 845 2.15
8324-000 Firefighting Services H 845 2.15
8351-000 Band Councils H 845 2.15
8372-001 Regional Conservation Authorities H 845 2.15
8411-000 Other Government Agencies H 845 2.15
8621-001 Long Term Care Home Operations H 851 3.15
8621-002 Residential Home Operations H 852 3.16
Section 5 - ©WSIB Ontario 42

2011 PREMIUM RATES2011
Classification Rate Premium
Unit Description Class Group Rate
($)
8611-000 General Hospitals H 853 1.06
8612-000 Rehabilitation Hospitals H 853 1.06
8613-000 Extended Care Hospitals H 853 1.06
8614-000 Psychiatric Hospitals H 853 1.06
8615-000 Addiction Hospitals H 853 1.06
8616-000 Outpost Hospitals H 853 1.06
8617-000 Paediatric Hospitals H 853 1.06
8619-000 Other Specialty Hospitals H 853 1.06
8634-000 Nursing and Other Health Care Operations H 857 3.17
8662-099 Offices of Nurses H 857 3.17
8622-000 Homes for Persons with a Physical Disability H 858 3.01
8623-000 Homes for Persons with a Developmental Disability H 858 3.01
8624-000 Homes for Persons with a Mental Health Disability H 858 3.01
8625-000 Homes for Emotionally Distressed Children H 858 3.01
8626-000 Homes for Alcohol or Drug Dependent Persons H 858 3.01
8627-000 Homes for Children In Need of Protection H 858 3.01
8628-000 Homes for Single Mothers H 858 3.01
8629-000 Other Institutional Health and Social Services H 858 3.01
8632-000 Drug Addiction and Alcoholism Treatment Clinics H 861 1.06
8633-000 Health Rehabilitation Clinics H 861 1.06
8635-000 Public Health Clinics and Community Health Centres H 861 1.06
8639-000 Other Non-Institutional Health Services H 861 1.06
8641-000 Child Daycare and Nursery School Services H 861 1.06
8644-000 Life Skills Training Facilities H 861 1.06
8647-000 Social Rehabilitation Services H 861 1.06
8648-000 Crisis Intervention H 861 1.06
8649-000 Other Non-Institutional Social Services H 861 1.06
8642-000 Child Welfare Services H 875 0.71
8643-000 Family Planning Services H 875 0.71
8646-000 Meal Services (Non-Commercial) H 875 0.71
Section 5 - ©WSIB Ontario 43

2011 PREMIUM RATES2011
Classification Rate Premium
Unit Description Class Group Rate
($)
8651-099 Offices of Physicians H 875 0.71
8653-099 Offices of Dentists H 875 0.71
8661-000 Offices of Chiropractors and Osteopaths H 875 0.71
8664-000 Offices of Nutritionists and Dietitians H 875 0.71
8665-000 Offices of Physiotherapists and Occupational Therapists H 875 0.71
8666-000 Offices of Optometrists H 875 0.71
8667-000 Offices of Podiatrists and Chiropodists H 875 0.71
8668-000 Offices of Denturists H 875 0.71
8669-000 Offices of Other Health Practitioners H 875 0.71
8671-000 Offices of Psychologists H 875 0.71
8672-000 Offices of Social Workers H 875 0.71
8679-000 Offices of Other Social Service Practitioners H 875 0.71
8681-000 Medical Laboratories H 875 0.71
8682-000 Diagnostic Laboratories H 875 0.71
8683-000 Combined Medical and Radiological Laboratories H 875 0.71
8684-000 Public Health Laboratories H 875 0.71
8685-000 Blood Bank Laboratories H 875 0.71
8689-000 Other Health Laboratories H 875 0.71
8691-000 Health Care and Public Safety Promotion Associations and Agencies H 875 0.71
8692-000 Health Care Standards Agencies H 875 0.71
8693-000 Health Care Research Agencies H 875 0.71
8694-000 Social Service Planning and Advocacy Agencies H 875 0.71
8699-000 Other Health and Safety Service Associations and Agencies H 875 0.71
Section 5 - ©WSIB Ontario 44

2011 PREMIUM RATES2011
Classification Rate Premium
Unit Description Class Group Rate
($)
7511-001 Operators of Apartment Buildings I 905 2.91
7511-002 Operators of Condominiums I 905 2.91
7512-001 Operators of Non-Residential Buildings I 908 1.25
7512-002 Self-Serve Storage Facilities I 908 1.25
7512-003 Operators of Recreational Buildings I 908 1.25
7599-001 Other Real Estate Operators I 908 1.25
9732-000 Cemeteries and Crematoria I 908 1.25
9991-000 Parking Lot Operations I 908 1.25
7791-001 Security Services I 911 1.67
7791-003 Detective Agencies I 911 1.67
7791-004 Armoured Car Services I 911 1.67
9211-000 Restaurants, Licensed I 919 1.65
9212-000 Restaurants, Unlicensed I 919 1.65
9213-000 Take-Out Food Services I 919 1.65
9214-001 Caterers I 919 1.65
9214-002 Supply of Labour, Restaurant/Catering I 919 1.65
9221-000 Taverns, Bars, and Nightclubs I 919 1.65
7599-002 Mobile Home Parks I 921 2.97
9111-000 Hotels and Motor Hotels I 921 2.97
9112-000 Motels I 921 2.97
9113-000 Tourist Courts and Cabins I 921 2.97
9114-000 Guest Houses and Tourist Homes I 921 2.97
9121-000 Lodging Houses and Residential Clubs I 921 2.97
9131-000 Camping Grounds and Travel Trailer Parks I 921 2.97
9141-000 Outfitters I 921 2.97
9149-001 Other Recreation and Vacation Camps I 921 2.97
9149-002 Children's Educational Camps I 921 2.97
9726-000 Carpet Cleaning I 923 3.57
9952-002 Ground Level Window Cleaning I 923 3.57
9953-001 Janitorial Operations I 923 3.57
Section 5 - ©WSIB Ontario 45

2011 PREMIUM RATES2011
Classification Rate Premium
Unit Description Class Group Rate
($)
9953-002 Other Cleaning Services I 923 3.57
9959-005 Window Tinting of Buildings I 923 3.57
9959-006 Pool Services I 923 3.57
7712-001 Supply of Non-Clerical Labour Operations I 929 4.83
7799-004 Custom Packaging I 933 2.95
9912-000 Audio-Visual Equipment Rental and Leasing I 933 2.95
9913-000 Office Furniture and Equipment Rental and Leasing I 933 2.95
9919-000 Other Machinery and Equipment Rental and Leasing I 933 2.95
9941-000 Electric Motor Repair I 933 2.95
9949-000 Other Repair Services I 933 2.95
9643-000 Horse Race Tracks I 937 2.10
9644-000 Other Race Tracks I 937 2.10
9651-000 Golf Courses I 937 2.10
9652-000 Curling Clubs I 937 2.10
9653-000 Skiing Facilities I 937 2.10
9659-001 Other Sports and Recreational Clubs I 937 2.10
9661-001 Gambling Operations I 937 2.10
9661-002 Lotteries and Casinos I 937 2.10
9691-000 Bowling Alleys and Billiard Parlours I 937 2.10
9692-000 Amusement Parks I 937 2.10
9693-000 Dance Halls, Studios and Schools I 937 2.10
9694-000 Coin-Operated Amusement Services I 937 2.10
9695-000 Roller Skating Facilities I 937 2.10
9696-000 Botanical and Zoological Gardens I 937 2.10
9699-001 Other Amusement and Recreational Services I 937 2.10
9699-002 Horse Trainers and Riding Operations I 937 2.10
9711-099 Barber and Beauty Shops I 944 3.12
9723-000 Self-Serve Laundries and/or Dry Cleaners I 944 3.12
9724-000 Valet Services and Cleaning Depots I 944 3.12
9731-000 Funeral Homes I 944 3.12
9741-099 Domestic Services I 944 3.12
Section 5 - ©WSIB Ontario 46

2011 PREMIUM RATES2011
Classification Rate Premium
Unit Description Class Group Rate
($)
9791-000 Shoe Repair I 944 3.12
9792-000 Fur Cleaning, Repair, and Storage I 944 3.12
9799-000 Other Personal Services I 944 3.12
9951-000 Disinfecting and Exterminating Services I 944 3.12
9999-001 Miscellaneous Services I 944 3.12
9999-002 Automobile Associations I 944 3.12
7011-000 Central Banks I 956 0.21
7021-000 Chartered Banks I 956 0.21
7029-000 Other Banking-Type Intermediaries I 956 0.21
7031-000 Trust Companies I 956 0.21
7041-000 Deposit Accepting Mortgage Companies I 956 0.21
7042-000 Co-Operative Mortgage Companies I 956 0.21
7051-099 Credit Unions I 956 0.21
7099-000 Other Deposit Accepting Intermediaries I 956 0.21
7111-000 Consumer Loan Companies I 956 0.21
7121-000 Sales Finance Companies I 956 0.21
7122-000 Credit Card Companies I 956 0.21
7123-000 Factoring Companies I 956 0.21
7124-000 Financial Leasing Companies I 956 0.21
7125-000 Venture Capital Companies I 956 0.21
7129-000 Other Business Financing Companies I 956 0.21
7211-000 Investment (Mutual) Funds I 956 0.21
7212-000 Retirement Savings Funds I 956 0.21
7213-000 Segregated Funds I 956 0.21
7214-000 Investment Companies I 956 0.21
7215-000 Holding Companies I 956 0.21
7221-000 Mortgage Investment Companies I 956 0.21
7222-000 Real Estate Investment Trusts I 956 0.21
7229-000 Other Mortgage Companies I 956 0.21
7291-000 Trusteed Pension Funds I 956 0.21
7292-000 Estate, Trust, and Agency Funds I 956 0.21
7299-000 Other Investment Intermediaries I 956 0.21
7311-000 Life Insurers I 956 0.21
7321-000 Deposit Insurers I 956 0.21
Section 5 - ©WSIB Ontario 47

2011 PREMIUM RATES2011
Classification Rate Premium
Unit Description Class Group Rate
($)
7331-000 Health Insurers I 956 0.21
7339-000 Other Property and Casualty Insurers I 956 0.21
7411-000 Investment Dealers I 956 0.21
7412-000 Stock Brokers I 956 0.21
7413-000 Commodity Brokers I 956 0.21
7421-000 Mortgage Brokers I 956 0.21
7431-000 Stock Exchanges I 956 0.21
7432-000 Commodity Exchanges I 956 0.21
7499-000 Other Financial Intermediaries I 956 0.21
7611-000 Insurance and Real Estate Agencies I 956 0.21
7711-001 Supply of Clerical Labour Operations I 956 0.21
7711-003 Placement Agencies I 956 0.21
7711-100 Out of Province Operations - Class A I 956 0.21
7711-200 Out of Province Operations - Class B I 956 0.21
7711-300 Out of Province Operations - Class C I 956 0.21
7711-400 Out of Province Operations - Class D I 956 0.21
7711-500 Out of Province Operations - Class E I 956 0.21
7711-600 Out of Province Operations - Class F I 956 0.21
7711-700 Out of Province Operations - Class G I 956 0.21
7711-800 Out of Province Operations - Class H I 956 0.21
7711-900 Out of Province Operations - Class I I 956 0.21
7731-000 Chartered and Certified Accountants I 956 0.21
7739-000 Other Accounting and Bookkeeping Services I 956 0.21
7761-000 Offices of Lawyers and Notaries I 956 0.21
7792-000 Credit Bureau Services I 956 0.21
7793-000 Collection Agencies I 956 0.21
7799-003 Actuarial Services I 956 0.21
0231-000 Agricultural Management and Consulting Services I 958 0.38
4555-000 Marine Shipping Agencies I 958 0.38
4592-003 Freight Brokers/Forwarders (Ground Freight) I 958 0.38
4592-004 Freight Forwarders (Air and / or Ocean) I 958 0.38
7721-001 Software Development and Computer Services I 958 0.38
7722-000 Computer Equipment Maintenance and Repair I 958 0.38
7751-000 Offices of Architects I 958 0.38
Section 5 - ©WSIB Ontario 48

2011 PREMIUM RATES2011
Classification Rate Premium
Unit Description Class Group Rate
($)
7752-000 Offices of Engineers I 958 0.38
7759-001 Other Scientific and Technical Services I 958 0.38
7759-002 Research and Development I 958 0.38
7771-001 Management Consulting Services I 958 0.38
7771-002 Property Management Services I 958 0.38
7794-000 Customs Brokers and Consultants I 958 0.38
7795-999 Telephone Answering Services / Call Centres I 958 0.38
7796-001 Business Service Centres I 958 0.38
7796-002 Microfilming and Micrographing Services I 958 0.38
7799-001 Miscellaneous Business Services I 958 0.38
7799-005 Translation Services I 958 0.38
7799-006 Custom Typing Services I 958 0.38
7799-007 Manufacturer's Agents I 958 0.38
7799-009 Meter Reading I 958 0.38
7799-010 Other Brokers I 958 0.38
7799-011 Quality Assurance I 958 0.38
9931-000 Photographers I 958 0.38
9961-000 Ticket and Travel Agencies I 958 0.38
9962-001 Tour Packagers I 958 0.38
2821-002 Photographic Film Processing I 962 1.05
7711-002 Franchise Operations I 962 1.05
7741-000 Advertising Agencies I 962 1.05
7742-000 Media Representatives I 962 1.05
7743-000 Display and Billboard Advertising I 962 1.05
7749-000 Other Advertising Services I 962 1.05
9611-000 Motion Picture and Video Production I 962 1.05
9612-000 Motion Picture and Video Distribution I 962 1.05
9613-000 Motion Picture Laboratories and Video Production Facilities I 962 1.05
9614-000 Sound Recording Services I 962 1.05
9619-000 Other Motion Picture, Audio, and Video Services I 962 1.05
9621-000 Regular Motion Picture Theatres I 962 1.05
9622-000 Outdoor Motion Picture Theatres I 962 1.05
9629-000 Other Motion Picture Exhibition I 962 1.05
9631-000 Entertainment Production Companies and Artists I 962 1.05
9639-000 Other Theatrical and Staged Entertainment Services I 962 1.05
Section 5 - ©WSIB Ontario 49

2011 PREMIUM RATES2011
Classification Rate Premium
Unit Description Class Group Rate
($)
9721-000 Power Laundries and/or Dry Cleaners I 975 3.94
9725-000 Linen Supply Services I 975 3.94
9729-000 Other Laundry and Dry Cleaning Services I 975 3.94
7791-002 Corps of Commissionaires I 981 0.77
9811-000 Religious Organizations I 981 0.77
9821-000 Business Associations I 981 0.77
9831-000 Health and Social Service Professional Membership Associations I 981 0.77
9839-000 Other Professional Membership Associations I 981 0.77
9841-000 Labour Organizations I 981 0.77
9851-000 Political Organizations I 981 0.77
9861-001 Civic and Fraternal Organizations I 981 0.77
9861-002 Cultural Organizations I 981 0.77
4811-000 Radio Broadcasting I 983 0.37
4812-000 Television Broadcasting I 983 0.37
4813-000 Combined Radio and Television Broadcasting I 983 0.37
4814-000 Cable Television I 983 0.37
4821-000 Telecommunication Carriers I 983 0.37
4839-000 Other Telecommunication Operations I 983 0.37
Section 5 - ©WSIB Ontario 50

2011Premium Rates M
ANUAL
SECTION 6Supporting Documention for each Class

2011Premium Rates M
ANUAL
SECTION 6AClass A – Forest Products

2011 PREMIUM RATES
6-YEAR HISTORICAL SUMMARY AND 2-YEAR PROJECTION
RATE GROUP 030: LOGGING
(CLASS A: FOREST PRODUCTS)
Year
Insurable
Earnings
Maximum
Insurable
Earnings
Ceiling
Average
Insurable
Earnings Employment
Total
Number of
Injuries
Total Injury
Rate
2004 $248,662,907 $66,800 $46,263 5,375 516 9.60%
2005 $255,770,394 $67,700 $47,718 5,360 482 8.99%
2006 $218,629,514 $69,400 $49,621 4,406 381 8.65%
2007 $186,500,473 $71,800 $48,797 3,822 335 8.77%
2008 $160,677,465 $73,300 $48,295 3,327 239 7.18%
2009 $118,520,064 $74,600 $47,484 2,496 174 6.97%
2010 $111,718,472 $77,600 $45,285 2,467 163 6.61%
2011 $110,745,328 $79,600 $44,982 2,462 154 6.26%
Section 6A - ©WSIB Ontario 51

2011 PREMIUM RATES
6-YEAR HISTORICAL SUMMARY AND 2-YEAR PROJECTION
RATE GROUP 033: MILL PRODUCTS AND FORESTRY SERVICES
(CLASS A: FOREST PRODUCTS)
Year
Insurable
Earnings
Maximum
Insurable
Earnings
Ceiling
Average
Insurable
Earnings Employment
Total
Number of
Injuries
Total Injury
Rate
2004 $343,009,920 $66,800 $35,170 9,753 1,842 18.89%
2005 $354,763,151 $67,700 $38,616 9,187 1,733 18.86%
2006 $326,312,396 $69,400 $41,154 7,929 1,403 17.69%
2007 $280,201,184 $71,800 $39,599 7,076 1,157 16.35%
2008 $194,397,390 $73,300 $35,702 5,445 729 13.39%
2009 $142,102,400 $74,600 $35,200 4,037 390 9.66%
2010 $133,947,473 $77,600 $33,571 3,990 358 8.97%
2011 $132,780,699 $79,600 $33,345 3,982 331 8.31%
Section 6A - ©WSIB Ontario 52

2011 PREMIUM RATES
6-YEAR HISTORICAL SUMMARY AND 2-YEAR PROJECTION
RATE GROUP 036: VENEERS, PLYWOOD AND WOOD PRESERVATION
(CLASS A: FOREST PRODUCTS)
Year
Insurable
Earnings
Maximum
Insurable
Earnings
Ceiling
Average
Insurable
Earnings Employment
Total
Number of
Injuries
Total Injury
Rate
2004 $198,193,475 $66,800 $37,353 5,306 541 10.20%
2005 $203,715,031 $67,700 $40,015 5,091 579 11.37%
2006 $190,087,703 $69,400 $41,082 4,627 471 10.18%
2007 $162,239,898 $71,800 $41,868 3,875 361 9.32%
2008 $127,001,600 $73,300 $39,688 3,200 269 8.41%
2009 $104,203,260 $74,600 $42,882 2,430 195 8.02%
2010 $98,223,276 $77,600 $40,892 2,402 183 7.62%
2011 $97,367,684 $79,600 $40,621 2,397 173 7.22%
Section 6A - ©WSIB Ontario 53

2011 PREMIUM RATES
6-YEAR HISTORICAL SUMMARY AND 2-YEAR PROJECTION
RATE GROUP 039: PULP, NEWSPRINT AND SPECIALTY PAPERS
(CLASS A: FOREST PRODUCTS)
Year
Insurable
Earnings
Maximum
Insurable
Earnings
Ceiling
Average
Insurable
Earnings Employment
Total
Number of
Injuries
Total Injury
Rate
2004 $865,103,611 $66,800 $50,526 17,122 1,248 7.29%
2005 $836,258,615 $67,700 $51,276 16,309 1,207 7.40%
2006 $735,235,337 $69,400 $50,500 14,559 943 6.48%
2007 $665,976,877 $71,800 $51,666 12,890 843 6.54%
2008 $642,316,758 $73,300 $53,674 11,967 655 5.47%
2009 $533,322,198 $74,600 $53,822 9,909 543 5.48%
2010 $528,771,231 $77,600 $55,473 9,532 495 5.19%
2011 $522,984,982 $79,600 $56,877 9,195 452 4.92%
Section 6A - ©WSIB Ontario 54

2011 PREMIUM RATES
6-YEAR HISTORICAL SUMMARY AND 2-YEAR PROJECTION
RATE GROUP 041: CORRUGATED BOXES
(CLASS A: FOREST PRODUCTS)
Year
Insurable
Earnings
Maximum
Insurable
Earnings
Ceiling
Average
Insurable
Earnings Employment
Total
Number of
Injuries
Total Injury
Rate
2004 $301,340,059 $66,800 $33,009 9,129 694 7.60%
2005 $304,221,082 $67,700 $34,756 8,753 548 6.26%
2006 $300,394,696 $69,400 $36,210 8,296 594 7.16%
2007 $292,063,757 $71,800 $37,187 7,854 507 6.46%
2008 $288,331,662 $73,300 $37,094 7,773 460 5.92%
2009 $250,378,506 $74,600 $38,502 6,503 335 5.15%
2010 $248,241,966 $77,600 $39,687 6,255 312 4.99%
2011 $245,525,499 $79,600 $40,690 6,034 291 4.82%
Section 6A - ©WSIB Ontario 55

2011 PREMIUM RATES
6-YEAR HISTORICAL SUMMARY AND 2-YEAR PROJECTION
CLASS A: FOREST PRODUCTS
Year
Insurable
Earnings
Maximum
Insurable
Earnings
Ceiling
Average
Insurable
Earnings Employment
Total
Number of
Injuries
Total Injury
Rate
2004 $1,956,309,972 $66,800 $41,904 46,685 4,841 10.37%
2005 $1,954,728,273 $67,700 $43,730 44,700 4,549 10.18%
2006 $1,770,659,646 $69,400 $44,470 39,817 3,792 9.52%
2007 $1,586,982,189 $71,800 $44,682 35,517 3,203 9.02%
2008 $1,412,724,875 $73,300 $44,549 31,712 2,352 7.42%
2009 $1,148,526,428 $74,600 $45,262 25,375 1,637 6.45%
2010 $1,120,902,418 $77,600 $45,480 24,646 1,511 6.13%
2011 $1,109,404,192 $79,600 $46,091 24,070 1,401 5.82%
Section 6A - ©WSIB Ontario 56

2011 PREMIUM RATESNEW CLAIMS COST BY RATE GROUP
2011 New Claims Cost 2011
Rate
Group Description Cost Index *
(%)
Cost per Claim
($)
Premium
Rate
($)
030 LOGGING 217% 35,094 12.47
033 MILL PRODUCTS AND FORESTRY SERVICES 81% 13,066 8.42
036 VENEERS, PLYWOOD AND WOOD PRESERVATION 68% 10,983 5.14
039 PULP, NEWSPRINT AND SPECIALTY PAPERS 73% 11,722 2.80
041 CORRUGATED BOXES 59% 9,537 3.10
CLASS A FOREST PRODUCTS 14,064 4.71
* The Cost Index compares the average cost of a claim for a Rate Group to that of the Class.Section 6A - ©WSIB Ontario 57

2011 PREMIUM RATES
SUB-COMPONENTS OF OVERHEAD EXPENSES
RATE GROUP 030: LOGGING
(CLASS A: FOREST PRODUCTS)
Overhead Expenses
Component
Overhead Expenses
Sub-Component
Premium Rate
Component
B.1 WSIB Administrative 0.862
B.2 Legislative Obligations
WSIAT 0.045
Office of Worker Advisor 0.022
Office of Employer Advisor 0.007
OHSA 0.213
Mine Rescue 0.000
Construction Certification Training 0.000
Program Administration 0.001
Institute of Work & Health 0.009
Sub-Total 0.296
B.3 Prevention Workplace Safety North 0.324
B.4 TOTAL OVERHEAD EXPENSES 1.482
Section 6A - ©WSIB Ontario 58

2011 PREMIUM RATES
SUB-COMPONENTS OF OVERHEAD EXPENSES
RATE GROUP 033: MILL PRODUCTS AND FORESTRY SERVICES
(CLASS A: FOREST PRODUCTS)
Overhead Expenses
Component
Overhead Expenses
Sub-Component
Premium Rate
Component
B.1 WSIB Administrative 0.624
B.2 Legislative Obligations
WSIAT 0.032
Office of Worker Advisor 0.016
Office of Employer Advisor 0.005
OHSA 0.154
Mine Rescue 0.000
Construction Certification Training 0.000
Program Administration 0.001
Institute of Work & Health 0.006
Sub-Total 0.214
B.3 Prevention Workplace Safety North 0.240
B.4 TOTAL OVERHEAD EXPENSES 1.078
Section 6A - ©WSIB Ontario 59

2011 PREMIUM RATES
SUB-COMPONENTS OF OVERHEAD EXPENSES
RATE GROUP 036: VENEERS, PLYWOOD AND WOOD PRESERVATION
(CLASS A: FOREST PRODUCTS)
Overhead Expenses
Component
Overhead Expenses
Sub-Component
Premium Rate
Component
B.1 WSIB Administrative 0.432
B.2 Legislative Obligations
WSIAT 0.022
Office of Worker Advisor 0.011
Office of Employer Advisor 0.004
OHSA 0.106
Mine Rescue 0.000
Construction Certification Training 0.000
Program Administration 0.001
Institute of Work & Health 0.004
Sub-Total 0.148
B.3 Prevention Workplace Safety North 0.172
B.4 TOTAL OVERHEAD EXPENSES 0.752
Section 6A - ©WSIB Ontario 60

2011 PREMIUM RATES
SUB-COMPONENTS OF OVERHEAD EXPENSES
RATE GROUP 039: PULP, NEWSPRINT AND SPECIALTY PAPERS
(CLASS A: FOREST PRODUCTS)
Overhead Expenses
Component
Overhead Expenses
Sub-Component
Premium Rate
Component
B.1 WSIB Administrative 0.294
B.2 Legislative Obligations
WSIAT 0.015
Office of Worker Advisor 0.007
Office of Employer Advisor 0.002
OHSA 0.072
Mine Rescue 0.000
Construction Certification Training 0.000
Program Administration 0.000
Institute of Work & Health 0.003
Sub-Total 0.100
B.3 Prevention Workplace Safety North 0.123
B.4 TOTAL OVERHEAD EXPENSES 0.517
Section 6A - ©WSIB Ontario 61

2011 PREMIUM RATES
SUB-COMPONENTS OF OVERHEAD EXPENSES
RATE GROUP 041: CORRUGATED BOXES
(CLASS A: FOREST PRODUCTS)
Overhead Expenses
Component
Overhead Expenses
Sub-Component
Premium Rate
Component
B.1 WSIB Administrative 0.312
B.2 Legislative Obligations
WSIAT 0.016
Office of Worker Advisor 0.008
Office of Employer Advisor 0.003
OHSA 0.076
Mine Rescue 0.000
Construction Certification Training 0.000
Program Administration 0.000
Institute of Work & Health 0.003
Sub-Total 0.106
B.3 Prevention Workplace Safety North 0.129
B.4 TOTAL OVERHEAD EXPENSES 0.547
Section 6A - ©WSIB Ontario 62

2011 PREMIUM RATES
SUB-COMPONENTS OF OVERHEAD EXPENSES
CLASS A: FOREST PRODUCTS
Overhead Expenses
Component
Overhead Expenses
Sub-Component
Premium Rate
Component
B.1 WSIB Administrative 0.406
B.2 Legislative Obligations
WSIAT 0.021
Office of Worker Advisor 0.010
Office of Employer Advisor 0.003
OHSA 0.100
Mine Rescue 0.000
Construction Certification Training 0.000
Program Administration 0.001
Institute of Work & Health 0.004
Sub-Total 0.139
B.3 Prevention 0.163
B.4 TOTAL OVERHEAD EXPENSES 0.708
Section 6A - ©WSIB Ontario 63

2011 PREMIUM RATE COMPONENTS
RATE GROUP 030: LOGGING
(CLASS A: FOREST PRODUCTS)
Component
2011 Premium Rate
Per $100 Of
Insurable Earnings
Percentage
of 2011
Premium Rate
2010 Premium Rate
Per $100 Of
Insurable Earnings
Percentage
of 2010
Premium Rate
A. NEW CLAIMS COST
1. New Claims Cost 4.953 4.953 40% 5.030 5.030 44%
B. OVERHEAD EXPENSES
1. WSIB Administrative 0.862 0.771
2. Legislative Obligations 0.296 0.270
3. Prevention 0.324 0.756
4. TOTAL OVERHEAD EXPENSES 1.482 1.482 12% 1.797 1.797 16%
C. PAST CLAIMS COST
1. Unfunded Liability 3.721 2.731
2. (Gain)/Loss 2.040 1.872
3. Bad Debts 0.274 N/A
4. TOTAL PAST CLAIMS COST 6.035 6.035 48% 4.603 4.603 40%
D. TOTAL PREMIUM RATE (A+B+C) 12.47 100% 11.43 100%
Section 6A - ©WSIB Ontario 64

2011 PREMIUM RATE COMPONENTS
RATE GROUP 033: MILL PRODUCTS AND FORESTRY SERVICES
(CLASS A: FOREST PRODUCTS)
Component
2011 Premium Rate
Per $100 Of
Insurable Earnings
Percentage
of 2011
Premium Rate
2010 Premium Rate
Per $100 Of
Insurable Earnings
Percentage
of 2010
Premium Rate
A. NEW CLAIMS COST
1. New Claims Cost 3.306 3.306 39% 3.346 3.346 43%
B. OVERHEAD EXPENSES
1. WSIB Administrative 0.624 0.561
2. Legislative Obligations 0.214 0.196
3. Prevention 0.240 0.607
4. TOTAL OVERHEAD EXPENSES 1.078 1.078 13% 1.364 1.364 18%
C. PAST CLAIMS COST
1. Unfunded Liability 2.486 1.817
2. (Gain)/Loss 1.363 1.245
3. Bad Debts 0.186 N/A
4. TOTAL PAST CLAIMS COST 4.035 4.035 48% 3.062 3.062 39%
D. TOTAL PREMIUM RATE (A+B+C) 8.42 100% 7.77 100%
Section 6A - ©WSIB Ontario 65

2011 PREMIUM RATE COMPONENTS
RATE GROUP 036: VENEERS, PLYWOOD AND WOOD PRESERVATION
(CLASS A: FOREST PRODUCTS)
Component
2011 Premium Rate
Per $100 Of
Insurable Earnings
Percentage
of 2011
Premium Rate
2010 Premium Rate
Per $100 Of
Insurable Earnings
Percentage
of 2010
Premium Rate
A. NEW CLAIMS COST
1. New Claims Cost 1.981 1.981 39% 1.829 1.829 41%
B. OVERHEAD EXPENSES
1. WSIB Administrative 0.432 0.372
2. Legislative Obligations 0.148 0.129
3. Prevention 0.172 0.473
4. TOTAL OVERHEAD EXPENSES 0.752 0.752 15% 0.974 0.974 22%
C. PAST CLAIMS COST
1. Unfunded Liability 1.486 0.993
2. (Gain)/Loss 0.815 0.681
3. Bad Debts 0.107 N/A
4. TOTAL PAST CLAIMS COST 2.408 2.408 47% 1.674 1.674 37%
D. TOTAL PREMIUM RATE (A+B+C) 5.14 100% 4.48 100%
Section 6A - ©WSIB Ontario 66

2011 PREMIUM RATE COMPONENTS
RATE GROUP 039: PULP, NEWSPRINT AND SPECIALTY PAPERS
(CLASS A: FOREST PRODUCTS)
Component
2011 Premium Rate
Per $100 Of
Insurable Earnings
Percentage
of 2011
Premium Rate
2010 Premium Rate
Per $100 Of
Insurable Earnings
Percentage
of 2010
Premium Rate
A. NEW CLAIMS COST
1. New Claims Cost 1.028 1.028 37% 1.007 1.007 41%
B. OVERHEAD EXPENSES
1. WSIB Administrative 0.294 0.269
2. Legislative Obligations 0.100 0.093
3. Prevention 0.123 0.175
4. TOTAL OVERHEAD EXPENSES 0.517 0.517 18% 0.537 0.537 22%
C. PAST CLAIMS COST
1. Unfunded Liability 0.772 0.547
2. (Gain)/Loss 0.423 0.375
3. Bad Debts 0.056 N/A
4. TOTAL PAST CLAIMS COST 1.251 1.251 45% 0.922 0.922 37%
D. TOTAL PREMIUM RATE (A+B+C) 2.80 100% 2.47 100%
Section 6A - ©WSIB Ontario 67

2011 PREMIUM RATE COMPONENTS
RATE GROUP 041: CORRUGATED BOXES
(CLASS A: FOREST PRODUCTS)
Component
2011 Premium Rate
Per $100 Of
Insurable Earnings
Percentage
of 2011
Premium Rate
2010 Premium Rate
Per $100 Of
Insurable Earnings
Percentage
of 2010
Premium Rate
A. NEW CLAIMS COST
1. New Claims Cost 1.147 1.147 37% 1.203 1.203 42%
B. OVERHEAD EXPENSES
1. WSIB Administrative 0.312 0.294
2. Legislative Obligations 0.106 0.102
3. Prevention 0.129 0.191
4. TOTAL OVERHEAD EXPENSES 0.547 0.547 18% 0.587 0.587 20%
C. PAST CLAIMS COST
1. Unfunded Liability 0.864 0.653
2. (Gain)/Loss 0.473 0.448
3. Bad Debts 0.066 N/A
4. TOTAL PAST CLAIMS COST 1.403 1.403 45% 1.101 1.101 38%
D. TOTAL PREMIUM RATE (A+B+C) 3.10 100% 2.89 100%
Section 6A - ©WSIB Ontario 68

2011 PREMIUM RATE COMPONENTS
CLASS A: FOREST PRODUCTS
Component
2011 Premium Rate
Per $100 Of
Insurable Earnings
Percentage
of 2011
Premium Rate
2010 Premium Rate
Per $100 Of
Insurable Earnings
Percentage
of 2010
Premium Rate
A. NEW CLAIMS COST
1. New Claims Cost 1.803 1.803 38% 1.859 1.859 42%
B. OVERHEAD EXPENSES
1. WSIB Administrative 0.406 0.375
2. Legislative Obligations 0.139 0.131
3. Prevention 0.163 0.322
4. TOTAL OVERHEAD EXPENSES 0.708 0.708 15% 0.828 0.828 19%
C. PAST CLAIMS COST
1. Unfunded Liability 1.354 1.010
2. (Gain)/Loss 0.743 0.692
3. Bad Debts 0.100 N/A
4. TOTAL PAST CLAIMS COST 2.197 2.197 47% 1.702 1.702 39%
D. TOTAL PREMIUM RATE (A+B+C) 4.71 100% 4.39 100%
Section 6A - ©WSIB Ontario 69

2011 PREMIUM RATES
Summary of Premium Rate Components by Rate Group
per $100 of Insurable Earnings
New Past 2011
Rate
Group Description
Claims
Cost
($)
Overhead
($)
Claims
Cost
($)
Premium
Rate
($)
030 LOGGING 4.953 1.482 6.035 12.47
033 MILL PRODUCTS AND FORESTRY SERVICES 3.306 1.078 4.035 8.42
036 VENEERS, PLYWOOD AND WOOD PRESERVATION 1.981 0.752 2.408 5.14
039 PULP, NEWSPRINT AND SPECIALTY PAPERS 1.028 0.517 1.251 2.80
041 CORRUGATED BOXES 1.147 0.547 1.403 3.10
CLASS A FOREST PRODUCTS 1.803 0.708 2.197 4.71
Section 6A - ©WSIB Ontario 70

2011Premium Rates M
ANUAL
SECTION 6BClass B – Mining and Related Industries

2011 PREMIUM RATES
6-YEAR HISTORICAL SUMMARY AND 2-YEAR PROJECTION
RATE GROUP 110: GOLD MINES
(CLASS B: MINING AND RELATED INDUSTRIES)
Year
Insurable
Earnings
Maximum
Insurable
Earnings
Ceiling
Average
Insurable
Earnings Employment
Total
Number of
Injuries
Total Injury
Rate
2004 $308,795,285 $66,800 $58,077 5,317 437 8.22%
2005 $313,381,157 $67,700 $59,151 5,298 416 7.85%
2006 $312,839,338 $69,400 $60,722 5,152 328 6.37%
2007 $350,462,221 $71,800 $64,340 5,447 389 7.14%
2008 $354,726,666 $73,300 $63,378 5,597 365 6.52%
2009 $385,433,746 $74,600 $67,219 5,734 382 6.66%
2010 $388,307,599 $77,600 $67,054 5,791 362 6.25%
2011 $395,094,029 $79,600 $67,618 5,843 343 5.87%
Section 6B - ©WSIB Ontario 71

2011 PREMIUM RATES
6-YEAR HISTORICAL SUMMARY AND 2-YEAR PROJECTION
RATE GROUP 113: NICKEL MINES
(CLASS B: MINING AND RELATED INDUSTRIES)
Year
Insurable
Earnings
Maximum
Insurable
Earnings
Ceiling
Average
Insurable
Earnings Employment
Total
Number of
Injuries
Total Injury
Rate
2004 $367,537,636 $66,800 $60,610 6,064 560 9.23%
2005 $392,959,909 $67,700 $62,723 6,265 541 8.64%
2006 $445,892,654 $69,400 $66,432 6,712 556 8.28%
2007 $582,999,598 $71,800 $66,416 8,778 606 6.90%
2008 $673,256,192 $73,300 $67,004 10,048 690 6.87%
2009 $454,227,947 $74,600 $67,303 6,749 350 5.19%
2010 $457,614,740 $77,600 $67,138 6,816 325 4.77%
2011 $465,612,447 $79,600 $67,706 6,877 300 4.36%
Section 6B - ©WSIB Ontario 72

2011 PREMIUM RATES
6-YEAR HISTORICAL SUMMARY AND 2-YEAR PROJECTION
RATE GROUP 119: OTHER MINES
(CLASS B: MINING AND RELATED INDUSTRIES)
Year
Insurable
Earnings
Maximum
Insurable
Earnings
Ceiling
Average
Insurable
Earnings Employment
Total
Number of
Injuries
Total Injury
Rate
2004 $236,398,249 $66,800 $52,162 4,532 338 7.46%
2005 $257,259,434 $67,700 $55,756 4,614 348 7.54%
2006 $285,266,528 $69,400 $58,988 4,836 337 6.97%
2007 $303,646,826 $71,800 $57,411 5,289 351 6.64%
2008 $359,837,760 $73,300 $60,640 5,934 368 6.20%
2009 $313,569,894 $74,600 $58,047 5,402 280 5.18%
2010 $315,907,919 $77,600 $57,912 5,455 271 4.97%
2011 $321,429,024 $79,600 $58,399 5,504 262 4.76%
Section 6B - ©WSIB Ontario 73

2011 PREMIUM RATES
6-YEAR HISTORICAL SUMMARY AND 2-YEAR PROJECTION
RATE GROUP 134: AGGREGATES
(CLASS B: MINING AND RELATED INDUSTRIES)
Year
Insurable
Earnings
Maximum
Insurable
Earnings
Ceiling
Average
Insurable
Earnings Employment
Total
Number of
Injuries
Total Injury
Rate
2004 $244,810,205 $66,800 $37,985 6,445 536 8.32%
2005 $255,446,463 $67,700 $41,148 6,208 537 8.65%
2006 $266,951,664 $69,400 $43,105 6,193 449 7.25%
2007 $281,304,861 $71,800 $44,175 6,368 522 8.20%
2008 $291,635,250 $73,300 $45,075 6,470 507 7.84%
2009 $276,682,267 $74,600 $47,143 5,869 469 7.99%
2010 $278,745,252 $77,600 $47,030 5,927 463 7.81%
2011 $283,616,867 $79,600 $47,428 5,980 457 7.64%
Section 6B - ©WSIB Ontario 74

2011 PREMIUM RATES
6-YEAR HISTORICAL SUMMARY AND 2-YEAR PROJECTION
CLASS B: MINING AND RELATED INDUSTRIES
Year
Insurable
Earnings
Maximum
Insurable
Earnings
Ceiling
Average
Insurable
Earnings Employment
Total
Number of
Injuries
Total Injury
Rate
2004 $1,157,541,375 $66,800 $51,773 22,358 1,871 8.37%
2005 $1,219,046,963 $67,700 $54,458 22,385 1,842 8.23%
2006 $1,310,950,184 $69,400 $57,264 22,893 1,670 7.29%
2007 $1,518,413,506 $71,800 $58,667 25,882 1,868 7.22%
2008 $1,679,455,868 $73,300 $59,876 28,049 1,930 6.88%
2009 $1,429,913,854 $74,600 $60,197 23,754 1,481 6.23%
2010 $1,440,575,510 $77,600 $60,052 23,989 1,421 5.92%
2011 $1,465,752,367 $79,600 $60,558 24,204 1,362 5.63%
Section 6B - ©WSIB Ontario 75

2011 PREMIUM RATESNEW CLAIMS COST BY RATE GROUP
2011 New Claims Cost 2011
Rate
Group Description Cost Index *
(%)
Cost per Claim
($)
Premium
Rate
($)
110 GOLD MINES 143% 35,401 7.79
113 NICKEL MINES 119% 29,440 4.98
119 OTHER MINES 123% 30,540 6.40
134 AGGREGATES 65% 16,163 6.24
CLASS B MINING AND RELATED INDUSTRIES 26,698 6.29
* The Cost Index compares the average cost of a claim for a Rate Group to that of the Class.Section 6B - ©WSIB Ontario 76

2011 PREMIUM RATES
SUB-COMPONENTS OF OVERHEAD EXPENSES
RATE GROUP 110: GOLD MINES
(CLASS B: MINING AND RELATED INDUSTRIES)
Overhead Expenses
Component
Overhead Expenses
Sub-Component
Premium Rate
Component
B.1 WSIB Administrative 0.575
B.2 Legislative Obligations
WSIAT 0.030
Office of Worker Advisor 0.014
Office of Employer Advisor 0.005
OHSA 0.141
Mine Rescue 0.380
Construction Certification Training 0.000
Program Administration 0.001
Institute of Work & Health 0.006
Sub-Total 0.577
B.3 Prevention Workplace Safety North 0.222
B.4 TOTAL OVERHEAD EXPENSES 1.374
Section 6B - ©WSIB Ontario 77

2011 PREMIUM RATES
SUB-COMPONENTS OF OVERHEAD EXPENSES
RATE GROUP 113: NICKEL MINES
(CLASS B: MINING AND RELATED INDUSTRIES)
Overhead Expenses
Component
Overhead Expenses
Sub-Component
Premium Rate
Component
B.1 WSIB Administrative 0.410
B.2 Legislative Obligations
WSIAT 0.021
Office of Worker Advisor 0.010
Office of Employer Advisor 0.003
OHSA 0.101
Mine Rescue 0.299
Construction Certification Training 0.000
Program Administration 0.001
Institute of Work & Health 0.004
Sub-Total 0.439
B.3 Prevention Workplace Safety North 0.164
B.4 TOTAL OVERHEAD EXPENSES 1.013
Section 6B - ©WSIB Ontario 78

2011 PREMIUM RATES
SUB-COMPONENTS OF OVERHEAD EXPENSES
RATE GROUP 119: OTHER MINES
(CLASS B: MINING AND RELATED INDUSTRIES)
Overhead Expenses
Component
Overhead Expenses
Sub-Component
Premium Rate
Component
B.1 WSIB Administrative 0.493
B.2 Legislative Obligations
WSIAT 0.025
Office of Worker Advisor 0.012
Office of Employer Advisor 0.004
OHSA 0.121
Mine Rescue 0.340
Construction Certification Training 0.000
Program Administration 0.001
Institute of Work & Health 0.005
Sub-Total 0.509
B.3 Prevention Workplace Safety North 0.194
B.4 TOTAL OVERHEAD EXPENSES 1.196
Section 6B - ©WSIB Ontario 79

2011 PREMIUM RATES
SUB-COMPONENTS OF OVERHEAD EXPENSES
RATE GROUP 134: AGGREGATES
(CLASS B: MINING AND RELATED INDUSTRIES)
Overhead Expenses
Component
Overhead Expenses
Sub-Component
Premium Rate
Component
B.1 WSIB Administrative 0.509
B.2 Legislative Obligations
WSIAT 0.026
Office of Worker Advisor 0.013
Office of Employer Advisor 0.004
OHSA 0.125
Mine Rescue 0.000
Construction Certification Training 0.000
Program Administration 0.001
Institute of Work & Health 0.005
Sub-Total 0.174
B.3 Prevention Infrastructure Health and
Safety Association
0.118
B.4 TOTAL OVERHEAD EXPENSES 0.801
Section 6B - ©WSIB Ontario 80

2011 PREMIUM RATES
SUB-COMPONENTS OF OVERHEAD EXPENSES
CLASS B: MINING AND RELATED INDUSTRIES
Overhead Expenses
Component
Overhead Expenses
Sub-Component
Premium Rate
Component
B.1 WSIB Administrative 0.492
B.2 Legislative Obligations
WSIAT 0.025
Office of Worker Advisor 0.012
Office of Employer Advisor 0.004
OHSA 0.121
Mine Rescue 0.272
Construction Certification Training 0.000
Program Administration 0.001
Institute of Work & Health 0.005
Sub-Total 0.440
B.3 Prevention 0.177
B.4 TOTAL OVERHEAD EXPENSES 1.109
Section 6B - ©WSIB Ontario 81

2011 PREMIUM RATE COMPONENTS
RATE GROUP 110: GOLD MINES
(CLASS B: MINING AND RELATED INDUSTRIES)
Component
2011 Premium Rate
Per $100 Of
Insurable Earnings
Percentage
of 2011
Premium Rate
2010 Premium Rate
Per $100 Of
Insurable Earnings
Percentage
of 2010
Premium Rate
A. NEW CLAIMS COST
1. New Claims Cost 3.119 3.119 40% 3.482 3.482 45%
B. OVERHEAD EXPENSES
1. WSIB Administrative 0.575 0.578
2. Legislative Obligations 0.577 0.491
3. Prevention 0.222 0.203
4. TOTAL OVERHEAD EXPENSES 1.374 1.374 18% 1.272 1.272 16%
C. PAST CLAIMS COST
1. Unfunded Liability 2.229 1.891
2. (Gain)/Loss 1.058 1.142
3. Bad Debts 0.012 N/A
4. TOTAL PAST CLAIMS COST 3.299 3.299 42% 3.033 3.033 39%
D. TOTAL PREMIUM RATE (A+B+C) 7.79 100% 7.79 100%
Section 6B - ©WSIB Ontario 82

2011 PREMIUM RATE COMPONENTS
RATE GROUP 113: NICKEL MINES
(CLASS B: MINING AND RELATED INDUSTRIES)
Component
2011 Premium Rate
Per $100 Of
Insurable Earnings
Percentage
of 2011
Premium Rate
2010 Premium Rate
Per $100 Of
Insurable Earnings
Percentage
of 2010
Premium Rate
A. NEW CLAIMS COST
1. New Claims Cost 1.925 1.925 39% 2.158 2.158 43%
B. OVERHEAD EXPENSES
1. WSIB Administrative 0.410 0.413
2. Legislative Obligations 0.439 0.371
3. Prevention 0.164 0.159
4. TOTAL OVERHEAD EXPENSES 1.013 1.013 20% 0.943 0.943 19%
C. PAST CLAIMS COST
1. Unfunded Liability 1.376 1.172
2. (Gain)/Loss 0.653 0.707
3. Bad Debts 0.008 N/A
4. TOTAL PAST CLAIMS COST 2.037 2.037 41% 1.879 1.879 38%
D. TOTAL PREMIUM RATE (A+B+C) 4.98 100% 4.98 100%
Section 6B - ©WSIB Ontario 83

2011 PREMIUM RATE COMPONENTS
RATE GROUP 119: OTHER MINES
(CLASS B: MINING AND RELATED INDUSTRIES)
Component
2011 Premium Rate
Per $100 Of
Insurable Earnings
Percentage
of 2011
Premium Rate
2010 Premium Rate
Per $100 Of
Insurable Earnings
Percentage
of 2010
Premium Rate
A. NEW CLAIMS COST
1. New Claims Cost 2.527 2.527 39% 2.830 2.830 44%
B. OVERHEAD EXPENSES
1. WSIB Administrative 0.493 0.496
2. Legislative Obligations 0.509 0.432
3. Prevention 0.194 0.181
4. TOTAL OVERHEAD EXPENSES 1.196 1.196 19% 1.109 1.109 17%
C. PAST CLAIMS COST
1. Unfunded Liability 1.805 1.537
2. (Gain)/Loss 0.857 0.928
3. Bad Debts 0.010 N/A
4. TOTAL PAST CLAIMS COST 2.672 2.672 42% 2.465 2.465 39%
D. TOTAL PREMIUM RATE (A+B+C) 6.40 100% 6.40 100%
Section 6B - ©WSIB Ontario 84

2011 PREMIUM RATE COMPONENTS
RATE GROUP 134: AGGREGATES
(CLASS B: MINING AND RELATED INDUSTRIES)
Component
2011 Premium Rate
Per $100 Of
Insurable Earnings
Percentage
of 2011
Premium Rate
2010 Premium Rate
Per $100 Of
Insurable Earnings
Percentage
of 2010
Premium Rate
A. NEW CLAIMS COST
1. New Claims Cost 2.643 2.643 42% 2.748 2.748 46%
B. OVERHEAD EXPENSES
1. WSIB Administrative 0.509 0.486
2. Legislative Obligations 0.174 0.170
3. Prevention 0.118 0.179
4. TOTAL OVERHEAD EXPENSES 0.801 0.801 13% 0.835 0.835 14%
C. PAST CLAIMS COST
1. Unfunded Liability 1.888 1.492
2. (Gain)/Loss 0.897 0.901
3. Bad Debts 0.009 N/A
4. TOTAL PAST CLAIMS COST 2.794 2.794 45% 2.393 2.393 40%
D. TOTAL PREMIUM RATE (A+B+C) 6.24 100% 5.98 100%
Section 6B - ©WSIB Ontario 85

2011 PREMIUM RATE COMPONENTS
CLASS B: MINING AND RELATED INDUSTRIES
Component
2011 Premium Rate
Per $100 Of
Insurable Earnings
Percentage
of 2011
Premium Rate
2010 Premium Rate
Per $100 Of
Insurable Earnings
Percentage
of 2010
Premium Rate
A. NEW CLAIMS COST
1. New Claims Cost 2.518 2.518 40% 2.689 2.689 44%
B. OVERHEAD EXPENSES
1. WSIB Administrative 0.492 0.479
2. Legislative Obligations 0.440 0.375
3. Prevention 0.177 0.177
4. TOTAL OVERHEAD EXPENSES 1.109 1.109 18% 1.031 1.031 17%
C. PAST CLAIMS COST
1. Unfunded Liability 1.799 1.460
2. (Gain)/Loss 0.854 0.881
3. Bad Debts 0.009 N/A
4. TOTAL PAST CLAIMS COST 2.662 2.662 42% 2.341 2.341 39%
D. TOTAL PREMIUM RATE (A+B+C) 6.29 100% 6.06 100%
Section 6B - ©WSIB Ontario 86

2011 PREMIUM RATES
Summary of Premium Rate Components by Rate Group
per $100 of Insurable Earnings
New Past 2011
Rate
Group Description
Claims
Cost
($)
Overhead
($)
Claims
Cost
($)
Premium
Rate
($)
110 GOLD MINES 3.119 1.374 3.299 7.79
113 NICKEL MINES 1.925 1.013 2.037 4.98
119 OTHER MINES 2.527 1.196 2.672 6.40
134 AGGREGATES 2.643 0.801 2.794 6.24
CLASS B MINING AND RELATED INDUSTRIES 2.518 1.109 2.662 6.29
Section 6B - ©WSIB Ontario 87

2011Premium Rates M
ANUAL
SECTION 6CClass C – Other Primary Industries

2011 PREMIUM RATES
6-YEAR HISTORICAL SUMMARY AND 2-YEAR PROJECTION
RATE GROUP 159: LIVESTOCK FARMS
(CLASS C: OTHER PRIMARY INDUSTRIES)
Year
Insurable
Earnings
Maximum
Insurable
Earnings
Ceiling
Average
Insurable
Earnings Employment
Total
Number of
Injuries
Total Injury
Rate
2004 $133,443,019 $66,800 $29,098 4,586 397 8.66%
2005 $135,410,320 $67,700 $28,388 4,770 369 7.74%
2006 $139,568,861 $69,400 $27,880 5,006 293 5.85%
2007 $141,184,917 $71,800 $29,861 4,728 272 5.75%
2008 $141,538,326 $73,300 $30,458 4,647 288 6.20%
2009 $148,218,300 $74,600 $33,300 4,451 264 5.93%
2010 $151,854,709 $77,600 $33,836 4,488 245 5.46%
2011 $155,047,278 $79,600 $34,310 4,519 228 5.05%
Section 6C - ©WSIB Ontario 88

2011 PREMIUM RATES
6-YEAR HISTORICAL SUMMARY AND 2-YEAR PROJECTION
RATE GROUP 167: FIELD CROP, FRUIT AND VEGETABLE FARMS
(CLASS C: OTHER PRIMARY INDUSTRIES)
Year
Insurable
Earnings
Maximum
Insurable
Earnings
Ceiling
Average
Insurable
Earnings Employment
Total
Number of
Injuries
Total Injury
Rate
2004 $278,995,089 $66,800 $25,975 10,741 647 6.02%
2005 $292,983,560 $67,700 $26,796 10,934 666 6.09%
2006 $319,956,566 $69,400 $27,880 11,476 613 5.34%
2007 $336,329,917 $71,800 $30,118 11,167 569 5.10%
2008 $350,987,565 $73,300 $28,895 12,147 576 4.74%
2009 $389,707,375 $74,600 $29,137 13,375 560 4.19%
2010 $399,268,511 $77,600 $29,604 13,487 532 3.94%
2011 $407,662,668 $79,600 $30,017 13,581 504 3.71%
Section 6C - ©WSIB Ontario 89

2011 PREMIUM RATES
6-YEAR HISTORICAL SUMMARY AND 2-YEAR PROJECTION
RATE GROUP 174: TOBACCO AND MUSHROOM FARMS
(CLASS C: OTHER PRIMARY INDUSTRIES)
Year
Insurable
Earnings
Maximum
Insurable
Earnings
Ceiling
Average
Insurable
Earnings Employment
Total
Number of
Injuries
Total Injury
Rate
2004 $112,138,960 $66,800 $26,460 4,238 442 10.43%
2005 $113,581,248 $67,700 $27,893 4,072 439 10.78%
2006 $102,293,019 $69,400 $29,003 3,527 335 9.50%
2007 $94,822,871 $71,800 $29,123 3,256 314 9.64%
2008 $95,517,916 $73,300 $29,354 3,254 305 9.37%
2009 $92,728,251 $74,600 $28,611 3,241 266 8.21%
2010 $95,003,259 $77,600 $29,071 3,268 258 7.89%
2011 $97,000,592 $79,600 $29,475 3,291 250 7.60%
Section 6C - ©WSIB Ontario 90

2011 PREMIUM RATES
6-YEAR HISTORICAL SUMMARY AND 2-YEAR PROJECTION
RATE GROUP 181: FISHING AND MISCELLANEOUS FARMING
(CLASS C: OTHER PRIMARY INDUSTRIES)
Year
Insurable
Earnings
Maximum
Insurable
Earnings
Ceiling
Average
Insurable
Earnings Employment
Total
Number of
Injuries
Total Injury
Rate
2004 $248,902,649 $66,800 $26,943 9,238 774 8.38%
2005 $247,997,793 $67,700 $26,854 9,235 727 7.87%
2006 $247,655,918 $69,400 $28,216 8,777 639 7.28%
2007 $247,130,279 $71,800 $29,174 8,471 537 6.34%
2008 $241,965,792 $73,300 $28,188 8,584 517 6.02%
2009 $242,498,938 $74,600 $29,678 8,171 447 5.47%
2010 $248,448,441 $77,600 $30,155 8,239 416 5.05%
2011 $253,671,781 $79,600 $30,578 8,296 385 4.64%
Section 6C - ©WSIB Ontario 91

2011 PREMIUM RATES
6-YEAR HISTORICAL SUMMARY AND 2-YEAR PROJECTION
RATE GROUP 184: POULTRY FARMS AND AGRICULTURAL SERVICES
(CLASS C: OTHER PRIMARY INDUSTRIES)
Year
Insurable
Earnings
Maximum
Insurable
Earnings
Ceiling
Average
Insurable
Earnings Employment
Total
Number of
Injuries
Total Injury
Rate
2004 $205,354,516 $66,800 $27,709 7,411 531 7.17%
2005 $215,021,470 $67,700 $31,028 6,930 566 8.17%
2006 $223,781,279 $69,400 $29,865 7,493 520 6.94%
2007 $244,161,304 $71,800 $29,936 8,156 552 6.77%
2008 $250,710,432 $73,300 $29,932 8,376 585 6.98%
2009 $264,969,306 $74,600 $30,258 8,757 681 7.78%
2010 $271,470,100 $77,600 $30,744 8,830 661 7.49%
2011 $277,177,444 $79,600 $31,175 8,891 640 7.20%
Section 6C - ©WSIB Ontario 92

2011 PREMIUM RATES
6-YEAR HISTORICAL SUMMARY AND 2-YEAR PROJECTION
RATE GROUP 190: LANDSCAPING AND RELATED SERVICES
(CLASS C: OTHER PRIMARY INDUSTRIES)
Year
Insurable
Earnings
Maximum
Insurable
Earnings
Ceiling
Average
Insurable
Earnings Employment
Total
Number of
Injuries
Total Injury
Rate
2004 $339,695,868 $66,800 $31,762 10,695 1,117 10.44%
2005 $368,356,891 $67,700 $31,430 11,720 1,110 9.47%
2006 $414,371,093 $69,400 $34,119 12,145 1,076 8.86%
2007 $441,453,085 $71,800 $34,757 12,701 1,111 8.75%
2008 $471,544,150 $73,300 $34,994 13,475 1,121 8.32%
2009 $508,955,850 $74,600 $36,150 14,079 1,041 7.39%
2010 $521,442,645 $77,600 $36,729 14,197 1,010 7.11%
2011 $532,405,371 $79,600 $37,242 14,296 979 6.85%
Section 6C - ©WSIB Ontario 93

2011 PREMIUM RATES
6-YEAR HISTORICAL SUMMARY AND 2-YEAR PROJECTION
CLASS C: OTHER PRIMARY INDUSTRIES
Year
Insurable
Earnings
Maximum
Insurable
Earnings
Ceiling
Average
Insurable
Earnings Employment
Total
Number of
Injuries
Total Injury
Rate
2004 $1,318,530,101 $66,800 $28,108 46,909 3,908 8.33%
2005 $1,373,351,282 $67,700 $28,815 47,661 3,877 8.13%
2006 $1,447,626,736 $69,400 $29,895 48,424 3,476 7.18%
2007 $1,505,082,373 $71,800 $31,046 48,479 3,355 6.92%
2008 $1,552,264,181 $73,300 $30,748 50,483 3,392 6.72%
2009 $1,647,078,020 $74,600 $31,630 52,074 3,259 6.26%
2010 $1,687,487,665 $77,600 $32,137 52,509 3,122 5.95%
2011 $1,722,965,134 $79,600 $32,586 52,874 2,986 5.65%
Section 6C - ©WSIB Ontario 94

2011 PREMIUM RATESNEW CLAIMS COST BY RATE GROUP
2011 New Claims Cost 2011
Rate
Group Description Cost Index *
(%)
Cost per Claim
($)
Premium
Rate
($)
159 LIVESTOCK FARMS 179% 21,095 6.78
167 FIELD CROP, FRUIT AND VEGETABLE FARMS 81% 9,568 2.72
174 TOBACCO AND MUSHROOM FARMS 74% 8,685 4.93
181 FISHING AND MISCELLANEOUS FARMING 87% 10,284 3.51
184 POULTRY FARMS AND AGRICULTURAL SERVICES 51% 6,005 3.13
190 LANDSCAPING AND RELATED SERVICES 99% 11,624 4.72
CLASS C OTHER PRIMARY INDUSTRIES 10,377 4.01
* The Cost Index compares the average cost of a claim for a Rate Group to that of the Class.Section 6C - ©WSIB Ontario 95

2011 PREMIUM RATES
SUB-COMPONENTS OF OVERHEAD EXPENSES
RATE GROUP 159: LIVESTOCK FARMS
(CLASS C: OTHER PRIMARY INDUSTRIES)
Overhead Expenses
Component
Overhead Expenses
Sub-Component
Premium Rate
Component
B.1 WSIB Administrative 0.597
B.2 Legislative Obligations
WSIAT 0.031
Office of Worker Advisor 0.015
Office of Employer Advisor 0.005
OHSA 0.147
Mine Rescue 0.000
Construction Certification Training 0.000
Program Administration 0.001
Institute of Work & Health 0.006
Sub-Total 0.205
B.3 Prevention Workplace Safety and
Prevention Services
0.091
B.4 TOTAL OVERHEAD EXPENSES 0.893
Section 6C - ©WSIB Ontario 96

2011 PREMIUM RATES
SUB-COMPONENTS OF OVERHEAD EXPENSES
RATE GROUP 167: FIELD CROP, FRUIT AND VEGETABLE FARMS
(CLASS C: OTHER PRIMARY INDUSTRIES)
Overhead Expenses
Component
Overhead Expenses
Sub-Component
Premium Rate
Component
B.1 WSIB Administrative 0.318
B.2 Legislative Obligations
WSIAT 0.016
Office of Worker Advisor 0.008
Office of Employer Advisor 0.003
OHSA 0.078
Mine Rescue 0.000
Construction Certification Training 0.000
Program Administration 0.000
Institute of Work & Health 0.003
Sub-Total 0.109
B.3 Prevention Workplace Safety and
Prevention Services
0.046
B.4 TOTAL OVERHEAD EXPENSES 0.473
Section 6C - ©WSIB Ontario 97

2011 PREMIUM RATES
SUB-COMPONENTS OF OVERHEAD EXPENSES
RATE GROUP 174: TOBACCO AND MUSHROOM FARMS
(CLASS C: OTHER PRIMARY INDUSTRIES)
Overhead Expenses
Component
Overhead Expenses
Sub-Component
Premium Rate
Component
B.1 WSIB Administrative 0.470
B.2 Legislative Obligations
WSIAT 0.024
Office of Worker Advisor 0.012
Office of Employer Advisor 0.004
OHSA 0.115
Mine Rescue 0.000
Construction Certification Training 0.000
Program Administration 0.001
Institute of Work & Health 0.005
Sub-Total 0.161
B.3 Prevention Workplace Safety and
Prevention Services
0.070
B.4 TOTAL OVERHEAD EXPENSES 0.701
Section 6C - ©WSIB Ontario 98

2011 PREMIUM RATES
SUB-COMPONENTS OF OVERHEAD EXPENSES
RATE GROUP 181: FISHING AND MISCELLANEOUS FARMING
(CLASS C: OTHER PRIMARY INDUSTRIES)
Overhead Expenses
Component
Overhead Expenses
Sub-Component
Premium Rate
Component
B.1 WSIB Administrative 0.372
B.2 Legislative Obligations
WSIAT 0.019
Office of Worker Advisor 0.009
Office of Employer Advisor 0.003
OHSA 0.091
Mine Rescue 0.000
Construction Certification Training 0.000
Program Administration 0.001
Institute of Work & Health 0.004
Sub-Total 0.127
B.3 Prevention Workplace Safety and
Prevention Services
0.054
B.4 TOTAL OVERHEAD EXPENSES 0.553
Section 6C - ©WSIB Ontario 99

2011 PREMIUM RATES
SUB-COMPONENTS OF OVERHEAD EXPENSES
RATE GROUP 184: POULTRY FARMS AND AGRICULTURAL SERVICES
(CLASS C: OTHER PRIMARY INDUSTRIES)
Overhead Expenses
Component
Overhead Expenses
Sub-Component
Premium Rate
Component
B.1 WSIB Administrative 0.346
B.2 Legislative Obligations
WSIAT 0.018
Office of Worker Advisor 0.009
Office of Employer Advisor 0.003
OHSA 0.085
Mine Rescue 0.000
Construction Certification Training 0.000
Program Administration 0.000
Institute of Work & Health 0.003
Sub-Total 0.118
B.3 Prevention Workplace Safety and
Prevention Services
0.050
B.4 TOTAL OVERHEAD EXPENSES 0.514
Section 6C - ©WSIB Ontario 100

2011 PREMIUM RATES
SUB-COMPONENTS OF OVERHEAD EXPENSES
RATE GROUP 190: LANDSCAPING AND RELATED SERVICES
(CLASS C: OTHER PRIMARY INDUSTRIES)
Overhead Expenses
Component
Overhead Expenses
Sub-Component
Premium Rate
Component
B.1 WSIB Administrative 0.455
B.2 Legislative Obligations
WSIAT 0.024
Office of Worker Advisor 0.011
Office of Employer Advisor 0.004
OHSA 0.112
Mine Rescue 0.000
Construction Certification Training 0.000
Program Administration 0.001
Institute of Work & Health 0.005
Sub-Total 0.156
B.3 Prevention Workplace Safety and
Prevention Services
0.068
B.4 TOTAL OVERHEAD EXPENSES 0.679
Section 6C - ©WSIB Ontario 101

2011 PREMIUM RATES
SUB-COMPONENTS OF OVERHEAD EXPENSES
CLASS C: OTHER PRIMARY INDUSTRIES
Overhead Expenses
Component
Overhead Expenses
Sub-Component
Premium Rate
Component
B.1 WSIB Administrative 0.407
B.2 Legislative Obligations
WSIAT 0.021
Office of Worker Advisor 0.010
Office of Employer Advisor 0.003
OHSA 0.100
Mine Rescue 0.000
Construction Certification Training 0.000
Program Administration 0.001
Institute of Work & Health 0.004
Sub-Total 0.139
B.3 Prevention 0.060
B.4 TOTAL OVERHEAD EXPENSES 0.606
Section 6C - ©WSIB Ontario 102

2011 PREMIUM RATE COMPONENTS
RATE GROUP 159: LIVESTOCK FARMS
(CLASS C: OTHER PRIMARY INDUSTRIES)
Component
2011 Premium Rate
Per $100 Of
Insurable Earnings
Percentage
of 2011
Premium Rate
2010 Premium Rate
Per $100 Of
Insurable Earnings
Percentage
of 2010
Premium Rate
A. NEW CLAIMS COST
1. New Claims Cost 3.149 3.149 46% 3.582 3.582 53%
B. OVERHEAD EXPENSES
1. WSIB Administrative 0.597 0.590
2. Legislative Obligations 0.205 0.206
3. Prevention 0.091 0.231
4. TOTAL OVERHEAD EXPENSES 0.893 0.893 13% 1.027 1.027 15%
C. PAST CLAIMS COST
1. Unfunded Liability 2.344 1.945
2. (Gain)/Loss 0.251 0.225
3. Bad Debts 0.144 N/A
4. TOTAL PAST CLAIMS COST 2.739 2.739 40% 2.170 2.170 32%
D. TOTAL PREMIUM RATE (A+B+C) 6.78 100% 6.78 100%
Section 6C - ©WSIB Ontario 103

2011 PREMIUM RATE COMPONENTS
RATE GROUP 167: FIELD CROP, FRUIT AND VEGETABLE FARMS
(CLASS C: OTHER PRIMARY INDUSTRIES)
Component
2011 Premium Rate
Per $100 Of
Insurable Earnings
Percentage
of 2011
Premium Rate
2010 Premium Rate
Per $100 Of
Insurable Earnings
Percentage
of 2010
Premium Rate
A. NEW CLAIMS COST
1. New Claims Cost 1.201 1.201 44% 1.349 1.349 50%
B. OVERHEAD EXPENSES
1. WSIB Administrative 0.318 0.312
2. Legislative Obligations 0.109 0.108
3. Prevention 0.046 0.137
4. TOTAL OVERHEAD EXPENSES 0.473 0.473 17% 0.557 0.557 20%
C. PAST CLAIMS COST
1. Unfunded Liability 0.896 0.733
2. (Gain)/Loss 0.096 0.085
3. Bad Debts 0.058 N/A
4. TOTAL PAST CLAIMS COST 1.050 1.050 39% 0.818 0.818 30%
D. TOTAL PREMIUM RATE (A+B+C) 2.72 100% 2.72 100%
Section 6C - ©WSIB Ontario 104

2011 PREMIUM RATE COMPONENTS
RATE GROUP 174: TOBACCO AND MUSHROOM FARMS
(CLASS C: OTHER PRIMARY INDUSTRIES)
Component
2011 Premium Rate
Per $100 Of
Insurable Earnings
Percentage
of 2011
Premium Rate
2010 Premium Rate
Per $100 Of
Insurable Earnings
Percentage
of 2010
Premium Rate
A. NEW CLAIMS COST
1. New Claims Cost 2.272 2.272 46% 2.249 2.249 52%
B. OVERHEAD EXPENSES
1. WSIB Administrative 0.470 0.424
2. Legislative Obligations 0.161 0.148
3. Prevention 0.070 0.175
4. TOTAL OVERHEAD EXPENSES 0.701 0.701 14% 0.747 0.747 17%
C. PAST CLAIMS COST
1. Unfunded Liability 1.683 1.221
2. (Gain)/Loss 0.180 0.141
3. Bad Debts 0.093 N/A
4. TOTAL PAST CLAIMS COST 1.956 1.956 40% 1.362 1.362 31%
D. TOTAL PREMIUM RATE (A+B+C) 4.93 100% 4.36 100%
Section 6C - ©WSIB Ontario 105

2011 PREMIUM RATE COMPONENTS
RATE GROUP 181: FISHING AND MISCELLANEOUS FARMING
(CLASS C: OTHER PRIMARY INDUSTRIES)
Component
2011 Premium Rate
Per $100 Of
Insurable Earnings
Percentage
of 2011
Premium Rate
2010 Premium Rate
Per $100 Of
Insurable Earnings
Percentage
of 2010
Premium Rate
A. NEW CLAIMS COST
1. New Claims Cost 1.584 1.584 45% 1.577 1.577 50%
B. OVERHEAD EXPENSES
1. WSIB Administrative 0.372 0.340
2. Legislative Obligations 0.127 0.118
3. Prevention 0.054 0.146
4. TOTAL OVERHEAD EXPENSES 0.553 0.553 16% 0.604 0.604 19%
C. PAST CLAIMS COST
1. Unfunded Liability 1.175 0.856
2. (Gain)/Loss 0.126 0.099
3. Bad Debts 0.067 N/A
4. TOTAL PAST CLAIMS COST 1.368 1.368 39% 0.955 0.955 30%
D. TOTAL PREMIUM RATE (A+B+C) 3.51 100% 3.14 100%
Section 6C - ©WSIB Ontario 106

2011 PREMIUM RATE COMPONENTS
RATE GROUP 184: POULTRY FARMS AND AGRICULTURAL SERVICES
(CLASS C: OTHER PRIMARY INDUSTRIES)
Component
2011 Premium Rate
Per $100 Of
Insurable Earnings
Percentage
of 2011
Premium Rate
2010 Premium Rate
Per $100 Of
Insurable Earnings
Percentage
of 2010
Premium Rate
A. NEW CLAIMS COST
1. New Claims Cost 1.407 1.407 45% 1.291 1.291 49%
B. OVERHEAD EXPENSES
1. WSIB Administrative 0.346 0.304
2. Legislative Obligations 0.118 0.106
3. Prevention 0.050 0.134
4. TOTAL OVERHEAD EXPENSES 0.514 0.514 16% 0.544 0.544 21%
C. PAST CLAIMS COST
1. Unfunded Liability 1.041 0.701
2. (Gain)/Loss 0.112 0.081
3. Bad Debts 0.056 N/A
4. TOTAL PAST CLAIMS COST 1.209 1.209 39% 0.782 0.782 30%
D. TOTAL PREMIUM RATE (A+B+C) 3.13 100% 2.62 100%
Section 6C - ©WSIB Ontario 107

2011 PREMIUM RATE COMPONENTS
RATE GROUP 190: LANDSCAPING AND RELATED SERVICES
(CLASS C: OTHER PRIMARY INDUSTRIES)
Component
2011 Premium Rate
Per $100 Of
Insurable Earnings
Percentage
of 2011
Premium Rate
2010 Premium Rate
Per $100 Of
Insurable Earnings
Percentage
of 2010
Premium Rate
A. NEW CLAIMS COST
1. New Claims Cost 2.170 2.170 46% 2.224 2.224 52%
B. OVERHEAD EXPENSES
1. WSIB Administrative 0.455 0.421
2. Legislative Obligations 0.156 0.147
3. Prevention 0.068 0.174
4. TOTAL OVERHEAD EXPENSES 0.679 0.679 14% 0.742 0.742 17%
C. PAST CLAIMS COST
1. Unfunded Liability 1.610 1.208
2. (Gain)/Loss 0.172 0.140
3. Bad Debts 0.092 N/A
4. TOTAL PAST CLAIMS COST 1.874 1.874 40% 1.348 1.348 31%
D. TOTAL PREMIUM RATE (A+B+C) 4.72 100% 4.31 100%
Section 6C - ©WSIB Ontario 108

2011 PREMIUM RATE COMPONENTS
CLASS C: OTHER PRIMARY INDUSTRIES
Component
2011 Premium Rate
Per $100 Of
Insurable Earnings
Percentage
of 2011
Premium Rate
2010 Premium Rate
Per $100 Of
Insurable Earnings
Percentage
of 2010
Premium Rate
A. NEW CLAIMS COST
1. New Claims Cost 1.825 1.825 46% 1.895 1.895 51%
B. OVERHEAD EXPENSES
1. WSIB Administrative 0.407 0.380
2. Legislative Obligations 0.139 0.132
3. Prevention 0.060 0.160
4. TOTAL OVERHEAD EXPENSES 0.606 0.606 15% 0.672 0.672 18%
C. PAST CLAIMS COST
1. Unfunded Liability 1.355 1.029
2. (Gain)/Loss 0.145 0.119
3. Bad Debts 0.079 N/A
4. TOTAL PAST CLAIMS COST 1.579 1.579 39% 1.148 1.148 31%
D. TOTAL PREMIUM RATE (A+B+C) 4.01 100% 3.72 100%
Section 6C - ©WSIB Ontario 109

2011 PREMIUM RATES
Summary of Premium Rate Components by Rate Group
per $100 of Insurable Earnings
New Past 2011
Rate
Group Description
Claims
Cost
($)
Overhead
($)
Claims
Cost
($)
Premium
Rate
($)
159 LIVESTOCK FARMS 3.149 0.893 2.739 6.78
167 FIELD CROP, FRUIT AND VEGETABLE FARMS 1.201 0.473 1.050 2.72
174 TOBACCO AND MUSHROOM FARMS 2.272 0.701 1.956 4.93
181 FISHING AND MISCELLANEOUS FARMING 1.584 0.553 1.368 3.51
184 POULTRY FARMS AND AGRICULTURAL SERVICES 1.407 0.514 1.209 3.13
190 LANDSCAPING AND RELATED SERVICES 2.170 0.679 1.874 4.72
CLASS C OTHER PRIMARY INDUSTRIES 1.825 0.606 1.579 4.01
Section 6C - ©WSIB Ontario 110

2011Premium Rates M
ANUAL
SECTION 6DClass D – Manufacturing

2011 PREMIUM RATES
6-YEAR HISTORICAL SUMMARY AND 2-YEAR PROJECTION
RATE GROUP 207: MEAT AND FISH PRODUCTS
(CLASS D: MANUFACTURING)
Year
Insurable
Earnings
Maximum
Insurable
Earnings
Ceiling
Average
Insurable
Earnings Employment
Total
Number of
Injuries
Total Injury
Rate
2004 $495,193,888 $66,800 $29,880 16,573 2,411 14.55%
2005 $535,721,772 $67,700 $31,069 17,243 2,401 13.92%
2006 $539,290,179 $69,400 $30,265 17,819 2,256 12.66%
2007 $523,415,572 $71,800 $30,674 17,064 2,194 12.86%
2008 $519,060,762 $73,300 $28,611 18,142 1,829 10.08%
2009 $513,285,684 $74,600 $30,252 16,967 1,602 9.44%
2010 $511,729,548 $77,600 $30,685 16,677 1,458 8.74%
2011 $511,515,783 $79,600 $30,582 16,726 1,350 8.07%
Section 6D - ©WSIB Ontario 111

2011 PREMIUM RATES
6-YEAR HISTORICAL SUMMARY AND 2-YEAR PROJECTION
RATE GROUP 210: POULTRY PRODUCTS
(CLASS D: MANUFACTURING)
Year
Insurable
Earnings
Maximum
Insurable
Earnings
Ceiling
Average
Insurable
Earnings Employment
Total
Number of
Injuries
Total Injury
Rate
2004 $328,875,105 $66,800 $30,794 10,680 1,303 12.20%
2005 $337,036,251 $67,700 $30,290 11,127 1,190 10.69%
2006 $362,502,516 $69,400 $30,637 11,832 1,166 9.85%
2007 $393,638,015 $71,800 $32,907 11,962 1,284 10.73%
2008 $428,868,421 $73,300 $34,729 12,349 1,214 9.83%
2009 $430,623,935 $74,600 $33,985 12,671 1,057 8.34%
2010 $429,318,406 $77,600 $34,472 12,454 1,004 8.06%
2011 $429,139,067 $79,600 $34,356 12,491 971 7.77%
Section 6D - ©WSIB Ontario 112

2011 PREMIUM RATES
6-YEAR HISTORICAL SUMMARY AND 2-YEAR PROJECTION
RATE GROUP 214: FRUIT AND VEGETABLE PRODUCTS
(CLASS D: MANUFACTURING)
Year
Insurable
Earnings
Maximum
Insurable
Earnings
Ceiling
Average
Insurable
Earnings Employment
Total
Number of
Injuries
Total Injury
Rate
2004 $359,183,538 $66,800 $30,047 11,954 885 7.40%
2005 $374,084,067 $67,700 $32,069 11,665 897 7.69%
2006 $377,787,249 $69,400 $32,641 11,574 775 6.70%
2007 $391,986,569 $71,800 $34,110 11,492 806 7.01%
2008 $387,284,565 $73,300 $35,547 10,895 669 6.14%
2009 $354,990,337 $74,600 $36,413 9,749 608 6.24%
2010 $353,914,108 $77,600 $36,935 9,582 577 6.02%
2011 $353,766,268 $79,600 $36,812 9,610 558 5.81%
Section 6D - ©WSIB Ontario 113

2011 PREMIUM RATES
6-YEAR HISTORICAL SUMMARY AND 2-YEAR PROJECTION
RATE GROUP 216: DAIRY PRODUCTS
(CLASS D: MANUFACTURING)
Year
Insurable
Earnings
Maximum
Insurable
Earnings
Ceiling
Average
Insurable
Earnings Employment
Total
Number of
Injuries
Total Injury
Rate
2004 $356,397,817 $66,800 $35,618 10,006 631 6.31%
2005 $357,936,085 $67,700 $36,006 9,941 731 7.35%
2006 $371,783,733 $69,400 $35,047 10,608 691 6.51%
2007 $386,093,808 $71,800 $35,578 10,852 715 6.59%
2008 $409,800,258 $73,300 $39,438 10,391 597 5.75%
2009 $430,636,544 $74,600 $40,352 10,672 558 5.23%
2010 $429,330,977 $77,600 $40,928 10,490 541 5.16%
2011 $429,151,633 $79,600 $40,790 10,521 534 5.08%
Section 6D - ©WSIB Ontario 114

2011 PREMIUM RATES
6-YEAR HISTORICAL SUMMARY AND 2-YEAR PROJECTION
RATE GROUP 220: OTHER BAKERY PRODUCTS
(CLASS D: MANUFACTURING)
Year
Insurable
Earnings
Maximum
Insurable
Earnings
Ceiling
Average
Insurable
Earnings Employment
Total
Number of
Injuries
Total Injury
Rate
2004 $431,425,407 $66,800 $27,422 15,733 994 6.32%
2005 $428,741,804 $67,700 $28,114 15,250 941 6.17%
2006 $441,482,959 $69,400 $27,538 16,032 977 6.09%
2007 $454,950,276 $71,800 $30,819 14,762 915 6.20%
2008 $442,262,455 $73,300 $28,265 15,647 790 5.05%
2009 $458,339,949 $74,600 $29,229 15,681 753 4.80%
2010 $456,950,393 $77,600 $29,647 15,413 715 4.64%
2011 $456,759,511 $79,600 $29,548 15,458 692 4.48%
Section 6D - ©WSIB Ontario 115

2011 PREMIUM RATES
6-YEAR HISTORICAL SUMMARY AND 2-YEAR PROJECTION
RATE GROUP 222: CONFECTIONERY
(CLASS D: MANUFACTURING)
Year
Insurable
Earnings
Maximum
Insurable
Earnings
Ceiling
Average
Insurable
Earnings Employment
Total
Number of
Injuries
Total Injury
Rate
2004 $301,447,109 $66,800 $35,179 8,569 502 5.86%
2005 $310,675,109 $67,700 $35,908 8,652 544 6.29%
2006 $310,081,558 $69,400 $36,635 8,464 469 5.54%
2007 $296,627,130 $71,800 $39,971 7,421 377 5.08%
2008 $290,723,680 $73,300 $37,904 7,670 292 3.81%
2009 $279,556,337 $74,600 $37,309 7,493 275 3.67%
2010 $278,708,802 $77,600 $37,842 7,365 250 3.39%
2011 $278,592,377 $79,600 $37,714 7,387 232 3.14%
Section 6D - ©WSIB Ontario 116

2011 PREMIUM RATES
6-YEAR HISTORICAL SUMMARY AND 2-YEAR PROJECTION
RATE GROUP 223: BISCUITS, SNACK FOODS AND OTHER FOOD PRODUCTS
(CLASS D: MANUFACTURING)
Year
Insurable
Earnings
Maximum
Insurable
Earnings
Ceiling
Average
Insurable
Earnings Employment
Total
Number of
Injuries
Total Injury
Rate
2004 $760,519,369 $66,800 $30,736 24,744 1,843 7.45%
2005 $787,330,652 $67,700 $32,648 24,116 1,692 7.02%
2006 $823,140,140 $69,400 $34,223 24,052 1,596 6.64%
2007 $843,916,121 $71,800 $33,789 24,976 1,547 6.19%
2008 $850,549,791 $73,300 $34,237 24,843 1,406 5.66%
2009 $844,844,910 $74,600 $35,034 24,115 1,207 5.01%
2010 $842,283,582 $77,600 $35,535 23,703 1,122 4.73%
2011 $841,931,735 $79,600 $35,415 23,773 1,062 4.47%
Section 6D - ©WSIB Ontario 117

2011 PREMIUM RATES
6-YEAR HISTORICAL SUMMARY AND 2-YEAR PROJECTION
RATE GROUP 226: CRUSHED AND GROUND FOODS
(CLASS D: MANUFACTURING)
Year
Insurable
Earnings
Maximum
Insurable
Earnings
Ceiling
Average
Insurable
Earnings Employment
Total
Number of
Injuries
Total Injury
Rate
2004 $606,503,757 $66,800 $41,678 14,552 914 6.28%
2005 $599,458,639 $67,700 $42,044 14,258 777 5.45%
2006 $594,008,910 $69,400 $41,902 14,176 750 5.29%
2007 $566,087,449 $71,800 $42,714 13,253 694 5.24%
2008 $562,926,250 $73,300 $42,485 13,250 610 4.60%
2009 $564,446,176 $74,600 $43,127 13,088 563 4.30%
2010 $562,734,936 $77,600 $43,745 12,864 524 4.07%
2011 $562,499,865 $79,600 $43,598 12,902 496 3.84%
Section 6D - ©WSIB Ontario 118

2011 PREMIUM RATES
6-YEAR HISTORICAL SUMMARY AND 2-YEAR PROJECTION
RATE GROUP 230: ALCOHOLIC BEVERAGES
(CLASS D: MANUFACTURING)
Year
Insurable
Earnings
Maximum
Insurable
Earnings
Ceiling
Average
Insurable
Earnings Employment
Total
Number of
Injuries
Total Injury
Rate
2004 $319,751,607 $66,800 $42,117 7,592 435 5.73%
2005 $333,486,722 $67,700 $41,525 8,031 429 5.34%
2006 $316,459,800 $69,400 $44,242 7,153 424 5.93%
2007 $329,644,927 $71,800 $46,221 7,132 399 5.59%
2008 $345,769,764 $73,300 $48,652 7,107 396 5.57%
2009 $347,937,980 $74,600 $45,890 7,582 341 4.50%
2010 $346,883,131 $77,600 $46,549 7,452 338 4.54%
2011 $346,738,228 $79,600 $46,393 7,474 340 4.55%
Section 6D - ©WSIB Ontario 119

2011 PREMIUM RATES
6-YEAR HISTORICAL SUMMARY AND 2-YEAR PROJECTION
RATE GROUP 231: SOFT DRINKS
(CLASS D: MANUFACTURING)
Year
Insurable
Earnings
Maximum
Insurable
Earnings
Ceiling
Average
Insurable
Earnings Employment
Total
Number of
Injuries
Total Injury
Rate
2004 $299,857,683 $66,800 $42,443 7,065 658 9.31%
2005 $293,742,431 $67,700 $42,071 6,982 700 10.03%
2006 $301,557,717 $69,400 $44,570 6,766 694 10.26%
2007 $309,572,801 $71,800 $41,755 7,414 605 8.16%
2008 $316,354,255 $73,300 $49,469 6,395 602 9.41%
2009 $304,159,144 $74,600 $48,218 6,308 503 7.97%
2010 $303,237,020 $77,600 $48,909 6,200 498 8.03%
2011 $303,110,349 $79,600 $48,747 6,218 502 8.07%
Section 6D - ©WSIB Ontario 120

2011 PREMIUM RATES
6-YEAR HISTORICAL SUMMARY AND 2-YEAR PROJECTION
RATE GROUP 238: OTHER RUBBER PRODUCTS
(CLASS D: MANUFACTURING)
Year
Insurable
Earnings
Maximum
Insurable
Earnings
Ceiling
Average
Insurable
Earnings Employment
Total
Number of
Injuries
Total Injury
Rate
2004 $475,287,817 $66,800 $37,445 12,693 1,640 12.92%
2005 $478,000,525 $67,700 $39,481 12,107 1,553 12.83%
2006 $433,597,523 $69,400 $40,425 10,726 1,313 12.24%
2007 $396,445,346 $71,800 $39,404 10,061 1,059 10.53%
2008 $358,876,700 $73,300 $39,437 9,100 910 10.00%
2009 $265,332,760 $74,600 $38,780 6,842 641 9.37%
2010 $280,601,472 $77,600 $40,690 6,896 598 8.67%
2011 $282,969,729 $79,600 $40,709 6,951 557 8.01%
Section 6D - ©WSIB Ontario 121

2011 PREMIUM RATES
6-YEAR HISTORICAL SUMMARY AND 2-YEAR PROJECTION
RATE GROUP 258: FOAMED AND EXPANDED PLASTIC PRODUCTS
(CLASS D: MANUFACTURING)
Year
Insurable
Earnings
Maximum
Insurable
Earnings
Ceiling
Average
Insurable
Earnings Employment
Total
Number of
Injuries
Total Injury
Rate
2004 $310,499,201 $66,800 $31,481 9,863 615 6.24%
2005 $291,434,413 $67,700 $31,903 9,135 608 6.66%
2006 $270,727,314 $69,400 $33,149 8,167 499 6.11%
2007 $249,357,260 $71,800 $33,019 7,552 407 5.39%
2008 $224,595,503 $73,300 $33,973 6,611 336 5.08%
2009 $189,456,080 $74,600 $36,080 5,251 248 4.72%
2010 $191,334,031 $77,600 $36,845 5,193 232 4.47%
2011 $193,011,022 $79,600 $37,507 5,146 217 4.22%
Section 6D - ©WSIB Ontario 122

2011 PREMIUM RATES
6-YEAR HISTORICAL SUMMARY AND 2-YEAR PROJECTION
RATE GROUP 261: PLASTIC FILM AND SHEETING
(CLASS D: MANUFACTURING)
Year
Insurable
Earnings
Maximum
Insurable
Earnings
Ceiling
Average
Insurable
Earnings Employment
Total
Number of
Injuries
Total Injury
Rate
2004 $211,772,521 $66,800 $36,306 5,833 528 9.05%
2005 $216,677,108 $67,700 $34,263 6,324 466 7.37%
2006 $223,249,544 $69,400 $36,265 6,156 443 7.20%
2007 $218,783,545 $71,800 $41,929 5,218 339 6.50%
2008 $205,903,498 $73,300 $38,422 5,359 353 6.59%
2009 $184,347,310 $74,600 $39,602 4,655 267 5.74%
2010 $186,174,622 $77,600 $40,446 4,603 244 5.30%
2011 $187,806,392 $79,600 $41,177 4,561 224 4.91%
Section 6D - ©WSIB Ontario 123
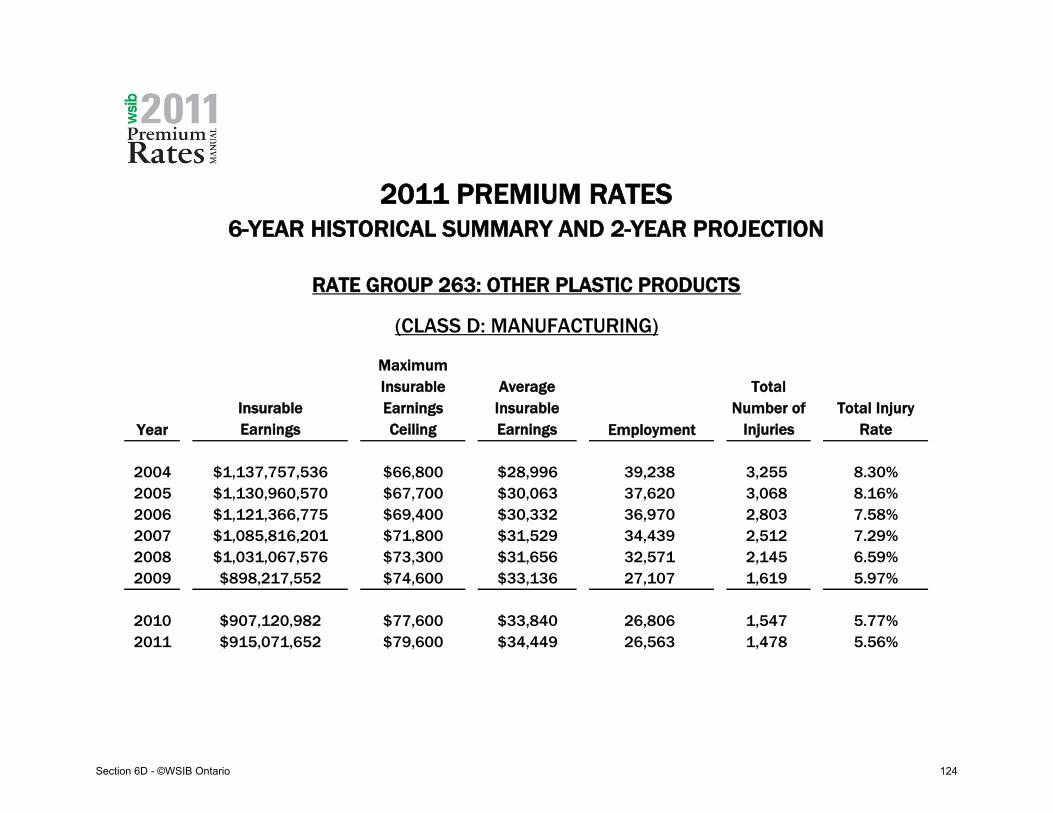
2011 PREMIUM RATES
6-YEAR HISTORICAL SUMMARY AND 2-YEAR PROJECTION
RATE GROUP 263: OTHER PLASTIC PRODUCTS
(CLASS D: MANUFACTURING)
Year
Insurable
Earnings
Maximum
Insurable
Earnings
Ceiling
Average
Insurable
Earnings Employment
Total
Number of
Injuries
Total Injury
Rate
2004 $1,137,757,536 $66,800 $28,996 39,238 3,255 8.30%
2005 $1,130,960,570 $67,700 $30,063 37,620 3,068 8.16%
2006 $1,121,366,775 $69,400 $30,332 36,970 2,803 7.58%
2007 $1,085,816,201 $71,800 $31,529 34,439 2,512 7.29%
2008 $1,031,067,576 $73,300 $31,656 32,571 2,145 6.59%
2009 $898,217,552 $74,600 $33,136 27,107 1,619 5.97%
2010 $907,120,982 $77,600 $33,840 26,806 1,547 5.77%
2011 $915,071,652 $79,600 $34,449 26,563 1,478 5.56%
Section 6D - ©WSIB Ontario 124

2011 PREMIUM RATES
6-YEAR HISTORICAL SUMMARY AND 2-YEAR PROJECTION
RATE GROUP 289: CLOTH, CARPETS AND TEXTILE PRODUCTS
(CLASS D: MANUFACTURING)
Year
Insurable
Earnings
Maximum
Insurable
Earnings
Ceiling
Average
Insurable
Earnings Employment
Total
Number of
Injuries
Total Injury
Rate
2004 $315,784,026 $66,800 $26,488 11,922 942 7.90%
2005 $378,142,531 $67,700 $27,041 13,984 822 5.88%
2006 $352,449,494 $69,400 $28,216 12,491 762 6.10%
2007 $337,101,739 $71,800 $27,353 12,324 640 5.19%
2008 $314,746,388 $73,300 $26,906 11,698 519 4.44%
2009 $277,738,510 $74,600 $26,978 10,295 367 3.56%
2010 $293,721,118 $77,600 $28,308 10,376 342 3.30%
2011 $296,200,103 $79,600 $28,323 10,458 319 3.05%
Section 6D - ©WSIB Ontario 125

2011 PREMIUM RATES
6-YEAR HISTORICAL SUMMARY AND 2-YEAR PROJECTION
RATE GROUP 301: CLOTHING, FIBRE AND YARN
(CLASS D: MANUFACTURING)
Year
Insurable
Earnings
Maximum
Insurable
Earnings
Ceiling
Average
Insurable
Earnings Employment
Total
Number of
Injuries
Total Injury
Rate
2004 $665,319,109 $66,800 $24,998 26,615 642 2.41%
2005 $494,217,656 $67,700 $26,946 18,341 575 3.14%
2006 $456,466,887 $69,400 $26,649 17,129 487 2.84%
2007 $419,743,285 $71,800 $29,943 14,018 433 3.09%
2008 $369,072,549 $73,300 $30,687 12,027 302 2.51%
2009 $315,137,152 $74,600 $34,768 9,064 273 3.01%
2010 $325,101,733 $77,600 $35,585 9,136 277 3.03%
2011 $336,084,676 $79,600 $36,495 9,209 281 3.05%
Section 6D - ©WSIB Ontario 126

2011 PREMIUM RATES
6-YEAR HISTORICAL SUMMARY AND 2-YEAR PROJECTION
RATE GROUP 308: MILLWORK AND OTHER WOOD INDUSTRIES
(CLASS D: MANUFACTURING)
Year
Insurable
Earnings
Maximum
Insurable
Earnings
Ceiling
Average
Insurable
Earnings Employment
Total
Number of
Injuries
Total Injury
Rate
2004 $320,485,215 $66,800 $29,297 10,939 1,748 15.98%
2005 $317,676,608 $67,700 $30,658 10,362 1,576 15.21%
2006 $315,808,349 $69,400 $32,608 9,685 1,333 13.76%
2007 $310,998,321 $71,800 $33,312 9,336 1,084 11.61%
2008 $303,031,411 $73,300 $34,037 8,903 1,079 12.12%
2009 $242,873,292 $74,600 $32,772 7,411 771 10.40%
2010 $256,849,563 $77,600 $34,384 7,470 719 9.63%
2011 $259,017,355 $79,600 $34,403 7,529 670 8.90%
Section 6D - ©WSIB Ontario 127

2011 PREMIUM RATES
6-YEAR HISTORICAL SUMMARY AND 2-YEAR PROJECTION
RATE GROUP 311: WOODEN CABINETS
(CLASS D: MANUFACTURING)
Year
Insurable
Earnings
Maximum
Insurable
Earnings
Ceiling
Average
Insurable
Earnings Employment
Total
Number of
Injuries
Total Injury
Rate
2004 $336,399,426 $66,800 $32,408 10,380 1,179 11.36%
2005 $340,115,819 $67,700 $34,407 9,885 1,081 10.94%
2006 $362,617,661 $69,400 $33,585 10,797 937 8.68%
2007 $357,922,375 $71,800 $34,052 10,511 802 7.63%
2008 $338,606,136 $73,300 $32,868 10,302 586 5.69%
2009 $289,645,510 $74,600 $33,845 8,558 483 5.64%
2010 $306,313,312 $77,600 $35,510 8,626 451 5.23%
2011 $308,898,575 $79,600 $35,526 8,695 420 4.83%
Section 6D - ©WSIB Ontario 128

2011 PREMIUM RATES
6-YEAR HISTORICAL SUMMARY AND 2-YEAR PROJECTION
RATE GROUP 312: WOODEN BOXES AND PALLETS
(CLASS D: MANUFACTURING)
Year
Insurable
Earnings
Maximum
Insurable
Earnings
Ceiling
Average
Insurable
Earnings Employment
Total
Number of
Injuries
Total Injury
Rate
2004 $69,026,919 $66,800 $26,356 2,619 368 14.05%
2005 $70,930,075 $67,700 $27,589 2,571 369 14.35%
2006 $70,907,442 $69,400 $28,766 2,465 364 14.77%
2007 $70,505,807 $71,800 $28,056 2,513 315 12.53%
2008 $69,440,578 $73,300 $30,113 2,306 286 12.40%
2009 $60,228,789 $74,600 $29,831 2,019 238 11.79%
2010 $62,476,835 $77,600 $30,701 2,035 232 11.40%
2011 $64,232,265 $79,600 $31,318 2,051 225 10.97%
Section 6D - ©WSIB Ontario 129

2011 PREMIUM RATES
6-YEAR HISTORICAL SUMMARY AND 2-YEAR PROJECTION
RATE GROUP 322: UPHOLSTERED FURNITURE
(CLASS D: MANUFACTURING)
Year
Insurable
Earnings
Maximum
Insurable
Earnings
Ceiling
Average
Insurable
Earnings Employment
Total
Number of
Injuries
Total Injury
Rate
2004 $143,844,692 $66,800 $32,744 4,393 301 6.85%
2005 $138,252,125 $67,700 $32,249 4,287 256 5.97%
2006 $110,276,228 $69,400 $30,976 3,560 150 4.21%
2007 $103,055,849 $71,800 $32,967 3,126 143 4.57%
2008 $91,129,512 $73,300 $32,804 2,778 99 3.56%
2009 $84,267,791 $74,600 $33,613 2,507 72 2.87%
2010 $87,413,096 $77,600 $34,592 2,527 67 2.65%
2011 $89,869,167 $79,600 $35,284 2,547 63 2.47%
Section 6D - ©WSIB Ontario 130

2011 PREMIUM RATES
6-YEAR HISTORICAL SUMMARY AND 2-YEAR PROJECTION
RATE GROUP 323: METAL FURNITURE
(CLASS D: MANUFACTURING)
Year
Insurable
Earnings
Maximum
Insurable
Earnings
Ceiling
Average
Insurable
Earnings Employment
Total
Number of
Injuries
Total Injury
Rate
2004 $418,385,369 $66,800 $33,420 12,519 940 7.51%
2005 $417,070,537 $67,700 $34,122 12,223 902 7.38%
2006 $409,823,309 $69,400 $34,238 11,970 754 6.30%
2007 $402,656,005 $71,800 $36,272 11,101 764 6.88%
2008 $392,025,248 $73,300 $36,734 10,672 593 5.56%
2009 $334,831,748 $74,600 $37,187 9,004 383 4.25%
2010 $354,099,817 $77,600 $39,019 9,075 365 4.02%
2011 $357,088,394 $79,600 $39,039 9,147 347 3.79%
Section 6D - ©WSIB Ontario 131

2011 PREMIUM RATES
6-YEAR HISTORICAL SUMMARY AND 2-YEAR PROJECTION
RATE GROUP 325: WOODEN AND OTHER NON-METAL FURNITURE
(CLASS D: MANUFACTURING)
Year
Insurable
Earnings
Maximum
Insurable
Earnings
Ceiling
Average
Insurable
Earnings Employment
Total
Number of
Injuries
Total Injury
Rate
2004 $460,549,274 $66,800 $31,302 14,713 1,545 10.50%
2005 $457,141,533 $67,700 $32,862 13,911 1,494 10.74%
2006 $455,857,064 $69,400 $34,167 13,342 1,299 9.74%
2007 $451,995,666 $71,800 $35,041 12,899 1,106 8.57%
2008 $437,073,600 $73,300 $35,520 12,305 935 7.60%
2009 $361,703,232 $74,600 $38,058 9,504 740 7.79%
2010 $382,517,634 $77,600 $39,933 9,579 690 7.20%
2011 $385,746,056 $79,600 $39,953 9,655 643 6.66%
Section 6D - ©WSIB Ontario 132

2011 PREMIUM RATES
6-YEAR HISTORICAL SUMMARY AND 2-YEAR PROJECTION
RATE GROUP 328: FURNITURE PARTS AND FIXTURES
(CLASS D: MANUFACTURING)
Year
Insurable
Earnings
Maximum
Insurable
Earnings
Ceiling
Average
Insurable
Earnings Employment
Total
Number of
Injuries
Total Injury
Rate
2004 $160,968,805 $66,800 $31,366 5,132 459 8.94%
2005 $158,383,833 $67,700 $32,656 4,850 405 8.35%
2006 $148,576,208 $69,400 $32,726 4,540 361 7.95%
2007 $146,022,222 $71,800 $35,755 4,084 324 7.93%
2008 $136,593,640 $73,300 $32,930 4,148 264 6.36%
2009 $109,502,532 $74,600 $32,943 3,324 181 5.45%
2010 $115,803,913 $77,600 $34,568 3,350 169 5.04%
2011 $116,781,289 $79,600 $34,581 3,377 157 4.65%
Section 6D - ©WSIB Ontario 133

2011 PREMIUM RATES
6-YEAR HISTORICAL SUMMARY AND 2-YEAR PROJECTION
RATE GROUP 333: PRINTING, PLATEMAKING AND BINDING
(CLASS D: MANUFACTURING)
Year
Insurable
Earnings
Maximum
Insurable
Earnings
Ceiling
Average
Insurable
Earnings Employment
Total
Number of
Injuries
Total Injury
Rate
2004 $1,353,586,136 $66,800 $34,842 38,849 1,763 4.54%
2005 $1,350,295,862 $67,700 $34,838 38,759 1,513 3.90%
2006 $1,333,797,275 $69,400 $36,096 36,951 1,532 4.15%
2007 $1,357,725,861 $71,800 $37,081 36,615 1,312 3.58%
2008 $1,339,579,386 $73,300 $37,007 36,198 1,204 3.33%
2009 $1,235,058,982 $74,600 $36,577 33,766 953 2.82%
2010 $1,274,111,327 $77,600 $37,438 34,033 889 2.61%
2011 $1,317,154,753 $79,600 $38,397 34,304 828 2.41%
Section 6D - ©WSIB Ontario 134

2011 PREMIUM RATES
6-YEAR HISTORICAL SUMMARY AND 2-YEAR PROJECTION
RATE GROUP 335: PUBLISHING
(CLASS D: MANUFACTURING)
Year
Insurable
Earnings
Maximum
Insurable
Earnings
Ceiling
Average
Insurable
Earnings Employment
Total
Number of
Injuries
Total Injury
Rate
2004 $1,160,851,173 $66,800 $35,182 32,996 582 1.76%
2005 $1,193,987,338 $67,700 $33,241 35,919 602 1.68%
2006 $1,285,427,015 $69,400 $31,337 41,019 517 1.26%
2007 $1,319,224,691 $71,800 $33,059 39,905 474 1.19%
2008 $1,344,927,654 $73,300 $35,859 37,506 489 1.30%
2009 $1,302,270,837 $74,600 $36,629 35,553 400 1.13%
2010 $1,343,448,408 $77,600 $37,491 35,834 373 1.04%
2011 $1,388,834,256 $79,600 $38,452 36,119 347 0.96%
Section 6D - ©WSIB Ontario 135

2011 PREMIUM RATES
6-YEAR HISTORICAL SUMMARY AND 2-YEAR PROJECTION
RATE GROUP 338: FOLDING CARTONS
(CLASS D: MANUFACTURING)
Year
Insurable
Earnings
Maximum
Insurable
Earnings
Ceiling
Average
Insurable
Earnings Employment
Total
Number of
Injuries
Total Injury
Rate
2004 $217,283,604 $66,800 $37,162 5,847 358 6.12%
2005 $216,130,290 $67,700 $35,321 6,119 358 5.85%
2006 $216,406,860 $69,400 $35,829 6,040 293 4.85%
2007 $204,616,765 $71,800 $40,327 5,074 298 5.87%
2008 $195,695,269 $73,300 $41,173 4,753 279 5.87%
2009 $180,631,668 $74,600 $41,034 4,402 232 5.27%
2010 $187,373,765 $77,600 $42,230 4,437 235 5.30%
2011 $192,638,460 $79,600 $43,077 4,472 238 5.32%
Section 6D - ©WSIB Ontario 136

2011 PREMIUM RATES
6-YEAR HISTORICAL SUMMARY AND 2-YEAR PROJECTION
RATE GROUP 341: PAPER PRODUCTS
(CLASS D: MANUFACTURING)
Year
Insurable
Earnings
Maximum
Insurable
Earnings
Ceiling
Average
Insurable
Earnings Employment
Total
Number of
Injuries
Total Injury
Rate
2004 $311,658,642 $66,800 $38,105 8,179 819 10.01%
2005 $300,479,799 $67,700 $38,103 7,886 691 8.76%
2006 $279,483,643 $69,400 $36,654 7,625 567 7.44%
2007 $253,090,893 $71,800 $36,958 6,848 493 7.20%
2008 $229,547,344 $73,300 $36,881 6,224 361 5.80%
2009 $205,691,682 $74,600 $38,361 5,362 302 5.63%
2010 $217,528,318 $77,600 $40,253 5,404 282 5.22%
2011 $219,364,242 $79,600 $40,272 5,447 262 4.81%
Section 6D - ©WSIB Ontario 137

2011 PREMIUM RATES
6-YEAR HISTORICAL SUMMARY AND 2-YEAR PROJECTION
RATE GROUP 352: STEEL AND OTHER SMELTING AND REFINING INDUSTRIES
(CLASS D: MANUFACTURING)
Year
Insurable
Earnings
Maximum
Insurable
Earnings
Ceiling
Average
Insurable
Earnings Employment
Total
Number of
Injuries
Total Injury
Rate
2004 $1,501,938,382 $66,800 $52,267 28,736 3,278 11.41%
2005 $1,518,525,872 $67,700 $53,127 28,583 3,122 10.92%
2006 $1,513,143,036 $69,400 $53,678 28,189 2,709 9.61%
2007 $1,457,980,453 $71,800 $56,476 25,816 2,379 9.22%
2008 $1,446,114,880 $73,300 $56,138 25,760 1,967 7.64%
2009 $1,165,840,200 $74,600 $56,280 20,715 1,327 6.41%
2010 $1,119,934,048 $77,600 $57,035 19,636 1,164 5.93%
2011 $1,096,095,402 $79,600 $57,668 19,007 1,041 5.48%
Section 6D - ©WSIB Ontario 138

2011 PREMIUM RATES
6-YEAR HISTORICAL SUMMARY AND 2-YEAR PROJECTION
RATE GROUP 358: FOUNDRIES
(CLASS D: MANUFACTURING)
Year
Insurable
Earnings
Maximum
Insurable
Earnings
Ceiling
Average
Insurable
Earnings Employment
Total
Number of
Injuries
Total Injury
Rate
2004 $172,527,478 $66,800 $37,473 4,604 1,006 21.85%
2005 $166,217,633 $67,700 $38,972 4,265 967 22.67%
2006 $151,656,530 $69,400 $42,092 3,603 767 21.29%
2007 $122,096,247 $71,800 $41,082 2,972 573 19.28%
2008 $117,220,896 $73,300 $40,872 2,868 553 19.28%
2009 $86,327,046 $74,600 $40,991 2,106 293 13.91%
2010 $82,927,830 $77,600 $41,547 1,996 268 13.43%
2011 $81,162,648 $79,600 $42,010 1,932 250 12.94%
Section 6D - ©WSIB Ontario 139

2011 PREMIUM RATES
6-YEAR HISTORICAL SUMMARY AND 2-YEAR PROJECTION
RATE GROUP 361: NON-FERROUS METAL INDUSTRIES*
(CLASS D: MANUFACTURING)
Year
Insurable
Earnings
Maximum
Insurable
Earnings
Ceiling
Average
Insurable
Earnings Employment
Total
Number of
Injuries
Total Injury
Rate
2004 $8,659,826,046 $66,800 $45,966 188,396 24,012 12.75%
2005 $8,747,266,560 $67,700 $46,262 189,081 23,432 12.39%
2006 $8,598,152,763 $69,400 $48,847 176,022 20,860 11.85%
2007 $8,231,332,066 $71,800 $50,454 163,145 17,672 10.83%
2008 $7,097,706,004 $73,300 $51,134 138,806 13,972 10.07%
2009 $5,137,062,000 $74,600 $50,862 101,000 8,974 8.89%
2010 $5,193,741,631 $77,600 $51,172 101,495 8,531 8.41%
2011 $5,294,086,922 $79,600 $51,699 102,403 8,125 7.93%
* Experience for rate groups 361, 390, 419, 421, 424 and 425 has been combined in order to determine a common 2011 Premium Rate.
Section 6D - ©WSIB Ontario 140

2011 PREMIUM RATES
6-YEAR HISTORICAL SUMMARY AND 2-YEAR PROJECTION
RATE GROUP 374: DOORS AND WINDOWS
(CLASS D: MANUFACTURING)
Year
Insurable
Earnings
Maximum
Insurable
Earnings
Ceiling
Average
Insurable
Earnings Employment
Total
Number of
Injuries
Total Injury
Rate
2004 $439,712,495 $66,800 $31,928 13,772 1,665 12.09%
2005 $456,868,401 $67,700 $32,727 13,960 1,693 12.13%
2006 $470,361,397 $69,400 $32,973 14,265 1,466 10.28%
2007 $473,152,848 $71,800 $32,878 14,391 1,380 9.59%
2008 $471,655,385 $73,300 $34,445 13,693 1,242 9.07%
2009 $447,344,768 $74,600 $34,528 12,956 917 7.08%
2010 $473,087,457 $77,600 $36,230 13,058 856 6.56%
2011 $477,080,282 $79,600 $36,247 13,162 796 6.05%
Section 6D - ©WSIB Ontario 141

2011 PREMIUM RATES
6-YEAR HISTORICAL SUMMARY AND 2-YEAR PROJECTION
RATE GROUP 375: STRUCTURAL AND ARCHITECTURAL PRODUCTS
(CLASS D: MANUFACTURING)
Year
Insurable
Earnings
Maximum
Insurable
Earnings
Ceiling
Average
Insurable
Earnings Employment
Total
Number of
Injuries
Total Injury
Rate
2004 $479,307,530 $66,800 $36,850 13,007 2,020 15.53%
2005 $484,066,407 $67,700 $37,222 13,005 2,151 16.54%
2006 $500,178,696 $69,400 $38,190 13,097 2,075 15.84%
2007 $558,388,175 $71,800 $40,180 13,897 2,016 14.51%
2008 $577,923,346 $73,300 $41,239 14,014 1,954 13.94%
2009 $507,210,500 $74,600 $41,660 12,175 1,510 12.40%
2010 $536,398,194 $77,600 $43,713 12,271 1,471 11.99%
2011 $540,925,357 $79,600 $43,732 12,369 1,429 11.55%
Section 6D - ©WSIB Ontario 142

2011 PREMIUM RATES
6-YEAR HISTORICAL SUMMARY AND 2-YEAR PROJECTION
RATE GROUP 377: COATING OF METAL PRODUCTS
(CLASS D: MANUFACTURING)
Year
Insurable
Earnings
Maximum
Insurable
Earnings
Ceiling
Average
Insurable
Earnings Employment
Total
Number of
Injuries
Total Injury
Rate
2004 $397,687,435 $66,800 $33,999 11,697 1,389 11.87%
2005 $388,396,360 $67,700 $34,190 11,360 1,335 11.75%
2006 $368,526,351 $69,400 $34,535 10,671 1,133 10.62%
2007 $346,912,515 $71,800 $36,387 9,534 850 8.92%
2008 $312,299,824 $73,300 $36,079 8,656 724 8.36%
2009 $237,081,322 $74,600 $37,501 6,322 464 7.34%
2010 $250,724,291 $77,600 $39,348 6,372 433 6.80%
2011 $252,840,386 $79,600 $39,365 6,423 403 6.27%
Section 6D - ©WSIB Ontario 143

2011 PREMIUM RATES
6-YEAR HISTORICAL SUMMARY AND 2-YEAR PROJECTION
RATE GROUP 379: HARDWARE, TOOLS AND CUTLERY
(CLASS D: MANUFACTURING)
Year
Insurable
Earnings
Maximum
Insurable
Earnings
Ceiling
Average
Insurable
Earnings Employment
Total
Number of
Injuries
Total Injury
Rate
2004 $225,355,868 $66,800 $34,766 6,482 532 8.21%
2005 $220,383,941 $67,700 $32,722 6,735 547 8.12%
2006 $216,664,974 $69,400 $33,806 6,409 392 6.12%
2007 $208,349,963 $71,800 $35,842 5,813 340 5.85%
2008 $193,954,740 $73,300 $37,443 5,180 272 5.25%
2009 $166,875,697 $74,600 $36,301 4,597 209 4.55%
2010 $176,478,647 $77,600 $38,092 4,633 195 4.21%
2011 $177,968,114 $79,600 $38,109 4,670 182 3.90%
Section 6D - ©WSIB Ontario 144

2011 PREMIUM RATES
6-YEAR HISTORICAL SUMMARY AND 2-YEAR PROJECTION
RATE GROUP 382: METAL DIES, MOULDS AND PATTERNS
(CLASS D: MANUFACTURING)
Year
Insurable
Earnings
Maximum
Insurable
Earnings
Ceiling
Average
Insurable
Earnings Employment
Total
Number of
Injuries
Total Injury
Rate
2004 $824,290,011 $66,800 $46,342 17,787 2,433 13.68%
2005 $840,953,896 $67,700 $46,257 18,180 2,320 12.76%
2006 $776,447,662 $69,400 $47,726 16,269 2,002 12.31%
2007 $671,315,829 $71,800 $48,777 13,763 1,417 10.30%
2008 $611,549,354 $73,300 $48,074 12,721 1,167 9.17%
2009 $510,591,680 $74,600 $46,672 10,940 913 8.35%
2010 $526,736,497 $77,600 $47,772 11,026 852 7.73%
2011 $544,531,288 $79,600 $48,995 11,114 793 7.14%
Section 6D - ©WSIB Ontario 145

2011 PREMIUM RATES
6-YEAR HISTORICAL SUMMARY AND 2-YEAR PROJECTION
RATE GROUP 383: HEATING, REFRIGERATION AND AIR CONDITIONING EQUIPMENT
(CLASS D: MANUFACTURING)
Year
Insurable
Earnings
Maximum
Insurable
Earnings
Ceiling
Average
Insurable
Earnings Employment
Total
Number of
Injuries
Total Injury
Rate
2004 $248,923,642 $66,800 $32,273 7,713 958 12.42%
2005 $255,532,713 $67,700 $33,579 7,610 921 12.10%
2006 $258,825,265 $69,400 $36,521 7,087 859 12.12%
2007 $247,861,211 $71,800 $33,631 7,370 680 9.23%
2008 $232,452,444 $73,300 $35,029 6,636 633 9.54%
2009 $208,813,108 $74,600 $36,737 5,684 513 9.03%
2010 $220,829,368 $77,600 $38,546 5,729 479 8.36%
2011 $222,693,152 $79,600 $38,562 5,775 446 7.72%
Section 6D - ©WSIB Ontario 146

2011 PREMIUM RATES
6-YEAR HISTORICAL SUMMARY AND 2-YEAR PROJECTION
RATE GROUP 385: MACHINE SHOPS
(CLASS D: MANUFACTURING)
Year
Insurable
Earnings
Maximum
Insurable
Earnings
Ceiling
Average
Insurable
Earnings Employment
Total
Number of
Injuries
Total Injury
Rate
2004 $956,206,834 $66,800 $38,180 25,045 2,523 10.07%
2005 $1,006,567,276 $67,700 $38,022 26,473 2,639 9.97%
2006 $1,047,789,762 $69,400 $39,399 26,594 2,370 8.91%
2007 $1,013,240,424 $71,800 $40,815 24,825 2,022 8.15%
2008 $944,867,511 $73,300 $43,281 21,831 1,703 7.80%
2009 $732,917,556 $74,600 $43,409 16,884 1,098 6.50%
2010 $775,093,681 $77,600 $45,548 17,017 1,024 6.02%
2011 $781,635,417 $79,600 $45,571 17,152 954 5.56%
Section 6D - ©WSIB Ontario 147

2011 PREMIUM RATES
6-YEAR HISTORICAL SUMMARY AND 2-YEAR PROJECTION
RATE GROUP 387: OTHER METAL FABRICATING INDUSTRIES
(CLASS D: MANUFACTURING)
Year
Insurable
Earnings
Maximum
Insurable
Earnings
Ceiling
Average
Insurable
Earnings Employment
Total
Number of
Injuries
Total Injury
Rate
2004 $953,188,025 $66,800 $35,965 26,503 3,121 11.78%
2005 $988,653,089 $67,700 $37,119 26,635 3,070 11.53%
2006 $973,415,622 $69,400 $37,869 25,705 2,835 11.03%
2007 $947,428,412 $71,800 $39,131 24,212 2,556 10.56%
2008 $922,366,230 $73,300 $39,495 23,354 2,281 9.77%
2009 $764,857,710 $74,600 $39,294 19,465 1,469 7.55%
2010 $808,871,848 $77,600 $41,229 19,619 1,431 7.29%
2011 $815,698,670 $79,600 $41,249 19,775 1,391 7.03%
Section 6D - ©WSIB Ontario 148

2011 PREMIUM RATES
6-YEAR HISTORICAL SUMMARY AND 2-YEAR PROJECTION
RATE GROUP 389: METAL CLOSURES AND CONTAINERS
(CLASS D: MANUFACTURING)
Year
Insurable
Earnings
Maximum
Insurable
Earnings
Ceiling
Average
Insurable
Earnings Employment
Total
Number of
Injuries
Total Injury
Rate
2004 $164,369,395 $66,800 $37,639 4,367 497 11.38%
2005 $158,883,431 $67,700 $38,790 4,096 364 8.89%
2006 $140,049,316 $69,400 $42,568 3,290 326 9.91%
2007 $124,425,489 $71,800 $37,946 3,279 265 8.08%
2008 $111,774,650 $73,300 $46,670 2,395 192 8.02%
2009 $95,604,705 $74,600 $43,715 2,187 144 6.58%
2010 $99,173,161 $77,600 $44,997 2,204 134 6.08%
2011 $101,959,658 $79,600 $45,886 2,222 125 5.63%
Section 6D - ©WSIB Ontario 149

2011 PREMIUM RATES
6-YEAR HISTORICAL SUMMARY AND 2-YEAR PROJECTION
RATE GROUP 390: OTHER STAMPED AND PRESSED METAL PRODUCTS*
(CLASS D: MANUFACTURING)
Year
Insurable
Earnings
Maximum
Insurable
Earnings
Ceiling
Average
Insurable
Earnings Employment
Total
Number of
Injuries
Total Injury
Rate
2004 $8,659,826,046 $66,800 $45,966 188,396 24,012 12.75%
2005 $8,747,266,560 $67,700 $46,262 189,081 23,432 12.39%
2006 $8,598,152,763 $69,400 $48,847 176,022 20,860 11.85%
2007 $8,231,332,066 $71,800 $50,454 163,145 17,672 10.83%
2008 $7,097,706,004 $73,300 $51,134 138,806 13,972 10.07%
2009 $5,137,062,000 $74,600 $50,862 101,000 8,974 8.89%
2010 $5,193,741,631 $77,600 $51,172 101,495 8,531 8.41%
2011 $5,294,086,922 $79,600 $51,699 102,403 8,125 7.93%
* Experience for rate groups 361, 390, 419, 421, 424 and 425 has been combined in order to determine a common 2011 Premium Rate.
Section 6D - ©WSIB Ontario 150

2011 PREMIUM RATES
6-YEAR HISTORICAL SUMMARY AND 2-YEAR PROJECTION
RATE GROUP 393: WIRE PRODUCTS
(CLASS D: MANUFACTURING)
Year
Insurable
Earnings
Maximum
Insurable
Earnings
Ceiling
Average
Insurable
Earnings Employment
Total
Number of
Injuries
Total Injury
Rate
2004 $267,726,205 $66,800 $32,634 8,204 765 9.32%
2005 $262,258,436 $67,700 $34,562 7,588 696 9.17%
2006 $242,237,340 $69,400 $34,680 6,985 533 7.63%
2007 $218,683,812 $71,800 $35,455 6,168 496 8.04%
2008 $203,742,147 $73,300 $37,779 5,393 443 8.21%
2009 $157,191,930 $74,600 $38,061 4,130 262 6.34%
2010 $166,237,622 $77,600 $39,932 4,163 255 6.13%
2011 $167,640,656 $79,600 $39,952 4,196 248 5.91%
Section 6D - ©WSIB Ontario 151
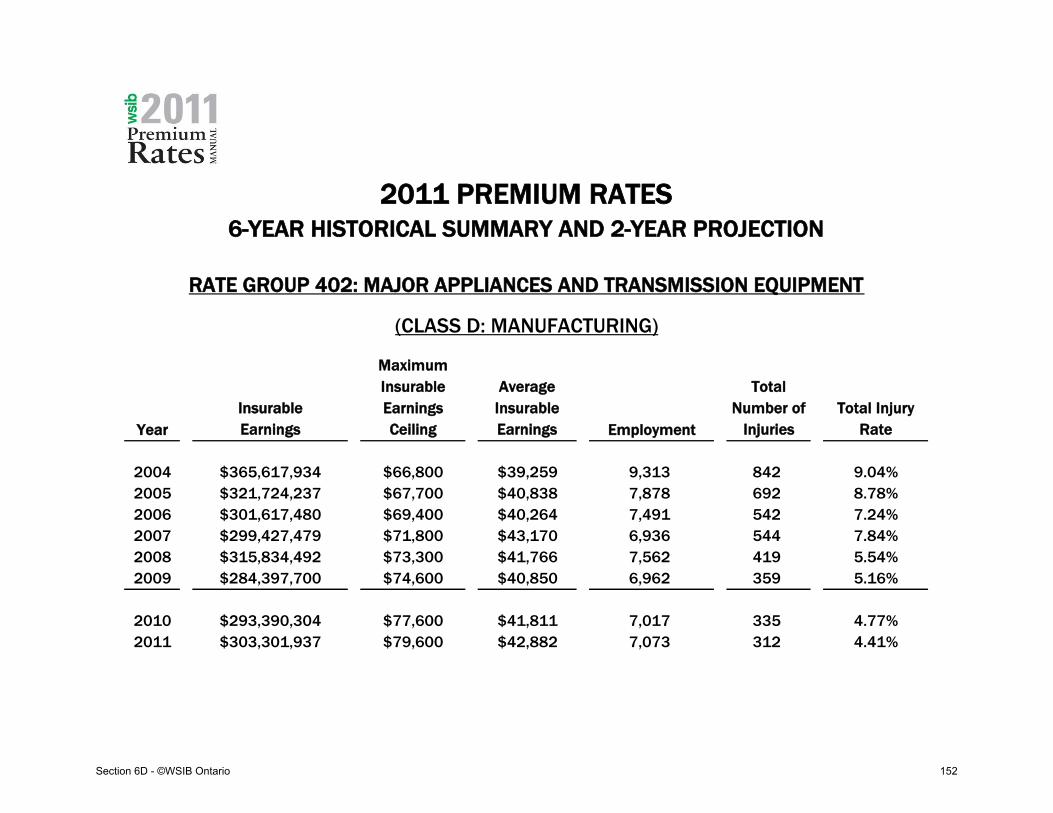
2011 PREMIUM RATES
6-YEAR HISTORICAL SUMMARY AND 2-YEAR PROJECTION
RATE GROUP 402: MAJOR APPLIANCES AND TRANSMISSION EQUIPMENT
(CLASS D: MANUFACTURING)
Year
Insurable
Earnings
Maximum
Insurable
Earnings
Ceiling
Average
Insurable
Earnings Employment
Total
Number of
Injuries
Total Injury
Rate
2004 $365,617,934 $66,800 $39,259 9,313 842 9.04%
2005 $321,724,237 $67,700 $40,838 7,878 692 8.78%
2006 $301,617,480 $69,400 $40,264 7,491 542 7.24%
2007 $299,427,479 $71,800 $43,170 6,936 544 7.84%
2008 $315,834,492 $73,300 $41,766 7,562 419 5.54%
2009 $284,397,700 $74,600 $40,850 6,962 359 5.16%
2010 $293,390,304 $77,600 $41,811 7,017 335 4.77%
2011 $303,301,937 $79,600 $42,882 7,073 312 4.41%
Section 6D - ©WSIB Ontario 152

2011 PREMIUM RATES
6-YEAR HISTORICAL SUMMARY AND 2-YEAR PROJECTION
RATE GROUP 403: OTHER MACHINERY AND EQUIPMENT
(CLASS D: MANUFACTURING)
Year
Insurable
Earnings
Maximum
Insurable
Earnings
Ceiling
Average
Insurable
Earnings Employment
Total
Number of
Injuries
Total Injury
Rate
2004 $1,182,208,603 $66,800 $41,548 28,454 1,931 6.79%
2005 $1,202,817,682 $67,700 $41,866 28,730 1,777 6.19%
2006 $1,201,001,515 $69,400 $42,888 28,003 1,839 6.57%
2007 $1,177,333,776 $71,800 $43,382 27,139 1,520 5.60%
2008 $1,148,107,070 $73,300 $43,945 26,126 1,402 5.37%
2009 $956,777,640 $74,600 $44,772 21,370 907 4.24%
2010 $987,030,778 $77,600 $45,825 21,539 883 4.10%
2011 $1,020,375,735 $79,600 $47,000 21,710 859 3.96%
Section 6D - ©WSIB Ontario 153

2011 PREMIUM RATES
6-YEAR HISTORICAL SUMMARY AND 2-YEAR PROJECTION
RATE GROUP 406: ELEVATORS AND ESCALATORS
(CLASS D: MANUFACTURING)
Year
Insurable
Earnings
Maximum
Insurable
Earnings
Ceiling
Average
Insurable
Earnings Employment
Total
Number of
Injuries
Total Injury
Rate
2004 $181,228,253 $66,800 $51,137 3,544 428 12.08%
2005 $202,434,820 $67,700 $51,760 3,911 509 13.01%
2006 $222,257,224 $69,400 $56,097 3,962 532 13.43%
2007 $243,846,519 $71,800 $58,406 4,175 490 11.74%
2008 $252,311,246 $73,300 $58,718 4,297 444 10.33%
2009 $236,905,585 $74,600 $60,823 3,895 347 8.91%
2010 $250,538,441 $77,600 $63,815 3,926 338 8.61%
2011 $252,652,968 $79,600 $63,850 3,957 328 8.29%
Section 6D - ©WSIB Ontario 154

2011 PREMIUM RATES
6-YEAR HISTORICAL SUMMARY AND 2-YEAR PROJECTION
RATE GROUP 408: BOILERS, PUMPS AND FANS
(CLASS D: MANUFACTURING)
Year
Insurable
Earnings
Maximum
Insurable
Earnings
Ceiling
Average
Insurable
Earnings Employment
Total
Number of
Injuries
Total Injury
Rate
2004 $152,013,471 $66,800 $42,857 3,547 320 9.02%
2005 $157,922,956 $67,700 $43,089 3,665 358 9.77%
2006 $169,250,972 $69,400 $43,487 3,892 360 9.25%
2007 $177,939,257 $71,800 $44,385 4,009 388 9.68%
2008 $192,087,400 $73,300 $45,400 4,231 304 7.19%
2009 $187,254,558 $74,600 $46,546 4,023 206 5.12%
2010 $198,030,220 $77,600 $48,836 4,055 205 5.06%
2011 $199,701,581 $79,600 $48,863 4,087 203 4.97%
Section 6D - ©WSIB Ontario 155

2011 PREMIUM RATES
6-YEAR HISTORICAL SUMMARY AND 2-YEAR PROJECTION
RATE GROUP 411: AGRICULTURAL, CONSTRUCTION AND MINING MACHINERY
(CLASS D: MANUFACTURING)
Year
Insurable
Earnings
Maximum
Insurable
Earnings
Ceiling
Average
Insurable
Earnings Employment
Total
Number of
Injuries
Total Injury
Rate
2004 $652,149,612 $66,800 $38,564 16,911 2,219 13.12%
2005 $714,119,602 $67,700 $40,214 17,758 2,357 13.27%
2006 $756,690,710 $69,400 $40,843 18,527 2,347 12.67%
2007 $773,330,257 $71,800 $43,338 17,844 2,252 12.62%
2008 $784,726,800 $73,300 $44,200 17,754 2,037 11.47%
2009 $607,216,398 $74,600 $43,998 13,801 1,150 8.33%
2010 $642,158,983 $77,600 $46,165 13,910 1,144 8.22%
2011 $647,578,760 $79,600 $46,186 14,021 1,135 8.10%
Section 6D - ©WSIB Ontario 156

2011 PREMIUM RATES
6-YEAR HISTORICAL SUMMARY AND 2-YEAR PROJECTION
RATE GROUP 417: AIRCRAFT MANUFACTURING
(CLASS D: MANUFACTURING)
Year
Insurable
Earnings
Maximum
Insurable
Earnings
Ceiling
Average
Insurable
Earnings Employment
Total
Number of
Injuries
Total Injury
Rate
2004 $543,889,785 $66,800 $48,449 11,226 681 6.07%
2005 $589,489,445 $67,700 $46,336 12,722 747 5.87%
2006 $660,123,075 $69,400 $46,056 14,333 832 5.80%
2007 $718,611,560 $71,800 $49,372 14,555 923 6.34%
2008 $784,165,482 $73,300 $51,651 15,182 921 6.07%
2009 $759,226,496 $74,600 $54,656 13,891 751 5.41%
2010 $783,233,102 $77,600 $55,941 14,001 762 5.44%
2011 $809,693,142 $79,600 $57,376 14,112 772 5.47%
Section 6D - ©WSIB Ontario 157

2011 PREMIUM RATES
6-YEAR HISTORICAL SUMMARY AND 2-YEAR PROJECTION
RATE GROUP 419: MOTOR VEHICLE ASSEMBLY*
(CLASS D: MANUFACTURING)
Year
Insurable
Earnings
Maximum
Insurable
Earnings
Ceiling
Average
Insurable
Earnings Employment
Total
Number of
Injuries
Total Injury
Rate
2004 $8,659,826,046 $66,800 $45,966 188,396 24,012 12.75%
2005 $8,747,266,560 $67,700 $46,262 189,081 23,432 12.39%
2006 $8,598,152,763 $69,400 $48,847 176,022 20,860 11.85%
2007 $8,231,332,066 $71,800 $50,454 163,145 17,672 10.83%
2008 $7,097,706,004 $73,300 $51,134 138,806 13,972 10.07%
2009 $5,137,062,000 $74,600 $50,862 101,000 8,974 8.89%
2010 $5,193,741,631 $77,600 $51,172 101,495 8,531 8.41%
2011 $5,294,086,922 $79,600 $51,699 102,403 8,125 7.93%
* Experience for rate groups 361, 390, 419, 421, 424 and 425 has been combined in order to determine a common 2011 Premium Rate.
Section 6D - ©WSIB Ontario 158

2011 PREMIUM RATES
6-YEAR HISTORICAL SUMMARY AND 2-YEAR PROJECTION
RATE GROUP 420: MOTOR VEHICLE ENGINE MANUFACTURING
(CLASS D: MANUFACTURING)
Year
Insurable
Earnings
Maximum
Insurable
Earnings
Ceiling
Average
Insurable
Earnings Employment
Total
Number of
Injuries
Total Injury
Rate
2004 $914,239,424 $66,800 $50,721 18,025 1,231 6.83%
2005 $844,859,221 $67,700 $49,505 17,066 1,099 6.44%
2006 $811,738,430 $69,400 $52,293 15,523 1,036 6.67%
2007 $776,742,675 $71,800 $50,415 15,407 897 5.82%
2008 $663,308,040 $73,300 $53,805 12,328 725 5.88%
2009 $531,049,530 $74,600 $56,166 9,455 464 4.91%
2010 $536,908,850 $77,600 $56,511 9,501 451 4.75%
2011 $547,282,157 $79,600 $57,092 9,586 438 4.57%
Section 6D - ©WSIB Ontario 159

2011 PREMIUM RATES
6-YEAR HISTORICAL SUMMARY AND 2-YEAR PROJECTION
RATE GROUP 421: OTHER MOTOR VEHICLE PARTS AND EQUIPMENT*
(CLASS D: MANUFACTURING)
Year
Insurable
Earnings
Maximum
Insurable
Earnings
Ceiling
Average
Insurable
Earnings Employment
Total
Number of
Injuries
Total Injury
Rate
2004 $8,659,826,046 $66,800 $45,966 188,396 24,012 12.75%
2005 $8,747,266,560 $67,700 $46,262 189,081 23,432 12.39%
2006 $8,598,152,763 $69,400 $48,847 176,022 20,860 11.85%
2007 $8,231,332,066 $71,800 $50,454 163,145 17,672 10.83%
2008 $7,097,706,004 $73,300 $51,134 138,806 13,972 10.07%
2009 $5,137,062,000 $74,600 $50,862 101,000 8,974 8.89%
2010 $5,193,741,631 $77,600 $51,172 101,495 8,531 8.41%
2011 $5,294,086,922 $79,600 $51,699 102,403 8,125 7.93%
* Experience for rate groups 361, 390, 419, 421, 424 and 425 has been combined in order to determine a common 2011 Premium Rate.
Section 6D - ©WSIB Ontario 160

2011 PREMIUM RATES
6-YEAR HISTORICAL SUMMARY AND 2-YEAR PROJECTION
RATE GROUP 424: MOTOR VEHICLE STAMPINGS*
(CLASS D: MANUFACTURING)
Year
Insurable
Earnings
Maximum
Insurable
Earnings
Ceiling
Average
Insurable
Earnings Employment
Total
Number of
Injuries
Total Injury
Rate
2004 $8,659,826,046 $66,800 $45,966 188,396 24,012 12.75%
2005 $8,747,266,560 $67,700 $46,262 189,081 23,432 12.39%
2006 $8,598,152,763 $69,400 $48,847 176,022 20,860 11.85%
2007 $8,231,332,066 $71,800 $50,454 163,145 17,672 10.83%
2008 $7,097,706,004 $73,300 $51,134 138,806 13,972 10.07%
2009 $5,137,062,000 $74,600 $50,862 101,000 8,974 8.89%
2010 $5,193,741,631 $77,600 $51,172 101,495 8,531 8.41%
2011 $5,294,086,922 $79,600 $51,699 102,403 8,125 7.93%
* Experience for rate groups 361, 390, 419, 421, 424 and 425 has been combined in order to determine a common 2011 Premium Rate.
Section 6D - ©WSIB Ontario 161

2011 PREMIUM RATES
6-YEAR HISTORICAL SUMMARY AND 2-YEAR PROJECTION
RATE GROUP 425: MOTOR VEHICLE WHEELS AND BRAKES*
(CLASS D: MANUFACTURING)
Year
Insurable
Earnings
Maximum
Insurable
Earnings
Ceiling
Average
Insurable
Earnings Employment
Total
Number of
Injuries
Total Injury
Rate
2004 $8,659,826,046 $66,800 $45,966 188,396 24,012 12.75%
2005 $8,747,266,560 $67,700 $46,262 189,081 23,432 12.39%
2006 $8,598,152,763 $69,400 $48,847 176,022 20,860 11.85%
2007 $8,231,332,066 $71,800 $50,454 163,145 17,672 10.83%
2008 $7,097,706,004 $73,300 $51,134 138,806 13,972 10.07%
2009 $5,137,062,000 $74,600 $50,862 101,000 8,974 8.89%
2010 $5,193,741,631 $77,600 $51,172 101,495 8,531 8.41%
2011 $5,294,086,922 $79,600 $51,699 102,403 8,125 7.93%
* Experience for rate groups 361, 390, 419, 421, 424 and 425 has been combined in order to determine a common 2011 Premium Rate.
Section 6D - ©WSIB Ontario 162

2011 PREMIUM RATES
6-YEAR HISTORICAL SUMMARY AND 2-YEAR PROJECTION
RATE GROUP 428: MOTOR VEHICLE FABRIC ACCESSORIES
(CLASS D: MANUFACTURING)
Year
Insurable
Earnings
Maximum
Insurable
Earnings
Ceiling
Average
Insurable
Earnings Employment
Total
Number of
Injuries
Total Injury
Rate
2004 $468,187,826 $66,800 $44,492 10,523 1,283 12.19%
2005 $465,428,862 $67,700 $44,624 10,430 1,403 13.45%
2006 $440,909,251 $69,400 $44,790 9,844 1,395 14.17%
2007 $413,904,470 $71,800 $50,249 8,237 1,276 15.49%
2008 $342,242,076 $73,300 $49,074 6,974 933 13.38%
2009 $236,206,670 $74,600 $50,065 4,718 641 13.59%
2010 $238,812,850 $77,600 $50,372 4,741 649 13.69%
2011 $243,426,816 $79,600 $50,894 4,783 658 13.76%
Section 6D - ©WSIB Ontario 163

2011 PREMIUM RATES
6-YEAR HISTORICAL SUMMARY AND 2-YEAR PROJECTION
RATE GROUP 432: TRUCKS, BUSES AND TRAILERS
(CLASS D: MANUFACTURING)
Year
Insurable
Earnings
Maximum
Insurable
Earnings
Ceiling
Average
Insurable
Earnings Employment
Total
Number of
Injuries
Total Injury
Rate
2004 $179,148,157 $66,800 $37,369 4,794 1,024 21.36%
2005 $176,658,661 $67,700 $36,394 4,854 997 20.54%
2006 $176,876,979 $69,400 $38,277 4,621 807 17.46%
2007 $173,599,715 $71,800 $40,028 4,337 715 16.49%
2008 $172,654,488 $73,300 $41,226 4,188 561 13.40%
2009 $151,410,400 $74,600 $42,400 3,571 421 11.79%
2010 $153,080,982 $77,600 $42,665 3,588 392 10.93%
2011 $156,038,571 $79,600 $43,105 3,620 365 10.08%
Section 6D - ©WSIB Ontario 164

2011 PREMIUM RATES
6-YEAR HISTORICAL SUMMARY AND 2-YEAR PROJECTION
RATE GROUP 442: RAILROAD ROLLING STOCK
(CLASS D: MANUFACTURING)
Year
Insurable
Earnings
Maximum
Insurable
Earnings
Ceiling
Average
Insurable
Earnings Employment
Total
Number of
Injuries
Total Injury
Rate
2004 $322,006,656 $66,800 $48,796 6,599 901 13.65%
2005 $372,202,567 $67,700 $46,514 8,002 1,130 14.12%
2006 $383,049,897 $69,400 $47,495 8,065 1,050 13.02%
2007 $372,130,973 $71,800 $46,703 7,968 665 8.35%
2008 $384,085,422 $73,300 $47,754 8,043 640 7.96%
2009 $306,930,261 $74,600 $51,249 5,989 413 6.90%
2010 $324,592,724 $77,600 $53,776 6,036 385 6.38%
2011 $327,332,264 $79,600 $53,802 6,084 359 5.90%
Section 6D - ©WSIB Ontario 165

2011 PREMIUM RATES
6-YEAR HISTORICAL SUMMARY AND 2-YEAR PROJECTION
RATE GROUP 460: LIGHTING AND SMALL ELECTRICAL APPLIANCES
(CLASS D: MANUFACTURING)
Year
Insurable
Earnings
Maximum
Insurable
Earnings
Ceiling
Average
Insurable
Earnings Employment
Total
Number of
Injuries
Total Injury
Rate
2004 $191,612,383 $66,800 $32,946 5,816 430 7.39%
2005 $196,038,446 $67,700 $34,219 5,729 480 8.38%
2006 $183,844,809 $69,400 $34,662 5,304 421 7.94%
2007 $163,520,772 $71,800 $34,888 4,687 335 7.15%
2008 $152,854,374 $73,300 $38,271 3,994 292 7.31%
2009 $136,067,246 $74,600 $35,278 3,857 228 5.91%
2010 $143,897,307 $77,600 $37,020 3,887 231 5.94%
2011 $145,111,790 $79,600 $37,037 3,918 234 5.97%
Section 6D - ©WSIB Ontario 166

2011 PREMIUM RATES
6-YEAR HISTORICAL SUMMARY AND 2-YEAR PROJECTION
RATE GROUP 466: COMMUNICATION AND ENERGY WIRE PRODUCTS
(CLASS D: MANUFACTURING)
Year
Insurable
Earnings
Maximum
Insurable
Earnings
Ceiling
Average
Insurable
Earnings Employment
Total
Number of
Injuries
Total Injury
Rate
2004 $218,209,980 $66,800 $35,383 6,167 435 7.05%
2005 $213,608,318 $67,700 $35,489 6,019 405 6.73%
2006 $206,236,672 $69,400 $35,074 5,880 361 6.14%
2007 $181,367,658 $71,800 $37,644 4,818 324 6.72%
2008 $178,829,251 $73,300 $35,279 5,069 250 4.93%
2009 $156,771,945 $74,600 $36,081 4,345 210 4.83%
2010 $161,729,046 $77,600 $36,933 4,379 200 4.57%
2011 $167,192,754 $79,600 $37,878 4,414 190 4.30%
Section 6D - ©WSIB Ontario 167

2011 PREMIUM RATES
6-YEAR HISTORICAL SUMMARY AND 2-YEAR PROJECTION
RATE GROUP 468: ELECTRONIC EQUIPMENT & OTHER COMMUNICATION DEVICES
(CLASS D: MANUFACTURING)
Year
Insurable
Earnings
Maximum
Insurable
Earnings
Ceiling
Average
Insurable
Earnings Employment
Total
Number of
Injuries
Total Injury
Rate
2004 $2,822,504,481 $66,800 $32,924 85,728 845 0.99%
2005 $2,843,621,810 $67,700 $34,112 83,361 958 1.15%
2006 $2,980,897,255 $69,400 $31,900 93,445 985 1.05%
2007 $3,067,530,283 $71,800 $33,265 92,215 855 0.93%
2008 $3,059,331,380 $73,300 $37,670 81,214 696 0.86%
2009 $3,024,220,628 $74,600 $38,174 79,222 570 0.72%
2010 $3,119,845,944 $77,600 $39,072 79,848 555 0.70%
2011 $3,225,244,003 $79,600 $40,074 80,483 540 0.67%
Section 6D - ©WSIB Ontario 168

2011 PREMIUM RATES
6-YEAR HISTORICAL SUMMARY AND 2-YEAR PROJECTION
RATE GROUP 477: INDUSTRIAL ELECTRICAL EQUIPMENT
(CLASS D: MANUFACTURING)
Year
Insurable
Earnings
Maximum
Insurable
Earnings
Ceiling
Average
Insurable
Earnings Employment
Total
Number of
Injuries
Total Injury
Rate
2004 $486,726,070 $66,800 $36,410 13,368 643 4.81%
2005 $497,307,038 $67,700 $38,470 12,927 561 4.34%
2006 $593,398,039 $69,400 $38,158 15,551 637 4.10%
2007 $611,684,131 $71,800 $41,199 14,847 577 3.89%
2008 $641,149,076 $73,300 $42,242 15,178 495 3.26%
2009 $582,086,118 $74,600 $44,738 13,011 406 3.12%
2010 $600,491,577 $77,600 $45,790 13,114 379 2.89%
2011 $620,778,042 $79,600 $46,965 13,218 353 2.67%
Section 6D - ©WSIB Ontario 169

2011 PREMIUM RATES
6-YEAR HISTORICAL SUMMARY AND 2-YEAR PROJECTION
RATE GROUP 485: BRICKS, CERAMICS AND ABRASIVES
(CLASS D: MANUFACTURING)
Year
Insurable
Earnings
Maximum
Insurable
Earnings
Ceiling
Average
Insurable
Earnings Employment
Total
Number of
Injuries
Total Injury
Rate
2004 $108,879,277 $66,800 $37,558 2,899 346 11.94%
2005 $108,462,866 $67,700 $40,623 2,670 292 10.94%
2006 $100,517,714 $69,400 $38,498 2,611 241 9.23%
2007 $101,563,247 $71,800 $44,235 2,296 222 9.67%
2008 $98,440,434 $73,300 $44,766 2,199 191 8.69%
2009 $82,719,315 $74,600 $46,655 1,773 109 6.15%
2010 $85,806,822 $77,600 $48,017 1,787 102 5.71%
2011 $88,217,761 $79,600 $48,983 1,801 95 5.27%
Section 6D - ©WSIB Ontario 170

2011 PREMIUM RATES
6-YEAR HISTORICAL SUMMARY AND 2-YEAR PROJECTION
RATE GROUP 496: CONCRETE PRODUCTS
(CLASS D: MANUFACTURING)
Year
Insurable
Earnings
Maximum
Insurable
Earnings
Ceiling
Average
Insurable
Earnings Employment
Total
Number of
Injuries
Total Injury
Rate
2004 $195,199,777 $66,800 $37,380 5,222 924 17.69%
2005 $206,555,448 $67,700 $38,061 5,427 972 17.91%
2006 $211,767,518 $69,400 $41,168 5,144 833 16.19%
2007 $214,751,294 $71,800 $40,359 5,321 833 15.65%
2008 $219,700,452 $73,300 $42,652 5,151 681 13.22%
2009 $199,040,232 $74,600 $41,484 4,798 492 10.25%
2010 $210,494,106 $77,600 $43,526 4,836 469 9.70%
2011 $212,270,661 $79,600 $43,552 4,874 446 9.15%
Section 6D - ©WSIB Ontario 171

2011 PREMIUM RATES
6-YEAR HISTORICAL SUMMARY AND 2-YEAR PROJECTION
RATE GROUP 497: READY-MIX CONCRETE
(CLASS D: MANUFACTURING)
Year
Insurable
Earnings
Maximum
Insurable
Earnings
Ceiling
Average
Insurable
Earnings Employment
Total
Number of
Injuries
Total Injury
Rate
2004 $200,850,519 $66,800 $49,888 4,026 463 11.50%
2005 $209,827,004 $67,700 $47,354 4,431 456 10.29%
2006 $213,676,114 $69,400 $50,887 4,199 403 9.60%
2007 $227,692,661 $71,800 $51,526 4,419 348 7.88%
2008 $236,106,774 $73,300 $51,006 4,629 360 7.78%
2009 $214,928,570 $74,600 $52,345 4,106 295 7.18%
2010 $215,419,434 $77,600 $53,269 4,044 269 6.65%
2011 $219,394,764 $79,600 $53,879 4,072 250 6.14%
Section 6D - ©WSIB Ontario 172

2011 PREMIUM RATES
6-YEAR HISTORICAL SUMMARY AND 2-YEAR PROJECTION
RATE GROUP 501: NON-METALLIC MINERAL PRODUCTS
(CLASS D: MANUFACTURING)
Year
Insurable
Earnings
Maximum
Insurable
Earnings
Ceiling
Average
Insurable
Earnings Employment
Total
Number of
Injuries
Total Injury
Rate
2004 $269,440,911 $66,800 $41,523 6,489 501 7.72%
2005 $286,456,538 $67,700 $40,969 6,992 536 7.67%
2006 $303,893,217 $69,400 $42,372 7,172 502 7.00%
2007 $316,834,606 $71,800 $40,961 7,735 498 6.44%
2008 $323,379,810 $73,300 $43,641 7,410 471 6.36%
2009 $289,752,372 $74,600 $46,242 6,266 375 5.98%
2010 $306,426,324 $77,600 $48,524 6,315 358 5.67%
2011 $309,012,541 $79,600 $48,549 6,365 340 5.34%
Section 6D - ©WSIB Ontario 173

2011 PREMIUM RATES
6-YEAR HISTORICAL SUMMARY AND 2-YEAR PROJECTION
RATE GROUP 502: GLASS PRODUCTS
(CLASS D: MANUFACTURING)
Year
Insurable
Earnings
Maximum
Insurable
Earnings
Ceiling
Average
Insurable
Earnings Employment
Total
Number of
Injuries
Total Injury
Rate
2004 $233,710,988 $66,800 $35,293 6,622 567 8.56%
2005 $215,790,729 $67,700 $37,321 5,782 556 9.62%
2006 $207,786,820 $69,400 $36,358 5,715 503 8.80%
2007 $201,506,483 $71,800 $40,874 4,930 499 10.12%
2008 $190,743,406 $73,300 $39,361 4,846 406 8.38%
2009 $143,087,796 $74,600 $37,764 3,789 314 8.29%
2010 $151,321,859 $77,600 $39,623 3,819 319 8.35%
2011 $152,599,004 $79,600 $39,646 3,849 323 8.39%
Section 6D - ©WSIB Ontario 174

2011 PREMIUM RATES
6-YEAR HISTORICAL SUMMARY AND 2-YEAR PROJECTION
RATE GROUP 507: PETROLEUM AND COAL PRODUCTS
(CLASS D: MANUFACTURING)
Year
Insurable
Earnings
Maximum
Insurable
Earnings
Ceiling
Average
Insurable
Earnings Employment
Total
Number of
Injuries
Total Injury
Rate
2004 $527,205,995 $66,800 $49,111 10,735 305 2.84%
2005 $522,541,542 $67,700 $52,134 10,023 280 2.79%
2006 $498,583,265 $69,400 $53,143 9,382 251 2.68%
2007 $500,889,451 $71,800 $57,593 8,697 248 2.85%
2008 $520,572,238 $73,300 $51,886 10,033 238 2.37%
2009 $521,299,108 $74,600 $51,178 10,186 221 2.17%
2010 $526,466,397 $77,600 $52,265 10,073 216 2.14%
2011 $531,080,733 $79,600 $53,204 9,982 210 2.10%
Section 6D - ©WSIB Ontario 175

2011 PREMIUM RATES
6-YEAR HISTORICAL SUMMARY AND 2-YEAR PROJECTION
RATE GROUP 512: RESINS, PAINT, INK AND ADHESIVES
(CLASS D: MANUFACTURING)
Year
Insurable
Earnings
Maximum
Insurable
Earnings
Ceiling
Average
Insurable
Earnings Employment
Total
Number of
Injuries
Total Injury
Rate
2004 $604,862,700 $66,800 $35,912 16,843 672 3.99%
2005 $591,710,997 $67,700 $38,301 15,449 697 4.51%
2006 $590,734,873 $69,400 $39,527 14,945 609 4.07%
2007 $572,252,683 $71,800 $39,862 14,356 580 4.04%
2008 $536,419,120 $73,300 $39,632 13,535 462 3.41%
2009 $456,983,296 $74,600 $42,064 10,864 358 3.30%
2010 $461,513,066 $77,600 $42,959 10,743 342 3.18%
2011 $465,558,103 $79,600 $43,731 10,646 327 3.07%
Section 6D - ©WSIB Ontario 176

2011 PREMIUM RATES
6-YEAR HISTORICAL SUMMARY AND 2-YEAR PROJECTION
RATE GROUP 514: PHARMACEUTICALS AND MEDICINES
(CLASS D: MANUFACTURING)
Year
Insurable
Earnings
Maximum
Insurable
Earnings
Ceiling
Average
Insurable
Earnings Employment
Total
Number of
Injuries
Total Injury
Rate
2004 $944,517,559 $66,800 $40,305 23,434 712 3.04%
2005 $952,914,098 $67,700 $39,933 23,863 772 3.24%
2006 $1,020,088,701 $69,400 $41,786 24,412 727 2.98%
2007 $1,028,151,938 $71,800 $43,751 23,500 748 3.18%
2008 $1,040,106,512 $73,300 $43,724 23,788 745 3.13%
2009 $1,032,582,394 $74,600 $48,157 21,442 617 2.88%
2010 $1,042,817,693 $77,600 $49,180 21,204 614 2.90%
2011 $1,051,957,708 $79,600 $50,065 21,012 612 2.91%
Section 6D - ©WSIB Ontario 177

2011 PREMIUM RATES
6-YEAR HISTORICAL SUMMARY AND 2-YEAR PROJECTION
RATE GROUP 517: SOAP AND TOILETRIES
(CLASS D: MANUFACTURING)
Year
Insurable
Earnings
Maximum
Insurable
Earnings
Ceiling
Average
Insurable
Earnings Employment
Total
Number of
Injuries
Total Injury
Rate
2004 $362,460,985 $66,800 $31,745 11,418 494 4.33%
2005 $377,696,103 $67,700 $31,997 11,804 448 3.80%
2006 $373,418,347 $69,400 $32,075 11,642 416 3.57%
2007 $377,574,823 $71,800 $34,554 10,927 400 3.66%
2008 $367,114,320 $73,300 $34,374 10,680 301 2.82%
2009 $342,334,970 $74,600 $31,730 10,789 271 2.51%
2010 $345,728,308 $77,600 $32,405 10,669 248 2.32%
2011 $348,758,523 $79,600 $32,989 10,572 227 2.15%
Section 6D - ©WSIB Ontario 178

2011 PREMIUM RATES
6-YEAR HISTORICAL SUMMARY AND 2-YEAR PROJECTION
RATE GROUP 524: CHEMICAL INDUSTRIES
(CLASS D: MANUFACTURING)
Year
Insurable
Earnings
Maximum
Insurable
Earnings
Ceiling
Average
Insurable
Earnings Employment
Total
Number of
Injuries
Total Injury
Rate
2004 $572,063,691 $66,800 $42,488 13,464 678 5.04%
2005 $560,137,976 $67,700 $40,672 13,772 614 4.46%
2006 $583,889,986 $69,400 $43,558 13,405 540 4.03%
2007 $606,534,567 $71,800 $45,683 13,277 529 3.98%
2008 $609,967,040 $73,300 $44,329 13,760 493 3.58%
2009 $554,266,328 $74,600 $43,736 12,673 408 3.22%
2010 $559,760,399 $77,600 $44,666 12,532 373 2.98%
2011 $564,666,547 $79,600 $45,468 12,419 342 2.75%
Section 6D - ©WSIB Ontario 179

2011 PREMIUM RATES
6-YEAR HISTORICAL SUMMARY AND 2-YEAR PROJECTION
RATE GROUP 529: JEWELRY AND INSTRUMENTS
(CLASS D: MANUFACTURING)
Year
Insurable
Earnings
Maximum
Insurable
Earnings
Ceiling
Average
Insurable
Earnings Employment
Total
Number of
Injuries
Total Injury
Rate
2004 $719,373,037 $66,800 $31,667 22,717 510 2.25%
2005 $730,812,473 $67,700 $31,616 23,115 498 2.15%
2006 $720,618,360 $69,400 $34,609 20,822 452 2.17%
2007 $761,214,062 $71,800 $31,865 23,889 413 1.73%
2008 $811,397,496 $73,300 $34,684 23,394 430 1.84%
2009 $810,353,052 $74,600 $34,803 23,284 322 1.38%
2010 $835,976,270 $77,600 $35,622 23,468 307 1.31%
2011 $864,218,138 $79,600 $36,534 23,655 292 1.23%
Section 6D - ©WSIB Ontario 180

2011 PREMIUM RATES
6-YEAR HISTORICAL SUMMARY AND 2-YEAR PROJECTION
RATE GROUP 533: SIGNS AND DISPLAYS
(CLASS D: MANUFACTURING)
Year
Insurable
Earnings
Maximum
Insurable
Earnings
Ceiling
Average
Insurable
Earnings Employment
Total
Number of
Injuries
Total Injury
Rate
2004 $228,040,049 $66,800 $32,494 7,018 461 6.57%
2005 $225,447,746 $67,700 $34,148 6,602 443 6.71%
2006 $230,764,610 $69,400 $35,794 6,447 400 6.20%
2007 $238,748,755 $71,800 $34,571 6,906 368 5.33%
2008 $245,408,128 $73,300 $35,392 6,934 319 4.60%
2009 $228,464,223 $74,600 $35,939 6,357 267 4.20%
2010 $241,611,316 $77,600 $37,711 6,407 249 3.89%
2011 $243,650,499 $79,600 $37,728 6,458 232 3.59%
Section 6D - ©WSIB Ontario 181

2011 PREMIUM RATES
6-YEAR HISTORICAL SUMMARY AND 2-YEAR PROJECTION
RATE GROUP 538: SPORTING GOODS AND TOYS
(CLASS D: MANUFACTURING)
Year
Insurable
Earnings
Maximum
Insurable
Earnings
Ceiling
Average
Insurable
Earnings Employment
Total
Number of
Injuries
Total Injury
Rate
2004 $74,043,883 $66,800 $28,788 2,572 155 6.03%
2005 $64,321,708 $67,700 $27,464 2,342 152 6.49%
2006 $65,637,395 $69,400 $29,700 2,210 147 6.65%
2007 $64,636,236 $71,800 $28,881 2,238 128 5.72%
2008 $62,027,975 $73,300 $29,893 2,075 89 4.29%
2009 $56,368,620 $74,600 $30,870 1,826 99 5.42%
2010 $58,472,585 $77,600 $31,779 1,840 92 5.00%
2011 $60,115,506 $79,600 $32,407 1,855 86 4.64%
Section 6D - ©WSIB Ontario 182

2011 PREMIUM RATES
6-YEAR HISTORICAL SUMMARY AND 2-YEAR PROJECTION
RATE GROUP 542: OTHER MANUFACTURED PRODUCTS
(CLASS D: MANUFACTURING)
Year
Insurable
Earnings
Maximum
Insurable
Earnings
Ceiling
Average
Insurable
Earnings Employment
Total
Number of
Injuries
Total Injury
Rate
2004 $143,230,924 $66,800 $24,125 5,937 236 3.98%
2005 $120,212,694 $67,700 $28,153 4,270 204 4.78%
2006 $121,404,564 $69,400 $27,436 4,425 176 3.98%
2007 $122,043,368 $71,800 $26,589 4,590 139 3.03%
2008 $121,769,474 $73,300 $32,611 3,734 101 2.70%
2009 $109,142,460 $74,600 $30,555 3,572 92 2.58%
2010 $112,593,525 $77,600 $31,276 3,600 86 2.39%
2011 $116,397,283 $79,600 $32,074 3,629 80 2.20%
Section 6D - ©WSIB Ontario 183

2011 PREMIUM RATES
6-YEAR HISTORICAL SUMMARY AND 2-YEAR PROJECTION
CLASS D: MANUFACTURING
Year
Insurable
Earnings
Maximum
Insurable
Earnings
Ceiling
Average
Insurable
Earnings Employment
Total
Number of
Injuries
Total Injury
Rate
2004 $41,483,297,021 $66,800 $37,715 1,099,922 92,696 8.43%
2005 $41,773,805,756 $67,700 $38,370 1,088,713 90,291 8.29%
2006 $41,873,055,858 $69,400 $39,015 1,073,267 81,883 7.63%
2007 $41,287,525,642 $71,800 $40,187 1,027,392 72,401 7.05%
2008 $39,633,979,380 $73,300 $41,039 965,765 61,654 6.38%
2009 $34,481,318,556 $74,600 $41,150 837,946 45,043 5.38%
2010 $35,305,464,336 $77,600 $42,147 837,678 42,785 5.11%
2011 $35,871,899,445 $79,600 $42,641 841,246 40,804 4.85%
Section 6D - ©WSIB Ontario 184

2011 PREMIUM RATESNEW CLAIMS COST BY RATE GROUP
2011 New Claims Cost 2011
Rate
Group Description Cost Index *
(%)
Cost per Claim
($)
Premium
Rate
($)
207 MEAT AND FISH PRODUCTS 79% 6,933 4.46
210 POULTRY PRODUCTS 68% 5,970 3.35
214 FRUIT AND VEGETABLE PRODUCTS 74% 6,462 2.57
216 DAIRY PRODUCTS 77% 6,773 2.17
220 OTHER BAKERY PRODUCTS 117% 10,285 3.83
222 CONFECTIONERY 89% 7,845 1.73
223 BISCUITS, SNACK FOODS AND OTHER FOOD PRODUCTS 96% 8,444 2.68
226 CRUSHED AND GROUND FOODS 78% 6,851 1.62
230 ALCOHOLIC BEVERAGES 64% 5,606 1.49
231 SOFT DRINKS 95% 8,372 3.43
238 OTHER RUBBER PRODUCTS 93% 8,196 3.95
258 FOAMED AND EXPANDED PLASTIC PRODUCTS 112% 9,886 2.79
261 PLASTIC FILM AND SHEETING 88% 7,711 2.35
263 OTHER PLASTIC PRODUCTS 87% 7,678 3.09
289 CLOTH, CARPETS AND TEXTILE PRODUCTS 152% 13,355 3.55
301 CLOTHING, FIBRE AND YARN 124% 10,887 2.32
308 MILLWORK AND OTHER WOOD INDUSTRIES 97% 8,543 5.33
311 WOODEN CABINETS 136% 11,949 3.98
312 WOODEN BOXES AND PALLETS 93% 8,148 6.83
* The Cost Index compares the average cost of a claim for a Rate Group to that of the Class.Section 6D - ©WSIB Ontario 185

2011 PREMIUM RATESNEW CLAIMS COST BY RATE GROUP
2011 New Claims Cost 2011
Rate
Group Description Cost Index *
(%)
Cost per Claim
($)
Premium
Rate
($)
322 UPHOLSTERED FURNITURE 209% 18,367 3.20
323 METAL FURNITURE 102% 9,006 2.24
325 WOODEN AND OTHER NON-METAL FURNITURE 115% 10,116 4.12
328 FURNITURE PARTS AND FIXTURES 138% 12,126 3.99
333 PRINTING, PLATEMAKING AND BINDING 109% 9,549 1.68
335 PUBLISHING 86% 7,590 0.54
338 FOLDING CARTONS 89% 7,841 2.54
341 PAPER PRODUCTS 113% 9,938 3.05
352 STEEL AND OTHER SMELTING AND REFINING INDUSTRIES 114% 10,045 2.51
358 FOUNDRIES 62% 5,440 4.11
361 NON-FERROUS METAL INDUSTRIES 103% 9,077 3.44
374 DOORS AND WINDOWS 94% 8,259 3.41
375 STRUCTURAL AND ARCHITECTURAL PRODUCTS 80% 7,015 4.51
377 COATING OF METAL PRODUCTS 117% 10,272 4.01
379 HARDWARE, TOOLS AND CUTLERY 116% 10,172 2.63
382 METAL DIES, MOULDS AND PATTERNS 65% 5,681 2.13
383 HEATING, REFRIGERATION AND AIR CONDITIONING EQUIPMENT 60% 5,288 2.67
385 MACHINE SHOPS 92% 8,075 2.50
387 OTHER METAL FABRICATING INDUSTRIES 95% 8,354 3.52
389 METAL CLOSURES AND CONTAINERS 91% 7,973 2.48
* The Cost Index compares the average cost of a claim for a Rate Group to that of the Class.Section 6D - ©WSIB Ontario 186

2011 PREMIUM RATESNEW CLAIMS COST BY RATE GROUP
2011 New Claims Cost 2011
Rate
Group Description Cost Index *
(%)
Cost per Claim
($)
Premium
Rate
($)
390 OTHER STAMPED AND PRESSED METAL PRODUCTS 103% 9,077 3.44
393 WIRE PRODUCTS 100% 8,792 3.23
402 MAJOR APPLIANCES AND TRANSMISSION EQUIPMENT 96% 8,470 2.23
403 OTHER MACHINERY AND EQUIPMENT 85% 7,476 1.67
406 ELEVATORS AND ESCALATORS 90% 7,903 2.59
408 BOILERS, PUMPS AND FANS 103% 9,069 2.35
411 AGRICULTURAL, CONSTRUCTION AND MINING MACHINERY 71% 6,267 2.76
417 AIRCRAFT MANUFACTURING 66% 5,821 1.50
419 MOTOR VEHICLE ASSEMBLY 103% 9,077 3.44
420 MOTOR VEHICLE ENGINE MANUFACTURING 98% 8,622 1.81
421 OTHER MOTOR VEHICLE PARTS AND EQUIPMENT 103% 9,077 3.44
424 MOTOR VEHICLE STAMPINGS 103% 9,077 3.44
425 MOTOR VEHICLE WHEELS AND BRAKES 103% 9,077 3.44
428 MOTOR VEHICLE FABRIC ACCESSORIES 76% 6,666 4.38
432 TRUCKS, BUSES AND TRAILERS 84% 7,368 4.21
442 RAILROAD ROLLING STOCK 108% 9,490 2.63
460 LIGHTING AND SMALL ELECTRICAL APPLIANCES 71% 6,225 2.54
466 COMMUNICATION AND ENERGY WIRE PRODUCTS 92% 8,068 2.34
468 ELECTRONIC EQUIPMENT & OTHER COMMUNICATION DEVICES 93% 8,136 0.39
477 INDUSTRIAL ELECTRICAL EQUIPMENT 110% 9,678 1.49
* The Cost Index compares the average cost of a claim for a Rate Group to that of the Class.Section 6D - ©WSIB Ontario 187

2011 PREMIUM RATESNEW CLAIMS COST BY RATE GROUP
2011 New Claims Cost 2011
Rate
Group Description Cost Index *
(%)
Cost per Claim
($)
Premium
Rate
($)
485 BRICKS, CERAMICS AND ABRASIVES 188% 16,512 4.34
496 CONCRETE PRODUCTS 116% 10,227 5.19
497 READY-MIX CONCRETE 151% 13,266 3.76
501 NON-METALLIC MINERAL PRODUCTS 119% 10,416 2.87
502 GLASS PRODUCTS 63% 5,537 2.92
507 PETROLEUM AND COAL PRODUCTS 117% 10,309 1.13
512 RESINS, PAINT, INK AND ADHESIVES 103% 9,014 1.68
514 PHARMACEUTICALS AND MEDICINES 64% 5,661 0.92
517 SOAP AND TOILETRIES 105% 9,219 1.61
524 CHEMICAL INDUSTRIES 135% 11,855 1.88
529 JEWELRY AND INSTRUMENTS 118% 10,376 0.98
533 SIGNS AND DISPLAYS 147% 12,903 3.06
538 SPORTING GOODS AND TOYS 133% 11,707 4.10
542 OTHER MANUFACTURED PRODUCTS 130% 11,447 2.04
CLASS D MANUFACTURING 8,389 2.41
* The Cost Index compares the average cost of a claim for a Rate Group to that of the Class.Section 6D - ©WSIB Ontario 188

2011 PREMIUM RATES
SUB-COMPONENTS OF OVERHEAD EXPENSES
RATE GROUP 207: MEAT AND FISH PRODUCTS
(CLASS D: MANUFACTURING)
Overhead Expenses
Component
Overhead Expenses
Sub-Component
Premium Rate
Component
B.1 WSIB Administrative 0.405
B.2 Legislative Obligations
WSIAT 0.021
Office of Worker Advisor 0.010
Office of Employer Advisor 0.003
OHSA 0.099
Mine Rescue 0.000
Construction Certification Training 0.000
Program Administration 0.001
Institute of Work & Health 0.004
Sub-Total 0.138
B.3 Prevention Workplace Safety and
Prevention Services
0.060
B.4 TOTAL OVERHEAD EXPENSES 0.603
Section 6D - ©WSIB Ontario 189

2011 PREMIUM RATES
SUB-COMPONENTS OF OVERHEAD EXPENSES
RATE GROUP 210: POULTRY PRODUCTS
(CLASS D: MANUFACTURING)
Overhead Expenses
Component
Overhead Expenses
Sub-Component
Premium Rate
Component
B.1 WSIB Administrative 0.337
B.2 Legislative Obligations
WSIAT 0.017
Office of Worker Advisor 0.008
Office of Employer Advisor 0.003
OHSA 0.083
Mine Rescue 0.000
Construction Certification Training 0.000
Program Administration 0.000
Institute of Work & Health 0.003
Sub-Total 0.115
B.3 Prevention Workplace Safety and
Prevention Services
0.049
B.4 TOTAL OVERHEAD EXPENSES 0.501
Section 6D - ©WSIB Ontario 190

2011 PREMIUM RATES
SUB-COMPONENTS OF OVERHEAD EXPENSES
RATE GROUP 214: FRUIT AND VEGETABLE PRODUCTS
(CLASS D: MANUFACTURING)
Overhead Expenses
Component
Overhead Expenses
Sub-Component
Premium Rate
Component
B.1 WSIB Administrative 0.290
B.2 Legislative Obligations
WSIAT 0.015
Office of Worker Advisor 0.007
Office of Employer Advisor 0.002
OHSA 0.071
Mine Rescue 0.000
Construction Certification Training 0.000
Program Administration 0.000
Institute of Work & Health 0.003
Sub-Total 0.099
B.3 Prevention Workplace Safety and
Prevention Services
0.041
B.4 TOTAL OVERHEAD EXPENSES 0.430
Section 6D - ©WSIB Ontario 191

2011 PREMIUM RATES
SUB-COMPONENTS OF OVERHEAD EXPENSES
RATE GROUP 216: DAIRY PRODUCTS
(CLASS D: MANUFACTURING)
Overhead Expenses
Component
Overhead Expenses
Sub-Component
Premium Rate
Component
B.1 WSIB Administrative 0.265
B.2 Legislative Obligations
WSIAT 0.014
Office of Worker Advisor 0.007
Office of Employer Advisor 0.002
OHSA 0.065
Mine Rescue 0.000
Construction Certification Training 0.000
Program Administration 0.000
Institute of Work & Health 0.003
Sub-Total 0.090
B.3 Prevention Workplace Safety and
Prevention Services
0.037
B.4 TOTAL OVERHEAD EXPENSES 0.392
Section 6D - ©WSIB Ontario 192

2011 PREMIUM RATES
SUB-COMPONENTS OF OVERHEAD EXPENSES
RATE GROUP 220: OTHER BAKERY PRODUCTS
(CLASS D: MANUFACTURING)
Overhead Expenses
Component
Overhead Expenses
Sub-Component
Premium Rate
Component
B.1 WSIB Administrative 0.367
B.2 Legislative Obligations
WSIAT 0.019
Office of Worker Advisor 0.009
Office of Employer Advisor 0.003
OHSA 0.090
Mine Rescue 0.000
Construction Certification Training 0.000
Program Administration 0.001
Institute of Work & Health 0.004
Sub-Total 0.125
B.3 Prevention Workplace Safety and
Prevention Services
0.054
B.4 TOTAL OVERHEAD EXPENSES 0.546
Section 6D - ©WSIB Ontario 193

2011 PREMIUM RATES
SUB-COMPONENTS OF OVERHEAD EXPENSES
RATE GROUP 222: CONFECTIONERY
(CLASS D: MANUFACTURING)
Overhead Expenses
Component
Overhead Expenses
Sub-Component
Premium Rate
Component
B.1 WSIB Administrative 0.239
B.2 Legislative Obligations
WSIAT 0.012
Office of Worker Advisor 0.006
Office of Employer Advisor 0.002
OHSA 0.058
Mine Rescue 0.000
Construction Certification Training 0.000
Program Administration 0.000
Institute of Work & Health 0.002
Sub-Total 0.081
B.3 Prevention Workplace Safety and
Prevention Services
0.033
B.4 TOTAL OVERHEAD EXPENSES 0.353
Section 6D - ©WSIB Ontario 194

2011 PREMIUM RATES
SUB-COMPONENTS OF OVERHEAD EXPENSES
RATE GROUP 223: BISCUITS, SNACK FOODS AND OTHER FOOD PRODUCTS
(CLASS D: MANUFACTURING)
Overhead Expenses
Component
Overhead Expenses
Sub-Component
Premium Rate
Component
B.1 WSIB Administrative 0.297
B.2 Legislative Obligations
WSIAT 0.015
Office of Worker Advisor 0.007
Office of Employer Advisor 0.003
OHSA 0.072
Mine Rescue 0.000
Construction Certification Training 0.000
Program Administration 0.000
Institute of Work & Health 0.003
Sub-Total 0.101
B.3 Prevention Workplace Safety and
Prevention Services
0.042
B.4 TOTAL OVERHEAD EXPENSES 0.440
Section 6D - ©WSIB Ontario 195

2011 PREMIUM RATES
SUB-COMPONENTS OF OVERHEAD EXPENSES
RATE GROUP 226: CRUSHED AND GROUND FOODS
(CLASS D: MANUFACTURING)
Overhead Expenses
Component
Overhead Expenses
Sub-Component
Premium Rate
Component
B.1 WSIB Administrative 0.231
B.2 Legislative Obligations
WSIAT 0.012
Office of Worker Advisor 0.006
Office of Employer Advisor 0.002
OHSA 0.056
Mine Rescue 0.000
Construction Certification Training 0.000
Program Administration 0.000
Institute of Work & Health 0.002
Sub-Total 0.079
B.3 Prevention Workplace Safety and
Prevention Services
0.032
B.4 TOTAL OVERHEAD EXPENSES 0.342
Section 6D - ©WSIB Ontario 196

2011 PREMIUM RATES
SUB-COMPONENTS OF OVERHEAD EXPENSES
RATE GROUP 230: ALCOHOLIC BEVERAGES
(CLASS D: MANUFACTURING)
Overhead Expenses
Component
Overhead Expenses
Sub-Component
Premium Rate
Component
B.1 WSIB Administrative 0.224
B.2 Legislative Obligations
WSIAT 0.012
Office of Worker Advisor 0.006
Office of Employer Advisor 0.002
OHSA 0.054
Mine Rescue 0.000
Construction Certification Training 0.000
Program Administration 0.000
Institute of Work & Health 0.002
Sub-Total 0.076
B.3 Prevention Workplace Safety and
Prevention Services
0.030
B.4 TOTAL OVERHEAD EXPENSES 0.330
Section 6D - ©WSIB Ontario 197

2011 PREMIUM RATES
SUB-COMPONENTS OF OVERHEAD EXPENSES
RATE GROUP 231: SOFT DRINKS
(CLASS D: MANUFACTURING)
Overhead Expenses
Component
Overhead Expenses
Sub-Component
Premium Rate
Component
B.1 WSIB Administrative 0.342
B.2 Legislative Obligations
WSIAT 0.018
Office of Worker Advisor 0.009
Office of Employer Advisor 0.003
OHSA 0.084
Mine Rescue 0.000
Construction Certification Training 0.000
Program Administration 0.000
Institute of Work & Health 0.003
Sub-Total 0.117
B.3 Prevention Workplace Safety and
Prevention Services
0.050
B.4 TOTAL OVERHEAD EXPENSES 0.509
Section 6D - ©WSIB Ontario 198

2011 PREMIUM RATES
SUB-COMPONENTS OF OVERHEAD EXPENSES
RATE GROUP 238: OTHER RUBBER PRODUCTS
(CLASS D: MANUFACTURING)
Overhead Expenses
Component
Overhead Expenses
Sub-Component
Premium Rate
Component
B.1 WSIB Administrative 0.374
B.2 Legislative Obligations
WSIAT 0.019
Office of Worker Advisor 0.009
Office of Employer Advisor 0.003
OHSA 0.092
Mine Rescue 0.000
Construction Certification Training 0.000
Program Administration 0.001
Institute of Work & Health 0.004
Sub-Total 0.128
B.3 Prevention Workplace Safety and
Prevention Services
0.055
B.4 TOTAL OVERHEAD EXPENSES 0.557
Section 6D - ©WSIB Ontario 199

2011 PREMIUM RATES
SUB-COMPONENTS OF OVERHEAD EXPENSES
RATE GROUP 258: FOAMED AND EXPANDED PLASTIC PRODUCTS
(CLASS D: MANUFACTURING)
Overhead Expenses
Component
Overhead Expenses
Sub-Component
Premium Rate
Component
B.1 WSIB Administrative 0.303
B.2 Legislative Obligations
WSIAT 0.016
Office of Worker Advisor 0.008
Office of Employer Advisor 0.003
OHSA 0.074
Mine Rescue 0.000
Construction Certification Training 0.000
Program Administration 0.000
Institute of Work & Health 0.003
Sub-Total 0.103
B.3 Prevention Workplace Safety and
Prevention Services
0.043
B.4 TOTAL OVERHEAD EXPENSES 0.449
Section 6D - ©WSIB Ontario 200

2011 PREMIUM RATES
SUB-COMPONENTS OF OVERHEAD EXPENSES
RATE GROUP 261: PLASTIC FILM AND SHEETING
(CLASS D: MANUFACTURING)
Overhead Expenses
Component
Overhead Expenses
Sub-Component
Premium Rate
Component
B.1 WSIB Administrative 0.276
B.2 Legislative Obligations
WSIAT 0.014
Office of Worker Advisor 0.007
Office of Employer Advisor 0.002
OHSA 0.067
Mine Rescue 0.000
Construction Certification Training 0.000
Program Administration 0.000
Institute of Work & Health 0.003
Sub-Total 0.094
B.3 Prevention Workplace Safety and
Prevention Services
0.039
B.4 TOTAL OVERHEAD EXPENSES 0.409
Section 6D - ©WSIB Ontario 201

2011 PREMIUM RATES
SUB-COMPONENTS OF OVERHEAD EXPENSES
RATE GROUP 263: OTHER PLASTIC PRODUCTS
(CLASS D: MANUFACTURING)
Overhead Expenses
Component
Overhead Expenses
Sub-Component
Premium Rate
Component
B.1 WSIB Administrative 0.321
B.2 Legislative Obligations
WSIAT 0.017
Office of Worker Advisor 0.008
Office of Employer Advisor 0.003
OHSA 0.079
Mine Rescue 0.000
Construction Certification Training 0.000
Program Administration 0.000
Institute of Work & Health 0.003
Sub-Total 0.110
B.3 Prevention Workplace Safety and
Prevention Services
0.046
B.4 TOTAL OVERHEAD EXPENSES 0.477
Section 6D - ©WSIB Ontario 202

2011 PREMIUM RATES
SUB-COMPONENTS OF OVERHEAD EXPENSES
RATE GROUP 289: CLOTH, CARPETS AND TEXTILE PRODUCTS
(CLASS D: MANUFACTURING)
Overhead Expenses
Component
Overhead Expenses
Sub-Component
Premium Rate
Component
B.1 WSIB Administrative 0.349
B.2 Legislative Obligations
WSIAT 0.018
Office of Worker Advisor 0.009
Office of Employer Advisor 0.003
OHSA 0.086
Mine Rescue 0.000
Construction Certification Training 0.000
Program Administration 0.000
Institute of Work & Health 0.003
Sub-Total 0.119
B.3 Prevention Workplace Safety and
Prevention Services
0.051
B.4 TOTAL OVERHEAD EXPENSES 0.519
Section 6D - ©WSIB Ontario 203

2011 PREMIUM RATES
SUB-COMPONENTS OF OVERHEAD EXPENSES
RATE GROUP 301: CLOTHING, FIBRE AND YARN
(CLASS D: MANUFACTURING)
Overhead Expenses
Component
Overhead Expenses
Sub-Component
Premium Rate
Component
B.1 WSIB Administrative 0.274
B.2 Legislative Obligations
WSIAT 0.014
Office of Worker Advisor 0.007
Office of Employer Advisor 0.002
OHSA 0.067
Mine Rescue 0.000
Construction Certification Training 0.000
Program Administration 0.000
Institute of Work & Health 0.003
Sub-Total 0.093
B.3 Prevention Workplace Safety and
Prevention Services
0.039
B.4 TOTAL OVERHEAD EXPENSES 0.406
Section 6D - ©WSIB Ontario 204

2011 PREMIUM RATES
SUB-COMPONENTS OF OVERHEAD EXPENSES
RATE GROUP 308: MILLWORK AND OTHER WOOD INDUSTRIES
(CLASS D: MANUFACTURING)
Overhead Expenses
Component
Overhead Expenses
Sub-Component
Premium Rate
Component
B.1 WSIB Administrative 0.458
B.2 Legislative Obligations
WSIAT 0.024
Office of Worker Advisor 0.012
Office of Employer Advisor 0.004
OHSA 0.113
Mine Rescue 0.000
Construction Certification Training 0.000
Program Administration 0.001
Institute of Work & Health 0.005
Sub-Total 0.157
B.3 Prevention Workplace Safety and
Prevention Services
0.068
B.4 TOTAL OVERHEAD EXPENSES 0.683
Section 6D - ©WSIB Ontario 205

2011 PREMIUM RATES
SUB-COMPONENTS OF OVERHEAD EXPENSES
RATE GROUP 311: WOODEN CABINETS
(CLASS D: MANUFACTURING)
Overhead Expenses
Component
Overhead Expenses
Sub-Component
Premium Rate
Component
B.1 WSIB Administrative 0.376
B.2 Legislative Obligations
WSIAT 0.019
Office of Worker Advisor 0.009
Office of Employer Advisor 0.003
OHSA 0.092
Mine Rescue 0.000
Construction Certification Training 0.000
Program Administration 0.001
Institute of Work & Health 0.004
Sub-Total 0.128
B.3 Prevention Workplace Safety and
Prevention Services
0.055
B.4 TOTAL OVERHEAD EXPENSES 0.559
Section 6D - ©WSIB Ontario 206

2011 PREMIUM RATES
SUB-COMPONENTS OF OVERHEAD EXPENSES
RATE GROUP 312: WOODEN BOXES AND PALLETS
(CLASS D: MANUFACTURING)
Overhead Expenses
Component
Overhead Expenses
Sub-Component
Premium Rate
Component
B.1 WSIB Administrative 0.550
B.2 Legislative Obligations
WSIAT 0.028
Office of Worker Advisor 0.014
Office of Employer Advisor 0.005
OHSA 0.135
Mine Rescue 0.000
Construction Certification Training 0.000
Program Administration 0.001
Institute of Work & Health 0.005
Sub-Total 0.188
B.3 Prevention Workplace Safety and
Prevention Services
0.083
B.4 TOTAL OVERHEAD EXPENSES 0.821
Section 6D - ©WSIB Ontario 207

2011 PREMIUM RATES
SUB-COMPONENTS OF OVERHEAD EXPENSES
RATE GROUP 322: UPHOLSTERED FURNITURE
(CLASS D: MANUFACTURING)
Overhead Expenses
Component
Overhead Expenses
Sub-Component
Premium Rate
Component
B.1 WSIB Administrative 0.328
B.2 Legislative Obligations
WSIAT 0.017
Office of Worker Advisor 0.008
Office of Employer Advisor 0.003
OHSA 0.080
Mine Rescue 0.000
Construction Certification Training 0.000
Program Administration 0.000
Institute of Work & Health 0.003
Sub-Total 0.112
B.3 Prevention Workplace Safety and
Prevention Services
0.047
B.4 TOTAL OVERHEAD EXPENSES 0.487
Section 6D - ©WSIB Ontario 208

2011 PREMIUM RATES
SUB-COMPONENTS OF OVERHEAD EXPENSES
RATE GROUP 323: METAL FURNITURE
(CLASS D: MANUFACTURING)
Overhead Expenses
Component
Overhead Expenses
Sub-Component
Premium Rate
Component
B.1 WSIB Administrative 0.270
B.2 Legislative Obligations
WSIAT 0.014
Office of Worker Advisor 0.007
Office of Employer Advisor 0.002
OHSA 0.066
Mine Rescue 0.000
Construction Certification Training 0.000
Program Administration 0.000
Institute of Work & Health 0.003
Sub-Total 0.092
B.3 Prevention Workplace Safety and
Prevention Services
0.038
B.4 TOTAL OVERHEAD EXPENSES 0.400
Section 6D - ©WSIB Ontario 209

2011 PREMIUM RATES
SUB-COMPONENTS OF OVERHEAD EXPENSES
RATE GROUP 325: WOODEN AND OTHER NON-METAL FURNITURE
(CLASS D: MANUFACTURING)
Overhead Expenses
Component
Overhead Expenses
Sub-Component
Premium Rate
Component
B.1 WSIB Administrative 0.384
B.2 Legislative Obligations
WSIAT 0.020
Office of Worker Advisor 0.010
Office of Employer Advisor 0.003
OHSA 0.094
Mine Rescue 0.000
Construction Certification Training 0.000
Program Administration 0.001
Institute of Work & Health 0.004
Sub-Total 0.131
B.3 Prevention Workplace Safety and
Prevention Services
0.056
B.4 TOTAL OVERHEAD EXPENSES 0.571
Section 6D - ©WSIB Ontario 210

2011 PREMIUM RATES
SUB-COMPONENTS OF OVERHEAD EXPENSES
RATE GROUP 328: FURNITURE PARTS AND FIXTURES
(CLASS D: MANUFACTURING)
Overhead Expenses
Component
Overhead Expenses
Sub-Component
Premium Rate
Component
B.1 WSIB Administrative 0.377
B.2 Legislative Obligations
WSIAT 0.019
Office of Worker Advisor 0.009
Office of Employer Advisor 0.003
OHSA 0.092
Mine Rescue 0.000
Construction Certification Training 0.000
Program Administration 0.001
Institute of Work & Health 0.004
Sub-Total 0.129
B.3 Prevention Workplace Safety and
Prevention Services
0.055
B.4 TOTAL OVERHEAD EXPENSES 0.561
Section 6D - ©WSIB Ontario 211

2011 PREMIUM RATES
SUB-COMPONENTS OF OVERHEAD EXPENSES
RATE GROUP 333: PRINTING, PLATEMAKING AND BINDING
(CLASS D: MANUFACTURING)
Overhead Expenses
Component
Overhead Expenses
Sub-Component
Premium Rate
Component
B.1 WSIB Administrative 0.231
B.2 Legislative Obligations
WSIAT 0.012
Office of Worker Advisor 0.006
Office of Employer Advisor 0.002
OHSA 0.056
Mine Rescue 0.000
Construction Certification Training 0.000
Program Administration 0.000
Institute of Work & Health 0.002
Sub-Total 0.078
B.3 Prevention Workplace Safety North 0.101
B.4 TOTAL OVERHEAD EXPENSES 0.410
Section 6D - ©WSIB Ontario 212

2011 PREMIUM RATES
SUB-COMPONENTS OF OVERHEAD EXPENSES
RATE GROUP 335: PUBLISHING
(CLASS D: MANUFACTURING)
Overhead Expenses
Component
Overhead Expenses
Sub-Component
Premium Rate
Component
B.1 WSIB Administrative 0.086
B.2 Legislative Obligations
WSIAT 0.004
Office of Worker Advisor 0.002
Office of Employer Advisor 0.001
OHSA 0.021
Mine Rescue 0.000
Construction Certification Training 0.000
Program Administration 0.000
Institute of Work & Health 0.001
Sub-Total 0.029
B.3 Prevention Workplace Safety and
Prevention Services
0.022
B.4 TOTAL OVERHEAD EXPENSES 0.137
Section 6D - ©WSIB Ontario 213

2011 PREMIUM RATES
SUB-COMPONENTS OF OVERHEAD EXPENSES
RATE GROUP 338: FOLDING CARTONS
(CLASS D: MANUFACTURING)
Overhead Expenses
Component
Overhead Expenses
Sub-Component
Premium Rate
Component
B.1 WSIB Administrative 0.283
B.2 Legislative Obligations
WSIAT 0.015
Office of Worker Advisor 0.007
Office of Employer Advisor 0.002
OHSA 0.069
Mine Rescue 0.000
Construction Certification Training 0.000
Program Administration 0.000
Institute of Work & Health 0.003
Sub-Total 0.096
B.3 Prevention Workplace Safety North 0.119
B.4 TOTAL OVERHEAD EXPENSES 0.498
Section 6D - ©WSIB Ontario 214

2011 PREMIUM RATES
SUB-COMPONENTS OF OVERHEAD EXPENSES
RATE GROUP 341: PAPER PRODUCTS
(CLASS D: MANUFACTURING)
Overhead Expenses
Component
Overhead Expenses
Sub-Component
Premium Rate
Component
B.1 WSIB Administrative 0.314
B.2 Legislative Obligations
WSIAT 0.016
Office of Worker Advisor 0.008
Office of Employer Advisor 0.003
OHSA 0.077
Mine Rescue 0.000
Construction Certification Training 0.000
Program Administration 0.000
Institute of Work & Health 0.003
Sub-Total 0.107
B.3 Prevention Workplace Safety North 0.130
B.4 TOTAL OVERHEAD EXPENSES 0.551
Section 6D - ©WSIB Ontario 215

2011 PREMIUM RATES
SUB-COMPONENTS OF OVERHEAD EXPENSES
RATE GROUP 352: STEEL AND OTHER SMELTING AND REFINING INDUSTRIES
(CLASS D: MANUFACTURING)
Overhead Expenses
Component
Overhead Expenses
Sub-Component
Premium Rate
Component
B.1 WSIB Administrative 0.281
B.2 Legislative Obligations
WSIAT 0.015
Office of Worker Advisor 0.007
Office of Employer Advisor 0.002
OHSA 0.069
Mine Rescue 0.000
Construction Certification Training 0.000
Program Administration 0.000
Institute of Work & Health 0.003
Sub-Total 0.096
B.3 Prevention Workplace Safety North 0.118
B.4 TOTAL OVERHEAD EXPENSES 0.495
Section 6D - ©WSIB Ontario 216

2011 PREMIUM RATES
SUB-COMPONENTS OF OVERHEAD EXPENSES
RATE GROUP 358: FOUNDRIES
(CLASS D: MANUFACTURING)
Overhead Expenses
Component
Overhead Expenses
Sub-Component
Premium Rate
Component
B.1 WSIB Administrative 0.384
B.2 Legislative Obligations
WSIAT 0.020
Office of Worker Advisor 0.010
Office of Employer Advisor 0.003
OHSA 0.094
Mine Rescue 0.000
Construction Certification Training 0.000
Program Administration 0.001
Institute of Work & Health 0.004
Sub-Total 0.131
B.3 Prevention Workplace Safety and
Prevention Services
0.056
B.4 TOTAL OVERHEAD EXPENSES 0.571
Section 6D - ©WSIB Ontario 217

2011 PREMIUM RATES
SUB-COMPONENTS OF OVERHEAD EXPENSES
RATE GROUP 361: NON-FERROUS METAL INDUSTRIES*
(CLASS D: MANUFACTURING)
Overhead Expenses
Component
Overhead Expenses
Sub-Component
Premium Rate
Component
B.1 WSIB Administrative 0.343
B.2 Legislative Obligations
WSIAT 0.018
Office of Worker Advisor 0.009
Office of Employer Advisor 0.003
OHSA 0.084
Mine Rescue 0.000
Construction Certification Training 0.000
Program Administration 0.000
Institute of Work & Health 0.003
Sub-Total 0.117
B.3 Prevention Workplace Safety and
Prevention Services
0.050
B.4 TOTAL OVERHEAD EXPENSES 0.510
* Experience for rate groups 361, 390, 419, 421, 424 and 425 has been combined in order to determine a common 2011 Premium Rate.
Section 6D - ©WSIB Ontario 218

2011 PREMIUM RATES
SUB-COMPONENTS OF OVERHEAD EXPENSES
RATE GROUP 374: DOORS AND WINDOWS
(CLASS D: MANUFACTURING)
Overhead Expenses
Component
Overhead Expenses
Sub-Component
Premium Rate
Component
B.1 WSIB Administrative 0.341
B.2 Legislative Obligations
WSIAT 0.018
Office of Worker Advisor 0.009
Office of Employer Advisor 0.003
OHSA 0.083
Mine Rescue 0.000
Construction Certification Training 0.000
Program Administration 0.000
Institute of Work & Health 0.003
Sub-Total 0.116
B.3 Prevention Workplace Safety and
Prevention Services
0.049
B.4 TOTAL OVERHEAD EXPENSES 0.506
Section 6D - ©WSIB Ontario 219

2011 PREMIUM RATES
SUB-COMPONENTS OF OVERHEAD EXPENSES
RATE GROUP 375: STRUCTURAL AND ARCHITECTURAL PRODUCTS
(CLASS D: MANUFACTURING)
Overhead Expenses
Component
Overhead Expenses
Sub-Component
Premium Rate
Component
B.1 WSIB Administrative 0.408
B.2 Legislative Obligations
WSIAT 0.021
Office of Worker Advisor 0.010
Office of Employer Advisor 0.003
OHSA 0.100
Mine Rescue 0.000
Construction Certification Training 0.000
Program Administration 0.001
Institute of Work & Health 0.004
Sub-Total 0.140
B.3 Prevention Workplace Safety and
Prevention Services
0.060
B.4 TOTAL OVERHEAD EXPENSES 0.608
Section 6D - ©WSIB Ontario 220

2011 PREMIUM RATES
SUB-COMPONENTS OF OVERHEAD EXPENSES
RATE GROUP 377: COATING OF METAL PRODUCTS
(CLASS D: MANUFACTURING)
Overhead Expenses
Component
Overhead Expenses
Sub-Component
Premium Rate
Component
B.1 WSIB Administrative 0.378
B.2 Legislative Obligations
WSIAT 0.020
Office of Worker Advisor 0.009
Office of Employer Advisor 0.003
OHSA 0.093
Mine Rescue 0.000
Construction Certification Training 0.000
Program Administration 0.001
Institute of Work & Health 0.004
Sub-Total 0.129
B.3 Prevention Workplace Safety and
Prevention Services
0.055
B.4 TOTAL OVERHEAD EXPENSES 0.562
Section 6D - ©WSIB Ontario 221

2011 PREMIUM RATES
SUB-COMPONENTS OF OVERHEAD EXPENSES
RATE GROUP 379: HARDWARE, TOOLS AND CUTLERY
(CLASS D: MANUFACTURING)
Overhead Expenses
Component
Overhead Expenses
Sub-Component
Premium Rate
Component
B.1 WSIB Administrative 0.293
B.2 Legislative Obligations
WSIAT 0.015
Office of Worker Advisor 0.007
Office of Employer Advisor 0.002
OHSA 0.072
Mine Rescue 0.000
Construction Certification Training 0.000
Program Administration 0.000
Institute of Work & Health 0.003
Sub-Total 0.100
B.3 Prevention Workplace Safety and
Prevention Services
0.042
B.4 TOTAL OVERHEAD EXPENSES 0.435
Section 6D - ©WSIB Ontario 222

2011 PREMIUM RATES
SUB-COMPONENTS OF OVERHEAD EXPENSES
RATE GROUP 382: METAL DIES, MOULDS AND PATTERNS
(CLASS D: MANUFACTURING)
Overhead Expenses
Component
Overhead Expenses
Sub-Component
Premium Rate
Component
B.1 WSIB Administrative 0.263
B.2 Legislative Obligations
WSIAT 0.014
Office of Worker Advisor 0.007
Office of Employer Advisor 0.002
OHSA 0.064
Mine Rescue 0.000
Construction Certification Training 0.000
Program Administration 0.000
Institute of Work & Health 0.003
Sub-Total 0.089
B.3 Prevention Workplace Safety and
Prevention Services
0.037
B.4 TOTAL OVERHEAD EXPENSES 0.389
Section 6D - ©WSIB Ontario 223

2011 PREMIUM RATES
SUB-COMPONENTS OF OVERHEAD EXPENSES
RATE GROUP 383: HEATING, REFRIGERATION AND AIR CONDITIONING EQUIPMENT
(CLASS D: MANUFACTURING)
Overhead Expenses
Component
Overhead Expenses
Sub-Component
Premium Rate
Component
B.1 WSIB Administrative 0.296
B.2 Legislative Obligations
WSIAT 0.015
Office of Worker Advisor 0.007
Office of Employer Advisor 0.002
OHSA 0.072
Mine Rescue 0.000
Construction Certification Training 0.000
Program Administration 0.000
Institute of Work & Health 0.003
Sub-Total 0.101
B.3 Prevention Workplace Safety and
Prevention Services
0.042
B.4 TOTAL OVERHEAD EXPENSES 0.439
Section 6D - ©WSIB Ontario 224
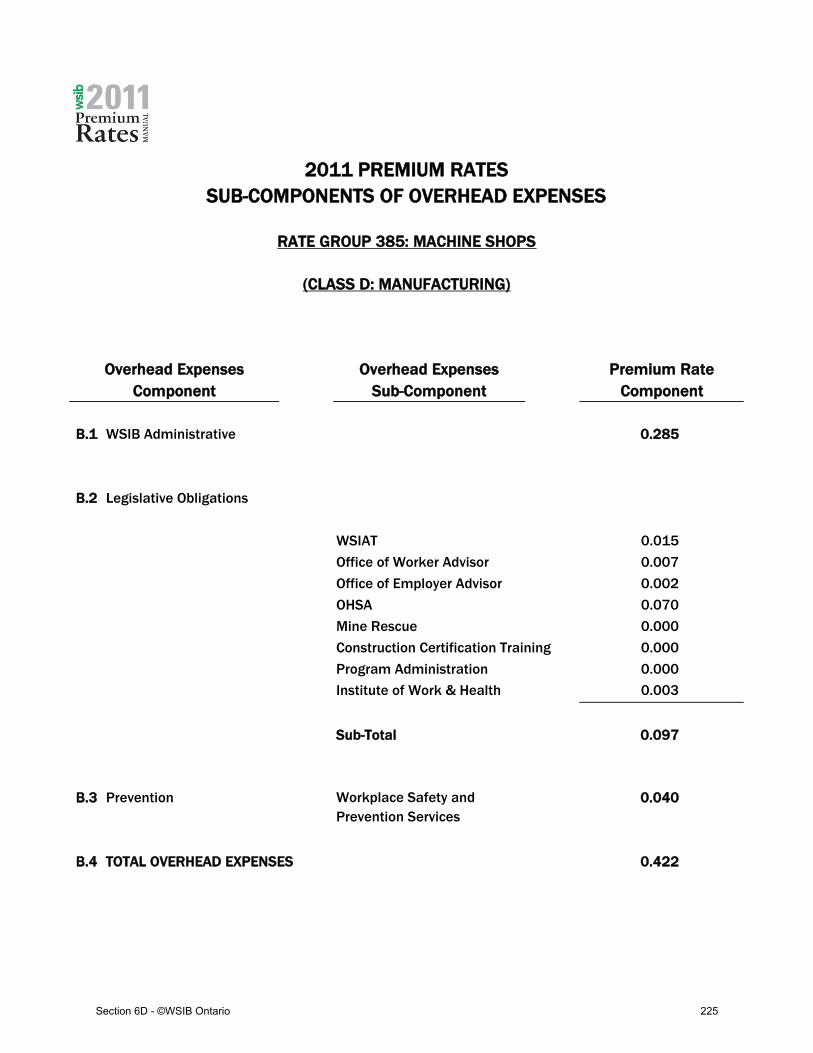
2011 PREMIUM RATES
SUB-COMPONENTS OF OVERHEAD EXPENSES
RATE GROUP 385: MACHINE SHOPS
(CLASS D: MANUFACTURING)
Overhead Expenses
Component
Overhead Expenses
Sub-Component
Premium Rate
Component
B.1 WSIB Administrative 0.285
B.2 Legislative Obligations
WSIAT 0.015
Office of Worker Advisor 0.007
Office of Employer Advisor 0.002
OHSA 0.070
Mine Rescue 0.000
Construction Certification Training 0.000
Program Administration 0.000
Institute of Work & Health 0.003
Sub-Total 0.097
B.3 Prevention Workplace Safety and
Prevention Services
0.040
B.4 TOTAL OVERHEAD EXPENSES 0.422
Section 6D - ©WSIB Ontario 225

2011 PREMIUM RATES
SUB-COMPONENTS OF OVERHEAD EXPENSES
RATE GROUP 387: OTHER METAL FABRICATING INDUSTRIES
(CLASS D: MANUFACTURING)
Overhead Expenses
Component
Overhead Expenses
Sub-Component
Premium Rate
Component
B.1 WSIB Administrative 0.347
B.2 Legislative Obligations
WSIAT 0.018
Office of Worker Advisor 0.009
Office of Employer Advisor 0.003
OHSA 0.085
Mine Rescue 0.000
Construction Certification Training 0.000
Program Administration 0.000
Institute of Work & Health 0.003
Sub-Total 0.119
B.3 Prevention Workplace Safety and
Prevention Services
0.050
B.4 TOTAL OVERHEAD EXPENSES 0.516
Section 6D - ©WSIB Ontario 226

2011 PREMIUM RATES
SUB-COMPONENTS OF OVERHEAD EXPENSES
RATE GROUP 389: METAL CLOSURES AND CONTAINERS
(CLASS D: MANUFACTURING)
Overhead Expenses
Component
Overhead Expenses
Sub-Component
Premium Rate
Component
B.1 WSIB Administrative 0.284
B.2 Legislative Obligations
WSIAT 0.015
Office of Worker Advisor 0.007
Office of Employer Advisor 0.002
OHSA 0.069
Mine Rescue 0.000
Construction Certification Training 0.000
Program Administration 0.000
Institute of Work & Health 0.003
Sub-Total 0.097
B.3 Prevention Workplace Safety and
Prevention Services
0.040
B.4 TOTAL OVERHEAD EXPENSES 0.421
Section 6D - ©WSIB Ontario 227

2011 PREMIUM RATES
SUB-COMPONENTS OF OVERHEAD EXPENSES
RATE GROUP 390: OTHER STAMPED AND PRESSED METAL PRODUCTS*
(CLASS D: MANUFACTURING)
Overhead Expenses
Component
Overhead Expenses
Sub-Component
Premium Rate
Component
B.1 WSIB Administrative 0.343
B.2 Legislative Obligations
WSIAT 0.018
Office of Worker Advisor 0.009
Office of Employer Advisor 0.003
OHSA 0.084
Mine Rescue 0.000
Construction Certification Training 0.000
Program Administration 0.000
Institute of Work & Health 0.003
Sub-Total 0.117
B.3 Prevention Workplace Safety and
Prevention Services
0.050
B.4 TOTAL OVERHEAD EXPENSES 0.510
* Experience for rate groups 361, 390, 419, 421, 424 and 425 has been combined in order to determine a common 2011 Premium Rate.
Section 6D - ©WSIB Ontario 228

2011 PREMIUM RATES
SUB-COMPONENTS OF OVERHEAD EXPENSES
RATE GROUP 393: WIRE PRODUCTS
(CLASS D: MANUFACTURING)
Overhead Expenses
Component
Overhead Expenses
Sub-Component
Premium Rate
Component
B.1 WSIB Administrative 0.330
B.2 Legislative Obligations
WSIAT 0.017
Office of Worker Advisor 0.008
Office of Employer Advisor 0.003
OHSA 0.081
Mine Rescue 0.000
Construction Certification Training 0.000
Program Administration 0.000
Institute of Work & Health 0.003
Sub-Total 0.113
B.3 Prevention Workplace Safety and
Prevention Services
0.048
B.4 TOTAL OVERHEAD EXPENSES 0.491
Section 6D - ©WSIB Ontario 229

2011 PREMIUM RATES
SUB-COMPONENTS OF OVERHEAD EXPENSES
RATE GROUP 402: MAJOR APPLIANCES AND TRANSMISSION EQUIPMENT
(CLASS D: MANUFACTURING)
Overhead Expenses
Component
Overhead Expenses
Sub-Component
Premium Rate
Component
B.1 WSIB Administrative 0.269
B.2 Legislative Obligations
WSIAT 0.014
Office of Worker Advisor 0.007
Office of Employer Advisor 0.002
OHSA 0.066
Mine Rescue 0.000
Construction Certification Training 0.000
Program Administration 0.000
Institute of Work & Health 0.003
Sub-Total 0.092
B.3 Prevention Workplace Safety and
Prevention Services
0.038
B.4 TOTAL OVERHEAD EXPENSES 0.399
Section 6D - ©WSIB Ontario 230

2011 PREMIUM RATES
SUB-COMPONENTS OF OVERHEAD EXPENSES
RATE GROUP 403: OTHER MACHINERY AND EQUIPMENT
(CLASS D: MANUFACTURING)
Overhead Expenses
Component
Overhead Expenses
Sub-Component
Premium Rate
Component
B.1 WSIB Administrative 0.235
B.2 Legislative Obligations
WSIAT 0.012
Office of Worker Advisor 0.006
Office of Employer Advisor 0.002
OHSA 0.057
Mine Rescue 0.000
Construction Certification Training 0.000
Program Administration 0.000
Institute of Work & Health 0.002
Sub-Total 0.080
B.3 Prevention Workplace Safety and
Prevention Services
0.032
B.4 TOTAL OVERHEAD EXPENSES 0.347
Section 6D - ©WSIB Ontario 231

2011 PREMIUM RATES
SUB-COMPONENTS OF OVERHEAD EXPENSES
RATE GROUP 406: ELEVATORS AND ESCALATORS
(CLASS D: MANUFACTURING)
Overhead Expenses
Component
Overhead Expenses
Sub-Component
Premium Rate
Component
B.1 WSIB Administrative 0.291
B.2 Legislative Obligations
WSIAT 0.015
Office of Worker Advisor 0.007
Office of Employer Advisor 0.002
OHSA 0.071
Mine Rescue 0.000
Construction Certification Training 0.000
Program Administration 0.000
Institute of Work & Health 0.003
Sub-Total 0.099
B.3 Prevention Workplace Safety and
Prevention Services
0.041
B.4 TOTAL OVERHEAD EXPENSES 0.431
Section 6D - ©WSIB Ontario 232

2011 PREMIUM RATES
SUB-COMPONENTS OF OVERHEAD EXPENSES
RATE GROUP 408: BOILERS, PUMPS AND FANS
(CLASS D: MANUFACTURING)
Overhead Expenses
Component
Overhead Expenses
Sub-Component
Premium Rate
Component
B.1 WSIB Administrative 0.276
B.2 Legislative Obligations
WSIAT 0.014
Office of Worker Advisor 0.007
Office of Employer Advisor 0.002
OHSA 0.067
Mine Rescue 0.000
Construction Certification Training 0.000
Program Administration 0.000
Institute of Work & Health 0.003
Sub-Total 0.094
B.3 Prevention Workplace Safety and
Prevention Services
0.039
B.4 TOTAL OVERHEAD EXPENSES 0.409
Section 6D - ©WSIB Ontario 233

2011 PREMIUM RATES
SUB-COMPONENTS OF OVERHEAD EXPENSES
RATE GROUP 411: AGRICULTURAL, CONSTRUCTION AND MINING MACHINERY
(CLASS D: MANUFACTURING)
Overhead Expenses
Component
Overhead Expenses
Sub-Component
Premium Rate
Component
B.1 WSIB Administrative 0.301
B.2 Legislative Obligations
WSIAT 0.016
Office of Worker Advisor 0.008
Office of Employer Advisor 0.003
OHSA 0.074
Mine Rescue 0.000
Construction Certification Training 0.000
Program Administration 0.000
Institute of Work & Health 0.003
Sub-Total 0.103
B.3 Prevention Workplace Safety and
Prevention Services
0.043
B.4 TOTAL OVERHEAD EXPENSES 0.447
Section 6D - ©WSIB Ontario 234

2011 PREMIUM RATES
SUB-COMPONENTS OF OVERHEAD EXPENSES
RATE GROUP 417: AIRCRAFT MANUFACTURING
(CLASS D: MANUFACTURING)
Overhead Expenses
Component
Overhead Expenses
Sub-Component
Premium Rate
Component
B.1 WSIB Administrative 0.224
B.2 Legislative Obligations
WSIAT 0.012
Office of Worker Advisor 0.006
Office of Employer Advisor 0.002
OHSA 0.055
Mine Rescue 0.000
Construction Certification Training 0.000
Program Administration 0.000
Institute of Work & Health 0.002
Sub-Total 0.076
B.3 Prevention Workplace Safety and
Prevention Services
0.030
B.4 TOTAL OVERHEAD EXPENSES 0.330
Section 6D - ©WSIB Ontario 235

2011 PREMIUM RATES
SUB-COMPONENTS OF OVERHEAD EXPENSES
RATE GROUP 419: MOTOR VEHICLE ASSEMBLY*
(CLASS D: MANUFACTURING)
Overhead Expenses
Component
Overhead Expenses
Sub-Component
Premium Rate
Component
B.1 WSIB Administrative 0.343
B.2 Legislative Obligations
WSIAT 0.018
Office of Worker Advisor 0.009
Office of Employer Advisor 0.003
OHSA 0.084
Mine Rescue 0.000
Construction Certification Training 0.000
Program Administration 0.000
Institute of Work & Health 0.003
Sub-Total 0.117
B.3 Prevention Workplace Safety and
Prevention Services
0.050
B.4 TOTAL OVERHEAD EXPENSES 0.510
* Experience for rate groups 361, 390, 419, 421, 424 and 425 has been combined in order to determine a common 2011 Premium Rate.
Section 6D - ©WSIB Ontario 236

2011 PREMIUM RATES
SUB-COMPONENTS OF OVERHEAD EXPENSES
RATE GROUP 420: MOTOR VEHICLE ENGINE MANUFACTURING
(CLASS D: MANUFACTURING)
Overhead Expenses
Component
Overhead Expenses
Sub-Component
Premium Rate
Component
B.1 WSIB Administrative 0.243
B.2 Legislative Obligations
WSIAT 0.013
Office of Worker Advisor 0.006
Office of Employer Advisor 0.002
OHSA 0.059
Mine Rescue 0.000
Construction Certification Training 0.000
Program Administration 0.000
Institute of Work & Health 0.002
Sub-Total 0.083
B.3 Prevention Workplace Safety and
Prevention Services
0.034
B.4 TOTAL OVERHEAD EXPENSES 0.360
Section 6D - ©WSIB Ontario 237

2011 PREMIUM RATES
SUB-COMPONENTS OF OVERHEAD EXPENSES
RATE GROUP 421: OTHER MOTOR VEHICLE PARTS AND EQUIPMENT*
(CLASS D: MANUFACTURING)
Overhead Expenses
Component
Overhead Expenses
Sub-Component
Premium Rate
Component
B.1 WSIB Administrative 0.343
B.2 Legislative Obligations
WSIAT 0.018
Office of Worker Advisor 0.009
Office of Employer Advisor 0.003
OHSA 0.084
Mine Rescue 0.000
Construction Certification Training 0.000
Program Administration 0.000
Institute of Work & Health 0.003
Sub-Total 0.117
B.3 Prevention Workplace Safety and
Prevention Services
0.050
B.4 TOTAL OVERHEAD EXPENSES 0.510
* Experience for rate groups 361, 390, 419, 421, 424 and 425 has been combined in order to determine a common 2011 Premium Rate.
Section 6D - ©WSIB Ontario 238

2011 PREMIUM RATES
SUB-COMPONENTS OF OVERHEAD EXPENSES
RATE GROUP 424: MOTOR VEHICLE STAMPINGS*
(CLASS D: MANUFACTURING)
Overhead Expenses
Component
Overhead Expenses
Sub-Component
Premium Rate
Component
B.1 WSIB Administrative 0.343
B.2 Legislative Obligations
WSIAT 0.018
Office of Worker Advisor 0.009
Office of Employer Advisor 0.003
OHSA 0.084
Mine Rescue 0.000
Construction Certification Training 0.000
Program Administration 0.000
Institute of Work & Health 0.003
Sub-Total 0.117
B.3 Prevention Workplace Safety and
Prevention Services
0.050
B.4 TOTAL OVERHEAD EXPENSES 0.510
* Experience for rate groups 361, 390, 419, 421, 424 and 425 has been combined in order to determine a common 2011 Premium Rate.
Section 6D - ©WSIB Ontario 239

2011 PREMIUM RATES
SUB-COMPONENTS OF OVERHEAD EXPENSES
RATE GROUP 425: MOTOR VEHICLE WHEELS AND BRAKES*
(CLASS D: MANUFACTURING)
Overhead Expenses
Component
Overhead Expenses
Sub-Component
Premium Rate
Component
B.1 WSIB Administrative 0.343
B.2 Legislative Obligations
WSIAT 0.018
Office of Worker Advisor 0.009
Office of Employer Advisor 0.003
OHSA 0.084
Mine Rescue 0.000
Construction Certification Training 0.000
Program Administration 0.000
Institute of Work & Health 0.003
Sub-Total 0.117
B.3 Prevention Workplace Safety and
Prevention Services
0.050
B.4 TOTAL OVERHEAD EXPENSES 0.510
* Experience for rate groups 361, 390, 419, 421, 424 and 425 has been combined in order to determine a common 2011 Premium Rate.
Section 6D - ©WSIB Ontario 240

2011 PREMIUM RATES
SUB-COMPONENTS OF OVERHEAD EXPENSES
RATE GROUP 428: MOTOR VEHICLE FABRIC ACCESSORIES
(CLASS D: MANUFACTURING)
Overhead Expenses
Component
Overhead Expenses
Sub-Component
Premium Rate
Component
B.1 WSIB Administrative 0.400
B.2 Legislative Obligations
WSIAT 0.021
Office of Worker Advisor 0.010
Office of Employer Advisor 0.003
OHSA 0.098
Mine Rescue 0.000
Construction Certification Training 0.000
Program Administration 0.001
Institute of Work & Health 0.004
Sub-Total 0.137
B.3 Prevention Workplace Safety and
Prevention Services
0.059
B.4 TOTAL OVERHEAD EXPENSES 0.596
Section 6D - ©WSIB Ontario 241

2011 PREMIUM RATES
SUB-COMPONENTS OF OVERHEAD EXPENSES
RATE GROUP 432: TRUCKS, BUSES AND TRAILERS
(CLASS D: MANUFACTURING)
Overhead Expenses
Component
Overhead Expenses
Sub-Component
Premium Rate
Component
B.1 WSIB Administrative 0.390
B.2 Legislative Obligations
WSIAT 0.020
Office of Worker Advisor 0.010
Office of Employer Advisor 0.003
OHSA 0.096
Mine Rescue 0.000
Construction Certification Training 0.000
Program Administration 0.001
Institute of Work & Health 0.004
Sub-Total 0.133
B.3 Prevention Workplace Safety and
Prevention Services
0.057
B.4 TOTAL OVERHEAD EXPENSES 0.580
Section 6D - ©WSIB Ontario 242

2011 PREMIUM RATES
SUB-COMPONENTS OF OVERHEAD EXPENSES
RATE GROUP 442: RAILROAD ROLLING STOCK
(CLASS D: MANUFACTURING)
Overhead Expenses
Component
Overhead Expenses
Sub-Component
Premium Rate
Component
B.1 WSIB Administrative 0.293
B.2 Legislative Obligations
WSIAT 0.015
Office of Worker Advisor 0.007
Office of Employer Advisor 0.002
OHSA 0.072
Mine Rescue 0.000
Construction Certification Training 0.000
Program Administration 0.000
Institute of Work & Health 0.003
Sub-Total 0.100
B.3 Prevention Workplace Safety and
Prevention Services
0.042
B.4 TOTAL OVERHEAD EXPENSES 0.435
Section 6D - ©WSIB Ontario 243

2011 PREMIUM RATES
SUB-COMPONENTS OF OVERHEAD EXPENSES
RATE GROUP 460: LIGHTING AND SMALL ELECTRICAL APPLIANCES
(CLASS D: MANUFACTURING)
Overhead Expenses
Component
Overhead Expenses
Sub-Component
Premium Rate
Component
B.1 WSIB Administrative 0.288
B.2 Legislative Obligations
WSIAT 0.015
Office of Worker Advisor 0.007
Office of Employer Advisor 0.002
OHSA 0.070
Mine Rescue 0.000
Construction Certification Training 0.000
Program Administration 0.000
Institute of Work & Health 0.003
Sub-Total 0.098
B.3 Prevention Workplace Safety and
Prevention Services
0.041
B.4 TOTAL OVERHEAD EXPENSES 0.427
Section 6D - ©WSIB Ontario 244

2011 PREMIUM RATES
SUB-COMPONENTS OF OVERHEAD EXPENSES
RATE GROUP 466: COMMUNICATION AND ENERGY WIRE PRODUCTS
(CLASS D: MANUFACTURING)
Overhead Expenses
Component
Overhead Expenses
Sub-Component
Premium Rate
Component
B.1 WSIB Administrative 0.276
B.2 Legislative Obligations
WSIAT 0.014
Office of Worker Advisor 0.007
Office of Employer Advisor 0.002
OHSA 0.067
Mine Rescue 0.000
Construction Certification Training 0.000
Program Administration 0.000
Institute of Work & Health 0.003
Sub-Total 0.094
B.3 Prevention Workplace Safety and
Prevention Services
0.039
B.4 TOTAL OVERHEAD EXPENSES 0.409
Section 6D - ©WSIB Ontario 245

2011 PREMIUM RATES
SUB-COMPONENTS OF OVERHEAD EXPENSES
RATE GROUP 468: ELECTRONIC EQUIPMENT & OTHER COMMUNICATION DEVICES
(CLASS D: MANUFACTURING)
Overhead Expenses
Component
Overhead Expenses
Sub-Component
Premium Rate
Component
B.1 WSIB Administrative 0.062
B.2 Legislative Obligations
WSIAT 0.003
Office of Worker Advisor 0.002
Office of Employer Advisor 0.001
OHSA 0.015
Mine Rescue 0.000
Construction Certification Training 0.000
Program Administration 0.000
Institute of Work & Health 0.001
Sub-Total 0.021
B.3 Prevention Workplace Safety and
Prevention Services
0.021
B.4 TOTAL OVERHEAD EXPENSES 0.104
Section 6D - ©WSIB Ontario 246

2011 PREMIUM RATES
SUB-COMPONENTS OF OVERHEAD EXPENSES
RATE GROUP 477: INDUSTRIAL ELECTRICAL EQUIPMENT
(CLASS D: MANUFACTURING)
Overhead Expenses
Component
Overhead Expenses
Sub-Component
Premium Rate
Component
B.1 WSIB Administrative 0.224
B.2 Legislative Obligations
WSIAT 0.012
Office of Worker Advisor 0.006
Office of Employer Advisor 0.002
OHSA 0.054
Mine Rescue 0.000
Construction Certification Training 0.000
Program Administration 0.000
Institute of Work & Health 0.002
Sub-Total 0.076
B.3 Prevention Workplace Safety and
Prevention Services
0.030
B.4 TOTAL OVERHEAD EXPENSES 0.330
Section 6D - ©WSIB Ontario 247

2011 PREMIUM RATES
SUB-COMPONENTS OF OVERHEAD EXPENSES
RATE GROUP 485: BRICKS, CERAMICS AND ABRASIVES
(CLASS D: MANUFACTURING)
Overhead Expenses
Component
Overhead Expenses
Sub-Component
Premium Rate
Component
B.1 WSIB Administrative 0.397
B.2 Legislative Obligations
WSIAT 0.021
Office of Worker Advisor 0.010
Office of Employer Advisor 0.003
OHSA 0.098
Mine Rescue 0.000
Construction Certification Training 0.000
Program Administration 0.001
Institute of Work & Health 0.004
Sub-Total 0.136
B.3 Prevention Workplace Safety and
Prevention Services
0.059
B.4 TOTAL OVERHEAD EXPENSES 0.592
Section 6D - ©WSIB Ontario 248

2011 PREMIUM RATES
SUB-COMPONENTS OF OVERHEAD EXPENSES
RATE GROUP 496: CONCRETE PRODUCTS
(CLASS D: MANUFACTURING)
Overhead Expenses
Component
Overhead Expenses
Sub-Component
Premium Rate
Component
B.1 WSIB Administrative 0.450
B.2 Legislative Obligations
WSIAT 0.023
Office of Worker Advisor 0.011
Office of Employer Advisor 0.004
OHSA 0.111
Mine Rescue 0.000
Construction Certification Training 0.000
Program Administration 0.001
Institute of Work & Health 0.004
Sub-Total 0.154
B.3 Prevention Workplace Safety and
Prevention Services
0.067
B.4 TOTAL OVERHEAD EXPENSES 0.671
Section 6D - ©WSIB Ontario 249

2011 PREMIUM RATES
SUB-COMPONENTS OF OVERHEAD EXPENSES
RATE GROUP 497: READY-MIX CONCRETE
(CLASS D: MANUFACTURING)
Overhead Expenses
Component
Overhead Expenses
Sub-Component
Premium Rate
Component
B.1 WSIB Administrative 0.360
B.2 Legislative Obligations
WSIAT 0.019
Office of Worker Advisor 0.009
Office of Employer Advisor 0.003
OHSA 0.088
Mine Rescue 0.000
Construction Certification Training 0.000
Program Administration 0.000
Institute of Work & Health 0.004
Sub-Total 0.123
B.3 Prevention Infrastructure Health and
Safety Association
0.093
B.4 TOTAL OVERHEAD EXPENSES 0.576
Section 6D - ©WSIB Ontario 250

2011 PREMIUM RATES
SUB-COMPONENTS OF OVERHEAD EXPENSES
RATE GROUP 501: NON-METALLIC MINERAL PRODUCTS
(CLASS D: MANUFACTURING)
Overhead Expenses
Component
Overhead Expenses
Sub-Component
Premium Rate
Component
B.1 WSIB Administrative 0.308
B.2 Legislative Obligations
WSIAT 0.016
Office of Worker Advisor 0.008
Office of Employer Advisor 0.003
OHSA 0.075
Mine Rescue 0.000
Construction Certification Training 0.000
Program Administration 0.000
Institute of Work & Health 0.003
Sub-Total 0.105
B.3 Prevention Workplace Safety and
Prevention Services
0.044
B.4 TOTAL OVERHEAD EXPENSES 0.457
Section 6D - ©WSIB Ontario 251

2011 PREMIUM RATES
SUB-COMPONENTS OF OVERHEAD EXPENSES
RATE GROUP 502: GLASS PRODUCTS
(CLASS D: MANUFACTURING)
Overhead Expenses
Component
Overhead Expenses
Sub-Component
Premium Rate
Component
B.1 WSIB Administrative 0.311
B.2 Legislative Obligations
WSIAT 0.016
Office of Worker Advisor 0.008
Office of Employer Advisor 0.003
OHSA 0.076
Mine Rescue 0.000
Construction Certification Training 0.000
Program Administration 0.000
Institute of Work & Health 0.003
Sub-Total 0.106
B.3 Prevention Workplace Safety and
Prevention Services
0.045
B.4 TOTAL OVERHEAD EXPENSES 0.462
Section 6D - ©WSIB Ontario 252

2011 PREMIUM RATES
SUB-COMPONENTS OF OVERHEAD EXPENSES
RATE GROUP 507: PETROLEUM AND COAL PRODUCTS
(CLASS D: MANUFACTURING)
Overhead Expenses
Component
Overhead Expenses
Sub-Component
Premium Rate
Component
B.1 WSIB Administrative 0.185
B.2 Legislative Obligations
WSIAT 0.010
Office of Worker Advisor 0.005
Office of Employer Advisor 0.002
OHSA 0.045
Mine Rescue 0.000
Construction Certification Training 0.000
Program Administration 0.000
Institute of Work & Health 0.002
Sub-Total 0.063
B.3 Prevention Workplace Safety and
Prevention Services
0.027
B.4 TOTAL OVERHEAD EXPENSES 0.275
Section 6D - ©WSIB Ontario 253

2011 PREMIUM RATES
SUB-COMPONENTS OF OVERHEAD EXPENSES
RATE GROUP 512: RESINS, PAINT, INK AND ADHESIVES
(CLASS D: MANUFACTURING)
Overhead Expenses
Component
Overhead Expenses
Sub-Component
Premium Rate
Component
B.1 WSIB Administrative 0.236
B.2 Legislative Obligations
WSIAT 0.012
Office of Worker Advisor 0.006
Office of Employer Advisor 0.002
OHSA 0.057
Mine Rescue 0.000
Construction Certification Training 0.000
Program Administration 0.000
Institute of Work & Health 0.002
Sub-Total 0.080
B.3 Prevention Workplace Safety and
Prevention Services
0.032
B.4 TOTAL OVERHEAD EXPENSES 0.348
Section 6D - ©WSIB Ontario 254

2011 PREMIUM RATES
SUB-COMPONENTS OF OVERHEAD EXPENSES
RATE GROUP 514: PHARMACEUTICALS AND MEDICINES
(CLASS D: MANUFACTURING)
Overhead Expenses
Component
Overhead Expenses
Sub-Component
Premium Rate
Component
B.1 WSIB Administrative 0.150
B.2 Legislative Obligations
WSIAT 0.008
Office of Worker Advisor 0.004
Office of Employer Advisor 0.001
OHSA 0.036
Mine Rescue 0.000
Construction Certification Training 0.000
Program Administration 0.000
Institute of Work & Health 0.001
Sub-Total 0.051
B.3 Prevention Workplace Safety and
Prevention Services
0.025
B.4 TOTAL OVERHEAD EXPENSES 0.226
Section 6D - ©WSIB Ontario 255

2011 PREMIUM RATES
SUB-COMPONENTS OF OVERHEAD EXPENSES
RATE GROUP 517: SOAP AND TOILETRIES
(CLASS D: MANUFACTURING)
Overhead Expenses
Component
Overhead Expenses
Sub-Component
Premium Rate
Component
B.1 WSIB Administrative 0.231
B.2 Legislative Obligations
WSIAT 0.012
Office of Worker Advisor 0.006
Office of Employer Advisor 0.002
OHSA 0.056
Mine Rescue 0.000
Construction Certification Training 0.000
Program Administration 0.000
Institute of Work & Health 0.002
Sub-Total 0.078
B.3 Prevention Workplace Safety and
Prevention Services
0.032
B.4 TOTAL OVERHEAD EXPENSES 0.341
Section 6D - ©WSIB Ontario 256

2011 PREMIUM RATES
SUB-COMPONENTS OF OVERHEAD EXPENSES
RATE GROUP 524: CHEMICAL INDUSTRIES
(CLASS D: MANUFACTURING)
Overhead Expenses
Component
Overhead Expenses
Sub-Component
Premium Rate
Component
B.1 WSIB Administrative 0.248
B.2 Legislative Obligations
WSIAT 0.013
Office of Worker Advisor 0.006
Office of Employer Advisor 0.002
OHSA 0.060
Mine Rescue 0.000
Construction Certification Training 0.000
Program Administration 0.000
Institute of Work & Health 0.002
Sub-Total 0.084
B.3 Prevention Workplace Safety and
Prevention Services
0.034
B.4 TOTAL OVERHEAD EXPENSES 0.366
Section 6D - ©WSIB Ontario 257

2011 PREMIUM RATES
SUB-COMPONENTS OF OVERHEAD EXPENSES
RATE GROUP 529: JEWELRY AND INSTRUMENTS
(CLASS D: MANUFACTURING)
Overhead Expenses
Component
Overhead Expenses
Sub-Component
Premium Rate
Component
B.1 WSIB Administrative 0.159
B.2 Legislative Obligations
WSIAT 0.008
Office of Worker Advisor 0.004
Office of Employer Advisor 0.001
OHSA 0.039
Mine Rescue 0.000
Construction Certification Training 0.000
Program Administration 0.000
Institute of Work & Health 0.002
Sub-Total 0.054
B.3 Prevention Workplace Safety and
Prevention Services
0.026
B.4 TOTAL OVERHEAD EXPENSES 0.239
Section 6D - ©WSIB Ontario 258

2011 PREMIUM RATES
SUB-COMPONENTS OF OVERHEAD EXPENSES
RATE GROUP 533: SIGNS AND DISPLAYS
(CLASS D: MANUFACTURING)
Overhead Expenses
Component
Overhead Expenses
Sub-Component
Premium Rate
Component
B.1 WSIB Administrative 0.320
B.2 Legislative Obligations
WSIAT 0.017
Office of Worker Advisor 0.008
Office of Employer Advisor 0.003
OHSA 0.078
Mine Rescue 0.000
Construction Certification Training 0.000
Program Administration 0.000
Institute of Work & Health 0.003
Sub-Total 0.109
B.3 Prevention Workplace Safety and
Prevention Services
0.046
B.4 TOTAL OVERHEAD EXPENSES 0.475
Section 6D - ©WSIB Ontario 259

2011 PREMIUM RATES
SUB-COMPONENTS OF OVERHEAD EXPENSES
RATE GROUP 538: SPORTING GOODS AND TOYS
(CLASS D: MANUFACTURING)
Overhead Expenses
Component
Overhead Expenses
Sub-Component
Premium Rate
Component
B.1 WSIB Administrative 0.383
B.2 Legislative Obligations
WSIAT 0.020
Office of Worker Advisor 0.010
Office of Employer Advisor 0.003
OHSA 0.094
Mine Rescue 0.000
Construction Certification Training 0.000
Program Administration 0.001
Institute of Work & Health 0.004
Sub-Total 0.131
B.3 Prevention Workplace Safety and
Prevention Services
0.056
B.4 TOTAL OVERHEAD EXPENSES 0.570
Section 6D - ©WSIB Ontario 260

2011 PREMIUM RATES
SUB-COMPONENTS OF OVERHEAD EXPENSES
RATE GROUP 542: OTHER MANUFACTURED PRODUCTS
(CLASS D: MANUFACTURING)
Overhead Expenses
Component
Overhead Expenses
Sub-Component
Premium Rate
Component
B.1 WSIB Administrative 0.257
B.2 Legislative Obligations
WSIAT 0.013
Office of Worker Advisor 0.006
Office of Employer Advisor 0.002
OHSA 0.063
Mine Rescue 0.000
Construction Certification Training 0.000
Program Administration 0.000
Institute of Work & Health 0.003
Sub-Total 0.088
B.3 Prevention Workplace Safety and
Prevention Services
0.036
B.4 TOTAL OVERHEAD EXPENSES 0.381
Section 6D - ©WSIB Ontario 261

2011 PREMIUM RATES
SUB-COMPONENTS OF OVERHEAD EXPENSES
CLASS D: MANUFACTURING
Overhead Expenses
Component
Overhead Expenses
Sub-Component
Premium Rate
Component
B.1 WSIB Administrative 0.266
B.2 Legislative Obligations
WSIAT 0.014
Office of Worker Advisor 0.007
Office of Employer Advisor 0.002
OHSA 0.065
Mine Rescue 0.000
Construction Certification Training 0.000
Program Administration 0.000
Institute of Work & Health 0.003
Sub-Total 0.091
B.3 Prevention 0.046
B.4 TOTAL OVERHEAD EXPENSES 0.403
Section 6D - ©WSIB Ontario 262

2011 PREMIUM RATE COMPONENTS
RATE GROUP 207: MEAT AND FISH PRODUCTS
(CLASS D: MANUFACTURING)
Component
2011 Premium Rate
Per $100 Of
Insurable Earnings
Percentage
of 2011
Premium Rate
2010 Premium Rate
Per $100 Of
Insurable Earnings
Percentage
of 2010
Premium Rate
A. NEW CLAIMS COST
1. New Claims Cost 1.857 1.857 42% 2.045 2.045 48%
B. OVERHEAD EXPENSES
1. WSIB Administrative 0.405 0.398
2. Legislative Obligations 0.138 0.139
3. Prevention 0.060 0.061
4. TOTAL OVERHEAD EXPENSES 0.603 0.603 14% 0.598 0.598 14%
C. PAST CLAIMS COST
1. Unfunded Liability 1.347 1.110
2. (Gain)/Loss 0.614 0.517
3. Bad Debts 0.035 N/A
4. TOTAL PAST CLAIMS COST 1.996 1.996 45% 1.627 1.627 38%
D. TOTAL PREMIUM RATE (A+B+C) 4.46 100% 4.27 100%
Section 6D - ©WSIB Ontario 263

2011 PREMIUM RATE COMPONENTS
RATE GROUP 210: POULTRY PRODUCTS
(CLASS D: MANUFACTURING)
Component
2011 Premium Rate
Per $100 Of
Insurable Earnings
Percentage
of 2011
Premium Rate
2010 Premium Rate
Per $100 Of
Insurable Earnings
Percentage
of 2010
Premium Rate
A. NEW CLAIMS COST
1. New Claims Cost 1.371 1.371 41% 1.582 1.582 47%
B. OVERHEAD EXPENSES
1. WSIB Administrative 0.337 0.341
2. Legislative Obligations 0.115 0.119
3. Prevention 0.049 0.052
4. TOTAL OVERHEAD EXPENSES 0.501 0.501 15% 0.512 0.512 15%
C. PAST CLAIMS COST
1. Unfunded Liability 0.995 0.859
2. (Gain)/Loss 0.454 0.400
3. Bad Debts 0.027 N/A
4. TOTAL PAST CLAIMS COST 1.476 1.476 44% 1.259 1.259 38%
D. TOTAL PREMIUM RATE (A+B+C) 3.35 100% 3.35 100%
Section 6D - ©WSIB Ontario 264

2011 PREMIUM RATE COMPONENTS
RATE GROUP 214: FRUIT AND VEGETABLE PRODUCTS
(CLASS D: MANUFACTURING)
Component
2011 Premium Rate
Per $100 Of
Insurable Earnings
Percentage
of 2011
Premium Rate
2010 Premium Rate
Per $100 Of
Insurable Earnings
Percentage
of 2010
Premium Rate
A. NEW CLAIMS COST
1. New Claims Cost 1.035 1.035 40% 0.981 0.981 45%
B. OVERHEAD EXPENSES
1. WSIB Administrative 0.290 0.266
2. Legislative Obligations 0.099 0.092
3. Prevention 0.041 0.039
4. TOTAL OVERHEAD EXPENSES 0.430 0.430 17% 0.397 0.397 18%
C. PAST CLAIMS COST
1. Unfunded Liability 0.749 0.532
2. (Gain)/Loss 0.342 0.248
3. Bad Debts 0.017 N/A
4. TOTAL PAST CLAIMS COST 1.108 1.108 43% 0.780 0.780 36%
D. TOTAL PREMIUM RATE (A+B+C) 2.57 100% 2.16 100%
Section 6D - ©WSIB Ontario 265

2011 PREMIUM RATE COMPONENTS
RATE GROUP 216: DAIRY PRODUCTS
(CLASS D: MANUFACTURING)
Component
2011 Premium Rate
Per $100 Of
Insurable Earnings
Percentage
of 2011
Premium Rate
2010 Premium Rate
Per $100 Of
Insurable Earnings
Percentage
of 2010
Premium Rate
A. NEW CLAIMS COST
1. New Claims Cost 0.855 0.855 39% 0.875 0.875 45%
B. OVERHEAD EXPENSES
1. WSIB Administrative 0.265 0.253
2. Legislative Obligations 0.090 0.088
3. Prevention 0.037 0.037
4. TOTAL OVERHEAD EXPENSES 0.392 0.392 18% 0.378 0.378 19%
C. PAST CLAIMS COST
1. Unfunded Liability 0.620 0.475
2. (Gain)/Loss 0.283 0.221
3. Bad Debts 0.016 N/A
4. TOTAL PAST CLAIMS COST 0.919 0.919 42% 0.696 0.696 36%
D. TOTAL PREMIUM RATE (A+B+C) 2.17 100% 1.95 100%
Section 6D - ©WSIB Ontario 266

2011 PREMIUM RATE COMPONENTS
RATE GROUP 220: OTHER BAKERY PRODUCTS
(CLASS D: MANUFACTURING)
Component
2011 Premium Rate
Per $100 Of
Insurable Earnings
Percentage
of 2011
Premium Rate
2010 Premium Rate
Per $100 Of
Insurable Earnings
Percentage
of 2010
Premium Rate
A. NEW CLAIMS COST
1. New Claims Cost 1.582 1.582 41% 1.822 1.822 48%
B. OVERHEAD EXPENSES
1. WSIB Administrative 0.367 0.371
2. Legislative Obligations 0.125 0.129
3. Prevention 0.054 0.056
4. TOTAL OVERHEAD EXPENSES 0.546 0.546 14% 0.556 0.556 15%
C. PAST CLAIMS COST
1. Unfunded Liability 1.148 0.990
2. (Gain)/Loss 0.524 0.460
3. Bad Debts 0.031 N/A
4. TOTAL PAST CLAIMS COST 1.703 1.703 44% 1.450 1.450 38%
D. TOTAL PREMIUM RATE (A+B+C) 3.83 100% 3.83 100%
Section 6D - ©WSIB Ontario 267

2011 PREMIUM RATE COMPONENTS
RATE GROUP 222: CONFECTIONERY
(CLASS D: MANUFACTURING)
Component
2011 Premium Rate
Per $100 Of
Insurable Earnings
Percentage
of 2011
Premium Rate
2010 Premium Rate
Per $100 Of
Insurable Earnings
Percentage
of 2010
Premium Rate
A. NEW CLAIMS COST
1. New Claims Cost 0.663 0.663 38% 0.763 0.763 44%
B. OVERHEAD EXPENSES
1. WSIB Administrative 0.239 0.239
2. Legislative Obligations 0.081 0.083
3. Prevention 0.033 0.035
4. TOTAL OVERHEAD EXPENSES 0.353 0.353 20% 0.357 0.357 21%
C. PAST CLAIMS COST
1. Unfunded Liability 0.482 0.414
2. (Gain)/Loss 0.220 0.193
3. Bad Debts 0.014 N/A
4. TOTAL PAST CLAIMS COST 0.716 0.716 41% 0.607 0.607 35%
D. TOTAL PREMIUM RATE (A+B+C) 1.73 100% 1.73 100%
Section 6D - ©WSIB Ontario 268

2011 PREMIUM RATE COMPONENTS
RATE GROUP 223: BISCUITS, SNACK FOODS AND OTHER FOOD PRODUCTS
(CLASS D: MANUFACTURING)
Component
2011 Premium Rate
Per $100 Of
Insurable Earnings
Percentage
of 2011
Premium Rate
2010 Premium Rate
Per $100 Of
Insurable Earnings
Percentage
of 2010
Premium Rate
A. NEW CLAIMS COST
1. New Claims Cost 1.081 1.081 40% 1.121 1.121 46%
B. OVERHEAD EXPENSES
1. WSIB Administrative 0.297 0.283
2. Legislative Obligations 0.101 0.098
3. Prevention 0.042 0.042
4. TOTAL OVERHEAD EXPENSES 0.440 0.440 16% 0.423 0.423 17%
C. PAST CLAIMS COST
1. Unfunded Liability 0.784 0.609
2. (Gain)/Loss 0.358 0.283
3. Bad Debts 0.020 N/A
4. TOTAL PAST CLAIMS COST 1.162 1.162 43% 0.892 0.892 37%
D. TOTAL PREMIUM RATE (A+B+C) 2.68 100% 2.44 100%
Section 6D - ©WSIB Ontario 269

2011 PREMIUM RATE COMPONENTS
RATE GROUP 226: CRUSHED AND GROUND FOODS
(CLASS D: MANUFACTURING)
Component
2011 Premium Rate
Per $100 Of
Insurable Earnings
Percentage
of 2011
Premium Rate
2010 Premium Rate
Per $100 Of
Insurable Earnings
Percentage
of 2010
Premium Rate
A. NEW CLAIMS COST
1. New Claims Cost 0.613 0.613 38% 0.647 0.647 43%
B. OVERHEAD EXPENSES
1. WSIB Administrative 0.231 0.224
2. Legislative Obligations 0.079 0.078
3. Prevention 0.032 0.033
4. TOTAL OVERHEAD EXPENSES 0.342 0.342 21% 0.335 0.335 22%
C. PAST CLAIMS COST
1. Unfunded Liability 0.445 0.351
2. (Gain)/Loss 0.203 0.164
3. Bad Debts 0.012 N/A
4. TOTAL PAST CLAIMS COST 0.660 0.660 41% 0.515 0.515 34%
D. TOTAL PREMIUM RATE (A+B+C) 1.62 100% 1.50 100%
Section 6D - ©WSIB Ontario 270

2011 PREMIUM RATE COMPONENTS
RATE GROUP 230: ALCOHOLIC BEVERAGES
(CLASS D: MANUFACTURING)
Component
2011 Premium Rate
Per $100 Of
Insurable Earnings
Percentage
of 2011
Premium Rate
2010 Premium Rate
Per $100 Of
Insurable Earnings
Percentage
of 2010
Premium Rate
A. NEW CLAIMS COST
1. New Claims Cost 0.558 0.558 37% 0.643 0.643 43%
B. OVERHEAD EXPENSES
1. WSIB Administrative 0.224 0.224
2. Legislative Obligations 0.076 0.078
3. Prevention 0.030 0.032
4. TOTAL OVERHEAD EXPENSES 0.330 0.330 22% 0.334 0.334 22%
C. PAST CLAIMS COST
1. Unfunded Liability 0.406 0.349
2. (Gain)/Loss 0.185 0.163
3. Bad Debts 0.012 N/A
4. TOTAL PAST CLAIMS COST 0.603 0.603 40% 0.512 0.512 34%
D. TOTAL PREMIUM RATE (A+B+C) 1.49 100% 1.49 100%
Section 6D - ©WSIB Ontario 271

2011 PREMIUM RATE COMPONENTS
RATE GROUP 231: SOFT DRINKS
(CLASS D: MANUFACTURING)
Component
2011 Premium Rate
Per $100 Of
Insurable Earnings
Percentage
of 2011
Premium Rate
2010 Premium Rate
Per $100 Of
Insurable Earnings
Percentage
of 2010
Premium Rate
A. NEW CLAIMS COST
1. New Claims Cost 1.407 1.407 41% 1.461 1.461 47%
B. OVERHEAD EXPENSES
1. WSIB Administrative 0.342 0.326
2. Legislative Obligations 0.117 0.113
3. Prevention 0.050 0.049
4. TOTAL OVERHEAD EXPENSES 0.509 0.509 15% 0.488 0.488 16%
C. PAST CLAIMS COST
1. Unfunded Liability 1.020 0.793
2. (Gain)/Loss 0.465 0.369
3. Bad Debts 0.025 N/A
4. TOTAL PAST CLAIMS COST 1.510 1.510 44% 1.162 1.162 37%
D. TOTAL PREMIUM RATE (A+B+C) 3.43 100% 3.11 100%
Section 6D - ©WSIB Ontario 272

2011 PREMIUM RATE COMPONENTS
RATE GROUP 238: OTHER RUBBER PRODUCTS
(CLASS D: MANUFACTURING)
Component
2011 Premium Rate
Per $100 Of
Insurable Earnings
Percentage
of 2011
Premium Rate
2010 Premium Rate
Per $100 Of
Insurable Earnings
Percentage
of 2010
Premium Rate
A. NEW CLAIMS COST
1. New Claims Cost 1.638 1.638 41% 1.657 1.657 47%
B. OVERHEAD EXPENSES
1. WSIB Administrative 0.374 0.350
2. Legislative Obligations 0.128 0.122
3. Prevention 0.055 0.053
4. TOTAL OVERHEAD EXPENSES 0.557 0.557 14% 0.525 0.525 15%
C. PAST CLAIMS COST
1. Unfunded Liability 1.184 0.900
2. (Gain)/Loss 0.540 0.419
3. Bad Debts 0.026 N/A
4. TOTAL PAST CLAIMS COST 1.750 1.750 44% 1.319 1.319 38%
D. TOTAL PREMIUM RATE (A+B+C) 3.95 100% 3.50 100%
Section 6D - ©WSIB Ontario 273

2011 PREMIUM RATE COMPONENTS
RATE GROUP 258: FOAMED AND EXPANDED PLASTIC PRODUCTS
(CLASS D: MANUFACTURING)
Component
2011 Premium Rate
Per $100 Of
Insurable Earnings
Percentage
of 2011
Premium Rate
2010 Premium Rate
Per $100 Of
Insurable Earnings
Percentage
of 2010
Premium Rate
A. NEW CLAIMS COST
1. New Claims Cost 1.128 1.128 40% 1.144 1.144 46%
B. OVERHEAD EXPENSES
1. WSIB Administrative 0.303 0.286
2. Legislative Obligations 0.103 0.099
3. Prevention 0.043 0.043
4. TOTAL OVERHEAD EXPENSES 0.449 0.449 16% 0.428 0.428 17%
C. PAST CLAIMS COST
1. Unfunded Liability 0.817 0.621
2. (Gain)/Loss 0.373 0.289
3. Bad Debts 0.020 N/A
4. TOTAL PAST CLAIMS COST 1.210 1.210 43% 0.910 0.910 37%
D. TOTAL PREMIUM RATE (A+B+C) 2.79 100% 2.48 100%
Section 6D - ©WSIB Ontario 274

2011 PREMIUM RATE COMPONENTS
RATE GROUP 261: PLASTIC FILM AND SHEETING
(CLASS D: MANUFACTURING)
Component
2011 Premium Rate
Per $100 Of
Insurable Earnings
Percentage
of 2011
Premium Rate
2010 Premium Rate
Per $100 Of
Insurable Earnings
Percentage
of 2010
Premium Rate
A. NEW CLAIMS COST
1. New Claims Cost 0.934 0.934 40% 1.007 1.007 46%
B. OVERHEAD EXPENSES
1. WSIB Administrative 0.276 0.269
2. Legislative Obligations 0.094 0.093
3. Prevention 0.039 0.040
4. TOTAL OVERHEAD EXPENSES 0.409 0.409 17% 0.402 0.402 18%
C. PAST CLAIMS COST
1. Unfunded Liability 0.677 0.547
2. (Gain)/Loss 0.309 0.254
3. Bad Debts 0.018 N/A
4. TOTAL PAST CLAIMS COST 1.004 1.004 43% 0.801 0.801 36%
D. TOTAL PREMIUM RATE (A+B+C) 2.35 100% 2.21 100%
Section 6D - ©WSIB Ontario 275

2011 PREMIUM RATE COMPONENTS
RATE GROUP 263: OTHER PLASTIC PRODUCTS
(CLASS D: MANUFACTURING)
Component
2011 Premium Rate
Per $100 Of
Insurable Earnings
Percentage
of 2011
Premium Rate
2010 Premium Rate
Per $100 Of
Insurable Earnings
Percentage
of 2010
Premium Rate
A. NEW CLAIMS COST
1. New Claims Cost 1.259 1.259 41% 1.351 1.351 47%
B. OVERHEAD EXPENSES
1. WSIB Administrative 0.321 0.312
2. Legislative Obligations 0.110 0.109
3. Prevention 0.046 0.047
4. TOTAL OVERHEAD EXPENSES 0.477 0.477 15% 0.468 0.468 16%
C. PAST CLAIMS COST
1. Unfunded Liability 0.912 0.734
2. (Gain)/Loss 0.416 0.341
3. Bad Debts 0.023 N/A
4. TOTAL PAST CLAIMS COST 1.351 1.351 44% 1.075 1.075 37%
D. TOTAL PREMIUM RATE (A+B+C) 3.09 100% 2.89 100%
Section 6D - ©WSIB Ontario 276

2011 PREMIUM RATE COMPONENTS
RATE GROUP 289: CLOTH, CARPETS AND TEXTILE PRODUCTS
(CLASS D: MANUFACTURING)
Component
2011 Premium Rate
Per $100 Of
Insurable Earnings
Percentage
of 2011
Premium Rate
2010 Premium Rate
Per $100 Of
Insurable Earnings
Percentage
of 2010
Premium Rate
A. NEW CLAIMS COST
1. New Claims Cost 1.460 1.460 41% 1.682 1.682 47%
B. OVERHEAD EXPENSES
1. WSIB Administrative 0.349 0.353
2. Legislative Obligations 0.119 0.123
3. Prevention 0.051 0.054
4. TOTAL OVERHEAD EXPENSES 0.519 0.519 15% 0.530 0.530 15%
C. PAST CLAIMS COST
1. Unfunded Liability 1.058 0.913
2. (Gain)/Loss 0.483 0.425
3. Bad Debts 0.027 N/A
4. TOTAL PAST CLAIMS COST 1.568 1.568 44% 1.338 1.338 38%
D. TOTAL PREMIUM RATE (A+B+C) 3.55 100% 3.55 100%
Section 6D - ©WSIB Ontario 277

2011 PREMIUM RATE COMPONENTS
RATE GROUP 301: CLOTHING, FIBRE AND YARN
(CLASS D: MANUFACTURING)
Component
2011 Premium Rate
Per $100 Of
Insurable Earnings
Percentage
of 2011
Premium Rate
2010 Premium Rate
Per $100 Of
Insurable Earnings
Percentage
of 2010
Premium Rate
A. NEW CLAIMS COST
1. New Claims Cost 0.924 0.924 40% 0.905 0.905 45%
B. OVERHEAD EXPENSES
1. WSIB Administrative 0.274 0.256
2. Legislative Obligations 0.093 0.089
3. Prevention 0.039 0.038
4. TOTAL OVERHEAD EXPENSES 0.406 0.406 18% 0.383 0.383 19%
C. PAST CLAIMS COST
1. Unfunded Liability 0.668 0.491
2. (Gain)/Loss 0.305 0.229
3. Bad Debts 0.015 N/A
4. TOTAL PAST CLAIMS COST 0.988 0.988 43% 0.720 0.720 36%
D. TOTAL PREMIUM RATE (A+B+C) 2.32 100% 2.01 100%
Section 6D - ©WSIB Ontario 278

2011 PREMIUM RATE COMPONENTS
RATE GROUP 308: MILLWORK AND OTHER WOOD INDUSTRIES
(CLASS D: MANUFACTURING)
Component
2011 Premium Rate
Per $100 Of
Insurable Earnings
Percentage
of 2011
Premium Rate
2010 Premium Rate
Per $100 Of
Insurable Earnings
Percentage
of 2010
Premium Rate
A. NEW CLAIMS COST
1. New Claims Cost 2.243 2.243 42% 2.576 2.576 48%
B. OVERHEAD EXPENSES
1. WSIB Administrative 0.458 0.465
2. Legislative Obligations 0.157 0.162
3. Prevention 0.068 0.072
4. TOTAL OVERHEAD EXPENSES 0.683 0.683 13% 0.699 0.699 13%
C. PAST CLAIMS COST
1. Unfunded Liability 1.625 1.399
2. (Gain)/Loss 0.742 0.651
3. Bad Debts 0.040 N/A
4. TOTAL PAST CLAIMS COST 2.407 2.407 45% 2.050 2.050 38%
D. TOTAL PREMIUM RATE (A+B+C) 5.33 100% 5.33 100%
Section 6D - ©WSIB Ontario 279

2011 PREMIUM RATE COMPONENTS
RATE GROUP 311: WOODEN CABINETS
(CLASS D: MANUFACTURING)
Component
2011 Premium Rate
Per $100 Of
Insurable Earnings
Percentage
of 2011
Premium Rate
2010 Premium Rate
Per $100 Of
Insurable Earnings
Percentage
of 2010
Premium Rate
A. NEW CLAIMS COST
1. New Claims Cost 1.649 1.649 41% 1.900 1.900 48%
B. OVERHEAD EXPENSES
1. WSIB Administrative 0.376 0.380
2. Legislative Obligations 0.128 0.133
3. Prevention 0.055 0.058
4. TOTAL OVERHEAD EXPENSES 0.559 0.559 14% 0.571 0.571 14%
C. PAST CLAIMS COST
1. Unfunded Liability 1.195 1.032
2. (Gain)/Loss 0.545 0.480
3. Bad Debts 0.030 N/A
4. TOTAL PAST CLAIMS COST 1.770 1.770 44% 1.512 1.512 38%
D. TOTAL PREMIUM RATE (A+B+C) 3.98 100% 3.98 100%
Section 6D - ©WSIB Ontario 280

2011 PREMIUM RATE COMPONENTS
RATE GROUP 312: WOODEN BOXES AND PALLETS
(CLASS D: MANUFACTURING)
Component
2011 Premium Rate
Per $100 Of
Insurable Earnings
Percentage
of 2011
Premium Rate
2010 Premium Rate
Per $100 Of
Insurable Earnings
Percentage
of 2010
Premium Rate
A. NEW CLAIMS COST
1. New Claims Cost 2.897 2.897 42% 3.333 3.333 49%
B. OVERHEAD EXPENSES
1. WSIB Administrative 0.550 0.559
2. Legislative Obligations 0.188 0.195
3. Prevention 0.083 0.087
4. TOTAL OVERHEAD EXPENSES 0.821 0.821 12% 0.841 0.841 12%
C. PAST CLAIMS COST
1. Unfunded Liability 2.099 1.810
2. (Gain)/Loss 0.958 0.842
3. Bad Debts 0.052 N/A
4. TOTAL PAST CLAIMS COST 3.109 3.109 46% 2.652 2.652 39%
D. TOTAL PREMIUM RATE (A+B+C) 6.83 100% 6.83 100%
Section 6D - ©WSIB Ontario 281

2011 PREMIUM RATE COMPONENTS
RATE GROUP 322: UPHOLSTERED FURNITURE
(CLASS D: MANUFACTURING)
Component
2011 Premium Rate
Per $100 Of
Insurable Earnings
Percentage
of 2011
Premium Rate
2010 Premium Rate
Per $100 Of
Insurable Earnings
Percentage
of 2010
Premium Rate
A. NEW CLAIMS COST
1. New Claims Cost 1.307 1.307 41% 1.392 1.392 47%
B. OVERHEAD EXPENSES
1. WSIB Administrative 0.328 0.317
2. Legislative Obligations 0.112 0.110
3. Prevention 0.047 0.048
4. TOTAL OVERHEAD EXPENSES 0.487 0.487 15% 0.475 0.475 16%
C. PAST CLAIMS COST
1. Unfunded Liability 0.946 0.756
2. (Gain)/Loss 0.432 0.352
3. Bad Debts 0.023 N/A
4. TOTAL PAST CLAIMS COST 1.401 1.401 44% 1.108 1.108 37%
D. TOTAL PREMIUM RATE (A+B+C) 3.20 100% 2.98 100%
Section 6D - ©WSIB Ontario 282

2011 PREMIUM RATE COMPONENTS
RATE GROUP 323: METAL FURNITURE
(CLASS D: MANUFACTURING)
Component
2011 Premium Rate
Per $100 Of
Insurable Earnings
Percentage
of 2011
Premium Rate
2010 Premium Rate
Per $100 Of
Insurable Earnings
Percentage
of 2010
Premium Rate
A. NEW CLAIMS COST
1. New Claims Cost 0.888 0.888 40% 1.023 1.023 46%
B. OVERHEAD EXPENSES
1. WSIB Administrative 0.270 0.271
2. Legislative Obligations 0.092 0.094
3. Prevention 0.038 0.040
4. TOTAL OVERHEAD EXPENSES 0.400 0.400 18% 0.405 0.405 18%
C. PAST CLAIMS COST
1. Unfunded Liability 0.644 0.556
2. (Gain)/Loss 0.294 0.259
3. Bad Debts 0.017 N/A
4. TOTAL PAST CLAIMS COST 0.955 0.955 43% 0.815 0.815 36%
D. TOTAL PREMIUM RATE (A+B+C) 2.24 100% 2.24 100%
Section 6D - ©WSIB Ontario 283
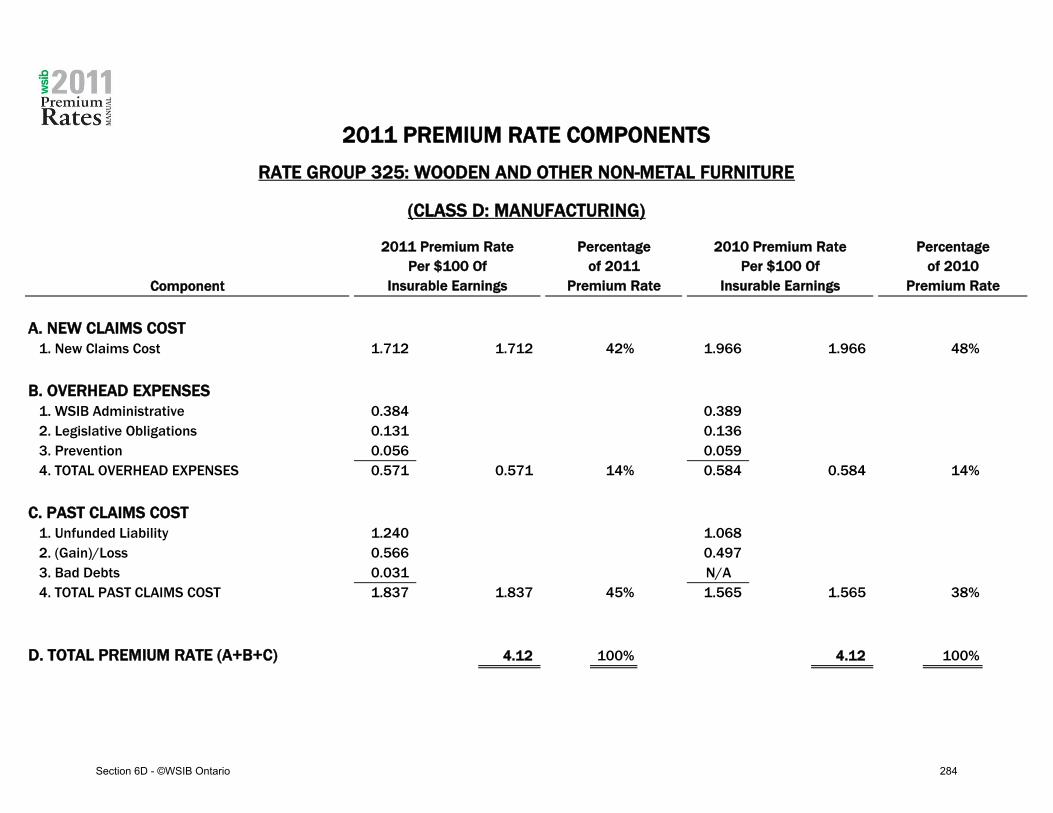
2011 PREMIUM RATE COMPONENTS
RATE GROUP 325: WOODEN AND OTHER NON-METAL FURNITURE
(CLASS D: MANUFACTURING)
Component
2011 Premium Rate
Per $100 Of
Insurable Earnings
Percentage
of 2011
Premium Rate
2010 Premium Rate
Per $100 Of
Insurable Earnings
Percentage
of 2010
Premium Rate
A. NEW CLAIMS COST
1. New Claims Cost 1.712 1.712 42% 1.966 1.966 48%
B. OVERHEAD EXPENSES
1. WSIB Administrative 0.384 0.389
2. Legislative Obligations 0.131 0.136
3. Prevention 0.056 0.059
4. TOTAL OVERHEAD EXPENSES 0.571 0.571 14% 0.584 0.584 14%
C. PAST CLAIMS COST
1. Unfunded Liability 1.240 1.068
2. (Gain)/Loss 0.566 0.497
3. Bad Debts 0.031 N/A
4. TOTAL PAST CLAIMS COST 1.837 1.837 45% 1.565 1.565 38%
D. TOTAL PREMIUM RATE (A+B+C) 4.12 100% 4.12 100%
Section 6D - ©WSIB Ontario 284

2011 PREMIUM RATE COMPONENTS
RATE GROUP 328: FURNITURE PARTS AND FIXTURES
(CLASS D: MANUFACTURING)
Component
2011 Premium Rate
Per $100 Of
Insurable Earnings
Percentage
of 2011
Premium Rate
2010 Premium Rate
Per $100 Of
Insurable Earnings
Percentage
of 2010
Premium Rate
A. NEW CLAIMS COST
1. New Claims Cost 1.655 1.655 41% 1.904 1.904 48%
B. OVERHEAD EXPENSES
1. WSIB Administrative 0.377 0.381
2. Legislative Obligations 0.129 0.133
3. Prevention 0.055 0.058
4. TOTAL OVERHEAD EXPENSES 0.561 0.561 14% 0.572 0.572 14%
C. PAST CLAIMS COST
1. Unfunded Liability 1.199 1.034
2. (Gain)/Loss 0.547 0.481
3. Bad Debts 0.030 N/A
4. TOTAL PAST CLAIMS COST 1.776 1.776 45% 1.515 1.515 38%
D. TOTAL PREMIUM RATE (A+B+C) 3.99 100% 3.99 100%
Section 6D - ©WSIB Ontario 285

2011 PREMIUM RATE COMPONENTS
RATE GROUP 333: PRINTING, PLATEMAKING AND BINDING
(CLASS D: MANUFACTURING)
Component
2011 Premium Rate
Per $100 Of
Insurable Earnings
Percentage
of 2011
Premium Rate
2010 Premium Rate
Per $100 Of
Insurable Earnings
Percentage
of 2010
Premium Rate
A. NEW CLAIMS COST
1. New Claims Cost 0.609 0.609 36% 0.694 0.694 44%
B. OVERHEAD EXPENSES
1. WSIB Administrative 0.231 0.230
2. Legislative Obligations 0.078 0.080
3. Prevention 0.101 0.034
4. TOTAL OVERHEAD EXPENSES 0.410 0.410 24% 0.344 0.344 22%
C. PAST CLAIMS COST
1. Unfunded Liability 0.442 0.377
2. (Gain)/Loss 0.202 0.175
3. Bad Debts 0.012 N/A
4. TOTAL PAST CLAIMS COST 0.656 0.656 39% 0.552 0.552 35%
D. TOTAL PREMIUM RATE (A+B+C) 1.68 100% 1.59 100%
Section 6D - ©WSIB Ontario 286

2011 PREMIUM RATE COMPONENTS
RATE GROUP 335: PUBLISHING
(CLASS D: MANUFACTURING)
Component
2011 Premium Rate
Per $100 Of
Insurable Earnings
Percentage
of 2011
Premium Rate
2010 Premium Rate
Per $100 Of
Insurable Earnings
Percentage
of 2010
Premium Rate
A. NEW CLAIMS COST
1. New Claims Cost 0.192 0.192 36% 0.214 0.214 40%
B. OVERHEAD EXPENSES
1. WSIB Administrative 0.086 0.096
2. Legislative Obligations 0.029 0.033
3. Prevention 0.022 0.024
4. TOTAL OVERHEAD EXPENSES 0.137 0.137 25% 0.153 0.153 28%
C. PAST CLAIMS COST
1. Unfunded Liability 0.140 0.116
2. (Gain)/Loss 0.064 0.054
3. Bad Debts 0.004 N/A
4. TOTAL PAST CLAIMS COST 0.208 0.208 39% 0.170 0.170 31%
D. TOTAL PREMIUM RATE (A+B+C) 0.54 100% 0.54 100%
Section 6D - ©WSIB Ontario 287

2011 PREMIUM RATE COMPONENTS
RATE GROUP 338: FOLDING CARTONS
(CLASS D: MANUFACTURING)
Component
2011 Premium Rate
Per $100 Of
Insurable Earnings
Percentage
of 2011
Premium Rate
2010 Premium Rate
Per $100 Of
Insurable Earnings
Percentage
of 2010
Premium Rate
A. NEW CLAIMS COST
1. New Claims Cost 0.983 0.983 39% 0.995 0.995 45%
B. OVERHEAD EXPENSES
1. WSIB Administrative 0.283 0.268
2. Legislative Obligations 0.096 0.093
3. Prevention 0.119 0.040
4. TOTAL OVERHEAD EXPENSES 0.498 0.498 20% 0.401 0.401 18%
C. PAST CLAIMS COST
1. Unfunded Liability 0.712 0.540
2. (Gain)/Loss 0.325 0.251
3. Bad Debts 0.017 N/A
4. TOTAL PAST CLAIMS COST 1.054 1.054 41% 0.791 0.791 36%
D. TOTAL PREMIUM RATE (A+B+C) 2.54 100% 2.19 100%
Section 6D - ©WSIB Ontario 288

2011 PREMIUM RATE COMPONENTS
RATE GROUP 341: PAPER PRODUCTS
(CLASS D: MANUFACTURING)
Component
2011 Premium Rate
Per $100 Of
Insurable Earnings
Percentage
of 2011
Premium Rate
2010 Premium Rate
Per $100 Of
Insurable Earnings
Percentage
of 2010
Premium Rate
A. NEW CLAIMS COST
1. New Claims Cost 1.205 1.205 40% 1.345 1.345 47%
B. OVERHEAD EXPENSES
1. WSIB Administrative 0.314 0.311
2. Legislative Obligations 0.107 0.108
3. Prevention 0.130 0.047
4. TOTAL OVERHEAD EXPENSES 0.551 0.551 18% 0.466 0.466 16%
C. PAST CLAIMS COST
1. Unfunded Liability 0.873 0.731
2. (Gain)/Loss 0.398 0.340
3. Bad Debts 0.022 N/A
4. TOTAL PAST CLAIMS COST 1.293 1.293 42% 1.071 1.071 37%
D. TOTAL PREMIUM RATE (A+B+C) 3.05 100% 2.88 100%
Section 6D - ©WSIB Ontario 289

2011 PREMIUM RATE COMPONENTS
RATE GROUP 352: STEEL AND OTHER SMELTING AND REFINING INDUSTRIES
(CLASS D: MANUFACTURING)
Component
2011 Premium Rate
Per $100 Of
Insurable Earnings
Percentage
of 2011
Premium Rate
2010 Premium Rate
Per $100 Of
Insurable Earnings
Percentage
of 2010
Premium Rate
A. NEW CLAIMS COST
1. New Claims Cost 0.968 0.968 39% 1.100 1.100 46%
B. OVERHEAD EXPENSES
1. WSIB Administrative 0.281 0.281
2. Legislative Obligations 0.096 0.098
3. Prevention 0.118 0.042
4. TOTAL OVERHEAD EXPENSES 0.495 0.495 20% 0.421 0.421 18%
C. PAST CLAIMS COST
1. Unfunded Liability 0.704 0.597
2. (Gain)/Loss 0.321 0.278
3. Bad Debts 0.021 N/A
4. TOTAL PAST CLAIMS COST 1.046 1.046 42% 0.875 0.875 36%
D. TOTAL PREMIUM RATE (A+B+C) 2.51 100% 2.40 100%
Section 6D - ©WSIB Ontario 290

2011 PREMIUM RATE COMPONENTS
RATE GROUP 358: FOUNDRIES
(CLASS D: MANUFACTURING)
Component
2011 Premium Rate
Per $100 Of
Insurable Earnings
Percentage
of 2011
Premium Rate
2010 Premium Rate
Per $100 Of
Insurable Earnings
Percentage
of 2010
Premium Rate
A. NEW CLAIMS COST
1. New Claims Cost 1.701 1.701 41% 1.963 1.963 48%
B. OVERHEAD EXPENSES
1. WSIB Administrative 0.384 0.388
2. Legislative Obligations 0.131 0.135
3. Prevention 0.056 0.059
4. TOTAL OVERHEAD EXPENSES 0.571 0.571 14% 0.582 0.582 14%
C. PAST CLAIMS COST
1. Unfunded Liability 1.236 1.066
2. (Gain)/Loss 0.564 0.496
3. Bad Debts 0.035 N/A
4. TOTAL PAST CLAIMS COST 1.835 1.835 45% 1.562 1.562 38%
D. TOTAL PREMIUM RATE (A+B+C) 4.11 100% 4.11 100%
Section 6D - ©WSIB Ontario 291

2011 PREMIUM RATE COMPONENTS
RATE GROUP 361: NON-FERROUS METAL INDUSTRIES*
(CLASS D: MANUFACTURING)
Component
2011 Premium Rate
Per $100 Of
Insurable Earnings
Percentage
of 2011
Premium Rate
2010 Premium Rate
Per $100 Of
Insurable Earnings
Percentage
of 2010
Premium Rate
A. NEW CLAIMS COST
1. New Claims Cost 1.414 1.414 41% 1.418 1.418 47%
B. OVERHEAD EXPENSES
1. WSIB Administrative 0.343 0.320
2. Legislative Obligations 0.117 0.111
3. Prevention 0.050 0.048
4. TOTAL OVERHEAD EXPENSES 0.510 0.510 15% 0.479 0.479 16%
C. PAST CLAIMS COST
1. Unfunded Liability 1.023 0.770
2. (Gain)/Loss 0.467 0.358
3. Bad Debts 0.024 N/A
4. TOTAL PAST CLAIMS COST 1.514 1.514 44% 1.128 1.128 37%
D. TOTAL PREMIUM RATE (A+B+C) 3.44 100% 3.03 100%
* Experience for rate groups 361, 390, 419, 421, 424 and 425 has been combined in order to determine a common 2011 premium rate.
Section 6D - ©WSIB Ontario 292

2011 PREMIUM RATE COMPONENTS
RATE GROUP 374: DOORS AND WINDOWS
(CLASS D: MANUFACTURING)
Component
2011 Premium Rate
Per $100 Of
Insurable Earnings
Percentage
of 2011
Premium Rate
2010 Premium Rate
Per $100 Of
Insurable Earnings
Percentage
of 2010
Premium Rate
A. NEW CLAIMS COST
1. New Claims Cost 1.399 1.399 41% 1.610 1.610 47%
B. OVERHEAD EXPENSES
1. WSIB Administrative 0.341 0.344
2. Legislative Obligations 0.116 0.120
3. Prevention 0.049 0.052
4. TOTAL OVERHEAD EXPENSES 0.506 0.506 15% 0.516 0.516 15%
C. PAST CLAIMS COST
1. Unfunded Liability 1.014 0.874
2. (Gain)/Loss 0.463 0.407
3. Bad Debts 0.026 N/A
4. TOTAL PAST CLAIMS COST 1.503 1.503 44% 1.281 1.281 38%
D. TOTAL PREMIUM RATE (A+B+C) 3.41 100% 3.41 100%
Section 6D - ©WSIB Ontario 293

2011 PREMIUM RATE COMPONENTS
RATE GROUP 375: STRUCTURAL AND ARCHITECTURAL PRODUCTS
(CLASS D: MANUFACTURING)
Component
2011 Premium Rate
Per $100 Of
Insurable Earnings
Percentage
of 2011
Premium Rate
2010 Premium Rate
Per $100 Of
Insurable Earnings
Percentage
of 2010
Premium Rate
A. NEW CLAIMS COST
1. New Claims Cost 1.881 1.881 42% 2.168 2.168 48%
B. OVERHEAD EXPENSES
1. WSIB Administrative 0.408 0.414
2. Legislative Obligations 0.140 0.144
3. Prevention 0.060 0.063
4. TOTAL OVERHEAD EXPENSES 0.608 0.608 13% 0.621 0.621 14%
C. PAST CLAIMS COST
1. Unfunded Liability 1.363 1.177
2. (Gain)/Loss 0.622 0.548
3. Bad Debts 0.034 N/A
4. TOTAL PAST CLAIMS COST 2.019 2.019 45% 1.725 1.725 38%
D. TOTAL PREMIUM RATE (A+B+C) 4.51 100% 4.51 100%
Section 6D - ©WSIB Ontario 294

2011 PREMIUM RATE COMPONENTS
RATE GROUP 377: COATING OF METAL PRODUCTS
(CLASS D: MANUFACTURING)
Component
2011 Premium Rate
Per $100 Of
Insurable Earnings
Percentage
of 2011
Premium Rate
2010 Premium Rate
Per $100 Of
Insurable Earnings
Percentage
of 2010
Premium Rate
A. NEW CLAIMS COST
1. New Claims Cost 1.662 1.662 41% 1.912 1.912 48%
B. OVERHEAD EXPENSES
1. WSIB Administrative 0.378 0.382
2. Legislative Obligations 0.129 0.133
3. Prevention 0.055 0.058
4. TOTAL OVERHEAD EXPENSES 0.562 0.562 14% 0.573 0.573 14%
C. PAST CLAIMS COST
1. Unfunded Liability 1.204 1.038
2. (Gain)/Loss 0.550 0.483
3. Bad Debts 0.030 N/A
4. TOTAL PAST CLAIMS COST 1.784 1.784 44% 1.521 1.521 38%
D. TOTAL PREMIUM RATE (A+B+C) 4.01 100% 4.01 100%
Section 6D - ©WSIB Ontario 295

2011 PREMIUM RATE COMPONENTS
RATE GROUP 379: HARDWARE, TOOLS AND CUTLERY
(CLASS D: MANUFACTURING)
Component
2011 Premium Rate
Per $100 Of
Insurable Earnings
Percentage
of 2011
Premium Rate
2010 Premium Rate
Per $100 Of
Insurable Earnings
Percentage
of 2010
Premium Rate
A. NEW CLAIMS COST
1. New Claims Cost 1.056 1.056 40% 1.220 1.220 46%
B. OVERHEAD EXPENSES
1. WSIB Administrative 0.293 0.296
2. Legislative Obligations 0.100 0.103
3. Prevention 0.042 0.044
4. TOTAL OVERHEAD EXPENSES 0.435 0.435 17% 0.443 0.443 17%
C. PAST CLAIMS COST
1. Unfunded Liability 0.766 0.662
2. (Gain)/Loss 0.349 0.308
3. Bad Debts 0.020 N/A
4. TOTAL PAST CLAIMS COST 1.135 1.135 43% 0.970 0.970 37%
D. TOTAL PREMIUM RATE (A+B+C) 2.63 100% 2.63 100%
Section 6D - ©WSIB Ontario 296

2011 PREMIUM RATE COMPONENTS
RATE GROUP 382: METAL DIES, MOULDS AND PATTERNS
(CLASS D: MANUFACTURING)
Component
2011 Premium Rate
Per $100 Of
Insurable Earnings
Percentage
of 2011
Premium Rate
2010 Premium Rate
Per $100 Of
Insurable Earnings
Percentage
of 2010
Premium Rate
A. NEW CLAIMS COST
1. New Claims Cost 0.840 0.840 39% 0.868 0.868 45%
B. OVERHEAD EXPENSES
1. WSIB Administrative 0.263 0.252
2. Legislative Obligations 0.089 0.087
3. Prevention 0.037 0.037
4. TOTAL OVERHEAD EXPENSES 0.389 0.389 18% 0.376 0.376 19%
C. PAST CLAIMS COST
1. Unfunded Liability 0.608 0.471
2. (Gain)/Loss 0.277 0.219
3. Bad Debts 0.015 N/A
4. TOTAL PAST CLAIMS COST 0.900 0.900 42% 0.690 0.690 36%
D. TOTAL PREMIUM RATE (A+B+C) 2.13 100% 1.93 100%
Section 6D - ©WSIB Ontario 297

2011 PREMIUM RATE COMPONENTS
RATE GROUP 383: HEATING, REFRIGERATION AND AIR CONDITIONING EQUIPMENT
(CLASS D: MANUFACTURING)
Component
2011 Premium Rate
Per $100 Of
Insurable Earnings
Percentage
of 2011
Premium Rate
2010 Premium Rate
Per $100 Of
Insurable Earnings
Percentage
of 2010
Premium Rate
A. NEW CLAIMS COST
1. New Claims Cost 1.075 1.075 40% 1.240 1.240 46%
B. OVERHEAD EXPENSES
1. WSIB Administrative 0.296 0.298
2. Legislative Obligations 0.101 0.104
3. Prevention 0.042 0.045
4. TOTAL OVERHEAD EXPENSES 0.439 0.439 16% 0.447 0.447 17%
C. PAST CLAIMS COST
1. Unfunded Liability 0.779 0.674
2. (Gain)/Loss 0.356 0.313
3. Bad Debts 0.020 N/A
4. TOTAL PAST CLAIMS COST 1.155 1.155 43% 0.987 0.987 37%
D. TOTAL PREMIUM RATE (A+B+C) 2.67 100% 2.67 100%
Section 6D - ©WSIB Ontario 298

2011 PREMIUM RATE COMPONENTS
RATE GROUP 385: MACHINE SHOPS
(CLASS D: MANUFACTURING)
Component
2011 Premium Rate
Per $100 Of
Insurable Earnings
Percentage
of 2011
Premium Rate
2010 Premium Rate
Per $100 Of
Insurable Earnings
Percentage
of 2010
Premium Rate
A. NEW CLAIMS COST
1. New Claims Cost 1.000 1.000 40% 1.152 1.152 46%
B. OVERHEAD EXPENSES
1. WSIB Administrative 0.285 0.287
2. Legislative Obligations 0.097 0.100
3. Prevention 0.040 0.043
4. TOTAL OVERHEAD EXPENSES 0.422 0.422 17% 0.430 0.430 17%
C. PAST CLAIMS COST
1. Unfunded Liability 0.725 0.625
2. (Gain)/Loss 0.331 0.291
3. Bad Debts 0.019 N/A
4. TOTAL PAST CLAIMS COST 1.075 1.075 43% 0.916 0.916 37%
D. TOTAL PREMIUM RATE (A+B+C) 2.50 100% 2.50 100%
Section 6D - ©WSIB Ontario 299

2011 PREMIUM RATE COMPONENTS
RATE GROUP 387: OTHER METAL FABRICATING INDUSTRIES
(CLASS D: MANUFACTURING)
Component
2011 Premium Rate
Per $100 Of
Insurable Earnings
Percentage
of 2011
Premium Rate
2010 Premium Rate
Per $100 Of
Insurable Earnings
Percentage
of 2010
Premium Rate
A. NEW CLAIMS COST
1. New Claims Cost 1.446 1.446 41% 1.666 1.666 47%
B. OVERHEAD EXPENSES
1. WSIB Administrative 0.347 0.351
2. Legislative Obligations 0.119 0.122
3. Prevention 0.050 0.053
4. TOTAL OVERHEAD EXPENSES 0.516 0.516 15% 0.526 0.526 15%
C. PAST CLAIMS COST
1. Unfunded Liability 1.048 0.905
2. (Gain)/Loss 0.478 0.421
3. Bad Debts 0.027 N/A
4. TOTAL PAST CLAIMS COST 1.553 1.553 44% 1.326 1.326 38%
D. TOTAL PREMIUM RATE (A+B+C) 3.52 100% 3.52 100%
Section 6D - ©WSIB Ontario 300

2011 PREMIUM RATE COMPONENTS
RATE GROUP 389: METAL CLOSURES AND CONTAINERS
(CLASS D: MANUFACTURING)
Component
2011 Premium Rate
Per $100 Of
Insurable Earnings
Percentage
of 2011
Premium Rate
2010 Premium Rate
Per $100 Of
Insurable Earnings
Percentage
of 2010
Premium Rate
A. NEW CLAIMS COST
1. New Claims Cost 0.992 0.992 40% 1.142 1.142 46%
B. OVERHEAD EXPENSES
1. WSIB Administrative 0.284 0.286
2. Legislative Obligations 0.097 0.099
3. Prevention 0.040 0.043
4. TOTAL OVERHEAD EXPENSES 0.421 0.421 17% 0.428 0.428 17%
C. PAST CLAIMS COST
1. Unfunded Liability 0.720 0.620
2. (Gain)/Loss 0.328 0.289
3. Bad Debts 0.019 N/A
4. TOTAL PAST CLAIMS COST 1.067 1.067 43% 0.909 0.909 37%
D. TOTAL PREMIUM RATE (A+B+C) 2.48 100% 2.48 100%
Section 6D - ©WSIB Ontario 301

2011 PREMIUM RATE COMPONENTS
RATE GROUP 390: OTHER STAMPED AND PRESSED METAL PRODUCTS*
(CLASS D: MANUFACTURING)
Component
2011 Premium Rate
Per $100 Of
Insurable Earnings
Percentage
of 2011
Premium Rate
2010 Premium Rate
Per $100 Of
Insurable Earnings
Percentage
of 2010
Premium Rate
A. NEW CLAIMS COST
1. New Claims Cost 1.414 1.414 41% 1.418 1.418 47%
B. OVERHEAD EXPENSES
1. WSIB Administrative 0.343 0.320
2. Legislative Obligations 0.117 0.111
3. Prevention 0.050 0.048
4. TOTAL OVERHEAD EXPENSES 0.510 0.510 15% 0.479 0.479 16%
C. PAST CLAIMS COST
1. Unfunded Liability 1.023 0.770
2. (Gain)/Loss 0.467 0.358
3. Bad Debts 0.024 N/A
4. TOTAL PAST CLAIMS COST 1.514 1.514 44% 1.128 1.128 37%
D. TOTAL PREMIUM RATE (A+B+C) 3.44 100% 3.03 100%
* Experience for rate groups 361, 390, 419, 421, 424 and 425 has been combined in order to determine a common 2011 premium rate.
Section 6D - ©WSIB Ontario 302

2011 PREMIUM RATE COMPONENTS
RATE GROUP 393: WIRE PRODUCTS
(CLASS D: MANUFACTURING)
Component
2011 Premium Rate
Per $100 Of
Insurable Earnings
Percentage
of 2011
Premium Rate
2010 Premium Rate
Per $100 Of
Insurable Earnings
Percentage
of 2010
Premium Rate
A. NEW CLAIMS COST
1. New Claims Cost 1.320 1.320 41% 1.405 1.405 47%
B. OVERHEAD EXPENSES
1. WSIB Administrative 0.330 0.319
2. Legislative Obligations 0.113 0.111
3. Prevention 0.048 0.048
4. TOTAL OVERHEAD EXPENSES 0.491 0.491 15% 0.478 0.478 16%
C. PAST CLAIMS COST
1. Unfunded Liability 0.956 0.763
2. (Gain)/Loss 0.436 0.355
3. Bad Debts 0.023 N/A
4. TOTAL PAST CLAIMS COST 1.415 1.415 44% 1.118 1.118 37%
D. TOTAL PREMIUM RATE (A+B+C) 3.23 100% 3.00 100%
Section 6D - ©WSIB Ontario 303

2011 PREMIUM RATE COMPONENTS
RATE GROUP 402: MAJOR APPLIANCES AND TRANSMISSION EQUIPMENT
(CLASS D: MANUFACTURING)
Component
2011 Premium Rate
Per $100 Of
Insurable Earnings
Percentage
of 2011
Premium Rate
2010 Premium Rate
Per $100 Of
Insurable Earnings
Percentage
of 2010
Premium Rate
A. NEW CLAIMS COST
1. New Claims Cost 0.884 0.884 40% 0.927 0.927 45%
B. OVERHEAD EXPENSES
1. WSIB Administrative 0.269 0.259
2. Legislative Obligations 0.092 0.090
3. Prevention 0.038 0.038
4. TOTAL OVERHEAD EXPENSES 0.399 0.399 18% 0.387 0.387 19%
C. PAST CLAIMS COST
1. Unfunded Liability 0.640 0.504
2. (Gain)/Loss 0.292 0.234
3. Bad Debts 0.016 N/A
4. TOTAL PAST CLAIMS COST 0.948 0.948 43% 0.738 0.738 36%
D. TOTAL PREMIUM RATE (A+B+C) 2.23 100% 2.05 100%
Section 6D - ©WSIB Ontario 304

2011 PREMIUM RATE COMPONENTS
RATE GROUP 403: OTHER MACHINERY AND EQUIPMENT
(CLASS D: MANUFACTURING)
Component
2011 Premium Rate
Per $100 Of
Insurable Earnings
Percentage
of 2011
Premium Rate
2010 Premium Rate
Per $100 Of
Insurable Earnings
Percentage
of 2010
Premium Rate
A. NEW CLAIMS COST
1. New Claims Cost 0.639 0.639 38% 0.689 0.689 44%
B. OVERHEAD EXPENSES
1. WSIB Administrative 0.235 0.230
2. Legislative Obligations 0.080 0.080
3. Prevention 0.032 0.033
4. TOTAL OVERHEAD EXPENSES 0.347 0.347 21% 0.343 0.343 22%
C. PAST CLAIMS COST
1. Unfunded Liability 0.463 0.374
2. (Gain)/Loss 0.211 0.174
3. Bad Debts 0.012 N/A
4. TOTAL PAST CLAIMS COST 0.686 0.686 41% 0.548 0.548 35%
D. TOTAL PREMIUM RATE (A+B+C) 1.67 100% 1.58 100%
Section 6D - ©WSIB Ontario 305

2011 PREMIUM RATE COMPONENTS
RATE GROUP 406: ELEVATORS AND ESCALATORS
(CLASS D: MANUFACTURING)
Component
2011 Premium Rate
Per $100 Of
Insurable Earnings
Percentage
of 2011
Premium Rate
2010 Premium Rate
Per $100 Of
Insurable Earnings
Percentage
of 2010
Premium Rate
A. NEW CLAIMS COST
1. New Claims Cost 1.041 1.041 40% 1.199 1.199 46%
B. OVERHEAD EXPENSES
1. WSIB Administrative 0.291 0.293
2. Legislative Obligations 0.099 0.102
3. Prevention 0.041 0.044
4. TOTAL OVERHEAD EXPENSES 0.431 0.431 17% 0.439 0.439 17%
C. PAST CLAIMS COST
1. Unfunded Liability 0.755 0.651
2. (Gain)/Loss 0.345 0.303
3. Bad Debts 0.020 N/A
4. TOTAL PAST CLAIMS COST 1.120 1.120 43% 0.954 0.954 37%
D. TOTAL PREMIUM RATE (A+B+C) 2.59 100% 2.59 100%
Section 6D - ©WSIB Ontario 306

2011 PREMIUM RATE COMPONENTS
RATE GROUP 408: BOILERS, PUMPS AND FANS
(CLASS D: MANUFACTURING)
Component
2011 Premium Rate
Per $100 Of
Insurable Earnings
Percentage
of 2011
Premium Rate
2010 Premium Rate
Per $100 Of
Insurable Earnings
Percentage
of 2010
Premium Rate
A. NEW CLAIMS COST
1. New Claims Cost 0.936 0.936 40% 1.079 1.079 46%
B. OVERHEAD EXPENSES
1. WSIB Administrative 0.276 0.278
2. Legislative Obligations 0.094 0.097
3. Prevention 0.039 0.041
4. TOTAL OVERHEAD EXPENSES 0.409 0.409 17% 0.416 0.416 18%
C. PAST CLAIMS COST
1. Unfunded Liability 0.679 0.586
2. (Gain)/Loss 0.310 0.273
3. Bad Debts 0.018 N/A
4. TOTAL PAST CLAIMS COST 1.007 1.007 43% 0.859 0.859 37%
D. TOTAL PREMIUM RATE (A+B+C) 2.35 100% 2.35 100%
Section 6D - ©WSIB Ontario 307

2011 PREMIUM RATE COMPONENTS
RATE GROUP 411: AGRICULTURAL, CONSTRUCTION AND MINING MACHINERY
(CLASS D: MANUFACTURING)
Component
2011 Premium Rate
Per $100 Of
Insurable Earnings
Percentage
of 2011
Premium Rate
2010 Premium Rate
Per $100 Of
Insurable Earnings
Percentage
of 2010
Premium Rate
A. NEW CLAIMS COST
1. New Claims Cost 1.115 1.115 40% 1.218 1.218 46%
B. OVERHEAD EXPENSES
1. WSIB Administrative 0.301 0.295
2. Legislative Obligations 0.103 0.103
3. Prevention 0.043 0.044
4. TOTAL OVERHEAD EXPENSES 0.447 0.447 16% 0.442 0.442 17%
C. PAST CLAIMS COST
1. Unfunded Liability 0.808 0.661
2. (Gain)/Loss 0.369 0.308
3. Bad Debts 0.020 N/A
4. TOTAL PAST CLAIMS COST 1.197 1.197 43% 0.969 0.969 37%
D. TOTAL PREMIUM RATE (A+B+C) 2.76 100% 2.63 100%
Section 6D - ©WSIB Ontario 308

2011 PREMIUM RATE COMPONENTS
RATE GROUP 417: AIRCRAFT MANUFACTURING
(CLASS D: MANUFACTURING)
Component
2011 Premium Rate
Per $100 Of
Insurable Earnings
Percentage
of 2011
Premium Rate
2010 Premium Rate
Per $100 Of
Insurable Earnings
Percentage
of 2010
Premium Rate
A. NEW CLAIMS COST
1. New Claims Cost 0.563 0.563 38% 0.602 0.602 43%
B. OVERHEAD EXPENSES
1. WSIB Administrative 0.224 0.219
2. Legislative Obligations 0.076 0.076
3. Prevention 0.030 0.032
4. TOTAL OVERHEAD EXPENSES 0.330 0.330 22% 0.327 0.327 23%
C. PAST CLAIMS COST
1. Unfunded Liability 0.409 0.327
2. (Gain)/Loss 0.186 0.152
3. Bad Debts 0.011 N/A
4. TOTAL PAST CLAIMS COST 0.606 0.606 40% 0.479 0.479 34%
D. TOTAL PREMIUM RATE (A+B+C) 1.50 100% 1.41 100%
Section 6D - ©WSIB Ontario 309

2011 PREMIUM RATE COMPONENTS
RATE GROUP 419: MOTOR VEHICLE ASSEMBLY*
(CLASS D: MANUFACTURING)
Component
2011 Premium Rate
Per $100 Of
Insurable Earnings
Percentage
of 2011
Premium Rate
2010 Premium Rate
Per $100 Of
Insurable Earnings
Percentage
of 2010
Premium Rate
A. NEW CLAIMS COST
1. New Claims Cost 1.414 1.414 41% 1.418 1.418 47%
B. OVERHEAD EXPENSES
1. WSIB Administrative 0.343 0.320
2. Legislative Obligations 0.117 0.111
3. Prevention 0.050 0.048
4. TOTAL OVERHEAD EXPENSES 0.510 0.510 15% 0.479 0.479 16%
C. PAST CLAIMS COST
1. Unfunded Liability 1.023 0.770
2. (Gain)/Loss 0.467 0.358
3. Bad Debts 0.024 N/A
4. TOTAL PAST CLAIMS COST 1.514 1.514 44% 1.128 1.128 37%
D. TOTAL PREMIUM RATE (A+B+C) 3.44 100% 3.03 100%
* Experience for rate groups 361, 390, 419, 421, 424 and 425 has been combined in order to determine a common 2011 premium rate.
Section 6D - ©WSIB Ontario 310

2011 PREMIUM RATE COMPONENTS
RATE GROUP 420: MOTOR VEHICLE ENGINE MANUFACTURING
(CLASS D: MANUFACTURING)
Component
2011 Premium Rate
Per $100 Of
Insurable Earnings
Percentage
of 2011
Premium Rate
2010 Premium Rate
Per $100 Of
Insurable Earnings
Percentage
of 2010
Premium Rate
A. NEW CLAIMS COST
1. New Claims Cost 0.700 0.700 39% 0.705 0.705 44%
B. OVERHEAD EXPENSES
1. WSIB Administrative 0.243 0.231
2. Legislative Obligations 0.083 0.080
3. Prevention 0.034 0.034
4. TOTAL OVERHEAD EXPENSES 0.360 0.360 20% 0.345 0.345 21%
C. PAST CLAIMS COST
1. Unfunded Liability 0.508 0.383
2. (Gain)/Loss 0.232 0.178
3. Bad Debts 0.013 N/A
4. TOTAL PAST CLAIMS COST 0.753 0.753 42% 0.561 0.561 35%
D. TOTAL PREMIUM RATE (A+B+C) 1.81 100% 1.61 100%
Section 6D - ©WSIB Ontario 311

2011 PREMIUM RATE COMPONENTS
RATE GROUP 421: OTHER MOTOR VEHICLE PARTS AND EQUIPMENT*
(CLASS D: MANUFACTURING)
Component
2011 Premium Rate
Per $100 Of
Insurable Earnings
Percentage
of 2011
Premium Rate
2010 Premium Rate
Per $100 Of
Insurable Earnings
Percentage
of 2010
Premium Rate
A. NEW CLAIMS COST
1. New Claims Cost 1.414 1.414 41% 1.418 1.418 47%
B. OVERHEAD EXPENSES
1. WSIB Administrative 0.343 0.320
2. Legislative Obligations 0.117 0.111
3. Prevention 0.050 0.048
4. TOTAL OVERHEAD EXPENSES 0.510 0.510 15% 0.479 0.479 16%
C. PAST CLAIMS COST
1. Unfunded Liability 1.023 0.770
2. (Gain)/Loss 0.467 0.358
3. Bad Debts 0.024 N/A
4. TOTAL PAST CLAIMS COST 1.514 1.514 44% 1.128 1.128 37%
D. TOTAL PREMIUM RATE (A+B+C) 3.44 100% 3.03 100%
* Experience for rate groups 361, 390, 419, 421, 424 and 425 has been combined in order to determine a common 2011 premium rate.
Section 6D - ©WSIB Ontario 312

2011 PREMIUM RATE COMPONENTS
RATE GROUP 424: MOTOR VEHICLE STAMPINGS*
(CLASS D: MANUFACTURING)
Component
2011 Premium Rate
Per $100 Of
Insurable Earnings
Percentage
of 2011
Premium Rate
2010 Premium Rate
Per $100 Of
Insurable Earnings
Percentage
of 2010
Premium Rate
A. NEW CLAIMS COST
1. New Claims Cost 1.414 1.414 41% 1.418 1.418 47%
B. OVERHEAD EXPENSES
1. WSIB Administrative 0.343 0.320
2. Legislative Obligations 0.117 0.111
3. Prevention 0.050 0.048
4. TOTAL OVERHEAD EXPENSES 0.510 0.510 15% 0.479 0.479 16%
C. PAST CLAIMS COST
1. Unfunded Liability 1.023 0.770
2. (Gain)/Loss 0.467 0.358
3. Bad Debts 0.024 N/A
4. TOTAL PAST CLAIMS COST 1.514 1.514 44% 1.128 1.128 37%
D. TOTAL PREMIUM RATE (A+B+C) 3.44 100% 3.03 100%
* Experience for rate groups 361, 390, 419, 421, 424 and 425 has been combined in order to determine a common 2011 premium rate.
Section 6D - ©WSIB Ontario 313

2011 PREMIUM RATE COMPONENTS
RATE GROUP 425: MOTOR VEHICLE WHEELS AND BRAKES*
(CLASS D: MANUFACTURING)
Component
2011 Premium Rate
Per $100 Of
Insurable Earnings
Percentage
of 2011
Premium Rate
2010 Premium Rate
Per $100 Of
Insurable Earnings
Percentage
of 2010
Premium Rate
A. NEW CLAIMS COST
1. New Claims Cost 1.414 1.414 41% 1.418 1.418 47%
B. OVERHEAD EXPENSES
1. WSIB Administrative 0.343 0.320
2. Legislative Obligations 0.117 0.111
3. Prevention 0.050 0.048
4. TOTAL OVERHEAD EXPENSES 0.510 0.510 15% 0.479 0.479 16%
C. PAST CLAIMS COST
1. Unfunded Liability 1.023 0.770
2. (Gain)/Loss 0.467 0.358
3. Bad Debts 0.024 N/A
4. TOTAL PAST CLAIMS COST 1.514 1.514 44% 1.128 1.128 37%
D. TOTAL PREMIUM RATE (A+B+C) 3.44 100% 3.03 100%
* Experience for rate groups 361, 390, 419, 421, 424 and 425 has been combined in order to determine a common 2011 premium rate.
Section 6D - ©WSIB Ontario 314

2011 PREMIUM RATE COMPONENTS
RATE GROUP 428: MOTOR VEHICLE FABRIC ACCESSORIES
(CLASS D: MANUFACTURING)
Component
2011 Premium Rate
Per $100 Of
Insurable Earnings
Percentage
of 2011
Premium Rate
2010 Premium Rate
Per $100 Of
Insurable Earnings
Percentage
of 2010
Premium Rate
A. NEW CLAIMS COST
1. New Claims Cost 1.829 1.829 42% 1.733 1.733 47%
B. OVERHEAD EXPENSES
1. WSIB Administrative 0.400 0.360
2. Legislative Obligations 0.137 0.125
3. Prevention 0.059 0.055
4. TOTAL OVERHEAD EXPENSES 0.596 0.596 14% 0.540 0.540 15%
C. PAST CLAIMS COST
1. Unfunded Liability 1.322 0.941
2. (Gain)/Loss 0.603 0.438
3. Bad Debts 0.029 N/A
4. TOTAL PAST CLAIMS COST 1.954 1.954 45% 1.379 1.379 38%
D. TOTAL PREMIUM RATE (A+B+C) 4.38 100% 3.65 100%
Section 6D - ©WSIB Ontario 315

2011 PREMIUM RATE COMPONENTS
RATE GROUP 432: TRUCKS, BUSES AND TRAILERS
(CLASS D: MANUFACTURING)
Component
2011 Premium Rate
Per $100 Of
Insurable Earnings
Percentage
of 2011
Premium Rate
2010 Premium Rate
Per $100 Of
Insurable Earnings
Percentage
of 2010
Premium Rate
A. NEW CLAIMS COST
1. New Claims Cost 1.749 1.749 42% 2.014 2.014 48%
B. OVERHEAD EXPENSES
1. WSIB Administrative 0.390 0.395
2. Legislative Obligations 0.133 0.138
3. Prevention 0.057 0.060
4. TOTAL OVERHEAD EXPENSES 0.580 0.580 14% 0.593 0.593 14%
C. PAST CLAIMS COST
1. Unfunded Liability 1.269 1.093
2. (Gain)/Loss 0.579 0.509
3. Bad Debts 0.033 N/A
4. TOTAL PAST CLAIMS COST 1.881 1.881 45% 1.602 1.602 38%
D. TOTAL PREMIUM RATE (A+B+C) 4.21 100% 4.21 100%
Section 6D - ©WSIB Ontario 316

2011 PREMIUM RATE COMPONENTS
RATE GROUP 442: RAILROAD ROLLING STOCK
(CLASS D: MANUFACTURING)
Component
2011 Premium Rate
Per $100 Of
Insurable Earnings
Percentage
of 2011
Premium Rate
2010 Premium Rate
Per $100 Of
Insurable Earnings
Percentage
of 2010
Premium Rate
A. NEW CLAIMS COST
1. New Claims Cost 1.056 1.056 40% 1.217 1.217 46%
B. OVERHEAD EXPENSES
1. WSIB Administrative 0.293 0.295
2. Legislative Obligations 0.100 0.103
3. Prevention 0.042 0.044
4. TOTAL OVERHEAD EXPENSES 0.435 0.435 17% 0.442 0.442 17%
C. PAST CLAIMS COST
1. Unfunded Liability 0.766 0.661
2. (Gain)/Loss 0.350 0.307
3. Bad Debts 0.020 N/A
4. TOTAL PAST CLAIMS COST 1.136 1.136 43% 0.968 0.968 37%
D. TOTAL PREMIUM RATE (A+B+C) 2.63 100% 2.63 100%
Section 6D - ©WSIB Ontario 317

2011 PREMIUM RATE COMPONENTS
RATE GROUP 460: LIGHTING AND SMALL ELECTRICAL APPLIANCES
(CLASS D: MANUFACTURING)
Component
2011 Premium Rate
Per $100 Of
Insurable Earnings
Percentage
of 2011
Premium Rate
2010 Premium Rate
Per $100 Of
Insurable Earnings
Percentage
of 2010
Premium Rate
A. NEW CLAIMS COST
1. New Claims Cost 1.019 1.019 40% 1.172 1.172 46%
B. OVERHEAD EXPENSES
1. WSIB Administrative 0.288 0.290
2. Legislative Obligations 0.098 0.101
3. Prevention 0.041 0.043
4. TOTAL OVERHEAD EXPENSES 0.427 0.427 17% 0.434 0.434 17%
C. PAST CLAIMS COST
1. Unfunded Liability 0.739 0.636
2. (Gain)/Loss 0.337 0.296
3. Bad Debts 0.019 N/A
4. TOTAL PAST CLAIMS COST 1.095 1.095 43% 0.932 0.932 37%
D. TOTAL PREMIUM RATE (A+B+C) 2.54 100% 2.54 100%
Section 6D - ©WSIB Ontario 318

2011 PREMIUM RATE COMPONENTS
RATE GROUP 466: COMMUNICATION AND ENERGY WIRE PRODUCTS
(CLASS D: MANUFACTURING)
Component
2011 Premium Rate
Per $100 Of
Insurable Earnings
Percentage
of 2011
Premium Rate
2010 Premium Rate
Per $100 Of
Insurable Earnings
Percentage
of 2010
Premium Rate
A. NEW CLAIMS COST
1. New Claims Cost 0.931 0.931 40% 0.986 0.986 45%
B. OVERHEAD EXPENSES
1. WSIB Administrative 0.276 0.267
2. Legislative Obligations 0.094 0.093
3. Prevention 0.039 0.039
4. TOTAL OVERHEAD EXPENSES 0.409 0.409 17% 0.399 0.399 18%
C. PAST CLAIMS COST
1. Unfunded Liability 0.674 0.536
2. (Gain)/Loss 0.308 0.249
3. Bad Debts 0.016 N/A
4. TOTAL PAST CLAIMS COST 0.998 0.998 43% 0.785 0.785 36%
D. TOTAL PREMIUM RATE (A+B+C) 2.34 100% 2.17 100%
Section 6D - ©WSIB Ontario 319

2011 PREMIUM RATE COMPONENTS
RATE GROUP 468: ELECTRONIC EQUIPMENT & OTHER COMMUNICATION DEVICES
(CLASS D: MANUFACTURING)
Component
2011 Premium Rate
Per $100 Of
Insurable Earnings
Percentage
of 2011
Premium Rate
2010 Premium Rate
Per $100 Of
Insurable Earnings
Percentage
of 2010
Premium Rate
A. NEW CLAIMS COST
1. New Claims Cost 0.138 0.138 35% 0.154 0.154 39%
B. OVERHEAD EXPENSES
1. WSIB Administrative 0.062 0.069
2. Legislative Obligations 0.021 0.024
3. Prevention 0.021 0.023
4. TOTAL OVERHEAD EXPENSES 0.104 0.104 27% 0.116 0.116 30%
C. PAST CLAIMS COST
1. Unfunded Liability 0.101 0.084
2. (Gain)/Loss 0.046 0.039
3. Bad Debts 0.003 N/A
4. TOTAL PAST CLAIMS COST 0.150 0.150 38% 0.123 0.123 32%
D. TOTAL PREMIUM RATE (A+B+C) 0.39 100% 0.39 100%
Section 6D - ©WSIB Ontario 320

2011 PREMIUM RATE COMPONENTS
RATE GROUP 477: INDUSTRIAL ELECTRICAL EQUIPMENT
(CLASS D: MANUFACTURING)
Component
2011 Premium Rate
Per $100 Of
Insurable Earnings
Percentage
of 2011
Premium Rate
2010 Premium Rate
Per $100 Of
Insurable Earnings
Percentage
of 2010
Premium Rate
A. NEW CLAIMS COST
1. New Claims Cost 0.559 0.559 38% 0.644 0.644 43%
B. OVERHEAD EXPENSES
1. WSIB Administrative 0.224 0.224
2. Legislative Obligations 0.076 0.078
3. Prevention 0.030 0.032
4. TOTAL OVERHEAD EXPENSES 0.330 0.330 22% 0.334 0.334 22%
C. PAST CLAIMS COST
1. Unfunded Liability 0.406 0.350
2. (Gain)/Loss 0.185 0.163
3. Bad Debts 0.011 N/A
4. TOTAL PAST CLAIMS COST 0.602 0.602 40% 0.513 0.513 34%
D. TOTAL PREMIUM RATE (A+B+C) 1.49 100% 1.49 100%
Section 6D - ©WSIB Ontario 321

2011 PREMIUM RATE COMPONENTS
RATE GROUP 485: BRICKS, CERAMICS AND ABRASIVES
(CLASS D: MANUFACTURING)
Component
2011 Premium Rate
Per $100 Of
Insurable Earnings
Percentage
of 2011
Premium Rate
2010 Premium Rate
Per $100 Of
Insurable Earnings
Percentage
of 2010
Premium Rate
A. NEW CLAIMS COST
1. New Claims Cost 1.805 1.805 42% 2.080 2.080 48%
B. OVERHEAD EXPENSES
1. WSIB Administrative 0.397 0.403
2. Legislative Obligations 0.136 0.140
3. Prevention 0.059 0.062
4. TOTAL OVERHEAD EXPENSES 0.592 0.592 14% 0.605 0.605 14%
C. PAST CLAIMS COST
1. Unfunded Liability 1.308 1.129
2. (Gain)/Loss 0.597 0.525
3. Bad Debts 0.033 N/A
4. TOTAL PAST CLAIMS COST 1.938 1.938 45% 1.654 1.654 38%
D. TOTAL PREMIUM RATE (A+B+C) 4.34 100% 4.34 100%
Section 6D - ©WSIB Ontario 322

2011 PREMIUM RATE COMPONENTS
RATE GROUP 496: CONCRETE PRODUCTS
(CLASS D: MANUFACTURING)
Component
2011 Premium Rate
Per $100 Of
Insurable Earnings
Percentage
of 2011
Premium Rate
2010 Premium Rate
Per $100 Of
Insurable Earnings
Percentage
of 2010
Premium Rate
A. NEW CLAIMS COST
1. New Claims Cost 2.181 2.181 42% 2.506 2.506 48%
B. OVERHEAD EXPENSES
1. WSIB Administrative 0.450 0.456
2. Legislative Obligations 0.154 0.159
3. Prevention 0.067 0.070
4. TOTAL OVERHEAD EXPENSES 0.671 0.671 13% 0.685 0.685 13%
C. PAST CLAIMS COST
1. Unfunded Liability 1.580 1.361
2. (Gain)/Loss 0.721 0.633
3. Bad Debts 0.039 N/A
4. TOTAL PAST CLAIMS COST 2.340 2.340 45% 1.994 1.994 38%
D. TOTAL PREMIUM RATE (A+B+C) 5.19 100% 5.19 100%
Section 6D - ©WSIB Ontario 323

2011 PREMIUM RATE COMPONENTS
RATE GROUP 497: READY-MIX CONCRETE
(CLASS D: MANUFACTURING)
Component
2011 Premium Rate
Per $100 Of
Insurable Earnings
Percentage
of 2011
Premium Rate
2010 Premium Rate
Per $100 Of
Insurable Earnings
Percentage
of 2010
Premium Rate
A. NEW CLAIMS COST
1. New Claims Cost 1.534 1.534 41% 1.670 1.670 47%
B. OVERHEAD EXPENSES
1. WSIB Administrative 0.360 0.352
2. Legislative Obligations 0.123 0.123
3. Prevention 0.093 0.042
4. TOTAL OVERHEAD EXPENSES 0.576 0.576 15% 0.517 0.517 15%
C. PAST CLAIMS COST
1. Unfunded Liability 1.112 0.907
2. (Gain)/Loss 0.507 0.422
3. Bad Debts 0.028 N/A
4. TOTAL PAST CLAIMS COST 1.647 1.647 44% 1.329 1.329 38%
D. TOTAL PREMIUM RATE (A+B+C) 3.76 100% 3.52 100%
Section 6D - ©WSIB Ontario 324

2011 PREMIUM RATE COMPONENTS
RATE GROUP 501: NON-METALLIC MINERAL PRODUCTS
(CLASS D: MANUFACTURING)
Component
2011 Premium Rate
Per $100 Of
Insurable Earnings
Percentage
of 2011
Premium Rate
2010 Premium Rate
Per $100 Of
Insurable Earnings
Percentage
of 2010
Premium Rate
A. NEW CLAIMS COST
1. New Claims Cost 1.163 1.163 41% 1.268 1.268 46%
B. OVERHEAD EXPENSES
1. WSIB Administrative 0.308 0.302
2. Legislative Obligations 0.105 0.105
3. Prevention 0.044 0.045
4. TOTAL OVERHEAD EXPENSES 0.457 0.457 16% 0.452 0.452 17%
C. PAST CLAIMS COST
1. Unfunded Liability 0.843 0.689
2. (Gain)/Loss 0.385 0.320
3. Bad Debts 0.021 N/A
4. TOTAL PAST CLAIMS COST 1.249 1.249 44% 1.009 1.009 37%
D. TOTAL PREMIUM RATE (A+B+C) 2.87 100% 2.73 100%
Section 6D - ©WSIB Ontario 325

2011 PREMIUM RATE COMPONENTS
RATE GROUP 502: GLASS PRODUCTS
(CLASS D: MANUFACTURING)
Component
2011 Premium Rate
Per $100 Of
Insurable Earnings
Percentage
of 2011
Premium Rate
2010 Premium Rate
Per $100 Of
Insurable Earnings
Percentage
of 2010
Premium Rate
A. NEW CLAIMS COST
1. New Claims Cost 1.190 1.190 41% 1.183 1.183 46%
B. OVERHEAD EXPENSES
1. WSIB Administrative 0.311 0.291
2. Legislative Obligations 0.106 0.101
3. Prevention 0.045 0.043
4. TOTAL OVERHEAD EXPENSES 0.462 0.462 16% 0.435 0.435 17%
C. PAST CLAIMS COST
1. Unfunded Liability 0.860 0.642
2. (Gain)/Loss 0.393 0.299
3. Bad Debts 0.019 N/A
4. TOTAL PAST CLAIMS COST 1.272 1.272 44% 0.941 0.941 37%
D. TOTAL PREMIUM RATE (A+B+C) 2.92 100% 2.56 100%
Section 6D - ©WSIB Ontario 326

2011 PREMIUM RATE COMPONENTS
RATE GROUP 507: PETROLEUM AND COAL PRODUCTS
(CLASS D: MANUFACTURING)
Component
2011 Premium Rate
Per $100 Of
Insurable Earnings
Percentage
of 2011
Premium Rate
2010 Premium Rate
Per $100 Of
Insurable Earnings
Percentage
of 2010
Premium Rate
A. NEW CLAIMS COST
1. New Claims Cost 0.414 0.414 37% 0.401 0.401 41%
B. OVERHEAD EXPENSES
1. WSIB Administrative 0.185 0.179
2. Legislative Obligations 0.063 0.062
3. Prevention 0.027 0.028
4. TOTAL OVERHEAD EXPENSES 0.275 0.275 24% 0.269 0.269 27%
C. PAST CLAIMS COST
1. Unfunded Liability 0.300 0.218
2. (Gain)/Loss 0.137 0.101
3. Bad Debts 0.008 N/A
4. TOTAL PAST CLAIMS COST 0.445 0.445 39% 0.319 0.319 32%
D. TOTAL PREMIUM RATE (A+B+C) 1.13 100% 0.99 100%
Section 6D - ©WSIB Ontario 327

2011 PREMIUM RATE COMPONENTS
RATE GROUP 512: RESINS, PAINT, INK AND ADHESIVES
(CLASS D: MANUFACTURING)
Component
2011 Premium Rate
Per $100 Of
Insurable Earnings
Percentage
of 2011
Premium Rate
2010 Premium Rate
Per $100 Of
Insurable Earnings
Percentage
of 2010
Premium Rate
A. NEW CLAIMS COST
1. New Claims Cost 0.643 0.643 38% 0.678 0.678 43%
B. OVERHEAD EXPENSES
1. WSIB Administrative 0.236 0.228
2. Legislative Obligations 0.080 0.079
3. Prevention 0.032 0.033
4. TOTAL OVERHEAD EXPENSES 0.348 0.348 21% 0.340 0.340 22%
C. PAST CLAIMS COST
1. Unfunded Liability 0.466 0.368
2. (Gain)/Loss 0.213 0.171
3. Bad Debts 0.012 N/A
4. TOTAL PAST CLAIMS COST 0.691 0.691 41% 0.539 0.539 35%
D. TOTAL PREMIUM RATE (A+B+C) 1.68 100% 1.56 100%
Section 6D - ©WSIB Ontario 328

2011 PREMIUM RATE COMPONENTS
RATE GROUP 514: PHARMACEUTICALS AND MEDICINES
(CLASS D: MANUFACTURING)
Component
2011 Premium Rate
Per $100 Of
Insurable Earnings
Percentage
of 2011
Premium Rate
2010 Premium Rate
Per $100 Of
Insurable Earnings
Percentage
of 2010
Premium Rate
A. NEW CLAIMS COST
1. New Claims Cost 0.334 0.334 36% 0.323 0.323 40%
B. OVERHEAD EXPENSES
1. WSIB Administrative 0.150 0.144
2. Legislative Obligations 0.051 0.050
3. Prevention 0.025 0.026
4. TOTAL OVERHEAD EXPENSES 0.226 0.226 25% 0.220 0.220 28%
C. PAST CLAIMS COST
1. Unfunded Liability 0.242 0.176
2. (Gain)/Loss 0.111 0.082
3. Bad Debts 0.006 N/A
4. TOTAL PAST CLAIMS COST 0.359 0.359 39% 0.258 0.258 32%
D. TOTAL PREMIUM RATE (A+B+C) 0.92 100% 0.80 100%
Section 6D - ©WSIB Ontario 329

2011 PREMIUM RATE COMPONENTS
RATE GROUP 517: SOAP AND TOILETRIES
(CLASS D: MANUFACTURING)
Component
2011 Premium Rate
Per $100 Of
Insurable Earnings
Percentage
of 2011
Premium Rate
2010 Premium Rate
Per $100 Of
Insurable Earnings
Percentage
of 2010
Premium Rate
A. NEW CLAIMS COST
1. New Claims Cost 0.609 0.609 38% 0.667 0.667 43%
B. OVERHEAD EXPENSES
1. WSIB Administrative 0.231 0.227
2. Legislative Obligations 0.078 0.079
3. Prevention 0.032 0.033
4. TOTAL OVERHEAD EXPENSES 0.341 0.341 21% 0.339 0.339 22%
C. PAST CLAIMS COST
1. Unfunded Liability 0.442 0.362
2. (Gain)/Loss 0.202 0.168
3. Bad Debts 0.012 N/A
4. TOTAL PAST CLAIMS COST 0.656 0.656 41% 0.530 0.530 34%
D. TOTAL PREMIUM RATE (A+B+C) 1.61 100% 1.54 100%
Section 6D - ©WSIB Ontario 330

2011 PREMIUM RATE COMPONENTS
RATE GROUP 524: CHEMICAL INDUSTRIES
(CLASS D: MANUFACTURING)
Component
2011 Premium Rate
Per $100 Of
Insurable Earnings
Percentage
of 2011
Premium Rate
2010 Premium Rate
Per $100 Of
Insurable Earnings
Percentage
of 2010
Premium Rate
A. NEW CLAIMS COST
1. New Claims Cost 0.729 0.729 39% 0.793 0.793 44%
B. OVERHEAD EXPENSES
1. WSIB Administrative 0.248 0.242
2. Legislative Obligations 0.084 0.084
3. Prevention 0.034 0.036
4. TOTAL OVERHEAD EXPENSES 0.366 0.366 19% 0.362 0.362 20%
C. PAST CLAIMS COST
1. Unfunded Liability 0.529 0.430
2. (Gain)/Loss 0.241 0.200
3. Bad Debts 0.014 N/A
4. TOTAL PAST CLAIMS COST 0.784 0.784 42% 0.630 0.630 35%
D. TOTAL PREMIUM RATE (A+B+C) 1.88 100% 1.79 100%
Section 6D - ©WSIB Ontario 331

2011 PREMIUM RATE COMPONENTS
RATE GROUP 529: JEWELRY AND INSTRUMENTS
(CLASS D: MANUFACTURING)
Component
2011 Premium Rate
Per $100 Of
Insurable Earnings
Percentage
of 2011
Premium Rate
2010 Premium Rate
Per $100 Of
Insurable Earnings
Percentage
of 2010
Premium Rate
A. NEW CLAIMS COST
1. New Claims Cost 0.356 0.356 36% 0.397 0.397 41%
B. OVERHEAD EXPENSES
1. WSIB Administrative 0.159 0.177
2. Legislative Obligations 0.054 0.061
3. Prevention 0.026 0.027
4. TOTAL OVERHEAD EXPENSES 0.239 0.239 24% 0.265 0.265 27%
C. PAST CLAIMS COST
1. Unfunded Liability 0.259 0.215
2. (Gain)/Loss 0.118 0.100
3. Bad Debts 0.007 N/A
4. TOTAL PAST CLAIMS COST 0.384 0.384 39% 0.315 0.315 32%
D. TOTAL PREMIUM RATE (A+B+C) 0.98 100% 0.98 100%
Section 6D - ©WSIB Ontario 332

2011 PREMIUM RATE COMPONENTS
RATE GROUP 533: SIGNS AND DISPLAYS
(CLASS D: MANUFACTURING)
Component
2011 Premium Rate
Per $100 Of
Insurable Earnings
Percentage
of 2011
Premium Rate
2010 Premium Rate
Per $100 Of
Insurable Earnings
Percentage
of 2010
Premium Rate
A. NEW CLAIMS COST
1. New Claims Cost 1.247 1.247 41% 1.437 1.437 47%
B. OVERHEAD EXPENSES
1. WSIB Administrative 0.320 0.323
2. Legislative Obligations 0.109 0.112
3. Prevention 0.046 0.049
4. TOTAL OVERHEAD EXPENSES 0.475 0.475 16% 0.484 0.484 16%
C. PAST CLAIMS COST
1. Unfunded Liability 0.904 0.780
2. (Gain)/Loss 0.413 0.363
3. Bad Debts 0.023 N/A
4. TOTAL PAST CLAIMS COST 1.340 1.340 44% 1.143 1.143 37%
D. TOTAL PREMIUM RATE (A+B+C) 3.06 100% 3.06 100%
Section 6D - ©WSIB Ontario 333

2011 PREMIUM RATE COMPONENTS
RATE GROUP 538: SPORTING GOODS AND TOYS
(CLASS D: MANUFACTURING)
Component
2011 Premium Rate
Per $100 Of
Insurable Earnings
Percentage
of 2011
Premium Rate
2010 Premium Rate
Per $100 Of
Insurable Earnings
Percentage
of 2010
Premium Rate
A. NEW CLAIMS COST
1. New Claims Cost 1.700 1.700 41% 1.957 1.957 48%
B. OVERHEAD EXPENSES
1. WSIB Administrative 0.383 0.388
2. Legislative Obligations 0.131 0.135
3. Prevention 0.056 0.059
4. TOTAL OVERHEAD EXPENSES 0.570 0.570 14% 0.582 0.582 14%
C. PAST CLAIMS COST
1. Unfunded Liability 1.232 1.063
2. (Gain)/Loss 0.562 0.495
3. Bad Debts 0.031 N/A
4. TOTAL PAST CLAIMS COST 1.825 1.825 45% 1.558 1.558 38%
D. TOTAL PREMIUM RATE (A+B+C) 4.10 100% 4.10 100%
Section 6D - ©WSIB Ontario 334

2011 PREMIUM RATE COMPONENTS
RATE GROUP 542: OTHER MANUFACTURED PRODUCTS
(CLASS D: MANUFACTURING)
Component
2011 Premium Rate
Per $100 Of
Insurable Earnings
Percentage
of 2011
Premium Rate
2010 Premium Rate
Per $100 Of
Insurable Earnings
Percentage
of 2010
Premium Rate
A. NEW CLAIMS COST
1. New Claims Cost 0.799 0.799 39% 0.922 0.922 45%
B. OVERHEAD EXPENSES
1. WSIB Administrative 0.257 0.259
2. Legislative Obligations 0.088 0.090
3. Prevention 0.036 0.038
4. TOTAL OVERHEAD EXPENSES 0.381 0.381 19% 0.387 0.387 19%
C. PAST CLAIMS COST
1. Unfunded Liability 0.579 0.501
2. (Gain)/Loss 0.264 0.233
3. Bad Debts 0.015 N/A
4. TOTAL PAST CLAIMS COST 0.858 0.858 42% 0.734 0.734 36%
D. TOTAL PREMIUM RATE (A+B+C) 2.04 100% 2.04 100%
Section 6D - ©WSIB Ontario 335

2011 PREMIUM RATE COMPONENTS
CLASS D: MANUFACTURING
Component
2011 Premium Rate
Per $100 Of
Insurable Earnings
Percentage
of 2011
Premium Rate
2010 Premium Rate
Per $100 Of
Insurable Earnings
Percentage
of 2010
Premium Rate
A. NEW CLAIMS COST
1. New Claims Cost 0.969 0.969 40% 1.078 1.078 46%
B. OVERHEAD EXPENSES
1. WSIB Administrative 0.266 0.266
2. Legislative Obligations 0.091 0.093
3. Prevention 0.046 0.041
4. TOTAL OVERHEAD EXPENSES 0.403 0.403 17% 0.400 0.400 17%
C. PAST CLAIMS COST
1. Unfunded Liability 0.702 0.585
2. (Gain)/Loss 0.320 0.272
3. Bad Debts 0.018 N/A
4. TOTAL PAST CLAIMS COST 1.040 1.040 43% 0.857 0.857 37%
D. TOTAL PREMIUM RATE (A+B+C) 2.41 100% 2.34 100%
Section 6D - ©WSIB Ontario 336

2011 PREMIUM RATES
Summary of Premium Rate Components by Rate Group
per $100 of Insurable Earnings
New Past 2011
Rate
Group Description
Claims
Cost
($)
Overhead
($)
Claims
Cost
($)
Premium
Rate
($)
207 MEAT AND FISH PRODUCTS 1.857 0.603 1.996 4.46
210 POULTRY PRODUCTS 1.371 0.501 1.476 3.35
214 FRUIT AND VEGETABLE PRODUCTS 1.035 0.430 1.108 2.57
216 DAIRY PRODUCTS 0.855 0.392 0.919 2.17
220 OTHER BAKERY PRODUCTS 1.582 0.546 1.703 3.83
222 CONFECTIONERY 0.663 0.353 0.716 1.73
223 BISCUITS, SNACK FOODS AND OTHER FOOD PRODUCTS 1.081 0.440 1.162 2.68
226 CRUSHED AND GROUND FOODS 0.613 0.342 0.660 1.62
230 ALCOHOLIC BEVERAGES 0.558 0.330 0.603 1.49
231 SOFT DRINKS 1.407 0.509 1.510 3.43
238 OTHER RUBBER PRODUCTS 1.638 0.557 1.750 3.95
258 FOAMED AND EXPANDED PLASTIC PRODUCTS 1.128 0.449 1.210 2.79
261 PLASTIC FILM AND SHEETING 0.934 0.409 1.004 2.35
263 OTHER PLASTIC PRODUCTS 1.259 0.477 1.351 3.09
289 CLOTH, CARPETS AND TEXTILE PRODUCTS 1.460 0.519 1.568 3.55
301 CLOTHING, FIBRE AND YARN 0.924 0.406 0.988 2.32
308 MILLWORK AND OTHER WOOD INDUSTRIES 2.243 0.683 2.407 5.33
311 WOODEN CABINETS 1.649 0.559 1.770 3.98
312 WOODEN BOXES AND PALLETS 2.897 0.821 3.109 6.83
Section 6D - ©WSIB Ontario 337

2011 PREMIUM RATES
Summary of Premium Rate Components by Rate Group
per $100 of Insurable Earnings
New Past 2011
Rate
Group Description
Claims
Cost
($)
Overhead
($)
Claims
Cost
($)
Premium
Rate
($)
322 UPHOLSTERED FURNITURE 1.307 0.487 1.401 3.20
323 METAL FURNITURE 0.888 0.400 0.955 2.24
325 WOODEN AND OTHER NON-METAL FURNITURE 1.712 0.571 1.837 4.12
328 FURNITURE PARTS AND FIXTURES 1.655 0.561 1.776 3.99
333 PRINTING, PLATEMAKING AND BINDING 0.609 0.410 0.656 1.68
335 PUBLISHING 0.192 0.137 0.208 0.54
338 FOLDING CARTONS 0.983 0.498 1.054 2.54
341 PAPER PRODUCTS 1.205 0.551 1.293 3.05
352 STEEL AND OTHER SMELTING AND REFINING INDUSTRIES 0.968 0.495 1.046 2.51
358 FOUNDRIES 1.701 0.571 1.835 4.11
361 NON-FERROUS METAL INDUSTRIES 1.414 0.510 1.514 3.44
374 DOORS AND WINDOWS 1.399 0.506 1.503 3.41
375 STRUCTURAL AND ARCHITECTURAL PRODUCTS 1.881 0.608 2.019 4.51
377 COATING OF METAL PRODUCTS 1.662 0.562 1.784 4.01
379 HARDWARE, TOOLS AND CUTLERY 1.056 0.435 1.135 2.63
382 METAL DIES, MOULDS AND PATTERNS 0.840 0.389 0.900 2.13
383 HEATING, REFRIGERATION AND AIR CONDITIONING EQUIPMENT 1.075 0.439 1.155 2.67
385 MACHINE SHOPS 1.000 0.422 1.075 2.50
387 OTHER METAL FABRICATING INDUSTRIES 1.446 0.516 1.553 3.52
389 METAL CLOSURES AND CONTAINERS 0.992 0.421 1.067 2.48Section 6D - ©WSIB Ontario 338

2011 PREMIUM RATES
Summary of Premium Rate Components by Rate Group
per $100 of Insurable Earnings
New Past 2011
Rate
Group Description
Claims
Cost
($)
Overhead
($)
Claims
Cost
($)
Premium
Rate
($)
390 OTHER STAMPED AND PRESSED METAL PRODUCTS 1.414 0.510 1.514 3.44
393 WIRE PRODUCTS 1.320 0.491 1.415 3.23
402 MAJOR APPLIANCES AND TRANSMISSION EQUIPMENT 0.884 0.399 0.948 2.23
403 OTHER MACHINERY AND EQUIPMENT 0.639 0.347 0.686 1.67
406 ELEVATORS AND ESCALATORS 1.041 0.431 1.120 2.59
408 BOILERS, PUMPS AND FANS 0.936 0.409 1.007 2.35
411 AGRICULTURAL, CONSTRUCTION AND MINING MACHINERY 1.115 0.447 1.197 2.76
417 AIRCRAFT MANUFACTURING 0.563 0.330 0.606 1.50
419 MOTOR VEHICLE ASSEMBLY 1.414 0.510 1.514 3.44
420 MOTOR VEHICLE ENGINE MANUFACTURING 0.700 0.360 0.753 1.81
421 OTHER MOTOR VEHICLE PARTS AND EQUIPMENT 1.414 0.510 1.514 3.44
424 MOTOR VEHICLE STAMPINGS 1.414 0.510 1.514 3.44
425 MOTOR VEHICLE WHEELS AND BRAKES 1.414 0.510 1.514 3.44
428 MOTOR VEHICLE FABRIC ACCESSORIES 1.829 0.596 1.954 4.38
432 TRUCKS, BUSES AND TRAILERS 1.749 0.580 1.881 4.21
442 RAILROAD ROLLING STOCK 1.056 0.435 1.136 2.63
460 LIGHTING AND SMALL ELECTRICAL APPLIANCES 1.019 0.427 1.095 2.54
466 COMMUNICATION AND ENERGY WIRE PRODUCTS 0.931 0.409 0.998 2.34
468 ELECTRONIC EQUIPMENT & OTHER COMMUNICATION DEVICES 0.138 0.104 0.150 0.39
477 INDUSTRIAL ELECTRICAL EQUIPMENT 0.559 0.330 0.602 1.49Section 6D - ©WSIB Ontario 339
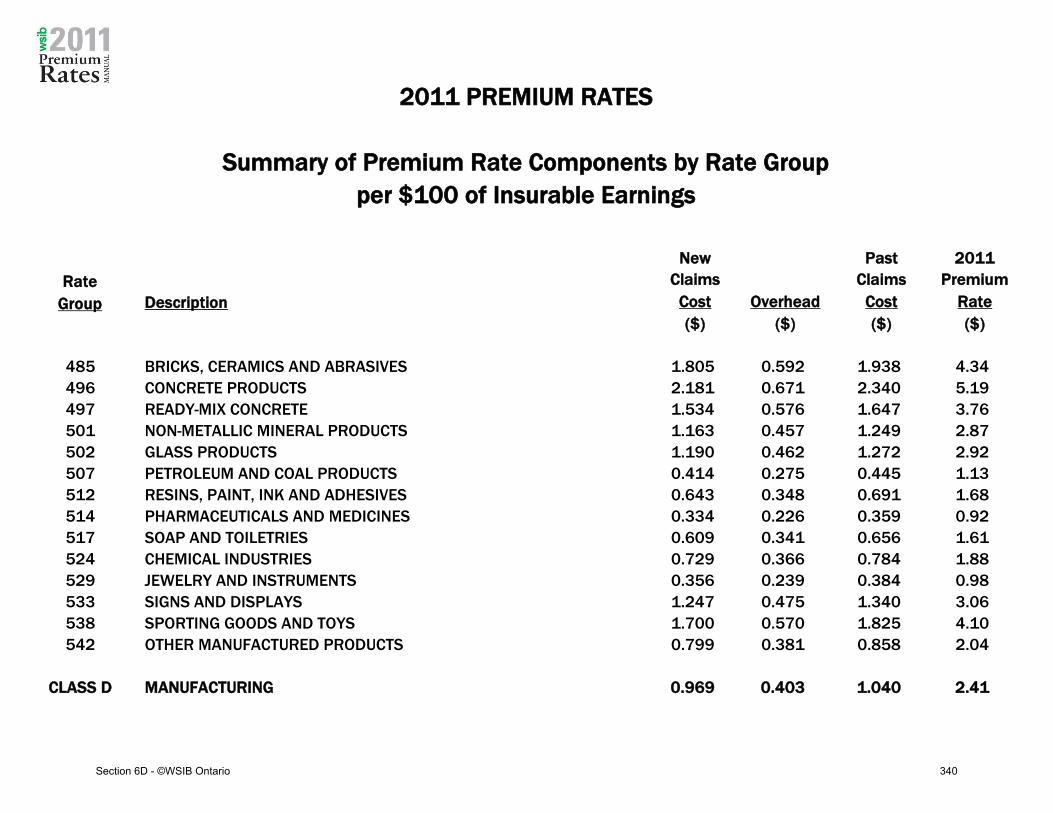
2011 PREMIUM RATES
Summary of Premium Rate Components by Rate Group
per $100 of Insurable Earnings
New Past 2011
Rate
Group Description
Claims
Cost
($)
Overhead
($)
Claims
Cost
($)
Premium
Rate
($)
485 BRICKS, CERAMICS AND ABRASIVES 1.805 0.592 1.938 4.34
496 CONCRETE PRODUCTS 2.181 0.671 2.340 5.19
497 READY-MIX CONCRETE 1.534 0.576 1.647 3.76
501 NON-METALLIC MINERAL PRODUCTS 1.163 0.457 1.249 2.87
502 GLASS PRODUCTS 1.190 0.462 1.272 2.92
507 PETROLEUM AND COAL PRODUCTS 0.414 0.275 0.445 1.13
512 RESINS, PAINT, INK AND ADHESIVES 0.643 0.348 0.691 1.68
514 PHARMACEUTICALS AND MEDICINES 0.334 0.226 0.359 0.92
517 SOAP AND TOILETRIES 0.609 0.341 0.656 1.61
524 CHEMICAL INDUSTRIES 0.729 0.366 0.784 1.88
529 JEWELRY AND INSTRUMENTS 0.356 0.239 0.384 0.98
533 SIGNS AND DISPLAYS 1.247 0.475 1.340 3.06
538 SPORTING GOODS AND TOYS 1.700 0.570 1.825 4.10
542 OTHER MANUFACTURED PRODUCTS 0.799 0.381 0.858 2.04
CLASS D MANUFACTURING 0.969 0.403 1.040 2.41
Section 6D - ©WSIB Ontario 340

2011Premium Rates M
ANUAL
SECTION 6EClass E – Transportation and Storage

2011 PREMIUM RATES
6-YEAR HISTORICAL SUMMARY AND 2-YEAR PROJECTION
RATE GROUP 551: AIR TRANSPORT INDUSTRIES
(CLASS E: TRANSPORTATION AND STORAGE)
Year
Insurable
Earnings
Maximum
Insurable
Earnings
Ceiling
Average
Insurable
Earnings Employment
Total
Number of
Injuries
Total Injury
Rate
2004 $298,447,406 $66,800 $30,073 9,924 405 4.08%
2005 $300,809,827 $67,700 $34,398 8,745 402 4.60%
2006 $337,502,678 $69,400 $33,258 10,148 352 3.47%
2007 $380,150,070 $71,800 $38,015 10,000 391 3.91%
2008 $418,126,752 $73,300 $38,112 10,971 381 3.47%
2009 $432,327,080 $74,600 $35,524 12,170 343 2.82%
2010 $433,314,449 $77,600 $36,152 11,986 320 2.67%
2011 $441,310,793 $79,600 $36,566 12,069 304 2.52%
Section 6E - ©WSIB Ontario 341

2011 PREMIUM RATES
6-YEAR HISTORICAL SUMMARY AND 2-YEAR PROJECTION
RATE GROUP 553: AIR TRANSPORT SERVICES
(CLASS E: TRANSPORTATION AND STORAGE)
Year
Insurable
Earnings
Maximum
Insurable
Earnings
Ceiling
Average
Insurable
Earnings Employment
Total
Number of
Injuries
Total Injury
Rate
2004 $312,878,329 $66,800 $27,769 11,267 522 4.63%
2005 $328,020,343 $67,700 $30,511 10,751 512 4.76%
2006 $346,006,684 $69,400 $28,671 12,068 485 4.02%
2007 $349,028,244 $71,800 $30,135 11,582 635 5.48%
2008 $369,664,076 $73,300 $33,478 11,042 569 5.15%
2009 $370,756,600 $74,600 $33,890 10,940 505 4.62%
2010 $371,603,351 $77,600 $34,488 10,775 490 4.55%
2011 $378,460,885 $79,600 $34,881 10,850 487 4.49%
Section 6E - ©WSIB Ontario 342

2011 PREMIUM RATES
6-YEAR HISTORICAL SUMMARY AND 2-YEAR PROJECTION
RATE GROUP 560: WAREHOUSING
(CLASS E: TRANSPORTATION AND STORAGE)
Year
Insurable
Earnings
Maximum
Insurable
Earnings
Ceiling
Average
Insurable
Earnings Employment
Total
Number of
Injuries
Total Injury
Rate
2004 $535,199,371 $66,800 $31,107 17,205 1,548 9.00%
2005 $587,407,915 $67,700 $32,359 18,153 1,742 9.60%
2006 $680,996,233 $69,400 $32,875 20,715 1,725 8.33%
2007 $723,926,460 $71,800 $33,521 21,596 1,845 8.54%
2008 $793,841,527 $73,300 $32,821 24,187 1,920 7.94%
2009 $798,451,220 $74,600 $32,431 24,620 1,808 7.34%
2010 $800,274,760 $77,600 $33,004 24,248 1,685 6.95%
2011 $815,042,956 $79,600 $33,382 24,416 1,604 6.57%
Section 6E - ©WSIB Ontario 343

2011 PREMIUM RATES
6-YEAR HISTORICAL SUMMARY AND 2-YEAR PROJECTION
RATE GROUP 570: GENERAL TRUCKING
(CLASS E: TRANSPORTATION AND STORAGE)
Year
Insurable
Earnings
Maximum
Insurable
Earnings
Ceiling
Average
Insurable
Earnings Employment
Total
Number of
Injuries
Total Injury
Rate
2004 $3,398,365,804 $66,800 $41,153 82,579 7,581 9.18%
2005 $3,588,224,662 $67,700 $42,295 84,838 7,832 9.23%
2006 $3,728,085,830 $69,400 $42,899 86,904 7,051 8.11%
2007 $3,828,982,225 $71,800 $42,996 89,054 7,365 8.27%
2008 $3,809,190,432 $73,300 $42,528 89,569 7,152 7.98%
2009 $3,396,181,100 $74,600 $42,827 79,300 5,591 7.05%
2010 $3,403,937,458 $77,600 $43,583 78,103 5,210 6.67%
2011 $3,466,753,402 $79,600 $44,080 78,646 4,962 6.31%
Section 6E - ©WSIB Ontario 344

2011 PREMIUM RATES
6-YEAR HISTORICAL SUMMARY AND 2-YEAR PROJECTION
RATE GROUP 577: COURIER SERVICES
(CLASS E: TRANSPORTATION AND STORAGE)
Year
Insurable
Earnings
Maximum
Insurable
Earnings
Ceiling
Average
Insurable
Earnings Employment
Total
Number of
Injuries
Total Injury
Rate
2004 $656,090,801 $66,800 $32,293 20,317 2,246 11.05%
2005 $677,750,327 $67,700 $33,375 20,307 2,193 10.80%
2006 $716,479,829 $69,400 $34,587 20,715 2,025 9.78%
2007 $743,786,620 $71,800 $35,850 20,747 2,030 9.78%
2008 $772,083,962 $73,300 $35,074 22,013 1,985 9.02%
2009 $741,369,788 $74,600 $36,767 20,164 1,666 8.26%
2010 $743,062,963 $77,600 $37,415 19,860 1,553 7.82%
2011 $756,775,377 $79,600 $37,843 19,998 1,478 7.39%
Section 6E - ©WSIB Ontario 345

2011 PREMIUM RATES
6-YEAR HISTORICAL SUMMARY AND 2-YEAR PROJECTION
RATE GROUP 580: MISCELLANEOUS TRANSPORT INDUSTRIES
(CLASS E: TRANSPORTATION AND STORAGE)
Year
Insurable
Earnings
Maximum
Insurable
Earnings
Ceiling
Average
Insurable
Earnings Employment
Total
Number of
Injuries
Total Injury
Rate
2004 $310,720,461 $66,800 $37,310 8,328 714 8.57%
2005 $330,047,669 $67,700 $37,382 8,829 741 8.39%
2006 $356,028,257 $69,400 $38,627 9,217 662 7.18%
2007 $371,291,741 $71,800 $39,668 9,360 716 7.65%
2008 $404,927,718 $73,300 $40,729 9,942 745 7.49%
2009 $397,250,768 $74,600 $39,496 10,058 681 6.77%
2010 $398,158,028 $77,600 $40,194 9,906 635 6.41%
2011 $405,505,599 $79,600 $40,652 9,975 604 6.06%
Section 6E - ©WSIB Ontario 346

2011 PREMIUM RATES
6-YEAR HISTORICAL SUMMARY AND 2-YEAR PROJECTION
RATE GROUP 584: SCHOOL BUSES
(CLASS E: TRANSPORTATION AND STORAGE)
Year
Insurable
Earnings
Maximum
Insurable
Earnings
Ceiling
Average
Insurable
Earnings Employment
Total
Number of
Injuries
Total Injury
Rate
2004 $270,460,299 $66,800 $20,545 13,164 571 4.34%
2005 $287,581,583 $67,700 $22,350 12,867 602 4.68%
2006 $299,752,061 $69,400 $22,285 13,451 563 4.19%
2007 $315,836,700 $71,800 $22,645 13,947 591 4.24%
2008 $326,795,145 $73,300 $21,999 14,855 601 4.05%
2009 $325,891,188 $74,600 $22,788 14,301 501 3.50%
2010 $326,635,474 $77,600 $23,190 14,085 477 3.39%
2011 $332,663,175 $79,600 $23,455 14,183 464 3.27%
Section 6E - ©WSIB Ontario 347

2011 PREMIUM RATES
6-YEAR HISTORICAL SUMMARY AND 2-YEAR PROJECTION
RATE GROUP 590: AMBULANCE SERVICES
(CLASS E: TRANSPORTATION AND STORAGE)
Year
Insurable
Earnings
Maximum
Insurable
Earnings
Ceiling
Average
Insurable
Earnings Employment
Total
Number of
Injuries
Total Injury
Rate
2004 $127,501,140 $66,800 $55,508 2,297 440 19.16%
2005 $108,983,731 $67,700 $59,881 1,820 334 18.35%
2006 $116,654,471 $69,400 $63,159 1,847 334 18.08%
2007 $128,188,721 $71,800 $64,255 1,995 398 19.95%
2008 $139,953,066 $73,300 $63,789 2,194 387 17.64%
2009 $139,600,577 $74,600 $67,019 2,083 368 17.67%
2010 $139,919,403 $77,600 $68,187 2,052 357 17.40%
2011 $142,501,463 $79,600 $68,975 2,066 355 17.18%
Section 6E - ©WSIB Ontario 348

2011 PREMIUM RATES
6-YEAR HISTORICAL SUMMARY AND 2-YEAR PROJECTION
CLASS E: TRANSPORTATION AND STORAGE
Year
Insurable
Earnings
Maximum
Insurable
Earnings
Ceiling
Average
Insurable
Earnings Employment
Total
Number of
Injuries
Total Injury
Rate
2004 $5,909,663,611 $66,800 $35,799 165,081 14,027 8.50%
2005 $6,208,826,057 $67,700 $37,333 166,310 14,358 8.63%
2006 $6,581,506,043 $69,400 $37,595 175,065 13,197 7.54%
2007 $6,841,190,781 $71,800 $38,373 178,281 13,971 7.84%
2008 $7,034,582,678 $73,300 $38,071 184,773 13,740 7.44%
2009 $6,601,828,321 $74,600 $38,021 173,636 11,463 6.60%
2010 $6,616,905,886 $77,600 $38,692 171,015 10,727 6.27%
2011 $6,739,013,650 $79,600 $39,134 172,203 10,258 5.96%
Section 6E - ©WSIB Ontario 349

2011 PREMIUM RATESNEW CLAIMS COST BY RATE GROUP
2011 New Claims Cost 2011
Rate
Group Description Cost Index *
(%)
Cost per Claim
($)
Premium
Rate
($)
551 AIR TRANSPORT INDUSTRIES 76% 12,387 2.00
553 AIR TRANSPORT SERVICES 38% 6,134 1.85
560 WAREHOUSING 43% 7,017 3.28
570 GENERAL TRUCKING 124% 20,087 6.43
577 COURIER SERVICES 38% 6,155 2.89
580 MISCELLANEOUS TRANSPORT INDUSTRIES 92% 14,842 4.89
584 SCHOOL BUSES 53% 8,645 2.91
590 AMBULANCE SERVICES 68% 10,945 6.18
CLASS E TRANSPORTATION AND STORAGE 14,002 4.83
* The Cost Index compares the average cost of a claim for a Rate Group to that of the Class.Section 6E - ©WSIB Ontario 350

2011 PREMIUM RATES
SUB-COMPONENTS OF OVERHEAD EXPENSES
RATE GROUP 551: AIR TRANSPORT INDUSTRIES
(CLASS E: TRANSPORTATION AND STORAGE)
Overhead Expenses
Component
Overhead Expenses
Sub-Component
Premium Rate
Component
B.1 WSIB Administrative 0.276
B.2 Legislative Obligations
WSIAT 0.014
Office of Worker Advisor 0.007
Office of Employer Advisor 0.002
OHSA 0.000
Mine Rescue 0.000
Construction Certification Training 0.000
Program Administration 0.000
Institute of Work & Health 0.003
Sub-Total 0.027
B.3 Prevention Infrastructure Health and
Safety Association
0.000
B.4 TOTAL OVERHEAD EXPENSES 0.303
Section 6E - ©WSIB Ontario 351

2011 PREMIUM RATES
SUB-COMPONENTS OF OVERHEAD EXPENSES
RATE GROUP 553: AIR TRANSPORT SERVICES
(CLASS E: TRANSPORTATION AND STORAGE)
Overhead Expenses
Component
Overhead Expenses
Sub-Component
Premium Rate
Component
B.1 WSIB Administrative 0.265
B.2 Legislative Obligations
WSIAT 0.014
Office of Worker Advisor 0.007
Office of Employer Advisor 0.002
OHSA 0.000
Mine Rescue 0.000
Construction Certification Training 0.000
Program Administration 0.000
Institute of Work & Health 0.003
Sub-Total 0.026
B.3 Prevention Infrastructure Health and
Safety Association
0.000
B.4 TOTAL OVERHEAD EXPENSES 0.291
Section 6E - ©WSIB Ontario 352

2011 PREMIUM RATES
SUB-COMPONENTS OF OVERHEAD EXPENSES
RATE GROUP 560: WAREHOUSING
(CLASS E: TRANSPORTATION AND STORAGE)
Overhead Expenses
Component
Overhead Expenses
Sub-Component
Premium Rate
Component
B.1 WSIB Administrative 0.347
B.2 Legislative Obligations
WSIAT 0.018
Office of Worker Advisor 0.009
Office of Employer Advisor 0.003
OHSA 0.085
Mine Rescue 0.000
Construction Certification Training 0.000
Program Administration 0.000
Institute of Work & Health 0.003
Sub-Total 0.118
B.3 Prevention Infrastructure Health and
Safety Association
0.091
B.4 TOTAL OVERHEAD EXPENSES 0.556
Section 6E - ©WSIB Ontario 353

2011 PREMIUM RATES
SUB-COMPONENTS OF OVERHEAD EXPENSES
RATE GROUP 570: GENERAL TRUCKING
(CLASS E: TRANSPORTATION AND STORAGE)
Overhead Expenses
Component
Overhead Expenses
Sub-Component
Premium Rate
Component
B.1 WSIB Administrative 0.574
B.2 Legislative Obligations
WSIAT 0.030
Office of Worker Advisor 0.014
Office of Employer Advisor 0.005
OHSA 0.000
Mine Rescue 0.000
Construction Certification Training 0.000
Program Administration 0.001
Institute of Work & Health 0.006
Sub-Total 0.055
B.3 Prevention Infrastructure Health and
Safety Association
0.127
B.4 TOTAL OVERHEAD EXPENSES 0.756
Section 6E - ©WSIB Ontario 354

2011 PREMIUM RATES
SUB-COMPONENTS OF OVERHEAD EXPENSES
RATE GROUP 577: COURIER SERVICES
(CLASS E: TRANSPORTATION AND STORAGE)
Overhead Expenses
Component
Overhead Expenses
Sub-Component
Premium Rate
Component
B.1 WSIB Administrative 0.321
B.2 Legislative Obligations
WSIAT 0.017
Office of Worker Advisor 0.008
Office of Employer Advisor 0.003
OHSA 0.079
Mine Rescue 0.000
Construction Certification Training 0.000
Program Administration 0.000
Institute of Work & Health 0.003
Sub-Total 0.110
B.3 Prevention Infrastructure Health and
Safety Association
0.086
B.4 TOTAL OVERHEAD EXPENSES 0.517
Section 6E - ©WSIB Ontario 355

2011 PREMIUM RATES
SUB-COMPONENTS OF OVERHEAD EXPENSES
RATE GROUP 580: MISCELLANEOUS TRANSPORT INDUSTRIES
(CLASS E: TRANSPORTATION AND STORAGE)
Overhead Expenses
Component
Overhead Expenses
Sub-Component
Premium Rate
Component
B.1 WSIB Administrative 0.476
B.2 Legislative Obligations
WSIAT 0.025
Office of Worker Advisor 0.012
Office of Employer Advisor 0.004
OHSA 0.000
Mine Rescue 0.000
Construction Certification Training 0.000
Program Administration 0.001
Institute of Work & Health 0.005
Sub-Total 0.046
B.3 Prevention Public Services Health and
Safety Association
0.000
B.4 TOTAL OVERHEAD EXPENSES 0.522
Section 6E - ©WSIB Ontario 356

2011 PREMIUM RATES
SUB-COMPONENTS OF OVERHEAD EXPENSES
RATE GROUP 584: SCHOOL BUSES
(CLASS E: TRANSPORTATION AND STORAGE)
Overhead Expenses
Component
Overhead Expenses
Sub-Component
Premium Rate
Component
B.1 WSIB Administrative 0.322
B.2 Legislative Obligations
WSIAT 0.017
Office of Worker Advisor 0.008
Office of Employer Advisor 0.003
OHSA 0.079
Mine Rescue 0.000
Construction Certification Training 0.000
Program Administration 0.000
Institute of Work & Health 0.003
Sub-Total 0.110
B.3 Prevention Infrastructure Health and
Safety Association
0.087
B.4 TOTAL OVERHEAD EXPENSES 0.519
Section 6E - ©WSIB Ontario 357

2011 PREMIUM RATES
SUB-COMPONENTS OF OVERHEAD EXPENSES
RATE GROUP 590: AMBULANCE SERVICES
(CLASS E: TRANSPORTATION AND STORAGE)
Overhead Expenses
Component
Overhead Expenses
Sub-Component
Premium Rate
Component
B.1 WSIB Administrative 0.544
B.2 Legislative Obligations
WSIAT 0.028
Office of Worker Advisor 0.014
Office of Employer Advisor 0.005
OHSA 0.134
Mine Rescue 0.000
Construction Certification Training 0.000
Program Administration 0.001
Institute of Work & Health 0.005
Sub-Total 0.186
B.3 Prevention Public Services Health and
Safety Association
0.055
B.4 TOTAL OVERHEAD EXPENSES 0.785
Section 6E - ©WSIB Ontario 358

2011 PREMIUM RATES
SUB-COMPONENTS OF OVERHEAD EXPENSES
CLASS E: TRANSPORTATION AND STORAGE
Overhead Expenses
Component
Overhead Expenses
Sub-Component
Premium Rate
Component
B.1 WSIB Administrative 0.462
B.2 Legislative Obligations
WSIAT 0.024
Office of Worker Advisor 0.012
Office of Employer Advisor 0.004
OHSA 0.026
Mine Rescue 0.000
Construction Certification Training 0.000
Program Administration 0.001
Institute of Work & Health 0.005
Sub-Total 0.070
B.3 Prevention 0.092
B.4 TOTAL OVERHEAD EXPENSES 0.624
Section 6E - ©WSIB Ontario 359

2011 PREMIUM RATE COMPONENTS
RATE GROUP 551: AIR TRANSPORT INDUSTRIES
(CLASS E: TRANSPORTATION AND STORAGE)
Component
2011 Premium Rate
Per $100 Of
Insurable Earnings
Percentage
of 2011
Premium Rate
2010 Premium Rate
Per $100 Of
Insurable Earnings
Percentage
of 2010
Premium Rate
A. NEW CLAIMS COST
1. New Claims Cost 0.866 0.866 43% 0.961 0.961 51%
B. OVERHEAD EXPENSES
1. WSIB Administrative 0.276 0.268
2. Legislative Obligations 0.027 0.026
3. Prevention 0.000 0.000
4. TOTAL OVERHEAD EXPENSES 0.303 0.303 15% 0.294 0.294 15%
C. PAST CLAIMS COST
1. Unfunded Liability 0.649 0.522
2. (Gain)/Loss 0.133 0.120
3. Bad Debts 0.045 N/A
4. TOTAL PAST CLAIMS COST 0.827 0.827 41% 0.642 0.642 34%
D. TOTAL PREMIUM RATE (A+B+C) 2.00 100% 1.90 100%
Section 6E - ©WSIB Ontario 360

2011 PREMIUM RATE COMPONENTS
RATE GROUP 553: AIR TRANSPORT SERVICES
(CLASS E: TRANSPORTATION AND STORAGE)
Component
2011 Premium Rate
Per $100 Of
Insurable Earnings
Percentage
of 2011
Premium Rate
2010 Premium Rate
Per $100 Of
Insurable Earnings
Percentage
of 2010
Premium Rate
A. NEW CLAIMS COST
1. New Claims Cost 0.801 0.801 43% 0.780 0.780 50%
B. OVERHEAD EXPENSES
1. WSIB Administrative 0.265 0.245
2. Legislative Obligations 0.026 0.024
3. Prevention 0.000 0.000
4. TOTAL OVERHEAD EXPENSES 0.291 0.291 16% 0.269 0.269 17%
C. PAST CLAIMS COST
1. Unfunded Liability 0.597 0.423
2. (Gain)/Loss 0.122 0.097
3. Bad Debts 0.037 N/A
4. TOTAL PAST CLAIMS COST 0.756 0.756 41% 0.520 0.520 33%
D. TOTAL PREMIUM RATE (A+B+C) 1.85 100% 1.57 100%
Section 6E - ©WSIB Ontario 361

2011 PREMIUM RATE COMPONENTS
RATE GROUP 560: WAREHOUSING
(CLASS E: TRANSPORTATION AND STORAGE)
Component
2011 Premium Rate
Per $100 Of
Insurable Earnings
Percentage
of 2011
Premium Rate
2010 Premium Rate
Per $100 Of
Insurable Earnings
Percentage
of 2010
Premium Rate
A. NEW CLAIMS COST
1. New Claims Cost 1.402 1.402 43% 1.383 1.383 50%
B. OVERHEAD EXPENSES
1. WSIB Administrative 0.347 0.316
2. Legislative Obligations 0.118 0.110
3. Prevention 0.091 0.039
4. TOTAL OVERHEAD EXPENSES 0.556 0.556 17% 0.465 0.465 17%
C. PAST CLAIMS COST
1. Unfunded Liability 1.044 0.751
2. (Gain)/Loss 0.213 0.172
3. Bad Debts 0.066 N/A
4. TOTAL PAST CLAIMS COST 1.323 1.323 40% 0.923 0.923 33%
D. TOTAL PREMIUM RATE (A+B+C) 3.28 100% 2.77 100%
Section 6E - ©WSIB Ontario 362

2011 PREMIUM RATE COMPONENTS
RATE GROUP 570: GENERAL TRUCKING
(CLASS E: TRANSPORTATION AND STORAGE)
Component
2011 Premium Rate
Per $100 Of
Insurable Earnings
Percentage
of 2011
Premium Rate
2010 Premium Rate
Per $100 Of
Insurable Earnings
Percentage
of 2010
Premium Rate
A. NEW CLAIMS COST
1. New Claims Cost 2.918 2.918 45% 3.083 3.083 53%
B. OVERHEAD EXPENSES
1. WSIB Administrative 0.574 0.536
2. Legislative Obligations 0.055 0.052
3. Prevention 0.127 0.058
4. TOTAL OVERHEAD EXPENSES 0.756 0.756 12% 0.646 0.646 11%
C. PAST CLAIMS COST
1. Unfunded Liability 2.175 1.674
2. (Gain)/Loss 0.444 0.384
3. Bad Debts 0.137 N/A
4. TOTAL PAST CLAIMS COST 2.756 2.756 43% 2.058 2.058 36%
D. TOTAL PREMIUM RATE (A+B+C) 6.43 100% 5.79 100%
Section 6E - ©WSIB Ontario 363

2011 PREMIUM RATE COMPONENTS
RATE GROUP 577: COURIER SERVICES
(CLASS E: TRANSPORTATION AND STORAGE)
Component
2011 Premium Rate
Per $100 Of
Insurable Earnings
Percentage
of 2011
Premium Rate
2010 Premium Rate
Per $100 Of
Insurable Earnings
Percentage
of 2010
Premium Rate
A. NEW CLAIMS COST
1. New Claims Cost 1.220 1.220 42% 1.215 1.215 49%
B. OVERHEAD EXPENSES
1. WSIB Administrative 0.321 0.295
2. Legislative Obligations 0.110 0.103
3. Prevention 0.086 0.038
4. TOTAL OVERHEAD EXPENSES 0.517 0.517 18% 0.436 0.436 18%
C. PAST CLAIMS COST
1. Unfunded Liability 0.910 0.660
2. (Gain)/Loss 0.186 0.151
3. Bad Debts 0.058 N/A
4. TOTAL PAST CLAIMS COST 1.154 1.154 40% 0.811 0.811 33%
D. TOTAL PREMIUM RATE (A+B+C) 2.89 100% 2.46 100%
Section 6E - ©WSIB Ontario 364

2011 PREMIUM RATE COMPONENTS
RATE GROUP 580: MISCELLANEOUS TRANSPORT INDUSTRIES
(CLASS E: TRANSPORTATION AND STORAGE)
Component
2011 Premium Rate
Per $100 Of
Insurable Earnings
Percentage
of 2011
Premium Rate
2010 Premium Rate
Per $100 Of
Insurable Earnings
Percentage
of 2010
Premium Rate
A. NEW CLAIMS COST
1. New Claims Cost 2.244 2.244 46% 2.363 2.363 53%
B. OVERHEAD EXPENSES
1. WSIB Administrative 0.476 0.445
2. Legislative Obligations 0.046 0.043
3. Prevention 0.000 0.000
4. TOTAL OVERHEAD EXPENSES 0.522 0.522 11% 0.488 0.488 11%
C. PAST CLAIMS COST
1. Unfunded Liability 1.672 1.283
2. (Gain)/Loss 0.342 0.294
3. Bad Debts 0.105 N/A
4. TOTAL PAST CLAIMS COST 2.119 2.119 43% 1.577 1.577 36%
D. TOTAL PREMIUM RATE (A+B+C) 4.89 100% 4.43 100%
Section 6E - ©WSIB Ontario 365

2011 PREMIUM RATE COMPONENTS
RATE GROUP 584: SCHOOL BUSES
(CLASS E: TRANSPORTATION AND STORAGE)
Component
2011 Premium Rate
Per $100 Of
Insurable Earnings
Percentage
of 2011
Premium Rate
2010 Premium Rate
Per $100 Of
Insurable Earnings
Percentage
of 2010
Premium Rate
A. NEW CLAIMS COST
1. New Claims Cost 1.224 1.224 42% 1.348 1.348 50%
B. OVERHEAD EXPENSES
1. WSIB Administrative 0.322 0.312
2. Legislative Obligations 0.110 0.108
3. Prevention 0.087 0.039
4. TOTAL OVERHEAD EXPENSES 0.519 0.519 18% 0.459 0.459 17%
C. PAST CLAIMS COST
1. Unfunded Liability 0.917 0.732
2. (Gain)/Loss 0.187 0.168
3. Bad Debts 0.064 N/A
4. TOTAL PAST CLAIMS COST 1.168 1.168 40% 0.900 0.900 33%
D. TOTAL PREMIUM RATE (A+B+C) 2.91 100% 2.71 100%
Section 6E - ©WSIB Ontario 366

2011 PREMIUM RATE COMPONENTS
RATE GROUP 590: AMBULANCE SERVICES
(CLASS E: TRANSPORTATION AND STORAGE)
Component
2011 Premium Rate
Per $100 Of
Insurable Earnings
Percentage
of 2011
Premium Rate
2010 Premium Rate
Per $100 Of
Insurable Earnings
Percentage
of 2010
Premium Rate
A. NEW CLAIMS COST
1. New Claims Cost 2.767 2.767 45% 3.052 3.052 52%
B. OVERHEAD EXPENSES
1. WSIB Administrative 0.544 0.524
2. Legislative Obligations 0.186 0.183
3. Prevention 0.055 0.057
4. TOTAL OVERHEAD EXPENSES 0.785 0.785 13% 0.764 0.764 13%
C. PAST CLAIMS COST
1. Unfunded Liability 2.068 1.657
2. (Gain)/Loss 0.423 0.380
3. Bad Debts 0.139 N/A
4. TOTAL PAST CLAIMS COST 2.630 2.630 43% 2.037 2.037 35%
D. TOTAL PREMIUM RATE (A+B+C) 6.18 100% 5.85 100%
Section 6E - ©WSIB Ontario 367

2011 PREMIUM RATE COMPONENTS
CLASS E: TRANSPORTATION AND STORAGE
Component
2011 Premium Rate
Per $100 Of
Insurable Earnings
Percentage
of 2011
Premium Rate
2010 Premium Rate
Per $100 Of
Insurable Earnings
Percentage
of 2010
Premium Rate
A. NEW CLAIMS COST
1. New Claims Cost 2.163 2.163 45% 2.313 2.313 53%
B. OVERHEAD EXPENSES
1. WSIB Administrative 0.462 0.437
2. Legislative Obligations 0.070 0.066
3. Prevention 0.092 0.043
4. TOTAL OVERHEAD EXPENSES 0.624 0.624 13% 0.546 0.546 12%
C. PAST CLAIMS COST
1. Unfunded Liability 1.613 1.256
2. (Gain)/Loss 0.330 0.288
3. Bad Debts 0.103 N/A
4. TOTAL PAST CLAIMS COST 2.046 2.046 42% 1.544 1.544 35%
D. TOTAL PREMIUM RATE (A+B+C) 4.83 100% 4.40 100%
Section 6E - ©WSIB Ontario 368

2011 PREMIUM RATES
Summary of Premium Rate Components by Rate Group
per $100 of Insurable Earnings
New Past 2011
Rate
Group Description
Claims
Cost
($)
Overhead
($)
Claims
Cost
($)
Premium
Rate
($)
551 AIR TRANSPORT INDUSTRIES 0.866 0.303 0.827 2.00
553 AIR TRANSPORT SERVICES 0.801 0.291 0.756 1.85
560 WAREHOUSING 1.402 0.556 1.323 3.28
570 GENERAL TRUCKING 2.918 0.756 2.756 6.43
577 COURIER SERVICES 1.220 0.517 1.154 2.89
580 MISCELLANEOUS TRANSPORT INDUSTRIES 2.244 0.522 2.119 4.89
584 SCHOOL BUSES 1.224 0.519 1.168 2.91
590 AMBULANCE SERVICES 2.767 0.785 2.630 6.18
CLASS E TRANSPORTATION AND STORAGE 2.163 0.624 2.046 4.83
Section 6E - ©WSIB Ontario 369

2011Premium Rates M
ANUAL
SECTION 6FClass F – Retail and Wholesale Trades

2011 PREMIUM RATES
6-YEAR HISTORICAL SUMMARY AND 2-YEAR PROJECTION
RATE GROUP 604: FOOD, SALES
(CLASS F: RETAIL AND WHOLESALE TRADES)
Year
Insurable
Earnings
Maximum
Insurable
Earnings
Ceiling
Average
Insurable
Earnings Employment
Total
Number of
Injuries
Total Injury
Rate
2004 $3,237,702,799 $66,800 $25,019 129,410 11,535 8.91%
2005 $3,344,455,459 $67,700 $26,022 128,524 11,206 8.72%
2006 $3,523,447,485 $69,400 $26,152 134,730 10,496 7.79%
2007 $3,724,373,959 $71,800 $27,748 134,221 10,209 7.61%
2008 $3,976,364,328 $73,300 $26,826 148,228 10,072 6.79%
2009 $4,084,745,590 $74,600 $26,885 151,934 9,573 6.30%
2010 $4,220,538,183 $77,600 $27,561 153,134 8,961 5.85%
2011 $4,362,696,632 $79,600 $28,237 154,504 8,378 5.42%
Section 6F - ©WSIB Ontario 370

2011 PREMIUM RATES
6-YEAR HISTORICAL SUMMARY AND 2-YEAR PROJECTION
RATE GROUP 606: GROCERY AND CONVENIENCE STORES
(CLASS F: RETAIL AND WHOLESALE TRADES)
Year
Insurable
Earnings
Maximum
Insurable
Earnings
Ceiling
Average
Insurable
Earnings Employment
Total
Number of
Injuries
Total Injury
Rate
2004 $342,277,385 $66,800 $19,080 17,939 501 2.79%
2005 $344,030,309 $67,700 $19,030 18,078 538 2.98%
2006 $356,246,395 $69,400 $20,122 17,704 499 2.82%
2007 $377,923,191 $71,800 $20,142 18,763 482 2.57%
2008 $386,079,574 $73,300 $21,523 17,938 507 2.83%
2009 $407,133,422 $74,600 $20,942 19,441 445 2.29%
2010 $420,668,097 $77,600 $21,468 19,595 443 2.26%
2011 $434,837,267 $79,600 $21,995 19,770 441 2.23%
Section 6F - ©WSIB Ontario 371

2011 PREMIUM RATES
6-YEAR HISTORICAL SUMMARY AND 2-YEAR PROJECTION
RATE GROUP 607: SPECIALTY FOOD STORES
(CLASS F: RETAIL AND WHOLESALE TRADES)
Year
Insurable
Earnings
Maximum
Insurable
Earnings
Ceiling
Average
Insurable
Earnings Employment
Total
Number of
Injuries
Total Injury
Rate
2004 $106,913,170 $66,800 $19,174 5,576 230 4.12%
2005 $108,163,397 $67,700 $19,315 5,600 204 3.64%
2006 $115,357,814 $69,400 $23,286 4,954 213 4.30%
2007 $124,036,159 $71,800 $20,604 6,020 211 3.50%
2008 $133,972,021 $73,300 $19,969 6,709 225 3.35%
2009 $143,129,448 $74,600 $21,123 6,776 197 2.91%
2010 $147,887,619 $77,600 $21,653 6,830 188 2.75%
2011 $152,868,850 $79,600 $22,184 6,891 180 2.61%
Section 6F - ©WSIB Ontario 372

2011 PREMIUM RATES
6-YEAR HISTORICAL SUMMARY AND 2-YEAR PROJECTION
RATE GROUP 608: BEER STORES
(CLASS F: RETAIL AND WHOLESALE TRADES)
Year
Insurable
Earnings
Maximum
Insurable
Earnings
Ceiling
Average
Insurable
Earnings Employment
Total
Number of
Injuries
Total Injury
Rate
2004 $133,134,295 $66,800 $35,895 3,709 481 12.97%
2005 $139,158,019 $67,700 $37,030 3,758 523 13.92%
2006 $140,161,855 $69,400 $38,815 3,611 448 12.41%
2007 $157,438,582 $71,800 $36,802 4,278 584 13.65%
2008 $164,016,267 $73,300 $39,723 4,129 617 14.94%
2009 $167,863,236 $74,600 $38,607 4,348 467 10.74%
2010 $173,443,653 $77,600 $39,581 4,382 465 10.61%
2011 $179,285,676 $79,600 $40,553 4,421 463 10.47%
Section 6F - ©WSIB Ontario 373

2011 PREMIUM RATES
6-YEAR HISTORICAL SUMMARY AND 2-YEAR PROJECTION
RATE GROUP 612: AGRICULTURAL PRODUCTS, SALES
(CLASS F: RETAIL AND WHOLESALE TRADES)
Year
Insurable
Earnings
Maximum
Insurable
Earnings
Ceiling
Average
Insurable
Earnings Employment
Total
Number of
Injuries
Total Injury
Rate
2004 $250,815,891 $66,800 $33,265 7,540 450 5.97%
2005 $250,903,510 $67,700 $33,075 7,586 378 4.98%
2006 $251,436,557 $69,400 $33,651 7,472 323 4.32%
2007 $243,117,598 $71,800 $32,814 7,409 331 4.47%
2008 $265,949,229 $73,300 $30,849 8,621 322 3.74%
2009 $274,377,475 $74,600 $31,975 8,581 276 3.22%
2010 $290,166,670 $77,600 $33,549 8,649 253 2.93%
2011 $292,615,657 $79,600 $33,565 8,718 231 2.65%
Section 6F - ©WSIB Ontario 374

2011 PREMIUM RATES
6-YEAR HISTORICAL SUMMARY AND 2-YEAR PROJECTION
RATE GROUP 630: VEHICLE SERVICES AND REPAIRS
(CLASS F: RETAIL AND WHOLESALE TRADES)
Year
Insurable
Earnings
Maximum
Insurable
Earnings
Ceiling
Average
Insurable
Earnings Employment
Total
Number of
Injuries
Total Injury
Rate
2004 $2,353,089,590 $66,800 $38,771 60,692 6,582 10.84%
2005 $2,383,242,331 $67,700 $39,905 59,723 6,350 10.63%
2006 $2,437,585,691 $69,400 $40,387 60,356 5,896 9.77%
2007 $2,488,745,353 $71,800 $40,435 61,549 5,636 9.16%
2008 $2,552,193,265 $73,300 $41,185 61,969 5,408 8.73%
2009 $2,473,996,785 $74,600 $42,107 58,755 4,675 7.96%
2010 $2,556,241,917 $77,600 $43,166 59,219 4,376 7.39%
2011 $2,642,342,639 $79,600 $44,224 59,749 4,091 6.85%
Section 6F - ©WSIB Ontario 375

2011 PREMIUM RATES
6-YEAR HISTORICAL SUMMARY AND 2-YEAR PROJECTION
RATE GROUP 633: PETROLEUM PRODUCTS, SALES
(CLASS F: RETAIL AND WHOLESALE TRADES)
Year
Insurable
Earnings
Maximum
Insurable
Earnings
Ceiling
Average
Insurable
Earnings Employment
Total
Number of
Injuries
Total Injury
Rate
2004 $390,565,543 $66,800 $29,512 13,234 529 4.00%
2005 $398,016,792 $67,700 $29,940 13,294 482 3.63%
2006 $403,464,664 $69,400 $30,724 13,132 466 3.55%
2007 $397,610,425 $71,800 $30,818 12,902 450 3.49%
2008 $399,766,080 $73,300 $31,310 12,768 383 3.00%
2009 $416,086,200 $74,600 $31,320 13,285 335 2.52%
2010 $429,918,499 $77,600 $32,107 13,390 314 2.35%
2011 $444,399,246 $79,600 $32,894 13,510 293 2.17%
Section 6F - ©WSIB Ontario 376
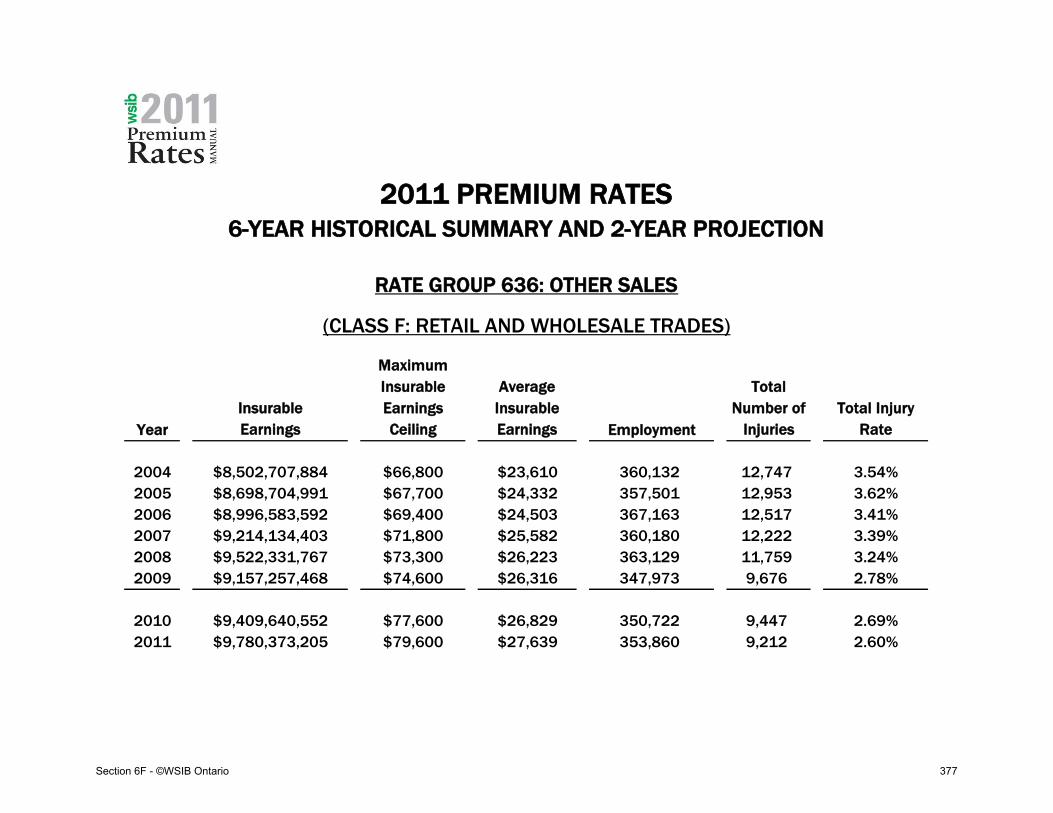
2011 PREMIUM RATES
6-YEAR HISTORICAL SUMMARY AND 2-YEAR PROJECTION
RATE GROUP 636: OTHER SALES
(CLASS F: RETAIL AND WHOLESALE TRADES)
Year
Insurable
Earnings
Maximum
Insurable
Earnings
Ceiling
Average
Insurable
Earnings Employment
Total
Number of
Injuries
Total Injury
Rate
2004 $8,502,707,884 $66,800 $23,610 360,132 12,747 3.54%
2005 $8,698,704,991 $67,700 $24,332 357,501 12,953 3.62%
2006 $8,996,583,592 $69,400 $24,503 367,163 12,517 3.41%
2007 $9,214,134,403 $71,800 $25,582 360,180 12,222 3.39%
2008 $9,522,331,767 $73,300 $26,223 363,129 11,759 3.24%
2009 $9,157,257,468 $74,600 $26,316 347,973 9,676 2.78%
2010 $9,409,640,552 $77,600 $26,829 350,722 9,447 2.69%
2011 $9,780,373,205 $79,600 $27,639 353,860 9,212 2.60%
Section 6F - ©WSIB Ontario 377

2011 PREMIUM RATES
6-YEAR HISTORICAL SUMMARY AND 2-YEAR PROJECTION
RATE GROUP 638: PHARMACIES
(CLASS F: RETAIL AND WHOLESALE TRADES)
Year
Insurable
Earnings
Maximum
Insurable
Earnings
Ceiling
Average
Insurable
Earnings Employment
Total
Number of
Injuries
Total Injury
Rate
2004 $1,700,587,276 $66,800 $25,107 67,734 794 1.17%
2005 $1,771,829,402 $67,700 $26,411 67,087 890 1.33%
2006 $1,848,618,384 $69,400 $28,295 65,334 821 1.26%
2007 $1,972,592,480 $71,800 $27,525 71,665 866 1.21%
2008 $2,089,863,272 $73,300 $27,448 76,139 909 1.19%
2009 $2,159,757,000 $74,600 $27,000 79,991 844 1.06%
2010 $2,231,555,597 $77,600 $27,679 80,623 841 1.04%
2011 $2,306,720,059 $79,600 $28,358 81,344 837 1.03%
Section 6F - ©WSIB Ontario 378

2011 PREMIUM RATES
6-YEAR HISTORICAL SUMMARY AND 2-YEAR PROJECTION
RATE GROUP 641: CLOTHING STORES
(CLASS F: RETAIL AND WHOLESALE TRADES)
Year
Insurable
Earnings
Maximum
Insurable
Earnings
Ceiling
Average
Insurable
Earnings Employment
Total
Number of
Injuries
Total Injury
Rate
2004 $1,229,929,520 $66,800 $20,673 59,494 1,660 2.79%
2005 $1,276,572,319 $67,700 $21,506 59,359 1,701 2.87%
2006 $1,350,503,035 $69,400 $21,626 62,448 1,711 2.74%
2007 $1,393,674,619 $71,800 $23,536 59,215 1,904 3.22%
2008 $1,447,779,760 $73,300 $23,954 60,440 1,883 3.12%
2009 $1,437,004,903 $74,600 $24,421 58,843 1,560 2.65%
2010 $1,484,776,452 $77,600 $25,035 59,308 1,554 2.62%
2011 $1,534,787,495 $79,600 $25,649 59,839 1,547 2.59%
Section 6F - ©WSIB Ontario 379

2011 PREMIUM RATES
6-YEAR HISTORICAL SUMMARY AND 2-YEAR PROJECTION
RATE GROUP 657: AUTOMOBILE AND TRUCK DEALERS
(CLASS F: RETAIL AND WHOLESALE TRADES)
Year
Insurable
Earnings
Maximum
Insurable
Earnings
Ceiling
Average
Insurable
Earnings Employment
Total
Number of
Injuries
Total Injury
Rate
2004 $1,313,532,536 $66,800 $31,308 41,955 720 1.72%
2005 $1,357,549,802 $67,700 $31,861 42,609 751 1.76%
2006 $1,413,106,182 $69,400 $34,239 41,272 652 1.58%
2007 $1,452,355,020 $71,800 $34,087 42,607 690 1.62%
2008 $1,473,711,200 $73,300 $36,478 40,400 728 1.80%
2009 $1,411,759,086 $74,600 $36,123 39,082 553 1.41%
2010 $1,458,691,367 $77,600 $37,031 39,391 551 1.40%
2011 $1,507,823,798 $79,600 $37,939 39,743 548 1.38%
Section 6F - ©WSIB Ontario 380

2011 PREMIUM RATES
6-YEAR HISTORICAL SUMMARY AND 2-YEAR PROJECTION
RATE GROUP 668: COMPUTER, ELECTRONIC AND ELECTRICAL EQUIPMENT, SALES
(CLASS F: RETAIL AND WHOLESALE TRADES)
Year
Insurable
Earnings
Maximum
Insurable
Earnings
Ceiling
Average
Insurable
Earnings Employment
Total
Number of
Injuries
Total Injury
Rate
2004 $2,367,170,909 $66,800 $33,417 70,837 790 1.12%
2005 $2,475,471,087 $67,700 $36,431 67,950 772 1.14%
2006 $2,671,629,056 $69,400 $35,662 74,915 756 1.01%
2007 $2,924,039,508 $71,800 $34,208 85,478 729 0.85%
2008 $3,013,546,434 $73,300 $35,374 85,191 757 0.89%
2009 $2,906,080,385 $74,600 $36,737 79,105 621 0.79%
2010 $3,002,689,631 $77,600 $37,661 79,730 569 0.71%
2011 $3,103,827,846 $79,600 $38,584 80,443 520 0.65%
Section 6F - ©WSIB Ontario 381

2011 PREMIUM RATES
6-YEAR HISTORICAL SUMMARY AND 2-YEAR PROJECTION
RATE GROUP 670: MACHINERY AND OTHER VEHICLES, SALES
(CLASS F: RETAIL AND WHOLESALE TRADES)
Year
Insurable
Earnings
Maximum
Insurable
Earnings
Ceiling
Average
Insurable
Earnings Employment
Total
Number of
Injuries
Total Injury
Rate
2004 $1,541,956,987 $66,800 $38,451 40,102 2,103 5.24%
2005 $1,608,371,016 $67,700 $40,173 40,036 2,171 5.42%
2006 $1,647,786,102 $69,400 $40,319 40,869 2,136 5.23%
2007 $1,717,774,237 $71,800 $42,324 40,586 2,044 5.04%
2008 $1,802,025,846 $73,300 $42,129 42,774 2,116 4.95%
2009 $1,716,398,688 $74,600 $42,144 40,727 1,605 3.94%
2010 $1,770,670,908 $77,600 $43,136 41,049 1,599 3.90%
2011 $1,830,489,655 $79,600 $44,241 41,375 1,590 3.84%
Section 6F - ©WSIB Ontario 382

2011 PREMIUM RATES
6-YEAR HISTORICAL SUMMARY AND 2-YEAR PROJECTION
RATE GROUP 681: LUMBER AND BUILDERS SUPPLY
(CLASS F: RETAIL AND WHOLESALE TRADES)
Year
Insurable
Earnings
Maximum
Insurable
Earnings
Ceiling
Average
Insurable
Earnings Employment
Total
Number of
Injuries
Total Injury
Rate
2004 $946,752,636 $66,800 $26,262 36,050 3,398 9.43%
2005 $1,003,597,694 $67,700 $27,093 37,043 3,260 8.80%
2006 $1,069,532,829 $69,400 $28,689 37,280 3,121 8.37%
2007 $1,140,219,342 $71,800 $28,782 39,616 3,123 7.88%
2008 $1,228,486,488 $73,300 $28,856 42,573 3,286 7.72%
2009 $1,225,717,493 $74,600 $29,393 41,701 3,004 7.20%
2010 $1,228,516,844 $77,600 $29,912 41,071 2,807 6.83%
2011 $1,251,187,779 $79,600 $30,254 41,356 2,675 6.47%
Section 6F - ©WSIB Ontario 383

2011 PREMIUM RATES
6-YEAR HISTORICAL SUMMARY AND 2-YEAR PROJECTION
RATE GROUP 685: METAL PRODUCTS, WHOLESALE
(CLASS F: RETAIL AND WHOLESALE TRADES)
Year
Insurable
Earnings
Maximum
Insurable
Earnings
Ceiling
Average
Insurable
Earnings Employment
Total
Number of
Injuries
Total Injury
Rate
2004 $124,312,285 $66,800 $36,243 3,430 397 11.57%
2005 $120,297,754 $67,700 $35,268 3,411 346 10.14%
2006 $126,890,762 $69,400 $36,855 3,443 342 9.93%
2007 $138,798,625 $71,800 $34,553 4,017 318 7.92%
2008 $140,844,072 $73,300 $37,379 3,768 294 7.80%
2009 $127,713,804 $74,600 $39,164 3,261 133 4.08%
2010 $135,063,162 $77,600 $41,090 3,287 122 3.71%
2011 $136,203,086 $79,600 $41,112 3,313 111 3.35%
Section 6F - ©WSIB Ontario 384

2011 PREMIUM RATES
6-YEAR HISTORICAL SUMMARY AND 2-YEAR PROJECTION
RATE GROUP 689: WASTE MATERIALS RECYCLING
(CLASS F: RETAIL AND WHOLESALE TRADES)
Year
Insurable
Earnings
Maximum
Insurable
Earnings
Ceiling
Average
Insurable
Earnings Employment
Total
Number of
Injuries
Total Injury
Rate
2004 $178,729,265 $66,800 $33,921 5,269 769 14.59%
2005 $195,894,323 $67,700 $34,392 5,696 809 14.20%
2006 $218,423,549 $69,400 $34,203 6,386 894 14.00%
2007 $248,462,726 $71,800 $36,352 6,835 964 14.10%
2008 $266,011,335 $73,300 $36,535 7,281 907 12.46%
2009 $250,348,755 $74,600 $35,355 7,081 656 9.26%
2010 $250,920,513 $77,600 $35,979 6,974 626 8.98%
2011 $255,550,977 $79,600 $36,393 7,022 609 8.67%
Section 6F - ©WSIB Ontario 385

2011 PREMIUM RATES
6-YEAR HISTORICAL SUMMARY AND 2-YEAR PROJECTION
CLASS F: RETAIL AND WHOLESALE TRADES
Year
Insurable
Earnings
Maximum
Insurable
Earnings
Ceiling
Average
Insurable
Earnings Employment
Total
Number of
Injuries
Total Injury
Rate
2004 $24,720,177,971 $66,800 $26,779 923,103 43,686 4.73%
2005 $25,476,258,205 $67,700 $27,774 917,255 43,334 4.72%
2006 $26,570,773,952 $69,400 $28,235 941,069 41,291 4.39%
2007 $27,715,296,227 $71,800 $29,011 955,341 40,763 4.27%
2008 $28,862,940,938 $73,300 $29,390 982,057 40,173 4.09%
2009 $28,359,369,738 $74,600 $29,514 960,884 34,620 3.60%
2010 $29,211,389,664 $77,600 $30,197 967,354 33,116 3.42%
2011 $30,216,009,867 $79,600 $30,964 975,858 31,726 3.25%
Section 6F - ©WSIB Ontario 386

2011 PREMIUM RATESNEW CLAIMS COST BY RATE GROUP
2011 New Claims Cost 2011
Rate
Group Description Cost Index *
(%)
Cost per Claim
($)
Premium
Rate
($)
604 FOOD, SALES 74% 5,542 2.43
606 GROCERY AND CONVENIENCE STORES 120% 9,005 2.11
607 SPECIALTY FOOD STORES 182% 13,681 3.57
608 BEER STORES 94% 7,032 3.99
612 AGRICULTURAL PRODUCTS, SALES 175% 13,139 2.37
630 VEHICLE SERVICES AND REPAIRS 131% 9,860 3.39
633 PETROLEUM PRODUCTS, SALES 220% 16,544 2.49
636 OTHER SALES 81% 6,048 1.40
638 PHARMACIES 96% 7,236 0.68
641 CLOTHING STORES 84% 6,270 1.53
657 AUTOMOBILE AND TRUCK DEALERS 112% 8,430 0.78
668 COMPUTER, ELECTRONIC AND ELECTRICAL EQUIPMENT, SALES 147% 11,049 0.48
670 MACHINERY AND OTHER VEHICLES, SALES 114% 8,562 1.76
681 LUMBER AND BUILDERS SUPPLY 79% 5,897 2.88
685 METAL PRODUCTS, WHOLESALE 228% 17,082 3.11
689 WASTE MATERIALS RECYCLING 151% 11,367 5.90
CLASS F RETAIL AND WHOLESALE TRADES 7,073 1.74
* The Cost Index compares the average cost of a claim for a Rate Group to that of the Class.Section 6F - ©WSIB Ontario 387

2011 PREMIUM RATES
SUB-COMPONENTS OF OVERHEAD EXPENSES
RATE GROUP 604: FOOD, SALES
(CLASS F: RETAIL AND WHOLESALE TRADES)
Overhead Expenses
Component
Overhead Expenses
Sub-Component
Premium Rate
Component
B.1 WSIB Administrative 0.296
B.2 Legislative Obligations
WSIAT 0.015
Office of Worker Advisor 0.007
Office of Employer Advisor 0.003
OHSA 0.072
Mine Rescue 0.000
Construction Certification Training 0.000
Program Administration 0.000
Institute of Work & Health 0.003
Sub-Total 0.101
B.3 Prevention Workplace Safety and
Prevention Services
0.042
B.4 TOTAL OVERHEAD EXPENSES 0.439
Section 6F - ©WSIB Ontario 388

2011 PREMIUM RATES
SUB-COMPONENTS OF OVERHEAD EXPENSES
RATE GROUP 606: GROCERY AND CONVENIENCE STORES
(CLASS F: RETAIL AND WHOLESALE TRADES)
Overhead Expenses
Component
Overhead Expenses
Sub-Component
Premium Rate
Component
B.1 WSIB Administrative 0.275
B.2 Legislative Obligations
WSIAT 0.014
Office of Worker Advisor 0.007
Office of Employer Advisor 0.002
OHSA 0.067
Mine Rescue 0.000
Construction Certification Training 0.000
Program Administration 0.000
Institute of Work & Health 0.003
Sub-Total 0.094
B.3 Prevention Workplace Safety and
Prevention Services
0.039
B.4 TOTAL OVERHEAD EXPENSES 0.408
Section 6F - ©WSIB Ontario 389

2011 PREMIUM RATES
SUB-COMPONENTS OF OVERHEAD EXPENSES
RATE GROUP 607: SPECIALTY FOOD STORES
(CLASS F: RETAIL AND WHOLESALE TRADES)
Overhead Expenses
Component
Overhead Expenses
Sub-Component
Premium Rate
Component
B.1 WSIB Administrative 0.373
B.2 Legislative Obligations
WSIAT 0.019
Office of Worker Advisor 0.009
Office of Employer Advisor 0.003
OHSA 0.092
Mine Rescue 0.000
Construction Certification Training 0.000
Program Administration 0.001
Institute of Work & Health 0.004
Sub-Total 0.128
B.3 Prevention Workplace Safety and
Prevention Services
0.055
B.4 TOTAL OVERHEAD EXPENSES 0.556
Section 6F - ©WSIB Ontario 390

2011 PREMIUM RATES
SUB-COMPONENTS OF OVERHEAD EXPENSES
RATE GROUP 608: BEER STORES
(CLASS F: RETAIL AND WHOLESALE TRADES)
Overhead Expenses
Component
Overhead Expenses
Sub-Component
Premium Rate
Component
B.1 WSIB Administrative 0.402
B.2 Legislative Obligations
WSIAT 0.021
Office of Worker Advisor 0.010
Office of Employer Advisor 0.003
OHSA 0.099
Mine Rescue 0.000
Construction Certification Training 0.000
Program Administration 0.001
Institute of Work & Health 0.004
Sub-Total 0.138
B.3 Prevention Workplace Safety and
Prevention Services
0.059
B.4 TOTAL OVERHEAD EXPENSES 0.599
Section 6F - ©WSIB Ontario 391

2011 PREMIUM RATES
SUB-COMPONENTS OF OVERHEAD EXPENSES
RATE GROUP 612: AGRICULTURAL PRODUCTS, SALES
(CLASS F: RETAIL AND WHOLESALE TRADES)
Overhead Expenses
Component
Overhead Expenses
Sub-Component
Premium Rate
Component
B.1 WSIB Administrative 0.292
B.2 Legislative Obligations
WSIAT 0.015
Office of Worker Advisor 0.007
Office of Employer Advisor 0.002
OHSA 0.071
Mine Rescue 0.000
Construction Certification Training 0.000
Program Administration 0.000
Institute of Work & Health 0.003
Sub-Total 0.100
B.3 Prevention Workplace Safety and
Prevention Services
0.042
B.4 TOTAL OVERHEAD EXPENSES 0.434
Section 6F - ©WSIB Ontario 392

2011 PREMIUM RATES
SUB-COMPONENTS OF OVERHEAD EXPENSES
RATE GROUP 630: VEHICLE SERVICES AND REPAIRS
(CLASS F: RETAIL AND WHOLESALE TRADES)
Overhead Expenses
Component
Overhead Expenses
Sub-Component
Premium Rate
Component
B.1 WSIB Administrative 0.362
B.2 Legislative Obligations
WSIAT 0.019
Office of Worker Advisor 0.009
Office of Employer Advisor 0.003
OHSA 0.089
Mine Rescue 0.000
Construction Certification Training 0.000
Program Administration 0.000
Institute of Work & Health 0.004
Sub-Total 0.124
B.3 Prevention Workplace Safety and
Prevention Services
0.053
B.4 TOTAL OVERHEAD EXPENSES 0.539
Section 6F - ©WSIB Ontario 393
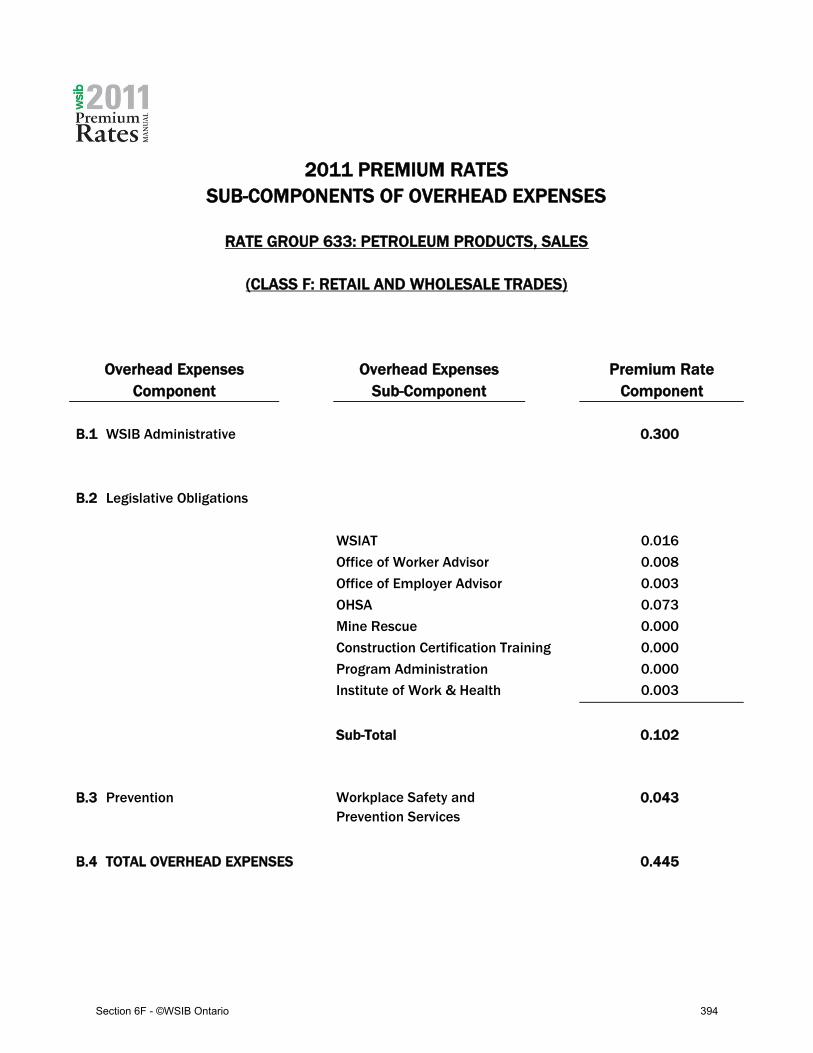
2011 PREMIUM RATES
SUB-COMPONENTS OF OVERHEAD EXPENSES
RATE GROUP 633: PETROLEUM PRODUCTS, SALES
(CLASS F: RETAIL AND WHOLESALE TRADES)
Overhead Expenses
Component
Overhead Expenses
Sub-Component
Premium Rate
Component
B.1 WSIB Administrative 0.300
B.2 Legislative Obligations
WSIAT 0.016
Office of Worker Advisor 0.008
Office of Employer Advisor 0.003
OHSA 0.073
Mine Rescue 0.000
Construction Certification Training 0.000
Program Administration 0.000
Institute of Work & Health 0.003
Sub-Total 0.102
B.3 Prevention Workplace Safety and
Prevention Services
0.043
B.4 TOTAL OVERHEAD EXPENSES 0.445
Section 6F - ©WSIB Ontario 394

2011 PREMIUM RATES
SUB-COMPONENTS OF OVERHEAD EXPENSES
RATE GROUP 636: OTHER SALES
(CLASS F: RETAIL AND WHOLESALE TRADES)
Overhead Expenses
Component
Overhead Expenses
Sub-Component
Premium Rate
Component
B.1 WSIB Administrative 0.226
B.2 Legislative Obligations
WSIAT 0.012
Office of Worker Advisor 0.006
Office of Employer Advisor 0.002
OHSA 0.055
Mine Rescue 0.000
Construction Certification Training 0.000
Program Administration 0.000
Institute of Work & Health 0.002
Sub-Total 0.077
B.3 Prevention Workplace Safety and
Prevention Services
0.031
B.4 TOTAL OVERHEAD EXPENSES 0.334
Section 6F - ©WSIB Ontario 395

2011 PREMIUM RATES
SUB-COMPONENTS OF OVERHEAD EXPENSES
RATE GROUP 638: PHARMACIES
(CLASS F: RETAIL AND WHOLESALE TRADES)
Overhead Expenses
Component
Overhead Expenses
Sub-Component
Premium Rate
Component
B.1 WSIB Administrative 0.119
B.2 Legislative Obligations
WSIAT 0.006
Office of Worker Advisor 0.003
Office of Employer Advisor 0.001
OHSA 0.029
Mine Rescue 0.000
Construction Certification Training 0.000
Program Administration 0.000
Institute of Work & Health 0.001
Sub-Total 0.040
B.3 Prevention Workplace Safety and
Prevention Services
0.024
B.4 TOTAL OVERHEAD EXPENSES 0.183
Section 6F - ©WSIB Ontario 396

2011 PREMIUM RATES
SUB-COMPONENTS OF OVERHEAD EXPENSES
RATE GROUP 641: CLOTHING STORES
(CLASS F: RETAIL AND WHOLESALE TRADES)
Overhead Expenses
Component
Overhead Expenses
Sub-Component
Premium Rate
Component
B.1 WSIB Administrative 0.235
B.2 Legislative Obligations
WSIAT 0.012
Office of Worker Advisor 0.006
Office of Employer Advisor 0.002
OHSA 0.057
Mine Rescue 0.000
Construction Certification Training 0.000
Program Administration 0.000
Institute of Work & Health 0.002
Sub-Total 0.080
B.3 Prevention Workplace Safety and
Prevention Services
0.032
B.4 TOTAL OVERHEAD EXPENSES 0.347
Section 6F - ©WSIB Ontario 397

2011 PREMIUM RATES
SUB-COMPONENTS OF OVERHEAD EXPENSES
RATE GROUP 657: AUTOMOBILE AND TRUCK DEALERS
(CLASS F: RETAIL AND WHOLESALE TRADES)
Overhead Expenses
Component
Overhead Expenses
Sub-Component
Premium Rate
Component
B.1 WSIB Administrative 0.139
B.2 Legislative Obligations
WSIAT 0.007
Office of Worker Advisor 0.004
Office of Employer Advisor 0.001
OHSA 0.034
Mine Rescue 0.000
Construction Certification Training 0.000
Program Administration 0.000
Institute of Work & Health 0.001
Sub-Total 0.047
B.3 Prevention Workplace Safety and
Prevention Services
0.025
B.4 TOTAL OVERHEAD EXPENSES 0.211
Section 6F - ©WSIB Ontario 398

2011 PREMIUM RATES
SUB-COMPONENTS OF OVERHEAD EXPENSES
RATE GROUP 668: COMPUTER, ELECTRONIC AND ELECTRICAL EQUIPMENT, SALES
(CLASS F: RETAIL AND WHOLESALE TRADES)
Overhead Expenses
Component
Overhead Expenses
Sub-Component
Premium Rate
Component
B.1 WSIB Administrative 0.084
B.2 Legislative Obligations
WSIAT 0.004
Office of Worker Advisor 0.002
Office of Employer Advisor 0.001
OHSA 0.020
Mine Rescue 0.000
Construction Certification Training 0.000
Program Administration 0.000
Institute of Work & Health 0.001
Sub-Total 0.028
B.3 Prevention Workplace Safety and
Prevention Services
0.022
B.4 TOTAL OVERHEAD EXPENSES 0.134
Section 6F - ©WSIB Ontario 399

2011 PREMIUM RATES
SUB-COMPONENTS OF OVERHEAD EXPENSES
RATE GROUP 670: MACHINERY AND OTHER VEHICLES, SALES
(CLASS F: RETAIL AND WHOLESALE TRADES)
Overhead Expenses
Component
Overhead Expenses
Sub-Component
Premium Rate
Component
B.1 WSIB Administrative 0.251
B.2 Legislative Obligations
WSIAT 0.013
Office of Worker Advisor 0.006
Office of Employer Advisor 0.002
OHSA 0.061
Mine Rescue 0.000
Construction Certification Training 0.000
Program Administration 0.000
Institute of Work & Health 0.002
Sub-Total 0.085
B.3 Prevention Workplace Safety and
Prevention Services
0.035
B.4 TOTAL OVERHEAD EXPENSES 0.371
Section 6F - ©WSIB Ontario 400

2011 PREMIUM RATES
SUB-COMPONENTS OF OVERHEAD EXPENSES
RATE GROUP 681: LUMBER AND BUILDERS SUPPLY
(CLASS F: RETAIL AND WHOLESALE TRADES)
Overhead Expenses
Component
Overhead Expenses
Sub-Component
Premium Rate
Component
B.1 WSIB Administrative 0.324
B.2 Legislative Obligations
WSIAT 0.017
Office of Worker Advisor 0.008
Office of Employer Advisor 0.003
OHSA 0.079
Mine Rescue 0.000
Construction Certification Training 0.000
Program Administration 0.000
Institute of Work & Health 0.003
Sub-Total 0.111
B.3 Prevention Infrastructure Health and
Safety Association
0.087
B.4 TOTAL OVERHEAD EXPENSES 0.522
Section 6F - ©WSIB Ontario 401

2011 PREMIUM RATES
SUB-COMPONENTS OF OVERHEAD EXPENSES
RATE GROUP 685: METAL PRODUCTS, WHOLESALE
(CLASS F: RETAIL AND WHOLESALE TRADES)
Overhead Expenses
Component
Overhead Expenses
Sub-Component
Premium Rate
Component
B.1 WSIB Administrative 0.343
B.2 Legislative Obligations
WSIAT 0.018
Office of Worker Advisor 0.009
Office of Employer Advisor 0.003
OHSA 0.084
Mine Rescue 0.000
Construction Certification Training 0.000
Program Administration 0.000
Institute of Work & Health 0.003
Sub-Total 0.117
B.3 Prevention Workplace Safety and
Prevention Services
0.050
B.4 TOTAL OVERHEAD EXPENSES 0.510
Section 6F - ©WSIB Ontario 402

2011 PREMIUM RATES
SUB-COMPONENTS OF OVERHEAD EXPENSES
RATE GROUP 689: WASTE MATERIALS RECYCLING
(CLASS F: RETAIL AND WHOLESALE TRADES)
Overhead Expenses
Component
Overhead Expenses
Sub-Component
Premium Rate
Component
B.1 WSIB Administrative 0.529
B.2 Legislative Obligations
WSIAT 0.027
Office of Worker Advisor 0.013
Office of Employer Advisor 0.004
OHSA 0.130
Mine Rescue 0.000
Construction Certification Training 0.000
Program Administration 0.001
Institute of Work & Health 0.005
Sub-Total 0.181
B.3 Prevention Infrastructure Health and
Safety Association
0.121
B.4 TOTAL OVERHEAD EXPENSES 0.831
Section 6F - ©WSIB Ontario 403

2011 PREMIUM RATES
SUB-COMPONENTS OF OVERHEAD EXPENSES
CLASS F: RETAIL AND WHOLESALE TRADES
Overhead Expenses
Component
Overhead Expenses
Sub-Component
Premium Rate
Component
B.1 WSIB Administrative 0.234
B.2 Legislative Obligations
WSIAT 0.012
Office of Worker Advisor 0.006
Office of Employer Advisor 0.002
OHSA 0.057
Mine Rescue 0.000
Construction Certification Training 0.000
Program Administration 0.000
Institute of Work & Health 0.002
Sub-Total 0.080
B.3 Prevention 0.037
B.4 TOTAL OVERHEAD EXPENSES 0.351
Section 6F - ©WSIB Ontario 404

2011 PREMIUM RATE COMPONENTS
RATE GROUP 604: FOOD, SALES
(CLASS F: RETAIL AND WHOLESALE TRADES)
Component
2011 Premium Rate
Per $100 Of
Insurable Earnings
Percentage
of 2011
Premium Rate
2010 Premium Rate
Per $100 Of
Insurable Earnings
Percentage
of 2010
Premium Rate
A. NEW CLAIMS COST
1. New Claims Cost 1.080 1.080 44% 1.235 1.235 51%
B. OVERHEAD EXPENSES
1. WSIB Administrative 0.296 0.298
2. Legislative Obligations 0.101 0.103
3. Prevention 0.042 0.029
4. TOTAL OVERHEAD EXPENSES 0.439 0.439 18% 0.430 0.430 18%
C. PAST CLAIMS COST
1. Unfunded Liability 0.782 0.671
2. (Gain)/Loss 0.109 0.089
3. Bad Debts 0.019 N/A
4. TOTAL PAST CLAIMS COST 0.910 0.910 37% 0.760 0.760 31%
D. TOTAL PREMIUM RATE (A+B+C) 2.43 100% 2.43 100%
Section 6F - ©WSIB Ontario 405

2011 PREMIUM RATE COMPONENTS
RATE GROUP 606: GROCERY AND CONVENIENCE STORES
(CLASS F: RETAIL AND WHOLESALE TRADES)
Component
2011 Premium Rate
Per $100 Of
Insurable Earnings
Percentage
of 2011
Premium Rate
2010 Premium Rate
Per $100 Of
Insurable Earnings
Percentage
of 2010
Premium Rate
A. NEW CLAIMS COST
1. New Claims Cost 0.927 0.927 44% 0.895 0.895 49%
B. OVERHEAD EXPENSES
1. WSIB Administrative 0.275 0.255
2. Legislative Obligations 0.094 0.089
3. Prevention 0.039 0.024
4. TOTAL OVERHEAD EXPENSES 0.408 0.408 19% 0.368 0.368 20%
C. PAST CLAIMS COST
1. Unfunded Liability 0.670 0.486
2. (Gain)/Loss 0.094 0.064
3. Bad Debts 0.014 N/A
4. TOTAL PAST CLAIMS COST 0.778 0.778 37% 0.550 0.550 30%
D. TOTAL PREMIUM RATE (A+B+C) 2.11 100% 1.81 100%
Section 6F - ©WSIB Ontario 406

2011 PREMIUM RATE COMPONENTS
RATE GROUP 607: SPECIALTY FOOD STORES
(CLASS F: RETAIL AND WHOLESALE TRADES)
Component
2011 Premium Rate
Per $100 Of
Insurable Earnings
Percentage
of 2011
Premium Rate
2010 Premium Rate
Per $100 Of
Insurable Earnings
Percentage
of 2010
Premium Rate
A. NEW CLAIMS COST
1. New Claims Cost 1.635 1.635 46% 1.874 1.874 52%
B. OVERHEAD EXPENSES
1. WSIB Administrative 0.373 0.377
2. Legislative Obligations 0.128 0.131
3. Prevention 0.055 0.038
4. TOTAL OVERHEAD EXPENSES 0.556 0.556 16% 0.546 0.546 15%
C. PAST CLAIMS COST
1. Unfunded Liability 1.183 1.017
2. (Gain)/Loss 0.165 0.135
3. Bad Debts 0.027 N/A
4. TOTAL PAST CLAIMS COST 1.375 1.375 39% 1.152 1.152 32%
D. TOTAL PREMIUM RATE (A+B+C) 3.57 100% 3.57 100%
Section 6F - ©WSIB Ontario 407

2011 PREMIUM RATE COMPONENTS
RATE GROUP 608: BEER STORES
(CLASS F: RETAIL AND WHOLESALE TRADES)
Component
2011 Premium Rate
Per $100 Of
Insurable Earnings
Percentage
of 2011
Premium Rate
2010 Premium Rate
Per $100 Of
Insurable Earnings
Percentage
of 2010
Premium Rate
A. NEW CLAIMS COST
1. New Claims Cost 1.843 1.843 46% 2.104 2.104 53%
B. OVERHEAD EXPENSES
1. WSIB Administrative 0.402 0.406
2. Legislative Obligations 0.138 0.142
3. Prevention 0.059 0.042
4. TOTAL OVERHEAD EXPENSES 0.599 0.599 15% 0.590 0.590 15%
C. PAST CLAIMS COST
1. Unfunded Liability 1.334 1.143
2. (Gain)/Loss 0.187 0.151
3. Bad Debts 0.031 N/A
4. TOTAL PAST CLAIMS COST 1.552 1.552 39% 1.294 1.294 32%
D. TOTAL PREMIUM RATE (A+B+C) 3.99 100% 3.99 100%
Section 6F - ©WSIB Ontario 408

2011 PREMIUM RATE COMPONENTS
RATE GROUP 612: AGRICULTURAL PRODUCTS, SALES
(CLASS F: RETAIL AND WHOLESALE TRADES)
Component
2011 Premium Rate
Per $100 Of
Insurable Earnings
Percentage
of 2011
Premium Rate
2010 Premium Rate
Per $100 Of
Insurable Earnings
Percentage
of 2010
Premium Rate
A. NEW CLAIMS COST
1. New Claims Cost 1.053 1.053 44% 1.195 1.195 50%
B. OVERHEAD EXPENSES
1. WSIB Administrative 0.292 0.293
2. Legislative Obligations 0.100 0.102
3. Prevention 0.042 0.044
4. TOTAL OVERHEAD EXPENSES 0.434 0.434 18% 0.439 0.439 19%
C. PAST CLAIMS COST
1. Unfunded Liability 0.762 0.649
2. (Gain)/Loss 0.107 0.086
3. Bad Debts 0.018 N/A
4. TOTAL PAST CLAIMS COST 0.887 0.887 37% 0.735 0.735 31%
D. TOTAL PREMIUM RATE (A+B+C) 2.37 100% 2.37 100%
Section 6F - ©WSIB Ontario 409
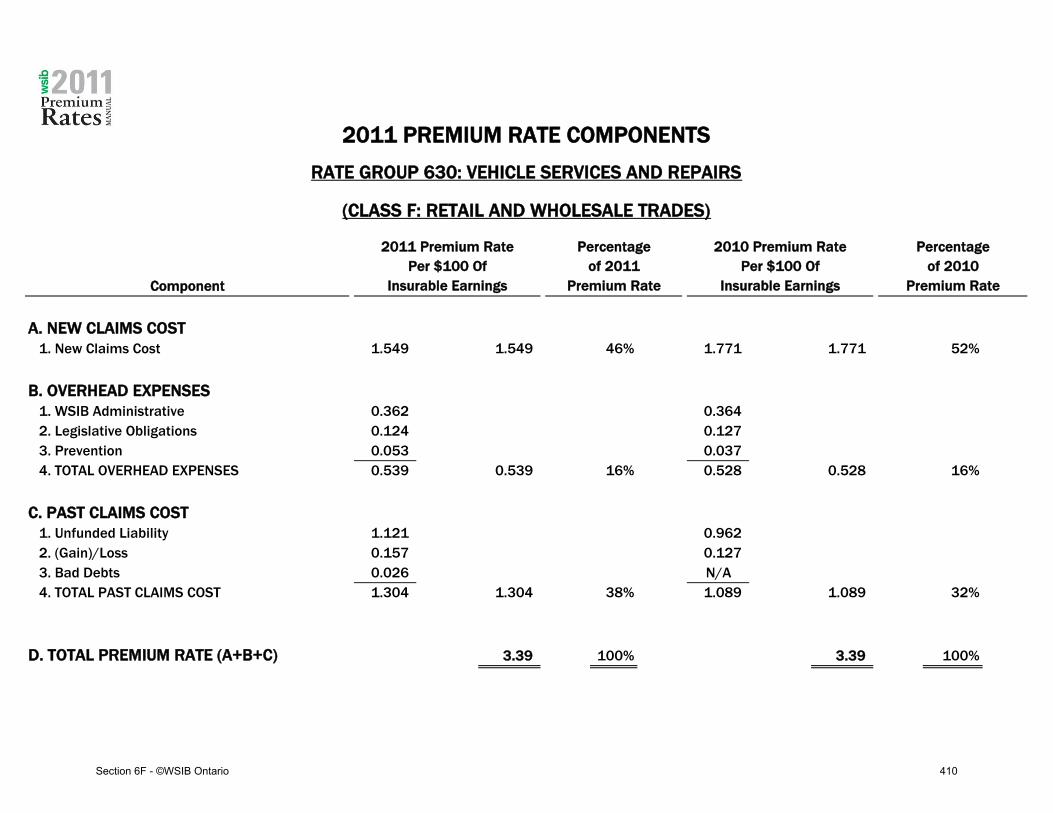
2011 PREMIUM RATE COMPONENTS
RATE GROUP 630: VEHICLE SERVICES AND REPAIRS
(CLASS F: RETAIL AND WHOLESALE TRADES)
Component
2011 Premium Rate
Per $100 Of
Insurable Earnings
Percentage
of 2011
Premium Rate
2010 Premium Rate
Per $100 Of
Insurable Earnings
Percentage
of 2010
Premium Rate
A. NEW CLAIMS COST
1. New Claims Cost 1.549 1.549 46% 1.771 1.771 52%
B. OVERHEAD EXPENSES
1. WSIB Administrative 0.362 0.364
2. Legislative Obligations 0.124 0.127
3. Prevention 0.053 0.037
4. TOTAL OVERHEAD EXPENSES 0.539 0.539 16% 0.528 0.528 16%
C. PAST CLAIMS COST
1. Unfunded Liability 1.121 0.962
2. (Gain)/Loss 0.157 0.127
3. Bad Debts 0.026 N/A
4. TOTAL PAST CLAIMS COST 1.304 1.304 38% 1.089 1.089 32%
D. TOTAL PREMIUM RATE (A+B+C) 3.39 100% 3.39 100%
Section 6F - ©WSIB Ontario 410

2011 PREMIUM RATE COMPONENTS
RATE GROUP 633: PETROLEUM PRODUCTS, SALES
(CLASS F: RETAIL AND WHOLESALE TRADES)
Component
2011 Premium Rate
Per $100 Of
Insurable Earnings
Percentage
of 2011
Premium Rate
2010 Premium Rate
Per $100 Of
Insurable Earnings
Percentage
of 2010
Premium Rate
A. NEW CLAIMS COST
1. New Claims Cost 1.107 1.107 44% 1.260 1.260 51%
B. OVERHEAD EXPENSES
1. WSIB Administrative 0.300 0.301
2. Legislative Obligations 0.102 0.105
3. Prevention 0.043 0.045
4. TOTAL OVERHEAD EXPENSES 0.445 0.445 18% 0.451 0.451 18%
C. PAST CLAIMS COST
1. Unfunded Liability 0.802 0.684
2. (Gain)/Loss 0.112 0.091
3. Bad Debts 0.019 N/A
4. TOTAL PAST CLAIMS COST 0.933 0.933 37% 0.775 0.775 31%
D. TOTAL PREMIUM RATE (A+B+C) 2.49 100% 2.49 100%
Section 6F - ©WSIB Ontario 411

2011 PREMIUM RATE COMPONENTS
RATE GROUP 636: OTHER SALES
(CLASS F: RETAIL AND WHOLESALE TRADES)
Component
2011 Premium Rate
Per $100 Of
Insurable Earnings
Percentage
of 2011
Premium Rate
2010 Premium Rate
Per $100 Of
Insurable Earnings
Percentage
of 2010
Premium Rate
A. NEW CLAIMS COST
1. New Claims Cost 0.578 0.578 41% 0.664 0.664 47%
B. OVERHEAD EXPENSES
1. WSIB Administrative 0.226 0.226
2. Legislative Obligations 0.077 0.078
3. Prevention 0.031 0.020
4. TOTAL OVERHEAD EXPENSES 0.334 0.334 24% 0.324 0.324 23%
C. PAST CLAIMS COST
1. Unfunded Liability 0.419 0.361
2. (Gain)/Loss 0.059 0.048
3. Bad Debts 0.011 N/A
4. TOTAL PAST CLAIMS COST 0.489 0.489 35% 0.409 0.409 29%
D. TOTAL PREMIUM RATE (A+B+C) 1.40 100% 1.40 100%
Section 6F - ©WSIB Ontario 412

2011 PREMIUM RATE COMPONENTS
RATE GROUP 638: PHARMACIES
(CLASS F: RETAIL AND WHOLESALE TRADES)
Component
2011 Premium Rate
Per $100 Of
Insurable Earnings
Percentage
of 2011
Premium Rate
2010 Premium Rate
Per $100 Of
Insurable Earnings
Percentage
of 2010
Premium Rate
A. NEW CLAIMS COST
1. New Claims Cost 0.267 0.267 39% 0.267 0.267 44%
B. OVERHEAD EXPENSES
1. WSIB Administrative 0.119 0.119
2. Legislative Obligations 0.040 0.041
3. Prevention 0.024 0.014
4. TOTAL OVERHEAD EXPENSES 0.183 0.183 27% 0.174 0.174 29%
C. PAST CLAIMS COST
1. Unfunded Liability 0.193 0.145
2. (Gain)/Loss 0.027 0.019
3. Bad Debts 0.005 N/A
4. TOTAL PAST CLAIMS COST 0.225 0.225 33% 0.164 0.164 27%
D. TOTAL PREMIUM RATE (A+B+C) 0.68 100% 0.61 100%
Section 6F - ©WSIB Ontario 413

2011 PREMIUM RATE COMPONENTS
RATE GROUP 641: CLOTHING STORES
(CLASS F: RETAIL AND WHOLESALE TRADES)
Component
2011 Premium Rate
Per $100 Of
Insurable Earnings
Percentage
of 2011
Premium Rate
2010 Premium Rate
Per $100 Of
Insurable Earnings
Percentage
of 2010
Premium Rate
A. NEW CLAIMS COST
1. New Claims Cost 0.641 0.641 42% 0.621 0.621 47%
B. OVERHEAD EXPENSES
1. WSIB Administrative 0.235 0.221
2. Legislative Obligations 0.080 0.077
3. Prevention 0.032 0.020
4. TOTAL OVERHEAD EXPENSES 0.347 0.347 23% 0.318 0.318 24%
C. PAST CLAIMS COST
1. Unfunded Liability 0.464 0.337
2. (Gain)/Loss 0.065 0.045
3. Bad Debts 0.010 N/A
4. TOTAL PAST CLAIMS COST 0.539 0.539 35% 0.382 0.382 29%
D. TOTAL PREMIUM RATE (A+B+C) 1.53 100% 1.32 100%
Section 6F - ©WSIB Ontario 414

2011 PREMIUM RATE COMPONENTS
RATE GROUP 657: AUTOMOBILE AND TRUCK DEALERS
(CLASS F: RETAIL AND WHOLESALE TRADES)
Component
2011 Premium Rate
Per $100 Of
Insurable Earnings
Percentage
of 2011
Premium Rate
2010 Premium Rate
Per $100 Of
Insurable Earnings
Percentage
of 2010
Premium Rate
A. NEW CLAIMS COST
1. New Claims Cost 0.311 0.311 40% 0.314 0.314 44%
B. OVERHEAD EXPENSES
1. WSIB Administrative 0.139 0.140
2. Legislative Obligations 0.047 0.048
3. Prevention 0.025 0.015
4. TOTAL OVERHEAD EXPENSES 0.211 0.211 27% 0.203 0.203 29%
C. PAST CLAIMS COST
1. Unfunded Liability 0.225 0.171
2. (Gain)/Loss 0.031 0.023
3. Bad Debts 0.005 N/A
4. TOTAL PAST CLAIMS COST 0.261 0.261 33% 0.194 0.194 27%
D. TOTAL PREMIUM RATE (A+B+C) 0.78 100% 0.71 100%
Section 6F - ©WSIB Ontario 415

2011 PREMIUM RATE COMPONENTS
RATE GROUP 668: COMPUTER, ELECTRONIC AND ELECTRICAL EQUIPMENT, SALES
(CLASS F: RETAIL AND WHOLESALE TRADES)
Component
2011 Premium Rate
Per $100 Of
Insurable Earnings
Percentage
of 2011
Premium Rate
2010 Premium Rate
Per $100 Of
Insurable Earnings
Percentage
of 2010
Premium Rate
A. NEW CLAIMS COST
1. New Claims Cost 0.188 0.188 39% 0.201 0.201 44%
B. OVERHEAD EXPENSES
1. WSIB Administrative 0.084 0.090
2. Legislative Obligations 0.028 0.031
3. Prevention 0.022 0.013
4. TOTAL OVERHEAD EXPENSES 0.134 0.134 28% 0.134 0.134 29%
C. PAST CLAIMS COST
1. Unfunded Liability 0.136 0.109
2. (Gain)/Loss 0.019 0.014
3. Bad Debts 0.004 N/A
4. TOTAL PAST CLAIMS COST 0.159 0.159 33% 0.123 0.123 27%
D. TOTAL PREMIUM RATE (A+B+C) 0.48 100% 0.46 100%
Section 6F - ©WSIB Ontario 416

2011 PREMIUM RATE COMPONENTS
RATE GROUP 670: MACHINERY AND OTHER VEHICLES, SALES
(CLASS F: RETAIL AND WHOLESALE TRADES)
Component
2011 Premium Rate
Per $100 Of
Insurable Earnings
Percentage
of 2011
Premium Rate
2010 Premium Rate
Per $100 Of
Insurable Earnings
Percentage
of 2010
Premium Rate
A. NEW CLAIMS COST
1. New Claims Cost 0.755 0.755 43% 0.858 0.858 49%
B. OVERHEAD EXPENSES
1. WSIB Administrative 0.251 0.251
2. Legislative Obligations 0.085 0.087
3. Prevention 0.035 0.037
4. TOTAL OVERHEAD EXPENSES 0.371 0.371 21% 0.375 0.375 21%
C. PAST CLAIMS COST
1. Unfunded Liability 0.547 0.466
2. (Gain)/Loss 0.076 0.062
3. Bad Debts 0.014 N/A
4. TOTAL PAST CLAIMS COST 0.637 0.637 36% 0.528 0.528 30%
D. TOTAL PREMIUM RATE (A+B+C) 1.76 100% 1.76 100%
Section 6F - ©WSIB Ontario 417

2011 PREMIUM RATE COMPONENTS
RATE GROUP 681: LUMBER AND BUILDERS SUPPLY
(CLASS F: RETAIL AND WHOLESALE TRADES)
Component
2011 Premium Rate
Per $100 Of
Insurable Earnings
Percentage
of 2011
Premium Rate
2010 Premium Rate
Per $100 Of
Insurable Earnings
Percentage
of 2010
Premium Rate
A. NEW CLAIMS COST
1. New Claims Cost 1.280 1.280 44% 1.396 1.396 51%
B. OVERHEAD EXPENSES
1. WSIB Administrative 0.324 0.318
2. Legislative Obligations 0.111 0.111
3. Prevention 0.087 0.040
4. TOTAL OVERHEAD EXPENSES 0.522 0.522 18% 0.469 0.469 17%
C. PAST CLAIMS COST
1. Unfunded Liability 0.926 0.758
2. (Gain)/Loss 0.130 0.100
3. Bad Debts 0.022 N/A
4. TOTAL PAST CLAIMS COST 1.078 1.078 37% 0.858 0.858 32%
D. TOTAL PREMIUM RATE (A+B+C) 2.88 100% 2.72 100%
Section 6F - ©WSIB Ontario 418

2011 PREMIUM RATE COMPONENTS
RATE GROUP 685: METAL PRODUCTS, WHOLESALE
(CLASS F: RETAIL AND WHOLESALE TRADES)
Component
2011 Premium Rate
Per $100 Of
Insurable Earnings
Percentage
of 2011
Premium Rate
2010 Premium Rate
Per $100 Of
Insurable Earnings
Percentage
of 2010
Premium Rate
A. NEW CLAIMS COST
1. New Claims Cost 1.413 1.413 45% 1.606 1.606 52%
B. OVERHEAD EXPENSES
1. WSIB Administrative 0.343 0.344
2. Legislative Obligations 0.117 0.120
3. Prevention 0.050 0.052
4. TOTAL OVERHEAD EXPENSES 0.510 0.510 16% 0.516 0.516 17%
C. PAST CLAIMS COST
1. Unfunded Liability 1.023 0.872
2. (Gain)/Loss 0.143 0.115
3. Bad Debts 0.024 N/A
4. TOTAL PAST CLAIMS COST 1.190 1.190 38% 0.987 0.987 32%
D. TOTAL PREMIUM RATE (A+B+C) 3.11 100% 3.11 100%
Section 6F - ©WSIB Ontario 419

2011 PREMIUM RATE COMPONENTS
RATE GROUP 689: WASTE MATERIALS RECYCLING
(CLASS F: RETAIL AND WHOLESALE TRADES)
Component
2011 Premium Rate
Per $100 Of
Insurable Earnings
Percentage
of 2011
Premium Rate
2010 Premium Rate
Per $100 Of
Insurable Earnings
Percentage
of 2010
Premium Rate
A. NEW CLAIMS COST
1. New Claims Cost 2.750 2.750 47% 3.166 3.166 54%
B. OVERHEAD EXPENSES
1. WSIB Administrative 0.529 0.538
2. Legislative Obligations 0.181 0.188
3. Prevention 0.121 0.058
4. TOTAL OVERHEAD EXPENSES 0.831 0.831 14% 0.784 0.784 13%
C. PAST CLAIMS COST
1. Unfunded Liability 1.991 1.719
2. (Gain)/Loss 0.278 0.228
3. Bad Debts 0.047 N/A
4. TOTAL PAST CLAIMS COST 2.316 2.316 39% 1.947 1.947 33%
D. TOTAL PREMIUM RATE (A+B+C) 5.90 100% 5.90 100%
Section 6F - ©WSIB Ontario 420

2011 PREMIUM RATE COMPONENTS
CLASS F: RETAIL AND WHOLESALE TRADES
Component
2011 Premium Rate
Per $100 Of
Insurable Earnings
Percentage
of 2011
Premium Rate
2010 Premium Rate
Per $100 Of
Insurable Earnings
Percentage
of 2010
Premium Rate
A. NEW CLAIMS COST
1. New Claims Cost 0.754 0.754 43% 0.844 0.844 50%
B. OVERHEAD EXPENSES
1. WSIB Administrative 0.234 0.234
2. Legislative Obligations 0.080 0.081
3. Prevention 0.037 0.025
4. TOTAL OVERHEAD EXPENSES 0.351 0.351 20% 0.340 0.340 20%
C. PAST CLAIMS COST
1. Unfunded Liability 0.546 0.458
2. (Gain)/Loss 0.076 0.061
3. Bad Debts 0.013 N/A
4. TOTAL PAST CLAIMS COST 0.635 0.635 36% 0.519 0.519 31%
D. TOTAL PREMIUM RATE (A+B+C) 1.74 100% 1.70 100%
Section 6F - ©WSIB Ontario 421

2011 PREMIUM RATES
Summary of Premium Rate Components by Rate Group
per $100 of Insurable Earnings
New Past 2011
Rate
Group Description
Claims
Cost
($)
Overhead
($)
Claims
Cost
($)
Premium
Rate
($)
604 FOOD, SALES 1.080 0.439 0.910 2.43
606 GROCERY AND CONVENIENCE STORES 0.927 0.408 0.778 2.11
607 SPECIALTY FOOD STORES 1.635 0.556 1.375 3.57
608 BEER STORES 1.843 0.599 1.552 3.99
612 AGRICULTURAL PRODUCTS, SALES 1.053 0.434 0.887 2.37
630 VEHICLE SERVICES AND REPAIRS 1.549 0.539 1.304 3.39
633 PETROLEUM PRODUCTS, SALES 1.107 0.445 0.933 2.49
636 OTHER SALES 0.578 0.334 0.489 1.40
638 PHARMACIES 0.267 0.183 0.225 0.68
641 CLOTHING STORES 0.641 0.347 0.539 1.53
657 AUTOMOBILE AND TRUCK DEALERS 0.311 0.211 0.261 0.78
668 COMPUTER, ELECTRONIC AND ELECTRICAL EQUIPMENT, SALES 0.188 0.134 0.159 0.48
670 MACHINERY AND OTHER VEHICLES, SALES 0.755 0.371 0.637 1.76
681 LUMBER AND BUILDERS SUPPLY 1.280 0.522 1.078 2.88
685 METAL PRODUCTS, WHOLESALE 1.413 0.510 1.190 3.11
689 WASTE MATERIALS RECYCLING 2.750 0.831 2.316 5.90
CLASS F RETAIL AND WHOLESALE TRADES 0.754 0.351 0.635 1.74
Section 6F - ©WSIB Ontario 422

2011Premium Rates M
ANUAL
SECTION 6GClass G – Construction

2011 PREMIUM RATES
6-YEAR HISTORICAL SUMMARY AND 2-YEAR PROJECTION
RATE GROUP 704: ELECTRICAL AND INCIDENTAL CONSTRUCTION SERVICES
(CLASS G: CONSTRUCTION)
Year
Insurable
Earnings
Maximum
Insurable
Earnings
Ceiling
Average
Insurable
Earnings Employment
Total
Number of
Injuries
Total Injury
Rate
2004 $1,365,925,131 $66,800 $44,031 31,022 2,589 8.35%
2005 $1,428,374,206 $67,700 $46,147 30,953 2,733 8.83%
2006 $1,546,201,229 $69,400 $46,876 32,985 2,711 8.22%
2007 $1,694,605,717 $71,800 $47,893 35,383 2,721 7.69%
2008 $1,854,456,890 $73,300 $48,763 38,030 2,848 7.49%
2009 $1,838,938,864 $74,600 $49,736 36,974 2,459 6.65%
2010 $1,917,457,381 $77,600 $50,550 37,932 2,360 6.22%
2011 $1,987,272,761 $79,600 $51,166 38,840 2,259 5.82%
Section 6G - ©WSIB Ontario 423

2011 PREMIUM RATES
6-YEAR HISTORICAL SUMMARY AND 2-YEAR PROJECTION
RATE GROUP 707: MECHANICAL AND SHEET METAL WORK
(CLASS G: CONSTRUCTION)
Year
Insurable
Earnings
Maximum
Insurable
Earnings
Ceiling
Average
Insurable
Earnings Employment
Total
Number of
Injuries
Total Injury
Rate
2004 $2,028,462,771 $66,800 $45,635 44,450 4,865 10.94%
2005 $2,265,827,464 $67,700 $47,359 47,844 5,128 10.72%
2006 $2,385,228,113 $69,400 $49,692 48,000 4,858 10.12%
2007 $2,547,208,293 $71,800 $50,021 50,923 4,931 9.68%
2008 $2,705,294,176 $73,300 $50,882 53,168 4,906 9.23%
2009 $2,585,982,627 $74,600 $51,237 50,471 3,907 7.74%
2010 $2,696,398,218 $77,600 $52,076 51,778 3,750 7.24%
2011 $2,794,575,141 $79,600 $52,710 53,018 3,589 6.77%
Section 6G - ©WSIB Ontario 424

2011 PREMIUM RATES
6-YEAR HISTORICAL SUMMARY AND 2-YEAR PROJECTION
RATE GROUP 711: ROADBUILDING AND EXCAVATING
(CLASS G: CONSTRUCTION)
Year
Insurable
Earnings
Maximum
Insurable
Earnings
Ceiling
Average
Insurable
Earnings Employment
Total
Number of
Injuries
Total Injury
Rate
2004 $1,271,658,113 $66,800 $45,137 28,173 2,037 7.23%
2005 $1,358,673,451 $67,700 $45,764 29,689 2,335 7.86%
2006 $1,407,594,432 $69,400 $48,240 29,179 2,159 7.40%
2007 $1,490,749,414 $71,800 $48,502 30,736 2,247 7.31%
2008 $1,575,807,858 $73,300 $49,086 32,103 2,290 7.13%
2009 $1,553,169,093 $74,600 $50,577 30,709 2,010 6.55%
2010 $1,619,485,889 $77,600 $51,406 31,504 2,011 6.38%
2011 $1,678,452,009 $79,600 $52,032 32,258 2,005 6.22%
Section 6G - ©WSIB Ontario 425

2011 PREMIUM RATES
6-YEAR HISTORICAL SUMMARY AND 2-YEAR PROJECTION
RATE GROUP 719: INSIDE FINISHING
(CLASS G: CONSTRUCTION)
Year
Insurable
Earnings
Maximum
Insurable
Earnings
Ceiling
Average
Insurable
Earnings Employment
Total
Number of
Injuries
Total Injury
Rate
2004 $996,452,546 $66,800 $38,666 25,771 1,574 6.11%
2005 $1,056,528,724 $67,700 $39,539 26,721 1,594 5.97%
2006 $1,109,890,118 $69,400 $40,379 27,487 1,483 5.40%
2007 $1,164,212,365 $71,800 $40,613 28,666 1,602 5.59%
2008 $1,208,329,559 $73,300 $41,309 29,251 1,596 5.46%
2009 $1,187,443,062 $74,600 $41,691 28,482 1,408 4.94%
2010 $1,238,144,187 $77,600 $42,373 29,220 1,380 4.72%
2011 $1,283,225,506 $79,600 $42,889 29,920 1,349 4.51%
Section 6G - ©WSIB Ontario 426

2011 PREMIUM RATES
6-YEAR HISTORICAL SUMMARY AND 2-YEAR PROJECTION
RATE GROUP 723: INDUSTRIAL, COMMERCIAL & INSTITUTIONAL CONSTRUCTION
(CLASS G: CONSTRUCTION)
Year
Insurable
Earnings
Maximum
Insurable
Earnings
Ceiling
Average
Insurable
Earnings Employment
Total
Number of
Injuries
Total Injury
Rate
2004 $1,107,416,605 $66,800 $41,667 26,578 2,248 8.46%
2005 $1,192,475,818 $67,700 $42,073 28,343 2,320 8.19%
2006 $1,314,981,289 $69,400 $45,550 28,869 2,293 7.94%
2007 $1,422,142,597 $71,800 $45,780 31,065 2,238 7.20%
2008 $1,530,843,868 $73,300 $46,628 32,831 2,388 7.27%
2009 $1,556,290,530 $74,600 $47,015 33,102 2,139 6.46%
2010 $1,622,740,605 $77,600 $47,785 33,959 2,053 6.05%
2011 $1,681,825,231 $79,600 $48,367 34,772 1,965 5.65%
Section 6G - ©WSIB Ontario 427

2011 PREMIUM RATES
6-YEAR HISTORICAL SUMMARY AND 2-YEAR PROJECTION
RATE GROUP 728: ROOFING
(CLASS G: CONSTRUCTION)
Year
Insurable
Earnings
Maximum
Insurable
Earnings
Ceiling
Average
Insurable
Earnings Employment
Total
Number of
Injuries
Total Injury
Rate
2004 $292,127,577 $66,800 $35,188 8,302 914 11.01%
2005 $313,920,256 $67,700 $35,439 8,858 1,013 11.44%
2006 $350,668,950 $69,400 $36,207 9,685 992 10.24%
2007 $351,486,321 $71,800 $38,860 9,045 969 10.71%
2008 $377,612,536 $73,300 $37,079 10,184 1,051 10.32%
2009 $411,728,176 $74,600 $37,106 11,096 887 7.99%
2010 $429,308,035 $77,600 $37,715 11,383 887 7.79%
2011 $444,939,310 $79,600 $38,173 11,656 885 7.59%
Section 6G - ©WSIB Ontario 428

2011 PREMIUM RATES
6-YEAR HISTORICAL SUMMARY AND 2-YEAR PROJECTION
RATE GROUP 732: HEAVY CIVIL CONSTRUCTION
(CLASS G: CONSTRUCTION)
Year
Insurable
Earnings
Maximum
Insurable
Earnings
Ceiling
Average
Insurable
Earnings Employment
Total
Number of
Injuries
Total Injury
Rate
2004 $363,421,945 $66,800 $53,840 6,750 776 11.50%
2005 $392,022,428 $67,700 $54,821 7,151 809 11.31%
2006 $466,345,123 $69,400 $56,823 8,207 1,013 12.34%
2007 $501,445,432 $71,800 $59,974 8,361 1,069 12.79%
2008 $488,954,510 $73,300 $59,585 8,206 992 12.09%
2009 $517,424,875 $74,600 $60,695 8,525 815 9.56%
2010 $539,517,743 $77,600 $61,687 8,746 815 9.32%
2011 $559,161,797 $79,600 $62,441 8,955 813 9.08%
Section 6G - ©WSIB Ontario 429

2011 PREMIUM RATES
6-YEAR HISTORICAL SUMMARY AND 2-YEAR PROJECTION
RATE GROUP 737: MILLWRIGHTING AND WELDING
(CLASS G: CONSTRUCTION)
Year
Insurable
Earnings
Maximum
Insurable
Earnings
Ceiling
Average
Insurable
Earnings Employment
Total
Number of
Injuries
Total Injury
Rate
2004 $455,168,687 $66,800 $45,677 9,965 1,324 13.29%
2005 $522,083,506 $67,700 $48,176 10,837 1,566 14.45%
2006 $552,390,233 $69,400 $48,038 11,499 1,548 13.46%
2007 $618,367,697 $71,800 $48,133 12,847 1,531 11.92%
2008 $628,856,613 $73,300 $44,121 14,253 1,574 11.04%
2009 $515,799,840 $74,600 $46,721 11,040 808 7.32%
2010 $537,823,323 $77,600 $47,486 11,326 776 6.85%
2011 $557,405,682 $79,600 $48,065 11,597 742 6.40%
Section 6G - ©WSIB Ontario 430

2011 PREMIUM RATES
6-YEAR HISTORICAL SUMMARY AND 2-YEAR PROJECTION
RATE GROUP 741: MASONRY
(CLASS G: CONSTRUCTION)
Year
Insurable
Earnings
Maximum
Insurable
Earnings
Ceiling
Average
Insurable
Earnings Employment
Total
Number of
Injuries
Total Injury
Rate
2004 $352,035,250 $66,800 $49,270 7,145 718 10.05%
2005 $354,464,819 $67,700 $48,583 7,296 642 8.80%
2006 $351,846,664 $69,400 $51,964 6,771 577 8.52%
2007 $355,918,917 $71,800 $51,411 6,923 611 8.83%
2008 $369,537,570 $73,300 $54,909 6,730 648 9.63%
2009 $334,956,820 $74,600 $53,636 6,245 513 8.21%
2010 $349,258,716 $77,600 $54,512 6,407 513 8.01%
2011 $361,975,364 $79,600 $55,179 6,560 512 7.80%
Section 6G - ©WSIB Ontario 431

2011 PREMIUM RATES
6-YEAR HISTORICAL SUMMARY AND 2-YEAR PROJECTION
RATE GROUP 748: FORM WORK AND DEMOLITION
(CLASS G: CONSTRUCTION)
Year
Insurable
Earnings
Maximum
Insurable
Earnings
Ceiling
Average
Insurable
Earnings Employment
Total
Number of
Injuries
Total Injury
Rate
2004 $195,832,291 $66,800 $53,771 3,642 856 23.50%
2005 $223,600,376 $67,700 $56,153 3,982 1,095 27.50%
2006 $253,936,415 $69,400 $56,156 4,522 1,070 23.66%
2007 $295,914,293 $71,800 $58,057 5,097 1,274 25.00%
2008 $365,420,224 $73,300 $60,944 5,996 1,514 25.25%
2009 $340,755,104 $74,600 $60,784 5,606 1,232 21.98%
2010 $355,304,574 $77,600 $61,781 5,751 1,232 21.42%
2011 $368,241,354 $79,600 $62,530 5,889 1,229 20.87%
Section 6G - ©WSIB Ontario 432

2011 PREMIUM RATES
6-YEAR HISTORICAL SUMMARY AND 2-YEAR PROJECTION
RATE GROUP 751: SIDING AND OUTSIDE FINISHING
(CLASS G: CONSTRUCTION)
Year
Insurable
Earnings
Maximum
Insurable
Earnings
Ceiling
Average
Insurable
Earnings Employment
Total
Number of
Injuries
Total Injury
Rate
2004 $534,765,769 $66,800 $41,713 12,820 1,617 12.61%
2005 $573,883,084 $67,700 $41,198 13,930 1,645 11.81%
2006 $600,867,297 $69,400 $42,214 14,234 1,634 11.48%
2007 $647,767,223 $71,800 $45,397 14,269 1,641 11.50%
2008 $704,603,564 $73,300 $45,164 15,601 1,781 11.42%
2009 $722,668,905 $74,600 $47,187 15,315 1,292 8.44%
2010 $753,525,228 $77,600 $47,959 15,712 1,292 8.22%
2011 $780,961,379 $79,600 $48,543 16,088 1,289 8.01%
Section 6G - ©WSIB Ontario 433

2011 PREMIUM RATES
6-YEAR HISTORICAL SUMMARY AND 2-YEAR PROJECTION
RATE GROUP 764: HOMEBUILDING
(CLASS G: CONSTRUCTION)
Year
Insurable
Earnings
Maximum
Insurable
Earnings
Ceiling
Average
Insurable
Earnings Employment
Total
Number of
Injuries
Total Injury
Rate
2004 $1,330,444,325 $66,800 $36,656 36,295 3,654 10.07%
2005 $1,411,285,573 $67,700 $38,257 36,890 3,873 10.50%
2006 $1,502,922,168 $69,400 $38,110 39,436 3,526 8.94%
2007 $1,603,700,508 $71,800 $39,756 40,339 3,628 8.99%
2008 $1,679,459,933 $73,300 $39,553 42,461 3,805 8.96%
2009 $1,612,612,599 $74,600 $41,093 39,243 2,649 6.75%
2010 $1,681,467,498 $77,600 $41,766 40,259 2,543 6.32%
2011 $1,742,690,393 $79,600 $42,275 41,223 2,433 5.90%
Section 6G - ©WSIB Ontario 434

2011 PREMIUM RATES
6-YEAR HISTORICAL SUMMARY AND 2-YEAR PROJECTION
CLASS G: CONSTRUCTION
Year
Insurable
Earnings
Maximum
Insurable
Earnings
Ceiling
Average
Insurable
Earnings Employment
Total
Number of
Injuries
Total Injury
Rate
2004 $10,293,711,010 $66,800 $42,728 240,913 23,172 9.62%
2005 $11,093,139,705 $67,700 $43,934 252,494 24,753 9.80%
2006 $11,842,872,031 $69,400 $45,397 260,874 23,864 9.15%
2007 $12,693,518,777 $71,800 $46,385 273,654 24,462 8.94%
2008 $13,489,177,301 $73,300 $46,705 288,814 25,393 8.79%
2009 $13,177,770,495 $74,600 $47,606 276,808 20,119 7.27%
2010 $13,740,431,397 $77,600 $48,386 283,977 19,612 6.91%
2011 $14,240,725,927 $79,600 $48,975 290,776 19,070 6.56%
Section 6G - ©WSIB Ontario 435

2011 PREMIUM RATESNEW CLAIMS COST BY RATE GROUP
2011 New Claims Cost 2011
Rate
Group Description Cost Index *
(%)
Cost per Claim
($)
Premium
Rate
($)
704 ELECTRICAL AND INCIDENTAL CONSTRUCTION SERVICES 76% 13,441 3.53
707 MECHANICAL AND SHEET METAL WORK 76% 13,484 3.98
711 ROADBUILDING AND EXCAVATING 106% 18,811 5.06
719 INSIDE FINISHING 173% 30,848 7.19
723 INDUSTRIAL, COMMERCIAL & INSTITUTIONAL CONSTRUCTION 92% 16,298 4.35
728 ROOFING 184% 32,702 14.16
732 HEAVY CIVIL CONSTRUCTION 117% 20,810 6.73
737 MILLWRIGHTING AND WELDING 125% 22,275 6.60
741 MASONRY 221% 39,399 12.15
748 FORM WORK AND DEMOLITION 136% 24,185 17.51
751 SIDING AND OUTSIDE FINISHING 152% 27,034 9.80
764 HOMEBUILDING 159% 28,221 8.71
CLASS G CONSTRUCTION 21,285 6.36
* The Cost Index compares the average cost of a claim for a Rate Group to that of the Class.Section 6G - ©WSIB Ontario 436

2011 PREMIUM RATES
SUB-COMPONENTS OF OVERHEAD EXPENSES
RATE GROUP 704: ELECTRICAL AND INCIDENTAL CONSTRUCTION SERVICES
(CLASS G: CONSTRUCTION)
Overhead Expenses
Component
Overhead Expenses
Sub-Component
Premium Rate
Component
B.1 WSIB Administrative 0.370
B.2 Legislative Obligations
WSIAT 0.019
Office of Worker Advisor 0.009
Office of Employer Advisor 0.003
OHSA 0.091
Mine Rescue 0.000
Construction Certification Training 0.000
Program Administration 0.001
Institute of Work & Health 0.004
Sub-Total 0.127
B.3 Prevention Infrastructure Health and
Safety Association
0.095
B.4 TOTAL OVERHEAD EXPENSES 0.592
Section 6G - ©WSIB Ontario 437

2011 PREMIUM RATES
SUB-COMPONENTS OF OVERHEAD EXPENSES
RATE GROUP 707: MECHANICAL AND SHEET METAL WORK
(CLASS G: CONSTRUCTION)
Overhead Expenses
Component
Overhead Expenses
Sub-Component
Premium Rate
Component
B.1 WSIB Administrative 0.401
B.2 Legislative Obligations
WSIAT 0.021
Office of Worker Advisor 0.010
Office of Employer Advisor 0.003
OHSA 0.098
Mine Rescue 0.000
Construction Certification Training 0.000
Program Administration 0.001
Institute of Work & Health 0.004
Sub-Total 0.138
B.3 Prevention Infrastructure Health and
Safety Association
0.100
B.4 TOTAL OVERHEAD EXPENSES 0.639
Section 6G - ©WSIB Ontario 438

2011 PREMIUM RATES
SUB-COMPONENTS OF OVERHEAD EXPENSES
RATE GROUP 711: ROADBUILDING AND EXCAVATING
(CLASS G: CONSTRUCTION)
Overhead Expenses
Component
Overhead Expenses
Sub-Component
Premium Rate
Component
B.1 WSIB Administrative 0.476
B.2 Legislative Obligations
WSIAT 0.025
Office of Worker Advisor 0.012
Office of Employer Advisor 0.004
OHSA 0.117
Mine Rescue 0.000
Construction Certification Training 0.000
Program Administration 0.001
Institute of Work & Health 0.005
Sub-Total 0.163
B.3 Prevention Infrastructure Health and
Safety Association
0.112
B.4 TOTAL OVERHEAD EXPENSES 0.751
Section 6G - ©WSIB Ontario 439

2011 PREMIUM RATES
SUB-COMPONENTS OF OVERHEAD EXPENSES
RATE GROUP 719: INSIDE FINISHING
(CLASS G: CONSTRUCTION)
Overhead Expenses
Component
Overhead Expenses
Sub-Component
Premium Rate
Component
B.1 WSIB Administrative 0.622
B.2 Legislative Obligations
WSIAT 0.032
Office of Worker Advisor 0.016
Office of Employer Advisor 0.005
OHSA 0.153
Mine Rescue 0.000
Construction Certification Training 0.000
Program Administration 0.001
Institute of Work & Health 0.006
Sub-Total 0.214
B.3 Prevention Infrastructure Health and
Safety Association
0.137
B.4 TOTAL OVERHEAD EXPENSES 0.973
Section 6G - ©WSIB Ontario 440

2011 PREMIUM RATES
SUB-COMPONENTS OF OVERHEAD EXPENSES
RATE GROUP 723: INDUSTRIAL, COMMERCIAL & INSTITUTIONAL CONSTRUCTION
(CLASS G: CONSTRUCTION)
Overhead Expenses
Component
Overhead Expenses
Sub-Component
Premium Rate
Component
B.1 WSIB Administrative 0.427
B.2 Legislative Obligations
WSIAT 0.022
Office of Worker Advisor 0.011
Office of Employer Advisor 0.004
OHSA 0.105
Mine Rescue 0.000
Construction Certification Training 0.000
Program Administration 0.001
Institute of Work & Health 0.004
Sub-Total 0.146
B.3 Prevention Infrastructure Health and
Safety Association
0.104
B.4 TOTAL OVERHEAD EXPENSES 0.677
Section 6G - ©WSIB Ontario 441

2011 PREMIUM RATES
SUB-COMPONENTS OF OVERHEAD EXPENSES
RATE GROUP 728: ROOFING
(CLASS G: CONSTRUCTION)
Overhead Expenses
Component
Overhead Expenses
Sub-Component
Premium Rate
Component
B.1 WSIB Administrative 1.099
B.2 Legislative Obligations
WSIAT 0.057
Office of Worker Advisor 0.028
Office of Employer Advisor 0.009
OHSA 0.272
Mine Rescue 0.000
Construction Certification Training 0.001
Program Administration 0.002
Institute of Work & Health 0.011
Sub-Total 0.378
B.3 Prevention Infrastructure Health and
Safety Association
0.217
B.4 TOTAL OVERHEAD EXPENSES 1.694
Section 6G - ©WSIB Ontario 442

2011 PREMIUM RATES
SUB-COMPONENTS OF OVERHEAD EXPENSES
RATE GROUP 732: HEAVY CIVIL CONSTRUCTION
(CLASS G: CONSTRUCTION)
Overhead Expenses
Component
Overhead Expenses
Sub-Component
Premium Rate
Component
B.1 WSIB Administrative 0.590
B.2 Legislative Obligations
WSIAT 0.031
Office of Worker Advisor 0.015
Office of Employer Advisor 0.005
OHSA 0.145
Mine Rescue 0.000
Construction Certification Training 0.000
Program Administration 0.001
Institute of Work & Health 0.006
Sub-Total 0.203
B.3 Prevention Infrastructure Health and
Safety Association
0.132
B.4 TOTAL OVERHEAD EXPENSES 0.925
Section 6G - ©WSIB Ontario 443

2011 PREMIUM RATES
SUB-COMPONENTS OF OVERHEAD EXPENSES
RATE GROUP 737: MILLWRIGHTING AND WELDING
(CLASS G: CONSTRUCTION)
Overhead Expenses
Component
Overhead Expenses
Sub-Component
Premium Rate
Component
B.1 WSIB Administrative 0.581
B.2 Legislative Obligations
WSIAT 0.030
Office of Worker Advisor 0.015
Office of Employer Advisor 0.005
OHSA 0.143
Mine Rescue 0.000
Construction Certification Training 0.000
Program Administration 0.001
Institute of Work & Health 0.006
Sub-Total 0.200
B.3 Prevention Infrastructure Health and
Safety Association
0.130
B.4 TOTAL OVERHEAD EXPENSES 0.911
Section 6G - ©WSIB Ontario 444

2011 PREMIUM RATES
SUB-COMPONENTS OF OVERHEAD EXPENSES
RATE GROUP 741: MASONRY
(CLASS G: CONSTRUCTION)
Overhead Expenses
Component
Overhead Expenses
Sub-Component
Premium Rate
Component
B.1 WSIB Administrative 0.962
B.2 Legislative Obligations
WSIAT 0.050
Office of Worker Advisor 0.024
Office of Employer Advisor 0.008
OHSA 0.237
Mine Rescue 0.000
Construction Certification Training 0.001
Program Administration 0.001
Institute of Work & Health 0.010
Sub-Total 0.331
B.3 Prevention Infrastructure Health and
Safety Association
0.194
B.4 TOTAL OVERHEAD EXPENSES 1.487
Section 6G - ©WSIB Ontario 445

2011 PREMIUM RATES
SUB-COMPONENTS OF OVERHEAD EXPENSES
RATE GROUP 748: FORM WORK AND DEMOLITION
(CLASS G: CONSTRUCTION)
Overhead Expenses
Component
Overhead Expenses
Sub-Component
Premium Rate
Component
B.1 WSIB Administrative 1.329
B.2 Legislative Obligations
WSIAT 0.069
Office of Worker Advisor 0.033
Office of Employer Advisor 0.011
OHSA 0.329
Mine Rescue 0.000
Construction Certification Training 0.001
Program Administration 0.002
Institute of Work & Health 0.013
Sub-Total 0.458
B.3 Prevention Infrastructure Health and
Safety Association
0.256
B.4 TOTAL OVERHEAD EXPENSES 2.043
Section 6G - ©WSIB Ontario 446

2011 PREMIUM RATES
SUB-COMPONENTS OF OVERHEAD EXPENSES
RATE GROUP 751: SIDING AND OUTSIDE FINISHING
(CLASS G: CONSTRUCTION)
Overhead Expenses
Component
Overhead Expenses
Sub-Component
Premium Rate
Component
B.1 WSIB Administrative 0.800
B.2 Legislative Obligations
WSIAT 0.041
Office of Worker Advisor 0.020
Office of Employer Advisor 0.007
OHSA 0.197
Mine Rescue 0.000
Construction Certification Training 0.000
Program Administration 0.001
Institute of Work & Health 0.008
Sub-Total 0.275
B.3 Prevention Infrastructure Health and
Safety Association
0.167
B.4 TOTAL OVERHEAD EXPENSES 1.242
Section 6G - ©WSIB Ontario 447

2011 PREMIUM RATES
SUB-COMPONENTS OF OVERHEAD EXPENSES
RATE GROUP 764: HOMEBUILDING
(CLASS G: CONSTRUCTION)
Overhead Expenses
Component
Overhead Expenses
Sub-Component
Premium Rate
Component
B.1 WSIB Administrative 0.726
B.2 Legislative Obligations
WSIAT 0.038
Office of Worker Advisor 0.018
Office of Employer Advisor 0.006
OHSA 0.179
Mine Rescue 0.000
Construction Certification Training 0.000
Program Administration 0.001
Institute of Work & Health 0.007
Sub-Total 0.249
B.3 Prevention Infrastructure Health and
Safety Association
0.155
B.4 TOTAL OVERHEAD EXPENSES 1.130
Section 6G - ©WSIB Ontario 448

2011 PREMIUM RATES
SUB-COMPONENTS OF OVERHEAD EXPENSES
CLASS G: CONSTRUCTION
Overhead Expenses
Component
Overhead Expenses
Sub-Component
Premium Rate
Component
B.1 WSIB Administrative 0.565
B.2 Legislative Obligations
WSIAT 0.029
Office of Worker Advisor 0.014
Office of Employer Advisor 0.005
OHSA 0.139
Mine Rescue 0.000
Construction Certification Training 0.000
Program Administration 0.001
Institute of Work & Health 0.006
Sub-Total 0.194
B.3 Prevention 0.127
B.4 TOTAL OVERHEAD EXPENSES 0.886
Section 6G - ©WSIB Ontario 449

2011 PREMIUM RATE COMPONENTS
RATE GROUP 704: ELECTRICAL AND INCIDENTAL CONSTRUCTION SERVICES
(CLASS G: CONSTRUCTION)
Component
2011 Premium Rate
Per $100 Of
Insurable Earnings
Percentage
of 2011
Premium Rate
2010 Premium Rate
Per $100 Of
Insurable Earnings
Percentage
of 2010
Premium Rate
A. NEW CLAIMS COST
1. New Claims Cost 1.551 1.551 44% 1.686 1.686 52%
B. OVERHEAD EXPENSES
1. WSIB Administrative 0.370 0.354
2. Legislative Obligations 0.127 0.123
3. Prevention 0.095 0.076
4. TOTAL OVERHEAD EXPENSES 0.592 0.592 17% 0.553 0.553 17%
C. PAST CLAIMS COST
1. Unfunded Liability 1.167 0.915
2. (Gain)/Loss 0.128 0.098
3. Bad Debts 0.088 N/A
4. TOTAL PAST CLAIMS COST 1.383 1.383 39% 1.013 1.013 31%
D. TOTAL PREMIUM RATE (A+B+C) 3.53 100% 3.25 100%
Section 6G - ©WSIB Ontario 450

2011 PREMIUM RATE COMPONENTS
RATE GROUP 707: MECHANICAL AND SHEET METAL WORK
(CLASS G: CONSTRUCTION)
Component
2011 Premium Rate
Per $100 Of
Insurable Earnings
Percentage
of 2011
Premium Rate
2010 Premium Rate
Per $100 Of
Insurable Earnings
Percentage
of 2010
Premium Rate
A. NEW CLAIMS COST
1. New Claims Cost 1.758 1.758 44% 2.095 2.095 53%
B. OVERHEAD EXPENSES
1. WSIB Administrative 0.401 0.405
2. Legislative Obligations 0.138 0.141
3. Prevention 0.100 0.082
4. TOTAL OVERHEAD EXPENSES 0.639 0.639 16% 0.628 0.628 16%
C. PAST CLAIMS COST
1. Unfunded Liability 1.328 1.137
2. (Gain)/Loss 0.146 0.122
3. Bad Debts 0.108 N/A
4. TOTAL PAST CLAIMS COST 1.582 1.582 40% 1.259 1.259 32%
D. TOTAL PREMIUM RATE (A+B+C) 3.98 100% 3.98 100%
Section 6G - ©WSIB Ontario 451

2011 PREMIUM RATE COMPONENTS
RATE GROUP 711: ROADBUILDING AND EXCAVATING
(CLASS G: CONSTRUCTION)
Component
2011 Premium Rate
Per $100 Of
Insurable Earnings
Percentage
of 2011
Premium Rate
2010 Premium Rate
Per $100 Of
Insurable Earnings
Percentage
of 2010
Premium Rate
A. NEW CLAIMS COST
1. New Claims Cost 2.281 2.281 45% 2.483 2.483 53%
B. OVERHEAD EXPENSES
1. WSIB Administrative 0.476 0.453
2. Legislative Obligations 0.163 0.158
3. Prevention 0.112 0.088
4. TOTAL OVERHEAD EXPENSES 0.751 0.751 15% 0.699 0.699 15%
C. PAST CLAIMS COST
1. Unfunded Liability 1.714 1.348
2. (Gain)/Loss 0.188 0.145
3. Bad Debts 0.127 N/A
4. TOTAL PAST CLAIMS COST 2.029 2.029 40% 1.493 1.493 32%
D. TOTAL PREMIUM RATE (A+B+C) 5.06 100% 4.68 100%
Section 6G - ©WSIB Ontario 452

2011 PREMIUM RATE COMPONENTS
RATE GROUP 719: INSIDE FINISHING
(CLASS G: CONSTRUCTION)
Component
2011 Premium Rate
Per $100 Of
Insurable Earnings
Percentage
of 2011
Premium Rate
2010 Premium Rate
Per $100 Of
Insurable Earnings
Percentage
of 2010
Premium Rate
A. NEW CLAIMS COST
1. New Claims Cost 3.292 3.292 46% 3.643 3.643 54%
B. OVERHEAD EXPENSES
1. WSIB Administrative 0.622 0.598
2. Legislative Obligations 0.214 0.209
3. Prevention 0.137 0.106
4. TOTAL OVERHEAD EXPENSES 0.973 0.973 14% 0.913 0.913 14%
C. PAST CLAIMS COST
1. Unfunded Liability 2.473 1.978
2. (Gain)/Loss 0.271 0.212
3. Bad Debts 0.183 N/A
4. TOTAL PAST CLAIMS COST 2.927 2.927 41% 2.190 2.190 32%
D. TOTAL PREMIUM RATE (A+B+C) 7.19 100% 6.75 100%
Section 6G - ©WSIB Ontario 453

2011 PREMIUM RATE COMPONENTS
RATE GROUP 723: INDUSTRIAL, COMMERCIAL & INSTITUTIONAL CONSTRUCTION
(CLASS G: CONSTRUCTION)
Component
2011 Premium Rate
Per $100 Of
Insurable Earnings
Percentage
of 2011
Premium Rate
2010 Premium Rate
Per $100 Of
Insurable Earnings
Percentage
of 2010
Premium Rate
A. NEW CLAIMS COST
1. New Claims Cost 1.933 1.933 44% 2.300 2.300 53%
B. OVERHEAD EXPENSES
1. WSIB Administrative 0.427 0.430
2. Legislative Obligations 0.146 0.150
3. Prevention 0.104 0.086
4. TOTAL OVERHEAD EXPENSES 0.677 0.677 16% 0.666 0.666 15%
C. PAST CLAIMS COST
1. Unfunded Liability 1.460 1.249
2. (Gain)/Loss 0.160 0.134
3. Bad Debts 0.118 N/A
4. TOTAL PAST CLAIMS COST 1.738 1.738 40% 1.383 1.383 32%
D. TOTAL PREMIUM RATE (A+B+C) 4.35 100% 4.35 100%
Section 6G - ©WSIB Ontario 454

2011 PREMIUM RATE COMPONENTS
RATE GROUP 728: ROOFING
(CLASS G: CONSTRUCTION)
Component
2011 Premium Rate
Per $100 Of
Insurable Earnings
Percentage
of 2011
Premium Rate
2010 Premium Rate
Per $100 Of
Insurable Earnings
Percentage
of 2010
Premium Rate
A. NEW CLAIMS COST
1. New Claims Cost 6.602 6.602 47% 7.312 7.312 55%
B. OVERHEAD EXPENSES
1. WSIB Administrative 1.099 1.055
2. Legislative Obligations 0.378 0.370
3. Prevention 0.217 0.163
4. TOTAL OVERHEAD EXPENSES 1.694 1.694 12% 1.588 1.588 12%
C. PAST CLAIMS COST
1. Unfunded Liability 4.956 3.970
2. (Gain)/Loss 0.543 0.426
3. Bad Debts 0.361 N/A
4. TOTAL PAST CLAIMS COST 5.860 5.860 41% 4.396 4.396 33%
D. TOTAL PREMIUM RATE (A+B+C) 14.16 100% 13.30 100%
Section 6G - ©WSIB Ontario 455

2011 PREMIUM RATE COMPONENTS
RATE GROUP 732: HEAVY CIVIL CONSTRUCTION
(CLASS G: CONSTRUCTION)
Component
2011 Premium Rate
Per $100 Of
Insurable Earnings
Percentage
of 2011
Premium Rate
2010 Premium Rate
Per $100 Of
Insurable Earnings
Percentage
of 2010
Premium Rate
A. NEW CLAIMS COST
1. New Claims Cost 3.071 3.071 46% 3.416 3.416 54%
B. OVERHEAD EXPENSES
1. WSIB Administrative 0.590 0.570
2. Legislative Obligations 0.203 0.199
3. Prevention 0.132 0.103
4. TOTAL OVERHEAD EXPENSES 0.925 0.925 14% 0.872 0.872 14%
C. PAST CLAIMS COST
1. Unfunded Liability 2.308 1.855
2. (Gain)/Loss 0.253 0.199
3. Bad Debts 0.172 N/A
4. TOTAL PAST CLAIMS COST 2.733 2.733 41% 2.054 2.054 32%
D. TOTAL PREMIUM RATE (A+B+C) 6.73 100% 6.34 100%
Section 6G - ©WSIB Ontario 456

2011 PREMIUM RATE COMPONENTS
RATE GROUP 737: MILLWRIGHTING AND WELDING
(CLASS G: CONSTRUCTION)
Component
2011 Premium Rate
Per $100 Of
Insurable Earnings
Percentage
of 2011
Premium Rate
2010 Premium Rate
Per $100 Of
Insurable Earnings
Percentage
of 2010
Premium Rate
A. NEW CLAIMS COST
1. New Claims Cost 3.010 3.010 46% 3.363 3.363 54%
B. OVERHEAD EXPENSES
1. WSIB Administrative 0.581 0.563
2. Legislative Obligations 0.200 0.197
3. Prevention 0.130 0.102
4. TOTAL OVERHEAD EXPENSES 0.911 0.911 14% 0.862 0.862 14%
C. PAST CLAIMS COST
1. Unfunded Liability 2.263 1.826
2. (Gain)/Loss 0.248 0.196
3. Bad Debts 0.170 N/A
4. TOTAL PAST CLAIMS COST 2.681 2.681 41% 2.022 2.022 32%
D. TOTAL PREMIUM RATE (A+B+C) 6.60 100% 6.25 100%
Section 6G - ©WSIB Ontario 457

2011 PREMIUM RATE COMPONENTS
RATE GROUP 741: MASONRY
(CLASS G: CONSTRUCTION)
Component
2011 Premium Rate
Per $100 Of
Insurable Earnings
Percentage
of 2011
Premium Rate
2010 Premium Rate
Per $100 Of
Insurable Earnings
Percentage
of 2010
Premium Rate
A. NEW CLAIMS COST
1. New Claims Cost 5.656 5.656 47% 6.111 6.111 55%
B. OVERHEAD EXPENSES
1. WSIB Administrative 0.962 0.905
2. Legislative Obligations 0.331 0.317
3. Prevention 0.194 0.144
4. TOTAL OVERHEAD EXPENSES 1.487 1.487 12% 1.366 1.366 12%
C. PAST CLAIMS COST
1. Unfunded Liability 4.242 3.318
2. (Gain)/Loss 0.465 0.356
3. Bad Debts 0.303 N/A
4. TOTAL PAST CLAIMS COST 5.010 5.010 41% 3.674 3.674 33%
D. TOTAL PREMIUM RATE (A+B+C) 12.15 100% 11.15 100%
Section 6G - ©WSIB Ontario 458

2011 PREMIUM RATE COMPONENTS
RATE GROUP 748: FORM WORK AND DEMOLITION
(CLASS G: CONSTRUCTION)
Component
2011 Premium Rate
Per $100 Of
Insurable Earnings
Percentage
of 2011
Premium Rate
2010 Premium Rate
Per $100 Of
Insurable Earnings
Percentage
of 2010
Premium Rate
A. NEW CLAIMS COST
1. New Claims Cost 8.193 8.193 47% 9.108 9.108 55%
B. OVERHEAD EXPENSES
1. WSIB Administrative 1.329 1.279
2. Legislative Obligations 0.458 0.448
3. Prevention 0.256 0.190
4. TOTAL OVERHEAD EXPENSES 2.043 2.043 12% 1.917 1.917 12%
C. PAST CLAIMS COST
1. Unfunded Liability 6.151 4.946
2. (Gain)/Loss 0.674 0.531
3. Bad Debts 0.448 N/A
4. TOTAL PAST CLAIMS COST 7.273 7.273 42% 5.477 5.477 33%
D. TOTAL PREMIUM RATE (A+B+C) 17.51 100% 16.50 100%
Section 6G - ©WSIB Ontario 459

2011 PREMIUM RATE COMPONENTS
RATE GROUP 751: SIDING AND OUTSIDE FINISHING
(CLASS G: CONSTRUCTION)
Component
2011 Premium Rate
Per $100 Of
Insurable Earnings
Percentage
of 2011
Premium Rate
2010 Premium Rate
Per $100 Of
Insurable Earnings
Percentage
of 2010
Premium Rate
A. NEW CLAIMS COST
1. New Claims Cost 4.529 4.529 46% 5.045 5.045 55%
B. OVERHEAD EXPENSES
1. WSIB Administrative 0.800 0.773
2. Legislative Obligations 0.275 0.270
3. Prevention 0.167 0.128
4. TOTAL OVERHEAD EXPENSES 1.242 1.242 13% 1.171 1.171 13%
C. PAST CLAIMS COST
1. Unfunded Liability 3.402 2.740
2. (Gain)/Loss 0.373 0.294
3. Bad Debts 0.251 N/A
4. TOTAL PAST CLAIMS COST 4.026 4.026 41% 3.034 3.034 33%
D. TOTAL PREMIUM RATE (A+B+C) 9.80 100% 9.25 100%
Section 6G - ©WSIB Ontario 460

2011 PREMIUM RATE COMPONENTS
RATE GROUP 764: HOMEBUILDING
(CLASS G: CONSTRUCTION)
Component
2011 Premium Rate
Per $100 Of
Insurable Earnings
Percentage
of 2011
Premium Rate
2010 Premium Rate
Per $100 Of
Insurable Earnings
Percentage
of 2010
Premium Rate
A. NEW CLAIMS COST
1. New Claims Cost 3.999 3.999 46% 4.745 4.745 54%
B. OVERHEAD EXPENSES
1. WSIB Administrative 0.726 0.735
2. Legislative Obligations 0.249 0.257
3. Prevention 0.155 0.123
4. TOTAL OVERHEAD EXPENSES 1.130 1.130 13% 1.115 1.115 13%
C. PAST CLAIMS COST
1. Unfunded Liability 3.015 2.576
2. (Gain)/Loss 0.330 0.276
3. Bad Debts 0.237 N/A
4. TOTAL PAST CLAIMS COST 3.582 3.582 41% 2.852 2.852 33%
D. TOTAL PREMIUM RATE (A+B+C) 8.71 100% 8.71 100%
Section 6G - ©WSIB Ontario 461

2011 PREMIUM RATE COMPONENTS
CLASS G: CONSTRUCTION
Component
2011 Premium Rate
Per $100 Of
Insurable Earnings
Percentage
of 2011
Premium Rate
2010 Premium Rate
Per $100 Of
Insurable Earnings
Percentage
of 2010
Premium Rate
A. NEW CLAIMS COST
1. New Claims Cost 2.893 2.893 45% 3.275 3.275 54%
B. OVERHEAD EXPENSES
1. WSIB Administrative 0.565 0.552
2. Legislative Obligations 0.194 0.193
3. Prevention 0.127 0.101
4. TOTAL OVERHEAD EXPENSES 0.886 0.886 14% 0.846 0.846 14%
C. PAST CLAIMS COST
1. Unfunded Liability 2.177 1.778
2. (Gain)/Loss 0.239 0.191
3. Bad Debts 0.166 N/A
4. TOTAL PAST CLAIMS COST 2.582 2.582 41% 1.969 1.969 32%
D. TOTAL PREMIUM RATE (A+B+C) 6.36 100% 6.09 100%
Section 6G - ©WSIB Ontario 462

2011 PREMIUM RATES
Summary of Premium Rate Components by Rate Group
per $100 of Insurable Earnings
New Past 2011
Rate
Group Description
Claims
Cost
($)
Overhead
($)
Claims
Cost
($)
Premium
Rate
($)
704 ELECTRICAL AND INCIDENTAL CONSTRUCTION SERVICES 1.551 0.592 1.383 3.53
707 MECHANICAL AND SHEET METAL WORK 1.758 0.639 1.582 3.98
711 ROADBUILDING AND EXCAVATING 2.281 0.751 2.029 5.06
719 INSIDE FINISHING 3.292 0.973 2.927 7.19
723 INDUSTRIAL, COMMERCIAL & INSTITUTIONAL CONSTRUCTION 1.933 0.677 1.738 4.35
728 ROOFING 6.602 1.694 5.860 14.16
732 HEAVY CIVIL CONSTRUCTION 3.071 0.925 2.733 6.73
737 MILLWRIGHTING AND WELDING 3.010 0.911 2.681 6.60
741 MASONRY 5.656 1.487 5.010 12.15
748 FORM WORK AND DEMOLITION 8.193 2.043 7.273 17.51
751 SIDING AND OUTSIDE FINISHING 4.529 1.242 4.026 9.80
764 HOMEBUILDING 3.999 1.130 3.582 8.71
CLASS G CONSTRUCTION 2.893 0.886 2.582 6.36
Section 6G - ©WSIB Ontario 463

2011Premium Rates M
ANUAL
SECTION 6HGovernment and Related Services

2011 PREMIUM RATES
6-YEAR HISTORICAL SUMMARY AND 2-YEAR PROJECTION
RATE GROUP 810: SCHOOL BOARDS
(CLASS H: GOVERNMENT AND RELATED SERVICES)
Year
Insurable
Earnings
Maximum
Insurable
Earnings
Ceiling
Average
Insurable
Earnings Employment
Total
Number of
Injuries
Total Injury
Rate
2004 $514,365,710 $66,800 $33,586 15,315 763 4.98%
2005 $548,931,825 $67,700 $34,688 15,825 777 4.91%
2006 $569,161,531 $69,400 $32,645 17,435 714 4.10%
2007 $614,144,718 $71,800 $32,434 18,935 723 3.82%
2008 $640,081,272 $73,300 $37,924 16,878 777 4.60%
2009 $658,538,895 $74,600 $38,143 17,265 724 4.19%
2010 $703,428,939 $77,600 $39,636 17,747 690 3.89%
2011 $733,528,635 $79,600 $40,845 17,959 647 3.60%
Section 6H - ©WSIB Ontario 464

2011 PREMIUM RATES
6-YEAR HISTORICAL SUMMARY AND 2-YEAR PROJECTION
RATE GROUP 817: EDUCATIONAL FACILITIES
(CLASS H: GOVERNMENT AND RELATED SERVICES)
Year
Insurable
Earnings
Maximum
Insurable
Earnings
Ceiling
Average
Insurable
Earnings Employment
Total
Number of
Injuries
Total Injury
Rate
2004 $3,812,526,562 $66,800 $36,027 105,824 1,654 1.56%
2005 $4,019,014,173 $67,700 $36,707 109,489 1,619 1.48%
2006 $4,300,500,049 $69,400 $38,115 112,830 1,507 1.34%
2007 $4,618,242,785 $71,800 $40,028 115,375 1,530 1.33%
2008 $4,897,590,410 $73,300 $41,579 117,790 1,617 1.37%
2009 $5,183,821,874 $74,600 $41,734 124,211 1,557 1.25%
2010 $5,537,182,917 $77,600 $43,369 127,676 1,485 1.16%
2011 $5,774,118,752 $79,600 $44,691 129,202 1,391 1.08%
Section 6H - ©WSIB Ontario 465

2011 PREMIUM RATES
6-YEAR HISTORICAL SUMMARY AND 2-YEAR PROJECTION
RATE GROUP 830: POWER AND TELECOMMUNICATION LINES
(CLASS H: GOVERNMENT AND RELATED SERVICES)
Year
Insurable
Earnings
Maximum
Insurable
Earnings
Ceiling
Average
Insurable
Earnings Employment
Total
Number of
Injuries
Total Injury
Rate
2004 $232,225,668 $66,800 $38,296 6,064 638 10.52%
2005 $290,822,299 $67,700 $41,594 6,992 721 10.31%
2006 $316,892,101 $69,400 $40,617 7,802 699 8.96%
2007 $355,989,386 $71,800 $40,624 8,763 764 8.72%
2008 $374,295,780 $73,300 $42,582 8,790 788 8.96%
2009 $394,006,029 $74,600 $41,707 9,447 682 7.22%
2010 $408,729,504 $77,600 $42,714 9,569 641 6.70%
2011 $414,523,725 $79,600 $42,849 9,674 600 6.20%
Section 6H - ©WSIB Ontario 466

2011 PREMIUM RATES
6-YEAR HISTORICAL SUMMARY AND 2-YEAR PROJECTION
RATE GROUP 833: ELECTRIC POWER GENERATION
(CLASS H: GOVERNMENT AND RELATED SERVICES)
Year
Insurable
Earnings
Maximum
Insurable
Earnings
Ceiling
Average
Insurable
Earnings Employment
Total
Number of
Injuries
Total Injury
Rate
2004 $1,142,563,984 $66,800 $61,610 18,545 521 2.81%
2005 $1,175,495,802 $67,700 $60,002 19,591 543 2.77%
2006 $1,212,310,214 $69,400 $63,964 18,953 511 2.70%
2007 $1,315,733,974 $71,800 $65,849 19,981 535 2.68%
2008 $1,377,903,701 $73,300 $67,867 20,303 484 2.38%
2009 $1,453,994,905 $74,600 $65,747 22,115 512 2.32%
2010 $1,508,328,737 $77,600 $67,336 22,400 481 2.15%
2011 $1,529,711,069 $79,600 $67,552 22,645 450 1.99%
Section 6H - ©WSIB Ontario 467

2011 PREMIUM RATES
6-YEAR HISTORICAL SUMMARY AND 2-YEAR PROJECTION
RATE GROUP 835: OIL, POWER AND WATER DISTRIBUTION
(CLASS H: GOVERNMENT AND RELATED SERVICES)
Year
Insurable
Earnings
Maximum
Insurable
Earnings
Ceiling
Average
Insurable
Earnings Employment
Total
Number of
Injuries
Total Injury
Rate
2004 $828,819,899 $66,800 $54,962 15,080 830 5.50%
2005 $840,571,530 $67,700 $56,316 14,926 894 5.99%
2006 $894,602,084 $69,400 $60,069 14,893 812 5.45%
2007 $972,395,643 $71,800 $61,505 15,810 876 5.54%
2008 $1,039,553,594 $73,300 $65,029 15,986 855 5.35%
2009 $1,116,703,990 $74,600 $63,590 17,561 784 4.46%
2010 $1,158,433,715 $77,600 $65,124 17,788 768 4.32%
2011 $1,174,855,874 $79,600 $65,331 17,983 749 4.17%
Section 6H - ©WSIB Ontario 468

2011 PREMIUM RATES
6-YEAR HISTORICAL SUMMARY AND 2-YEAR PROJECTION
RATE GROUP 838: NATURAL GAS DISTRIBUTION
(CLASS H: GOVERNMENT AND RELATED SERVICES)
Year
Insurable
Earnings
Maximum
Insurable
Earnings
Ceiling
Average
Insurable
Earnings Employment
Total
Number of
Injuries
Total Injury
Rate
2004 $254,223,233 $66,800 $53,229 4,776 170 3.56%
2005 $267,659,063 $67,700 $53,532 5,000 145 2.90%
2006 $272,018,531 $69,400 $57,558 4,726 151 3.20%
2007 $293,291,334 $71,800 $57,295 5,119 138 2.70%
2008 $304,611,440 $73,300 $58,310 5,224 136 2.60%
2009 $294,805,776 $74,600 $59,629 4,944 162 3.28%
2010 $304,127,482 $77,600 $61,033 4,983 145 2.91%
2011 $314,401,850 $79,600 $62,592 5,023 130 2.59%
Section 6H - ©WSIB Ontario 469

2011 PREMIUM RATES
6-YEAR HISTORICAL SUMMARY AND 2-YEAR PROJECTION
RATE GROUP 845: LOCAL GOVERNMENT SERVICES
(CLASS H: GOVERNMENT AND RELATED SERVICES)
Year
Insurable
Earnings
Maximum
Insurable
Earnings
Ceiling
Average
Insurable
Earnings Employment
Total
Number of
Injuries
Total Injury
Rate
2004 $1,242,887,773 $66,800 $38,451 32,324 1,983 6.13%
2005 $1,293,857,792 $67,700 $39,833 32,482 2,039 6.28%
2006 $1,370,958,441 $69,400 $42,927 31,937 2,037 6.38%
2007 $1,444,096,279 $71,800 $43,566 33,147 2,021 6.10%
2008 $1,560,531,288 $73,300 $44,607 34,984 2,000 5.72%
2009 $1,611,614,778 $74,600 $43,089 37,402 1,995 5.33%
2010 $1,655,506,131 $77,600 $43,959 37,660 1,903 5.05%
2011 $1,701,959,251 $79,600 $44,309 38,411 1,834 4.77%
Section 6H - ©WSIB Ontario 470

2011 PREMIUM RATES
6-YEAR HISTORICAL SUMMARY AND 2-YEAR PROJECTION
RATE GROUP 851: HOMES FOR NURSING CARE
(CLASS H: GOVERNMENT AND RELATED SERVICES)
Year
Insurable
Earnings
Maximum
Insurable
Earnings
Ceiling
Average
Insurable
Earnings Employment
Total
Number of
Injuries
Total Injury
Rate
2004 $1,731,354,154 $66,800 $28,044 61,737 5,799 9.39%
2005 $1,849,613,039 $67,700 $29,011 63,756 5,955 9.34%
2006 $1,961,848,034 $69,400 $30,778 63,742 5,731 8.99%
2007 $2,076,286,087 $71,800 $31,209 66,528 6,152 9.25%
2008 $2,204,959,767 $73,300 $32,169 68,543 6,239 9.10%
2009 $2,348,440,733 $74,600 $33,757 69,569 5,930 8.52%
2010 $2,557,805,761 $77,600 $35,769 71,510 5,892 8.24%
2011 $2,630,710,180 $79,600 $36,104 72,865 5,791 7.95%
Section 6H - ©WSIB Ontario 471

2011 PREMIUM RATES
6-YEAR HISTORICAL SUMMARY AND 2-YEAR PROJECTION
RATE GROUP 852: HOMES FOR RESIDENTIAL CARE
(CLASS H: GOVERNMENT AND RELATED SERVICES)
Year
Insurable
Earnings
Maximum
Insurable
Earnings
Ceiling
Average
Insurable
Earnings Employment
Total
Number of
Injuries
Total Injury
Rate
2004 $208,412,320 $66,800 $20,935 9,955 740 7.43%
2005 $239,580,714 $67,700 $21,695 11,043 696 6.30%
2006 $259,680,697 $69,400 $23,861 10,883 758 6.96%
2007 $276,719,680 $71,800 $24,088 11,488 765 6.66%
2008 $304,706,438 $73,300 $24,443 12,466 839 6.73%
2009 $331,060,674 $74,600 $24,234 13,661 728 5.33%
2010 $360,574,950 $77,600 $25,678 14,042 723 5.15%
2011 $370,852,317 $79,600 $25,919 14,308 711 4.97%
Section 6H - ©WSIB Ontario 472

2011 PREMIUM RATES
6-YEAR HISTORICAL SUMMARY AND 2-YEAR PROJECTION
RATE GROUP 853: HOSPITALS*
(CLASS H: GOVERNMENT AND RELATED SERVICES)
Year
Insurable
Earnings
Maximum
Insurable
Earnings
Ceiling
Average
Insurable
Earnings Employment
Total
Number of
Injuries
Total Injury
Rate
2004 $9,842,960,383 $66,800 $42,573 231,202 11,115 4.81%
2005 $10,259,310,526 $67,700 $44,172 232,258 11,456 4.93%
2006 $10,813,519,307 $69,400 $45,758 236,320 11,232 4.75%
2007 $11,629,884,333 $71,800 $47,213 246,328 11,442 4.65%
2008 $12,399,712,976 $73,300 $47,768 259,582 12,027 4.63%
2009 $12,911,921,050 $74,600 $48,550 265,951 11,961 4.50%
2010 $13,718,272,491 $77,600 $50,182 273,370 11,644 4.26%
2011 $14,463,861,779 $79,600 $51,926 278,550 11,214 4.03%
* Experience for rate groups 853 and 861 has been combined in order to determine a common 2011 Premium Rate.
Section 6H - ©WSIB Ontario 473

2011 PREMIUM RATES
6-YEAR HISTORICAL SUMMARY AND 2-YEAR PROJECTION
RATE GROUP 857: NURSING SERVICES
(CLASS H: GOVERNMENT AND RELATED SERVICES)
Year
Insurable
Earnings
Maximum
Insurable
Earnings
Ceiling
Average
Insurable
Earnings Employment
Total
Number of
Injuries
Total Injury
Rate
2004 $845,886,151 $66,800 $24,146 35,032 1,940 5.54%
2005 $907,835,418 $67,700 $25,207 36,015 2,128 5.91%
2006 $990,024,037 $69,400 $26,257 37,705 2,156 5.72%
2007 $1,027,501,060 $71,800 $26,280 39,098 2,087 5.34%
2008 $1,096,105,472 $73,300 $27,803 39,424 2,215 5.62%
2009 $1,171,653,024 $74,600 $27,717 42,272 2,142 5.07%
2010 $1,276,106,657 $77,600 $29,369 43,451 2,128 4.90%
2011 $1,312,479,167 $79,600 $29,644 44,274 2,092 4.73%
Section 6H - ©WSIB Ontario 474

2011 PREMIUM RATES
6-YEAR HISTORICAL SUMMARY AND 2-YEAR PROJECTION
RATE GROUP 858: GROUP HOMES
(CLASS H: GOVERNMENT AND RELATED SERVICES)
Year
Insurable
Earnings
Maximum
Insurable
Earnings
Ceiling
Average
Insurable
Earnings Employment
Total
Number of
Injuries
Total Injury
Rate
2004 $492,826,498 $66,800 $31,406 15,692 1,416 9.02%
2005 $508,062,929 $67,700 $32,369 15,696 1,530 9.75%
2006 $540,501,058 $69,400 $33,368 16,198 1,346 8.31%
2007 $590,714,867 $71,800 $34,894 16,929 1,473 8.70%
2008 $666,330,672 $73,300 $35,196 18,932 1,390 7.34%
2009 $699,668,352 $74,600 $36,996 18,912 1,581 8.36%
2010 $747,473,854 $77,600 $38,450 19,440 1,507 7.75%
2011 $783,764,577 $79,600 $39,568 19,808 1,422 7.18%
Section 6H - ©WSIB Ontario 475

2011 PREMIUM RATES
6-YEAR HISTORICAL SUMMARY AND 2-YEAR PROJECTION
RATE GROUP 861: TREATMENT CLINICS AND SPECIALIZED SERVICES*
(CLASS H: GOVERNMENT AND RELATED SERVICES)
Year
Insurable
Earnings
Maximum
Insurable
Earnings
Ceiling
Average
Insurable
Earnings Employment
Total
Number of
Injuries
Total Injury
Rate
2004 $9,842,960,383 $66,800 $42,573 231,202 11,115 4.81%
2005 $10,259,310,526 $67,700 $44,172 232,258 11,456 4.93%
2006 $10,813,519,307 $69,400 $45,758 236,320 11,232 4.75%
2007 $11,629,884,333 $71,800 $47,213 246,328 11,442 4.65%
2008 $12,399,712,976 $73,300 $47,768 259,582 12,027 4.63%
2009 $12,911,921,050 $74,600 $48,550 265,951 11,961 4.50%
2010 $13,718,272,491 $77,600 $50,182 273,370 11,644 4.26%
2011 $14,463,861,779 $79,600 $51,926 278,550 11,214 4.03%
* Experience for rate groups 853 and 861 has been combined in order to determine a common 2011 Premium Rate.
Section 6H - ©WSIB Ontario 476

2011 PREMIUM RATES
6-YEAR HISTORICAL SUMMARY AND 2-YEAR PROJECTION
RATE GROUP 875: PROFESSIONAL OFFICES AND AGENCIES
(CLASS H: GOVERNMENT AND RELATED SERVICES)
Year
Insurable
Earnings
Maximum
Insurable
Earnings
Ceiling
Average
Insurable
Earnings Employment
Total
Number of
Injuries
Total Injury
Rate
2004 $1,391,039,993 $66,800 $36,086 38,548 871 2.26%
2005 $1,465,076,358 $67,700 $36,580 40,051 949 2.37%
2006 $1,568,265,308 $69,400 $39,107 40,102 900 2.24%
2007 $1,697,271,619 $71,800 $41,650 40,751 935 2.29%
2008 $1,830,234,549 $73,300 $41,379 44,231 1,011 2.29%
2009 $1,927,050,666 $74,600 $44,518 43,287 870 2.01%
2010 $2,058,718,224 $77,600 $46,269 44,495 864 1.94%
2011 $2,158,671,383 $79,600 $47,613 45,338 850 1.87%
Section 6H - ©WSIB Ontario 477

2011 PREMIUM RATES
6-YEAR HISTORICAL SUMMARY AND 2-YEAR PROJECTION
CLASS H: GOVERNMENT AND RELATED SERVICES
Year
Insurable
Earnings
Maximum
Insurable
Earnings
Ceiling
Average
Insurable
Earnings Employment
Total
Number of
Injuries
Total Injury
Rate
2004 $22,540,092,328 $66,800 $38,197 590,094 28,440 4.82%
2005 $23,665,831,468 $67,700 $39,239 603,124 29,452 4.88%
2006 $25,070,281,392 $69,400 $40,863 613,526 28,554 4.65%
2007 $26,912,271,765 $71,800 $42,166 638,252 29,441 4.61%
2008 $28,696,617,359 $73,300 $43,274 663,133 30,378 4.58%
2009 $30,103,280,746 $74,600 $43,844 686,597 29,628 4.32%
2010 $31,994,689,362 $77,600 $45,439 704,131 28,871 4.10%
2011 $33,363,438,559 $79,600 $46,594 716,040 27,881 3.89%
Section 6H - ©WSIB Ontario 478

2011 PREMIUM RATESNEW CLAIMS COST BY RATE GROUP
2011 New Claims Cost 2011
Rate
Group Description Cost Index *
(%)
Cost per Claim
($)
Premium
Rate
($)
810 SCHOOL BOARDS 47% 3,424 0.78
817 EDUCATIONAL FACILITIES 80% 5,800 0.36
830 POWER AND TELECOMMUNICATION LINES 179% 12,954 4.25
833 ELECTRIC POWER GENERATION 130% 9,423 0.76
835 OIL, POWER AND WATER DISTRIBUTION 83% 5,964 1.03
838 NATURAL GAS DISTRIBUTION 80% 5,771 0.67
845 LOCAL GOVERNMENT SERVICES 122% 8,784 2.15
851 HOMES FOR NURSING CARE 87% 6,311 3.15
852 HOMES FOR RESIDENTIAL CARE 100% 7,261 3.16
853 HOSPITALS 73% 5,308 1.06
857 NURSING SERVICES 121% 8,753 3.17
858 GROUP HOMES 101% 7,285 3.01
861 TREATMENT CLINICS AND SPECIALIZED SERVICES 73% 5,308 1.06
875 PROFESSIONAL OFFICES AND AGENCIES 98% 7,053 0.71
CLASS H GOVERNMENT AND RELATED SERVICES 6,441 1.30
* The Cost Index compares the average cost of a claim for a Rate Group to that of the Class.Section 6H - ©WSIB Ontario 479

2011 PREMIUM RATES
SUB-COMPONENTS OF OVERHEAD EXPENSES
RATE GROUP 810: SCHOOL BOARDS
(CLASS H: GOVERNMENT AND RELATED SERVICES)
Overhead Expenses
Component
Overhead Expenses
Sub-Component
Premium Rate
Component
B.1 WSIB Administrative 0.136
B.2 Legislative Obligations
WSIAT 0.007
Office of Worker Advisor 0.003
Office of Employer Advisor 0.001
OHSA 0.033
Mine Rescue 0.000
Construction Certification Training 0.000
Program Administration 0.000
Institute of Work & Health 0.001
Sub-Total 0.046
B.3 Prevention Public Services Health and
Safety Association
0.014
B.4 TOTAL OVERHEAD EXPENSES 0.196
Section 6H - ©WSIB Ontario 480

2011 PREMIUM RATES
SUB-COMPONENTS OF OVERHEAD EXPENSES
RATE GROUP 817: EDUCATIONAL FACILITIES
(CLASS H: GOVERNMENT AND RELATED SERVICES)
Overhead Expenses
Component
Overhead Expenses
Sub-Component
Premium Rate
Component
B.1 WSIB Administrative 0.063
B.2 Legislative Obligations
WSIAT 0.003
Office of Worker Advisor 0.002
Office of Employer Advisor 0.001
OHSA 0.015
Mine Rescue 0.000
Construction Certification Training 0.000
Program Administration 0.000
Institute of Work & Health 0.001
Sub-Total 0.021
B.3 Prevention Public Services Health and
Safety Association
0.011
B.4 TOTAL OVERHEAD EXPENSES 0.095
Section 6H - ©WSIB Ontario 481

2011 PREMIUM RATES
SUB-COMPONENTS OF OVERHEAD EXPENSES
RATE GROUP 830: POWER AND TELECOMMUNICATION LINES
(CLASS H: GOVERNMENT AND RELATED SERVICES)
Overhead Expenses
Component
Overhead Expenses
Sub-Component
Premium Rate
Component
B.1 WSIB Administrative 0.405
B.2 Legislative Obligations
WSIAT 0.021
Office of Worker Advisor 0.010
Office of Employer Advisor 0.003
OHSA 0.099
Mine Rescue 0.000
Construction Certification Training 0.000
Program Administration 0.001
Institute of Work & Health 0.004
Sub-Total 0.138
B.3 Prevention Infrastructure Health and
Safety Association
0.101
B.4 TOTAL OVERHEAD EXPENSES 0.644
Section 6H - ©WSIB Ontario 482

2011 PREMIUM RATES
SUB-COMPONENTS OF OVERHEAD EXPENSES
RATE GROUP 833: ELECTRIC POWER GENERATION
(CLASS H: GOVERNMENT AND RELATED SERVICES)
Overhead Expenses
Component
Overhead Expenses
Sub-Component
Premium Rate
Component
B.1 WSIB Administrative 0.152
B.2 Legislative Obligations
WSIAT 0.008
Office of Worker Advisor 0.004
Office of Employer Advisor 0.001
OHSA 0.000
Mine Rescue 0.000
Construction Certification Training 0.000
Program Administration 0.000
Institute of Work & Health 0.002
Sub-Total 0.015
B.3 Prevention Infrastructure Health and
Safety Association
0.063
B.4 TOTAL OVERHEAD EXPENSES 0.230
Section 6H - ©WSIB Ontario 483

2011 PREMIUM RATES
SUB-COMPONENTS OF OVERHEAD EXPENSES
RATE GROUP 835: OIL, POWER AND WATER DISTRIBUTION
(CLASS H: GOVERNMENT AND RELATED SERVICES)
Overhead Expenses
Component
Overhead Expenses
Sub-Component
Premium Rate
Component
B.1 WSIB Administrative 0.171
B.2 Legislative Obligations
WSIAT 0.009
Office of Worker Advisor 0.004
Office of Employer Advisor 0.001
OHSA 0.042
Mine Rescue 0.000
Construction Certification Training 0.000
Program Administration 0.000
Institute of Work & Health 0.002
Sub-Total 0.058
B.3 Prevention Infrastructure Health and
Safety Association
0.066
B.4 TOTAL OVERHEAD EXPENSES 0.295
Section 6H - ©WSIB Ontario 484

2011 PREMIUM RATES
SUB-COMPONENTS OF OVERHEAD EXPENSES
RATE GROUP 838: NATURAL GAS DISTRIBUTION
(CLASS H: GOVERNMENT AND RELATED SERVICES)
Overhead Expenses
Component
Overhead Expenses
Sub-Component
Premium Rate
Component
B.1 WSIB Administrative 0.108
B.2 Legislative Obligations
WSIAT 0.006
Office of Worker Advisor 0.003
Office of Employer Advisor 0.001
OHSA 0.026
Mine Rescue 0.000
Construction Certification Training 0.000
Program Administration 0.000
Institute of Work & Health 0.001
Sub-Total 0.036
B.3 Prevention Infrastructure Health and
Safety Association
0.063
B.4 TOTAL OVERHEAD EXPENSES 0.207
Section 6H - ©WSIB Ontario 485

2011 PREMIUM RATES
SUB-COMPONENTS OF OVERHEAD EXPENSES
RATE GROUP 845: LOCAL GOVERNMENT SERVICES
(CLASS H: GOVERNMENT AND RELATED SERVICES)
Overhead Expenses
Component
Overhead Expenses
Sub-Component
Premium Rate
Component
B.1 WSIB Administrative 0.267
B.2 Legislative Obligations
WSIAT 0.014
Office of Worker Advisor 0.007
Office of Employer Advisor 0.002
OHSA 0.065
Mine Rescue 0.000
Construction Certification Training 0.000
Program Administration 0.000
Institute of Work & Health 0.003
Sub-Total 0.091
B.3 Prevention Public Services Health and
Safety Association
0.023
B.4 TOTAL OVERHEAD EXPENSES 0.381
Section 6H - ©WSIB Ontario 486

2011 PREMIUM RATES
SUB-COMPONENTS OF OVERHEAD EXPENSES
RATE GROUP 851: HOMES FOR NURSING CARE
(CLASS H: GOVERNMENT AND RELATED SERVICES)
Overhead Expenses
Component
Overhead Expenses
Sub-Component
Premium Rate
Component
B.1 WSIB Administrative 0.338
B.2 Legislative Obligations
WSIAT 0.017
Office of Worker Advisor 0.008
Office of Employer Advisor 0.003
OHSA 0.083
Mine Rescue 0.000
Construction Certification Training 0.000
Program Administration 0.000
Institute of Work & Health 0.003
Sub-Total 0.115
B.3 Prevention Public Services Health and
Safety Association
0.031
B.4 TOTAL OVERHEAD EXPENSES 0.484
Section 6H - ©WSIB Ontario 487

2011 PREMIUM RATES
SUB-COMPONENTS OF OVERHEAD EXPENSES
RATE GROUP 852: HOMES FOR RESIDENTIAL CARE
(CLASS H: GOVERNMENT AND RELATED SERVICES)
Overhead Expenses
Component
Overhead Expenses
Sub-Component
Premium Rate
Component
B.1 WSIB Administrative 0.338
B.2 Legislative Obligations
WSIAT 0.017
Office of Worker Advisor 0.009
Office of Employer Advisor 0.003
OHSA 0.083
Mine Rescue 0.000
Construction Certification Training 0.000
Program Administration 0.000
Institute of Work & Health 0.003
Sub-Total 0.115
B.3 Prevention Public Services Health and
Safety Association
0.031
B.4 TOTAL OVERHEAD EXPENSES 0.484
Section 6H - ©WSIB Ontario 488

2011 PREMIUM RATES
SUB-COMPONENTS OF OVERHEAD EXPENSES
RATE GROUP 853: HOSPITALS*
(CLASS H: GOVERNMENT AND RELATED SERVICES)
Overhead Expenses
Component
Overhead Expenses
Sub-Component
Premium Rate
Component
B.1 WSIB Administrative 0.185
B.2 Legislative Obligations
WSIAT 0.010
Office of Worker Advisor 0.005
Office of Employer Advisor 0.002
OHSA 0.045
Mine Rescue 0.000
Construction Certification Training 0.000
Program Administration 0.000
Institute of Work & Health 0.002
Sub-Total 0.063
B.3 Prevention Public Services Health and
Safety Association
0.015
B.4 TOTAL OVERHEAD EXPENSES 0.263
* Experience for rate groups 853 and 861 has been combined in order to determine a common 2011 Premium Rate.
Section 6H - ©WSIB Ontario 489

2011 PREMIUM RATES
SUB-COMPONENTS OF OVERHEAD EXPENSES
RATE GROUP 857: NURSING SERVICES
(CLASS H: GOVERNMENT AND RELATED SERVICES)
Overhead Expenses
Component
Overhead Expenses
Sub-Component
Premium Rate
Component
B.1 WSIB Administrative 0.338
B.2 Legislative Obligations
WSIAT 0.018
Office of Worker Advisor 0.009
Office of Employer Advisor 0.003
OHSA 0.083
Mine Rescue 0.000
Construction Certification Training 0.000
Program Administration 0.000
Institute of Work & Health 0.003
Sub-Total 0.116
B.3 Prevention Public Services Health and
Safety Association
0.031
B.4 TOTAL OVERHEAD EXPENSES 0.485
Section 6H - ©WSIB Ontario 490

2011 PREMIUM RATES
SUB-COMPONENTS OF OVERHEAD EXPENSES
RATE GROUP 858: GROUP HOMES
(CLASS H: GOVERNMENT AND RELATED SERVICES)
Overhead Expenses
Component
Overhead Expenses
Sub-Component
Premium Rate
Component
B.1 WSIB Administrative 0.328
B.2 Legislative Obligations
WSIAT 0.017
Office of Worker Advisor 0.008
Office of Employer Advisor 0.003
OHSA 0.080
Mine Rescue 0.000
Construction Certification Training 0.000
Program Administration 0.000
Institute of Work & Health 0.003
Sub-Total 0.112
B.3 Prevention Public Services Health and
Safety Association
0.030
B.4 TOTAL OVERHEAD EXPENSES 0.470
Section 6H - ©WSIB Ontario 491

2011 PREMIUM RATES
SUB-COMPONENTS OF OVERHEAD EXPENSES
RATE GROUP 861: TREATMENT CLINICS AND SPECIALIZED SERVICES*
(CLASS H: GOVERNMENT AND RELATED SERVICES)
Overhead Expenses
Component
Overhead Expenses
Sub-Component
Premium Rate
Component
B.1 WSIB Administrative 0.185
B.2 Legislative Obligations
WSIAT 0.010
Office of Worker Advisor 0.005
Office of Employer Advisor 0.002
OHSA 0.045
Mine Rescue 0.000
Construction Certification Training 0.000
Program Administration 0.000
Institute of Work & Health 0.002
Sub-Total 0.063
B.3 Prevention Public Services Health and
Safety Association
0.015
B.4 TOTAL OVERHEAD EXPENSES 0.263
* Experience for rate groups 853 and 861 has been combined in order to determine a common 2011 Premium Rate.
Section 6H - ©WSIB Ontario 492

2011 PREMIUM RATES
SUB-COMPONENTS OF OVERHEAD EXPENSES
RATE GROUP 875: PROFESSIONAL OFFICES AND AGENCIES
(CLASS H: GOVERNMENT AND RELATED SERVICES)
Overhead Expenses
Component
Overhead Expenses
Sub-Component
Premium Rate
Component
B.1 WSIB Administrative 0.125
B.2 Legislative Obligations
WSIAT 0.006
Office of Worker Advisor 0.003
Office of Employer Advisor 0.001
OHSA 0.030
Mine Rescue 0.000
Construction Certification Training 0.000
Program Administration 0.000
Institute of Work & Health 0.001
Sub-Total 0.042
B.3 Prevention Public Services Health and
Safety Association
0.013
B.4 TOTAL OVERHEAD EXPENSES 0.180
Section 6H - ©WSIB Ontario 493

2011 PREMIUM RATES
SUB-COMPONENTS OF OVERHEAD EXPENSES
CLASS H: GOVERNMENT AND RELATED SERVICES
Overhead Expenses
Component
Overhead Expenses
Sub-Component
Premium Rate
Component
B.1 WSIB Administrative 0.186
B.2 Legislative Obligations
WSIAT 0.010
Office of Worker Advisor 0.005
Office of Employer Advisor 0.002
OHSA 0.044
Mine Rescue 0.000
Construction Certification Training 0.000
Program Administration 0.000
Institute of Work & Health 0.002
Sub-Total 0.062
B.3 Prevention 0.023
B.4 TOTAL OVERHEAD EXPENSES 0.271
Section 6H - ©WSIB Ontario 494

2011 PREMIUM RATE COMPONENTS
RATE GROUP 810: SCHOOL BOARDS
(CLASS H: GOVERNMENT AND RELATED SERVICES)
Component
2011 Premium Rate
Per $100 Of
Insurable Earnings
Percentage
of 2011
Premium Rate
2010 Premium Rate
Per $100 Of
Insurable Earnings
Percentage
of 2010
Premium Rate
A. NEW CLAIMS COST
1. New Claims Cost 0.307 0.307 39% 0.316 0.316 41%
B. OVERHEAD EXPENSES
1. WSIB Administrative 0.136 0.141
2. Legislative Obligations 0.046 0.049
3. Prevention 0.014 0.051
4. TOTAL OVERHEAD EXPENSES 0.196 0.196 25% 0.241 0.241 31%
C. PAST CLAIMS COST
1. Unfunded Liability 0.217 0.172
2. (Gain)/Loss 0.056 0.050
3. Bad Debts 0.001 N/A
4. TOTAL PAST CLAIMS COST 0.274 0.274 35% 0.222 0.222 28%
D. TOTAL PREMIUM RATE (A+B+C) 0.78 100% 0.78 100%
Section 6H - ©WSIB Ontario 495

2011 PREMIUM RATE COMPONENTS
RATE GROUP 817: EDUCATIONAL FACILITIES
(CLASS H: GOVERNMENT AND RELATED SERVICES)
Component
2011 Premium Rate
Per $100 Of
Insurable Earnings
Percentage
of 2011
Premium Rate
2010 Premium Rate
Per $100 Of
Insurable Earnings
Percentage
of 2010
Premium Rate
A. NEW CLAIMS COST
1. New Claims Cost 0.142 0.142 39% 0.133 0.133 39%
B. OVERHEAD EXPENSES
1. WSIB Administrative 0.063 0.059
2. Legislative Obligations 0.021 0.020
3. Prevention 0.011 0.031
4. TOTAL OVERHEAD EXPENSES 0.095 0.095 26% 0.110 0.110 32%
C. PAST CLAIMS COST
1. Unfunded Liability 0.100 0.072
2. (Gain)/Loss 0.026 0.021
3. Bad Debts 0.001 N/A
4. TOTAL PAST CLAIMS COST 0.127 0.127 35% 0.093 0.093 27%
D. TOTAL PREMIUM RATE (A+B+C) 0.36 100% 0.34 100%
Section 6H - ©WSIB Ontario 496

2011 PREMIUM RATE COMPONENTS
RATE GROUP 830: POWER AND TELECOMMUNICATION LINES
(CLASS H: GOVERNMENT AND RELATED SERVICES)
Component
2011 Premium Rate
Per $100 Of
Insurable Earnings
Percentage
of 2011
Premium Rate
2010 Premium Rate
Per $100 Of
Insurable Earnings
Percentage
of 2010
Premium Rate
A. NEW CLAIMS COST
1. New Claims Cost 1.903 1.903 45% 1.856 1.856 44%
B. OVERHEAD EXPENSES
1. WSIB Administrative 0.405 0.375
2. Legislative Obligations 0.138 0.131
3. Prevention 0.101 0.584
4. TOTAL OVERHEAD EXPENSES 0.644 0.644 15% 1.090 1.090 26%
C. PAST CLAIMS COST
1. Unfunded Liability 1.347 1.008
2. (Gain)/Loss 0.347 0.295
3. Bad Debts 0.007 N/A
4. TOTAL PAST CLAIMS COST 1.701 1.701 40% 1.303 1.303 31%
D. TOTAL PREMIUM RATE (A+B+C) 4.25 100% 4.25 100%
Section 6H - ©WSIB Ontario 497

2011 PREMIUM RATE COMPONENTS
RATE GROUP 833: ELECTRIC POWER GENERATION
(CLASS H: GOVERNMENT AND RELATED SERVICES)
Component
2011 Premium Rate
Per $100 Of
Insurable Earnings
Percentage
of 2011
Premium Rate
2010 Premium Rate
Per $100 Of
Insurable Earnings
Percentage
of 2010
Premium Rate
A. NEW CLAIMS COST
1. New Claims Cost 0.281 0.281 37% 0.248 0.248 33%
B. OVERHEAD EXPENSES
1. WSIB Administrative 0.152 0.136
2. Legislative Obligations 0.015 0.013
3. Prevention 0.063 0.186
4. TOTAL OVERHEAD EXPENSES 0.230 0.230 30% 0.335 0.335 44%
C. PAST CLAIMS COST
1. Unfunded Liability 0.199 0.135
2. (Gain)/Loss 0.051 0.039
3. Bad Debts 0.001 N/A
4. TOTAL PAST CLAIMS COST 0.251 0.251 33% 0.174 0.174 23%
D. TOTAL PREMIUM RATE (A+B+C) 0.76 100% 0.76 100%
Section 6H - ©WSIB Ontario 498

2011 PREMIUM RATE COMPONENTS
RATE GROUP 835: OIL, POWER AND WATER DISTRIBUTION
(CLASS H: GOVERNMENT AND RELATED SERVICES)
Component
2011 Premium Rate
Per $100 Of
Insurable Earnings
Percentage
of 2011
Premium Rate
2010 Premium Rate
Per $100 Of
Insurable Earnings
Percentage
of 2010
Premium Rate
A. NEW CLAIMS COST
1. New Claims Cost 0.386 0.386 37% 0.348 0.348 34%
B. OVERHEAD EXPENSES
1. WSIB Administrative 0.171 0.155
2. Legislative Obligations 0.058 0.054
3. Prevention 0.066 0.211
4. TOTAL OVERHEAD EXPENSES 0.295 0.295 29% 0.420 0.420 42%
C. PAST CLAIMS COST
1. Unfunded Liability 0.273 0.189
2. (Gain)/Loss 0.070 0.055
3. Bad Debts 0.002 N/A
4. TOTAL PAST CLAIMS COST 0.345 0.345 33% 0.244 0.244 24%
D. TOTAL PREMIUM RATE (A+B+C) 1.03 100% 1.01 100%
Section 6H - ©WSIB Ontario 499

2011 PREMIUM RATE COMPONENTS
RATE GROUP 838: NATURAL GAS DISTRIBUTION
(CLASS H: GOVERNMENT AND RELATED SERVICES)
Component
2011 Premium Rate
Per $100 Of
Insurable Earnings
Percentage
of 2011
Premium Rate
2010 Premium Rate
Per $100 Of
Insurable Earnings
Percentage
of 2010
Premium Rate
A. NEW CLAIMS COST
1. New Claims Cost 0.242 0.242 36% 0.238 0.238 42%
B. OVERHEAD EXPENSES
1. WSIB Administrative 0.108 0.106
2. Legislative Obligations 0.036 0.037
3. Prevention 0.063 0.024
4. TOTAL OVERHEAD EXPENSES 0.207 0.207 31% 0.167 0.167 29%
C. PAST CLAIMS COST
1. Unfunded Liability 0.171 0.129
2. (Gain)/Loss 0.044 0.038
3. Bad Debts 0.001 N/A
4. TOTAL PAST CLAIMS COST 0.216 0.216 32% 0.167 0.167 29%
D. TOTAL PREMIUM RATE (A+B+C) 0.67 100% 0.57 100%
Section 6H - ©WSIB Ontario 500

2011 PREMIUM RATE COMPONENTS
RATE GROUP 845: LOCAL GOVERNMENT SERVICES
(CLASS H: GOVERNMENT AND RELATED SERVICES)
Component
2011 Premium Rate
Per $100 Of
Insurable Earnings
Percentage
of 2011
Premium Rate
2010 Premium Rate
Per $100 Of
Insurable Earnings
Percentage
of 2010
Premium Rate
A. NEW CLAIMS COST
1. New Claims Cost 0.975 0.975 45% 0.875 0.875 47%
B. OVERHEAD EXPENSES
1. WSIB Administrative 0.267 0.253
2. Legislative Obligations 0.091 0.088
3. Prevention 0.023 0.034
4. TOTAL OVERHEAD EXPENSES 0.381 0.381 18% 0.375 0.375 20%
C. PAST CLAIMS COST
1. Unfunded Liability 0.628 0.475
2. (Gain)/Loss 0.162 0.139
3. Bad Debts 0.003 N/A
4. TOTAL PAST CLAIMS COST 0.793 0.793 37% 0.614 0.614 33%
D. TOTAL PREMIUM RATE (A+B+C) 2.15 100% 1.86 100%
Section 6H - ©WSIB Ontario 501

2011 PREMIUM RATE COMPONENTS
RATE GROUP 851: HOMES FOR NURSING CARE
(CLASS H: GOVERNMENT AND RELATED SERVICES)
Component
2011 Premium Rate
Per $100 Of
Insurable Earnings
Percentage
of 2011
Premium Rate
2010 Premium Rate
Per $100 Of
Insurable Earnings
Percentage
of 2010
Premium Rate
A. NEW CLAIMS COST
1. New Claims Cost 1.410 1.410 45% 1.322 1.322 49%
B. OVERHEAD EXPENSES
1. WSIB Administrative 0.338 0.308
2. Legislative Obligations 0.115 0.107
3. Prevention 0.031 0.025
4. TOTAL OVERHEAD EXPENSES 0.484 0.484 15% 0.440 0.440 16%
C. PAST CLAIMS COST
1. Unfunded Liability 0.997 0.718
2. (Gain)/Loss 0.257 0.210
3. Bad Debts 0.004 N/A
4. TOTAL PAST CLAIMS COST 1.258 1.258 40% 0.928 0.928 34%
D. TOTAL PREMIUM RATE (A+B+C) 3.15 100% 2.69 100%
Section 6H - ©WSIB Ontario 502

2011 PREMIUM RATE COMPONENTS
RATE GROUP 852: HOMES FOR RESIDENTIAL CARE
(CLASS H: GOVERNMENT AND RELATED SERVICES)
Component
2011 Premium Rate
Per $100 Of
Insurable Earnings
Percentage
of 2011
Premium Rate
2010 Premium Rate
Per $100 Of
Insurable Earnings
Percentage
of 2010
Premium Rate
A. NEW CLAIMS COST
1. New Claims Cost 1.413 1.413 45% 1.541 1.541 50%
B. OVERHEAD EXPENSES
1. WSIB Administrative 0.338 0.336
2. Legislative Obligations 0.115 0.117
3. Prevention 0.031 0.028
4. TOTAL OVERHEAD EXPENSES 0.484 0.484 15% 0.481 0.481 16%
C. PAST CLAIMS COST
1. Unfunded Liability 1.000 0.837
2. (Gain)/Loss 0.257 0.245
3. Bad Debts 0.005 N/A
4. TOTAL PAST CLAIMS COST 1.262 1.262 40% 1.082 1.082 35%
D. TOTAL PREMIUM RATE (A+B+C) 3.16 100% 3.10 100%
Section 6H - ©WSIB Ontario 503

2011 PREMIUM RATE COMPONENTS
RATE GROUP 853: HOSPITALS*
(CLASS H: GOVERNMENT AND RELATED SERVICES)
Component
2011 Premium Rate
Per $100 Of
Insurable Earnings
Percentage
of 2011
Premium Rate
2010 Premium Rate
Per $100 Of
Insurable Earnings
Percentage
of 2010
Premium Rate
A. NEW CLAIMS COST
1. New Claims Cost 0.418 0.418 39% 0.421 0.421 43%
B. OVERHEAD EXPENSES
1. WSIB Administrative 0.185 0.188
2. Legislative Obligations 0.063 0.065
3. Prevention 0.015 0.013
4. TOTAL OVERHEAD EXPENSES 0.263 0.263 25% 0.266 0.266 27%
C. PAST CLAIMS COST
1. Unfunded Liability 0.296 0.229
2. (Gain)/Loss 0.076 0.067
3. Bad Debts 0.002 N/A
4. TOTAL PAST CLAIMS COST 0.374 0.374 35% 0.296 0.296 30%
D. TOTAL PREMIUM RATE (A+B+C) 1.06 100% 0.98 100%
* Experience for rate groups 853 and 861 has been combined in order to determine a common 2011 premium rate.
Section 6H - ©WSIB Ontario 504

2011 PREMIUM RATE COMPONENTS
RATE GROUP 857: NURSING SERVICES
(CLASS H: GOVERNMENT AND RELATED SERVICES)
Component
2011 Premium Rate
Per $100 Of
Insurable Earnings
Percentage
of 2011
Premium Rate
2010 Premium Rate
Per $100 Of
Insurable Earnings
Percentage
of 2010
Premium Rate
A. NEW CLAIMS COST
1. New Claims Cost 1.416 1.416 45% 1.448 1.448 49%
B. OVERHEAD EXPENSES
1. WSIB Administrative 0.338 0.324
2. Legislative Obligations 0.116 0.113
3. Prevention 0.031 0.027
4. TOTAL OVERHEAD EXPENSES 0.485 0.485 15% 0.464 0.464 16%
C. PAST CLAIMS COST
1. Unfunded Liability 1.001 0.786
2. (Gain)/Loss 0.258 0.230
3. Bad Debts 0.005 N/A
4. TOTAL PAST CLAIMS COST 1.264 1.264 40% 1.016 1.016 35%
D. TOTAL PREMIUM RATE (A+B+C) 3.17 100% 2.93 100%
Section 6H - ©WSIB Ontario 505

2011 PREMIUM RATE COMPONENTS
RATE GROUP 858: GROUP HOMES
(CLASS H: GOVERNMENT AND RELATED SERVICES)
Component
2011 Premium Rate
Per $100 Of
Insurable Earnings
Percentage
of 2011
Premium Rate
2010 Premium Rate
Per $100 Of
Insurable Earnings
Percentage
of 2010
Premium Rate
A. NEW CLAIMS COST
1. New Claims Cost 1.341 1.341 45% 1.467 1.467 50%
B. OVERHEAD EXPENSES
1. WSIB Administrative 0.328 0.326
2. Legislative Obligations 0.112 0.114
3. Prevention 0.030 0.027
4. TOTAL OVERHEAD EXPENSES 0.470 0.470 16% 0.467 0.467 16%
C. PAST CLAIMS COST
1. Unfunded Liability 0.949 0.796
2. (Gain)/Loss 0.244 0.233
3. Bad Debts 0.005 N/A
4. TOTAL PAST CLAIMS COST 1.198 1.198 40% 1.029 1.029 35%
D. TOTAL PREMIUM RATE (A+B+C) 3.01 100% 2.96 100%
Section 6H - ©WSIB Ontario 506

2011 PREMIUM RATE COMPONENTS
RATE GROUP 861: TREATMENT CLINICS AND SPECIALIZED SERVICES*
(CLASS H: GOVERNMENT AND RELATED SERVICES)
Component
2011 Premium Rate
Per $100 Of
Insurable Earnings
Percentage
of 2011
Premium Rate
2010 Premium Rate
Per $100 Of
Insurable Earnings
Percentage
of 2010
Premium Rate
A. NEW CLAIMS COST
1. New Claims Cost 0.418 0.418 39% 0.421 0.421 43%
B. OVERHEAD EXPENSES
1. WSIB Administrative 0.185 0.188
2. Legislative Obligations 0.063 0.065
3. Prevention 0.015 0.013
4. TOTAL OVERHEAD EXPENSES 0.263 0.263 25% 0.266 0.266 27%
C. PAST CLAIMS COST
1. Unfunded Liability 0.296 0.229
2. (Gain)/Loss 0.076 0.067
3. Bad Debts 0.002 N/A
4. TOTAL PAST CLAIMS COST 0.374 0.374 35% 0.296 0.296 30%
D. TOTAL PREMIUM RATE (A+B+C) 1.06 100% 0.98 100%
* Experience for rate groups 853 and 861 has been combined in order to determine a common 2011 premium rate.
Section 6H - ©WSIB Ontario 507

2011 PREMIUM RATE COMPONENTS
RATE GROUP 875: PROFESSIONAL OFFICES AND AGENCIES
(CLASS H: GOVERNMENT AND RELATED SERVICES)
Component
2011 Premium Rate
Per $100 Of
Insurable Earnings
Percentage
of 2011
Premium Rate
2010 Premium Rate
Per $100 Of
Insurable Earnings
Percentage
of 2010
Premium Rate
A. NEW CLAIMS COST
1. New Claims Cost 0.282 0.282 40% 0.299 0.299 43%
B. OVERHEAD EXPENSES
1. WSIB Administrative 0.125 0.133
2. Legislative Obligations 0.042 0.046
3. Prevention 0.013 0.012
4. TOTAL OVERHEAD EXPENSES 0.180 0.180 25% 0.191 0.191 27%
C. PAST CLAIMS COST
1. Unfunded Liability 0.199 0.162
2. (Gain)/Loss 0.051 0.048
3. Bad Debts 0.001 N/A
4. TOTAL PAST CLAIMS COST 0.251 0.251 35% 0.210 0.210 30%
D. TOTAL PREMIUM RATE (A+B+C) 0.71 100% 0.70 100%
Section 6H - ©WSIB Ontario 509

2011 PREMIUM RATE COMPONENTS
CLASS H: GOVERNMENT AND RELATED SERVICES
Component
2011 Premium Rate
Per $100 Of
Insurable Earnings
Percentage
of 2011
Premium Rate
2010 Premium Rate
Per $100 Of
Insurable Earnings
Percentage
of 2010
Premium Rate
A. NEW CLAIMS COST
1. New Claims Cost 0.547 0.547 42% 0.541 0.541 45%
B. OVERHEAD EXPENSES
1. WSIB Administrative 0.186 0.183
2. Legislative Obligations 0.062 0.062
3. Prevention 0.023 0.042
4. TOTAL OVERHEAD EXPENSES 0.271 0.271 21% 0.287 0.287 24%
C. PAST CLAIMS COST
1. Unfunded Liability 0.384 0.294
2. (Gain)/Loss 0.099 0.086
3. Bad Debts 0.002 N/A
4. TOTAL PAST CLAIMS COST 0.485 0.485 37% 0.380 0.380 31%
D. TOTAL PREMIUM RATE (A+B+C) 1.30 100% 1.21 100%
Section 6H - ©WSIB Ontario 510

2011 PREMIUM RATES
Summary of Premium Rate Components by Rate Group
per $100 of Insurable Earnings
New Past 2011
Rate
Group Description
Claims
Cost
($)
Overhead
($)
Claims
Cost
($)
Premium
Rate
($)
810 SCHOOL BOARDS 0.307 0.196 0.274 0.78
817 EDUCATIONAL FACILITIES 0.142 0.095 0.127 0.36
830 POWER AND TELECOMMUNICATION LINES 1.903 0.644 1.701 4.25
833 ELECTRIC POWER GENERATION 0.281 0.230 0.251 0.76
835 OIL, POWER AND WATER DISTRIBUTION 0.386 0.295 0.345 1.03
838 NATURAL GAS DISTRIBUTION 0.242 0.207 0.216 0.67
845 LOCAL GOVERNMENT SERVICES 0.975 0.381 0.793 2.15
851 HOMES FOR NURSING CARE 1.410 0.484 1.258 3.15
852 HOMES FOR RESIDENTIAL CARE 1.413 0.484 1.262 3.16
853 HOSPITALS 0.418 0.263 0.374 1.06
857 NURSING SERVICES 1.416 0.485 1.264 3.17
858 GROUP HOMES 1.341 0.470 1.198 3.01
861 TREATMENT CLINICS AND SPECIALIZED SERVICES 0.418 0.263 0.374 1.06
875 PROFESSIONAL OFFICES AND AGENCIES 0.282 0.180 0.251 0.71
CLASS H GOVERNMENT AND RELATED SERVICES 0.547 0.271 0.485 1.30
Section 6H - ©WSIB Ontario 511

2011Premium Rates M
ANUAL
SECTION 6IClass I – Other Services

2011 PREMIUM RATES
6-YEAR HISTORICAL SUMMARY AND 2-YEAR PROJECTION
RATE GROUP 905: APARTMENT AND CONDOMINIUM SERVICES
(CLASS I: OTHER SERVICES)
Year
Insurable
Earnings
Maximum
Insurable
Earnings
Ceiling
Average
Insurable
Earnings Employment
Total
Number of
Injuries
Total Injury
Rate
2004 $514,286,251 $66,800 $28,567 18,003 723 4.02%
2005 $542,786,948 $67,700 $28,021 19,371 785 4.05%
2006 $580,556,625 $69,400 $29,288 19,822 822 4.15%
2007 $612,491,113 $71,800 $30,734 19,929 920 4.62%
2008 $634,842,770 $73,300 $31,030 20,459 878 4.29%
2009 $643,436,040 $74,600 $30,810 20,884 788 3.77%
2010 $680,462,905 $77,600 $32,328 21,049 780 3.71%
2011 $686,205,964 $79,600 $32,344 21,216 771 3.63%
Section 6I - ©WSIB Ontario 512

2011 PREMIUM RATES
6-YEAR HISTORICAL SUMMARY AND 2-YEAR PROJECTION
RATE GROUP 908: OTHER REAL ESTATE SERVICES
(CLASS I: OTHER SERVICES)
Year
Insurable
Earnings
Maximum
Insurable
Earnings
Ceiling
Average
Insurable
Earnings Employment
Total
Number of
Injuries
Total Injury
Rate
2004 $717,758,688 $66,800 $32,399 22,154 608 2.74%
2005 $738,887,677 $67,700 $32,077 23,035 629 2.73%
2006 $792,688,398 $69,400 $33,571 23,612 615 2.60%
2007 $856,422,235 $71,800 $33,289 25,727 613 2.38%
2008 $922,692,712 $73,300 $33,494 27,548 610 2.21%
2009 $973,514,052 $74,600 $34,636 28,107 528 1.88%
2010 $1,004,296,392 $77,600 $35,451 28,329 502 1.77%
2011 $1,038,224,634 $79,600 $36,360 28,554 476 1.67%
Section 6I - ©WSIB Ontario 513

2011 PREMIUM RATES
6-YEAR HISTORICAL SUMMARY AND 2-YEAR PROJECTION
RATE GROUP 911: SECURITY AND INVESTIGATION SERVICES
(CLASS I: OTHER SERVICES)
Year
Insurable
Earnings
Maximum
Insurable
Earnings
Ceiling
Average
Insurable
Earnings Employment
Total
Number of
Injuries
Total Injury
Rate
2004 $714,648,804 $66,800 $25,351 28,190 1,123 3.98%
2005 $741,577,395 $67,700 $26,594 27,885 1,265 4.54%
2006 $788,695,179 $69,400 $27,926 28,242 1,113 3.94%
2007 $839,735,123 $71,800 $28,907 29,050 1,209 4.16%
2008 $901,198,023 $73,300 $28,369 31,767 1,258 3.96%
2009 $925,711,530 $74,600 $31,490 29,397 1,146 3.90%
2010 $954,982,363 $77,600 $32,231 29,629 1,134 3.83%
2011 $987,244,625 $79,600 $33,057 29,865 1,121 3.75%
Section 6I - ©WSIB Ontario 514

2011 PREMIUM RATES
6-YEAR HISTORICAL SUMMARY AND 2-YEAR PROJECTION
RATE GROUP 919: RESTAURANTS AND CATERING
(CLASS I: OTHER SERVICES)
Year
Insurable
Earnings
Maximum
Insurable
Earnings
Ceiling
Average
Insurable
Earnings Employment
Total
Number of
Injuries
Total Injury
Rate
2004 $4,620,002,136 $66,800 $17,440 264,908 15,423 5.82%
2005 $4,789,607,238 $67,700 $17,902 267,546 15,151 5.66%
2006 $5,066,324,657 $69,400 $19,495 259,878 14,789 5.69%
2007 $5,307,828,391 $71,800 $19,573 271,181 14,234 5.25%
2008 $5,593,458,704 $73,300 $19,736 283,414 14,073 4.97%
2009 $5,646,689,708 $74,600 $19,811 285,028 11,415 4.00%
2010 $5,834,407,308 $77,600 $20,309 287,280 10,843 3.77%
2011 $6,030,924,969 $79,600 $20,807 289,851 10,296 3.55%
Section 6I - ©WSIB Ontario 515

2011 PREMIUM RATES
6-YEAR HISTORICAL SUMMARY AND 2-YEAR PROJECTION
RATE GROUP 921: HOTELS, MOTELS AND CAMPING
(CLASS I: OTHER SERVICES)
Year
Insurable
Earnings
Maximum
Insurable
Earnings
Ceiling
Average
Insurable
Earnings Employment
Total
Number of
Injuries
Total Injury
Rate
2004 $717,567,777 $66,800 $22,454 31,957 1,941 6.07%
2005 $744,547,830 $67,700 $23,279 31,984 2,091 6.54%
2006 $795,284,780 $69,400 $23,298 34,135 2,158 6.32%
2007 $833,963,138 $71,800 $24,994 33,367 2,098 6.29%
2008 $872,022,576 $73,300 $25,462 34,248 1,949 5.69%
2009 $871,078,995 $74,600 $25,407 34,285 1,785 5.21%
2010 $900,036,998 $77,600 $26,046 34,556 1,767 5.11%
2011 $930,352,531 $79,600 $26,684 34,865 1,748 5.01%
Section 6I - ©WSIB Ontario 516

2011 PREMIUM RATES
6-YEAR HISTORICAL SUMMARY AND 2-YEAR PROJECTION
RATE GROUP 923: JANITORIAL SERVICES
(CLASS I: OTHER SERVICES)
Year
Insurable
Earnings
Maximum
Insurable
Earnings
Ceiling
Average
Insurable
Earnings Employment
Total
Number of
Injuries
Total Injury
Rate
2004 $681,695,714 $66,800 $19,879 34,292 1,808 5.27%
2005 $739,839,135 $67,700 $21,509 34,397 1,967 5.72%
2006 $806,078,059 $69,400 $21,738 37,082 1,861 5.02%
2007 $862,492,532 $71,800 $22,281 38,710 1,941 5.01%
2008 $923,033,415 $73,300 $23,811 38,765 1,984 5.12%
2009 $959,644,511 $74,600 $24,617 38,983 1,709 4.38%
2010 $1,014,867,757 $77,600 $25,830 39,291 1,657 4.22%
2011 $1,023,433,169 $79,600 $25,842 39,603 1,605 4.05%
Section 6I - ©WSIB Ontario 517

2011 PREMIUM RATES
6-YEAR HISTORICAL SUMMARY AND 2-YEAR PROJECTION
RATE GROUP 929: SUPPLY OF NON-CLERICAL LABOUR
(CLASS I: OTHER SERVICES)
Year
Insurable
Earnings
Maximum
Insurable
Earnings
Ceiling
Average
Insurable
Earnings Employment
Total
Number of
Injuries
Total Injury
Rate
2004 $880,029,842 $66,800 $19,637 44,815 5,672 12.66%
2005 $955,169,306 $67,700 $20,385 46,856 5,688 12.14%
2006 $1,023,297,623 $69,400 $21,354 47,921 5,188 10.83%
2007 $1,040,443,549 $71,800 $22,597 46,043 4,803 10.43%
2008 $1,000,268,352 $73,300 $22,608 44,244 3,968 8.97%
2009 $790,302,240 $74,600 $23,088 34,230 2,309 6.75%
2010 $816,574,914 $77,600 $23,669 34,500 2,101 6.09%
2011 $844,079,232 $79,600 $24,249 34,809 1,911 5.49%
Section 6I - ©WSIB Ontario 518

2011 PREMIUM RATES
6-YEAR HISTORICAL SUMMARY AND 2-YEAR PROJECTION
RATE GROUP 933: EQUIPMENT RENTAL AND REPAIR SERVICES
(CLASS I: OTHER SERVICES)
Year
Insurable
Earnings
Maximum
Insurable
Earnings
Ceiling
Average
Insurable
Earnings Employment
Total
Number of
Injuries
Total Injury
Rate
2004 $376,387,831 $66,800 $29,431 12,789 1,008 7.88%
2005 $381,502,021 $67,700 $30,406 12,547 887 7.07%
2006 $384,666,736 $69,400 $30,619 12,563 825 6.57%
2007 $394,077,996 $71,800 $30,988 12,717 854 6.72%
2008 $394,081,377 $73,300 $30,363 12,979 853 6.57%
2009 $369,894,945 $74,600 $29,905 12,369 551 4.45%
2010 $382,191,670 $77,600 $30,656 12,467 523 4.20%
2011 $395,064,856 $79,600 $31,407 12,579 497 3.95%
Section 6I - ©WSIB Ontario 519

2011 PREMIUM RATES
6-YEAR HISTORICAL SUMMARY AND 2-YEAR PROJECTION
RATE GROUP 937: RECREATIONAL SERVICES AND FACILITIES
(CLASS I: OTHER SERVICES)
Year
Insurable
Earnings
Maximum
Insurable
Earnings
Ceiling
Average
Insurable
Earnings Employment
Total
Number of
Injuries
Total Injury
Rate
2004 $887,694,859 $66,800 $26,158 33,936 1,740 5.13%
2005 $911,052,795 $67,700 $28,015 32,520 1,778 5.47%
2006 $913,793,441 $69,400 $26,643 34,298 1,672 4.87%
2007 $911,875,311 $71,800 $27,318 33,380 1,549 4.64%
2008 $918,292,312 $73,300 $27,748 33,094 1,536 4.64%
2009 $912,299,584 $74,600 $27,334 33,376 1,359 4.07%
2010 $942,627,917 $77,600 $28,021 33,640 1,291 3.84%
2011 $974,378,020 $79,600 $28,708 33,941 1,226 3.61%
Section 6I - ©WSIB Ontario 520

2011 PREMIUM RATES
6-YEAR HISTORICAL SUMMARY AND 2-YEAR PROJECTION
RATE GROUP 944: PERSONAL SERVICES
(CLASS I: OTHER SERVICES)
Year
Insurable
Earnings
Maximum
Insurable
Earnings
Ceiling
Average
Insurable
Earnings Employment
Total
Number of
Injuries
Total Injury
Rate
2004 $300,590,515 $66,800 $21,359 14,073 545 3.87%
2005 $316,442,313 $67,700 $21,226 14,908 623 4.18%
2006 $334,322,853 $69,400 $23,214 14,402 523 3.63%
2007 $347,653,796 $71,800 $22,351 15,554 522 3.36%
2008 $367,908,882 $73,300 $22,957 16,026 622 3.88%
2009 $376,807,969 $74,600 $22,739 16,571 480 2.90%
2010 $389,334,510 $77,600 $23,311 16,702 475 2.84%
2011 $402,448,285 $79,600 $23,883 16,851 470 2.79%
Section 6I - ©WSIB Ontario 521

2011 PREMIUM RATES
6-YEAR HISTORICAL SUMMARY AND 2-YEAR PROJECTION
RATE GROUP 956: LEGAL AND FINANCIAL SERVICES
(CLASS I: OTHER SERVICES)
Year
Insurable
Earnings
Maximum
Insurable
Earnings
Ceiling
Average
Insurable
Earnings Employment
Total
Number of
Injuries
Total Injury
Rate
2004 $3,319,618,143 $66,800 $29,046 114,288 379 0.33%
2005 $3,566,385,057 $67,700 $29,479 120,981 437 0.36%
2006 $3,843,514,615 $69,400 $30,010 128,074 409 0.32%
2007 $4,059,282,462 $71,800 $30,901 131,364 413 0.31%
2008 $4,232,376,220 $73,300 $37,006 114,370 407 0.36%
2009 $3,868,294,584 $74,600 $35,304 109,571 354 0.32%
2010 $3,974,908,614 $77,600 $35,993 110,437 350 0.32%
2011 $4,131,516,978 $79,600 $37,079 111,425 347 0.31%
Section 6I - ©WSIB Ontario 522

2011 PREMIUM RATES
6-YEAR HISTORICAL SUMMARY AND 2-YEAR PROJECTION
RATE GROUP 958: TECHNICAL AND BUSINESS SERVICES
(CLASS I: OTHER SERVICES)
Year
Insurable
Earnings
Maximum
Insurable
Earnings
Ceiling
Average
Insurable
Earnings Employment
Total
Number of
Injuries
Total Injury
Rate
2004 $6,097,862,359 $66,800 $32,230 189,198 1,667 0.88%
2005 $6,424,123,029 $67,700 $33,102 194,071 1,885 0.97%
2006 $6,884,782,836 $69,400 $32,541 211,573 1,779 0.84%
2007 $7,507,169,871 $71,800 $32,832 228,654 2,049 0.90%
2008 $8,029,859,184 $73,300 $34,992 229,477 1,945 0.85%
2009 $8,027,735,729 $74,600 $35,191 228,119 1,458 0.64%
2010 $8,281,571,298 $77,600 $36,019 229,921 1,443 0.63%
2011 $8,561,348,425 $79,600 $36,942 231,749 1,427 0.62%
Section 6I - ©WSIB Ontario 523

2011 PREMIUM RATES
6-YEAR HISTORICAL SUMMARY AND 2-YEAR PROJECTION
RATE GROUP 962: ADVERTISING AND ENTERTAINMENT
(CLASS I: OTHER SERVICES)
Year
Insurable
Earnings
Maximum
Insurable
Earnings
Ceiling
Average
Insurable
Earnings Employment
Total
Number of
Injuries
Total Injury
Rate
2004 $862,226,896 $66,800 $34,045 25,326 652 2.57%
2005 $936,776,336 $67,700 $37,530 24,961 652 2.61%
2006 $931,583,262 $69,400 $32,179 28,950 611 2.11%
2007 $969,855,228 $71,800 $37,091 26,148 644 2.46%
2008 $928,693,350 $73,300 $35,278 26,325 585 2.22%
2009 $1,002,525,300 $74,600 $38,100 26,313 576 2.19%
2010 $1,035,853,082 $77,600 $39,058 26,521 547 2.06%
2011 $1,070,743,246 $79,600 $40,016 26,758 520 1.94%
Section 6I - ©WSIB Ontario 524

2011 PREMIUM RATES
6-YEAR HISTORICAL SUMMARY AND 2-YEAR PROJECTION
RATE GROUP 975: LINEN AND LAUNDRY SERVICES
(CLASS I: OTHER SERVICES)
Year
Insurable
Earnings
Maximum
Insurable
Earnings
Ceiling
Average
Insurable
Earnings Employment
Total
Number of
Injuries
Total Injury
Rate
2004 $245,578,967 $66,800 $28,378 8,654 651 7.52%
2005 $254,483,607 $67,700 $28,889 8,809 640 7.27%
2006 $263,009,273 $69,400 $29,708 8,853 652 7.36%
2007 $266,001,623 $71,800 $31,682 8,396 625 7.44%
2008 $265,519,820 $73,300 $30,460 8,717 649 7.45%
2009 $260,800,596 $74,600 $32,004 8,149 556 6.82%
2010 $270,535,007 $77,600 $32,940 8,213 550 6.70%
2011 $278,136,308 $79,600 $33,599 8,278 544 6.57%
Section 6I - ©WSIB Ontario 525

2011 PREMIUM RATES
6-YEAR HISTORICAL SUMMARY AND 2-YEAR PROJECTION
RATE GROUP 981: MEMBERSHIP ORGANIZATIONS
(CLASS I: OTHER SERVICES)
Year
Insurable
Earnings
Maximum
Insurable
Earnings
Ceiling
Average
Insurable
Earnings Employment
Total
Number of
Injuries
Total Injury
Rate
2004 $810,548,138 $66,800 $30,682 26,418 411 1.56%
2005 $832,033,169 $67,700 $30,566 27,221 385 1.41%
2006 $877,913,514 $69,400 $31,093 28,235 383 1.36%
2007 $934,932,561 $71,800 $33,689 27,752 406 1.46%
2008 $992,018,880 $73,300 $32,832 30,215 391 1.29%
2009 $1,039,549,644 $74,600 $34,234 30,366 369 1.22%
2010 $1,074,108,257 $77,600 $35,095 30,606 351 1.15%
2011 $1,110,286,952 $79,600 $35,955 30,880 333 1.08%
Section 6I - ©WSIB Ontario 526

2011 PREMIUM RATES
6-YEAR HISTORICAL SUMMARY AND 2-YEAR PROJECTION
RATE GROUP 983: COMMUNICATIONS INDUSTRIES
(CLASS I: OTHER SERVICES)
Year
Insurable
Earnings
Maximum
Insurable
Earnings
Ceiling
Average
Insurable
Earnings Employment
Total
Number of
Injuries
Total Injury
Rate
2004 $1,155,905,150 $66,800 $42,565 27,156 208 0.77%
2005 $1,243,090,775 $67,700 $42,678 29,127 281 0.96%
2006 $1,355,537,733 $69,400 $43,170 31,400 274 0.87%
2007 $1,533,312,724 $71,800 $44,280 34,628 256 0.74%
2008 $1,653,437,801 $73,300 $44,771 36,931 280 0.76%
2009 $1,730,656,468 $74,600 $46,796 36,983 267 0.72%
2010 $1,795,328,770 $77,600 $47,927 37,460 255 0.68%
2011 $1,820,779,665 $79,600 $48,080 37,870 242 0.64%
Section 6I - ©WSIB Ontario 527

2011 PREMIUM RATES
6-YEAR HISTORICAL SUMMARY AND 2-YEAR PROJECTION
CLASS I: OTHER SERVICES
Year
Insurable
Earnings
Maximum
Insurable
Earnings
Ceiling
Average
Insurable
Earnings Employment
Total
Number of
Injuries
Total Injury
Rate
2004 $22,902,402,070 $66,800 $25,556 896,157 34,559 3.86%
2005 $24,118,304,631 $67,700 $26,324 916,219 35,144 3.84%
2006 $25,642,049,584 $69,400 $27,019 949,040 33,674 3.55%
2007 $27,277,537,653 $71,800 $27,761 982,600 33,136 3.37%
2008 $28,629,704,378 $73,300 $28,960 988,579 31,988 3.24%
2009 $28,398,941,895 $74,600 $29,195 972,731 25,650 2.64%
2010 $29,352,087,762 $77,600 $29,933 980,601 24,569 2.51%
2011 $30,285,167,859 $79,600 $30,619 989,094 23,534 2.38%
Section 6I - ©WSIB Ontario 528

2011 PREMIUM RATESNEW CLAIMS COST BY RATE GROUP
2011 New Claims Cost 2011
Rate
Group Description Cost Index *
(%)
Cost per Claim
($)
Premium
Rate
($)
905 APARTMENT AND CONDOMINIUM SERVICES 174% 11,520 2.91
908 OTHER REAL ESTATE SERVICES 162% 10,766 1.25
911 SECURITY AND INVESTIGATION SERVICES 92% 6,124 1.67
919 RESTAURANTS AND CATERING 60% 3,997 1.65
921 HOTELS, MOTELS AND CAMPING 106% 7,046 2.97
923 JANITORIAL SERVICES 155% 10,258 3.57
929 SUPPLY OF NON-CLERICAL LABOUR 147% 9,771 4.83
933 EQUIPMENT RENTAL AND REPAIR SERVICES 157% 10,393 2.95
937 RECREATIONAL SERVICES AND FACILITIES 108% 7,185 2.10
944 PERSONAL SERVICES 180% 11,914 3.12
956 LEGAL AND FINANCIAL SERVICES 138% 9,176 0.21
958 TECHNICAL AND BUSINESS SERVICES 131% 8,712 0.38
962 ADVERTISING AND ENTERTAINMENT 128% 8,496 1.05
975 LINEN AND LAUNDRY SERVICES 138% 9,164 3.94
981 MEMBERSHIP ORGANIZATIONS 152% 10,056 0.77
983 COMMUNICATIONS INDUSTRIES 169% 11,195 0.37
CLASS I OTHER SERVICES 6,804 1.25
* The Cost Index compares the average cost of a claim for a Rate Group to that of the Class.Section 6I - ©WSIB Ontario 529

2011 PREMIUM RATES
SUB-COMPONENTS OF OVERHEAD EXPENSES
RATE GROUP 905: APARTMENT AND CONDOMINIUM SERVICES
(CLASS I: OTHER SERVICES)
Overhead Expenses
Component
Overhead Expenses
Sub-Component
Premium Rate
Component
B.1 WSIB Administrative 0.332
B.2 Legislative Obligations
WSIAT 0.017
Office of Worker Advisor 0.008
Office of Employer Advisor 0.003
OHSA 0.081
Mine Rescue 0.000
Construction Certification Training 0.000
Program Administration 0.000
Institute of Work & Health 0.003
Sub-Total 0.113
B.3 Prevention Workplace Safety and
Prevention Services
0.048
B.4 TOTAL OVERHEAD EXPENSES 0.493
Section 6I - ©WSIB Ontario 530

2011 PREMIUM RATES
SUB-COMPONENTS OF OVERHEAD EXPENSES
RATE GROUP 908: OTHER REAL ESTATE SERVICES
(CLASS I: OTHER SERVICES)
Overhead Expenses
Component
Overhead Expenses
Sub-Component
Premium Rate
Component
B.1 WSIB Administrative 0.218
B.2 Legislative Obligations
WSIAT 0.011
Office of Worker Advisor 0.005
Office of Employer Advisor 0.002
OHSA 0.053
Mine Rescue 0.000
Construction Certification Training 0.000
Program Administration 0.000
Institute of Work & Health 0.002
Sub-Total 0.074
B.3 Prevention Workplace Safety and
Prevention Services
0.029
B.4 TOTAL OVERHEAD EXPENSES 0.321
Section 6I - ©WSIB Ontario 531

2011 PREMIUM RATES
SUB-COMPONENTS OF OVERHEAD EXPENSES
RATE GROUP 911: SECURITY AND INVESTIGATION SERVICES
(CLASS I: OTHER SERVICES)
Overhead Expenses
Component
Overhead Expenses
Sub-Component
Premium Rate
Component
B.1 WSIB Administrative 0.246
B.2 Legislative Obligations
WSIAT 0.013
Office of Worker Advisor 0.006
Office of Employer Advisor 0.002
OHSA 0.060
Mine Rescue 0.000
Construction Certification Training 0.000
Program Administration 0.000
Institute of Work & Health 0.002
Sub-Total 0.084
B.3 Prevention Workplace Safety and
Prevention Services
0.034
B.4 TOTAL OVERHEAD EXPENSES 0.364
Section 6I - ©WSIB Ontario 532

2011 PREMIUM RATES
SUB-COMPONENTS OF OVERHEAD EXPENSES
RATE GROUP 919: RESTAURANTS AND CATERING
(CLASS I: OTHER SERVICES)
Overhead Expenses
Component
Overhead Expenses
Sub-Component
Premium Rate
Component
B.1 WSIB Administrative 0.245
B.2 Legislative Obligations
WSIAT 0.013
Office of Worker Advisor 0.006
Office of Employer Advisor 0.002
OHSA 0.060
Mine Rescue 0.000
Construction Certification Training 0.000
Program Administration 0.000
Institute of Work & Health 0.002
Sub-Total 0.083
B.3 Prevention Workplace Safety and
Prevention Services
0.034
B.4 TOTAL OVERHEAD EXPENSES 0.362
Section 6I - ©WSIB Ontario 533

2011 PREMIUM RATES
SUB-COMPONENTS OF OVERHEAD EXPENSES
RATE GROUP 921: HOTELS, MOTELS AND CAMPING
(CLASS I: OTHER SERVICES)
Overhead Expenses
Component
Overhead Expenses
Sub-Component
Premium Rate
Component
B.1 WSIB Administrative 0.337
B.2 Legislative Obligations
WSIAT 0.017
Office of Worker Advisor 0.008
Office of Employer Advisor 0.003
OHSA 0.082
Mine Rescue 0.000
Construction Certification Training 0.000
Program Administration 0.000
Institute of Work & Health 0.003
Sub-Total 0.115
B.3 Prevention Workplace Safety and
Prevention Services
0.049
B.4 TOTAL OVERHEAD EXPENSES 0.501
Section 6I - ©WSIB Ontario 534

2011 PREMIUM RATES
SUB-COMPONENTS OF OVERHEAD EXPENSES
RATE GROUP 923: JANITORIAL SERVICES
(CLASS I: OTHER SERVICES)
Overhead Expenses
Component
Overhead Expenses
Sub-Component
Premium Rate
Component
B.1 WSIB Administrative 0.378
B.2 Legislative Obligations
WSIAT 0.020
Office of Worker Advisor 0.010
Office of Employer Advisor 0.003
OHSA 0.093
Mine Rescue 0.000
Construction Certification Training 0.000
Program Administration 0.001
Institute of Work & Health 0.004
Sub-Total 0.129
B.3 Prevention Workplace Safety and
Prevention Services
0.055
B.4 TOTAL OVERHEAD EXPENSES 0.562
Section 6I - ©WSIB Ontario 535

2011 PREMIUM RATES
SUB-COMPONENTS OF OVERHEAD EXPENSES
RATE GROUP 929: SUPPLY OF NON-CLERICAL LABOUR
(CLASS I: OTHER SERVICES)
Overhead Expenses
Component
Overhead Expenses
Sub-Component
Premium Rate
Component
B.1 WSIB Administrative 0.465
B.2 Legislative Obligations
WSIAT 0.024
Office of Worker Advisor 0.012
Office of Employer Advisor 0.004
OHSA 0.114
Mine Rescue 0.000
Construction Certification Training 0.000
Program Administration 0.001
Institute of Work & Health 0.005
Sub-Total 0.159
B.3 Prevention Workplace Safety and
Prevention Services
0.069
B.4 TOTAL OVERHEAD EXPENSES 0.693
Section 6I - ©WSIB Ontario 536

2011 PREMIUM RATES
SUB-COMPONENTS OF OVERHEAD EXPENSES
RATE GROUP 933: EQUIPMENT RENTAL AND REPAIR SERVICES
(CLASS I: OTHER SERVICES)
Overhead Expenses
Component
Overhead Expenses
Sub-Component
Premium Rate
Component
B.1 WSIB Administrative 0.335
B.2 Legislative Obligations
WSIAT 0.017
Office of Worker Advisor 0.008
Office of Employer Advisor 0.003
OHSA 0.082
Mine Rescue 0.000
Construction Certification Training 0.000
Program Administration 0.000
Institute of Work & Health 0.003
Sub-Total 0.114
B.3 Prevention Workplace Safety and
Prevention Services
0.048
B.4 TOTAL OVERHEAD EXPENSES 0.497
Section 6I - ©WSIB Ontario 537

2011 PREMIUM RATES
SUB-COMPONENTS OF OVERHEAD EXPENSES
RATE GROUP 937: RECREATIONAL SERVICES AND FACILITIES
(CLASS I: OTHER SERVICES)
Overhead Expenses
Component
Overhead Expenses
Sub-Component
Premium Rate
Component
B.1 WSIB Administrative 0.276
B.2 Legislative Obligations
WSIAT 0.014
Office of Worker Advisor 0.007
Office of Employer Advisor 0.002
OHSA 0.067
Mine Rescue 0.000
Construction Certification Training 0.000
Program Administration 0.000
Institute of Work & Health 0.003
Sub-Total 0.094
B.3 Prevention Workplace Safety and
Prevention Services
0.039
B.4 TOTAL OVERHEAD EXPENSES 0.409
Section 6I - ©WSIB Ontario 538

2011 PREMIUM RATES
SUB-COMPONENTS OF OVERHEAD EXPENSES
RATE GROUP 944: PERSONAL SERVICES
(CLASS I: OTHER SERVICES)
Overhead Expenses
Component
Overhead Expenses
Sub-Component
Premium Rate
Component
B.1 WSIB Administrative 0.347
B.2 Legislative Obligations
WSIAT 0.018
Office of Worker Advisor 0.009
Office of Employer Advisor 0.003
OHSA 0.085
Mine Rescue 0.000
Construction Certification Training 0.000
Program Administration 0.000
Institute of Work & Health 0.003
Sub-Total 0.118
B.3 Prevention Workplace Safety and
Prevention Services
0.050
B.4 TOTAL OVERHEAD EXPENSES 0.515
Section 6I - ©WSIB Ontario 539

2011 PREMIUM RATES
SUB-COMPONENTS OF OVERHEAD EXPENSES
RATE GROUP 956: LEGAL AND FINANCIAL SERVICES
(CLASS I: OTHER SERVICES)
Overhead Expenses
Component
Overhead Expenses
Sub-Component
Premium Rate
Component
B.1 WSIB Administrative 0.035
B.2 Legislative Obligations
WSIAT 0.002
Office of Worker Advisor 0.001
Office of Employer Advisor 0.000
OHSA 0.008
Mine Rescue 0.000
Construction Certification Training 0.000
Program Administration 0.000
Institute of Work & Health 0.000
Sub-Total 0.012
B.3 Prevention Workplace Safety and
Prevention Services
0.020
B.4 TOTAL OVERHEAD EXPENSES 0.067
Section 6I - ©WSIB Ontario 540

2011 PREMIUM RATES
SUB-COMPONENTS OF OVERHEAD EXPENSES
RATE GROUP 958: TECHNICAL AND BUSINESS SERVICES
(CLASS I: OTHER SERVICES)
Overhead Expenses
Component
Overhead Expenses
Sub-Component
Premium Rate
Component
B.1 WSIB Administrative 0.066
B.2 Legislative Obligations
WSIAT 0.003
Office of Worker Advisor 0.002
Office of Employer Advisor 0.001
OHSA 0.016
Mine Rescue 0.000
Construction Certification Training 0.000
Program Administration 0.000
Institute of Work & Health 0.001
Sub-Total 0.022
B.3 Prevention Workplace Safety and
Prevention Services
0.021
B.4 TOTAL OVERHEAD EXPENSES 0.109
Section 6I - ©WSIB Ontario 541

2011 PREMIUM RATES
SUB-COMPONENTS OF OVERHEAD EXPENSES
RATE GROUP 962: ADVERTISING AND ENTERTAINMENT
(CLASS I: OTHER SERVICES)
Overhead Expenses
Component
Overhead Expenses
Sub-Component
Premium Rate
Component
B.1 WSIB Administrative 0.188
B.2 Legislative Obligations
WSIAT 0.010
Office of Worker Advisor 0.005
Office of Employer Advisor 0.002
OHSA 0.046
Mine Rescue 0.000
Construction Certification Training 0.000
Program Administration 0.000
Institute of Work & Health 0.002
Sub-Total 0.064
B.3 Prevention Workplace Safety and
Prevention Services
0.027
B.4 TOTAL OVERHEAD EXPENSES 0.279
Section 6I - ©WSIB Ontario 542

2011 PREMIUM RATES
SUB-COMPONENTS OF OVERHEAD EXPENSES
RATE GROUP 975: LINEN AND LAUNDRY SERVICES
(CLASS I: OTHER SERVICES)
Overhead Expenses
Component
Overhead Expenses
Sub-Component
Premium Rate
Component
B.1 WSIB Administrative 0.403
B.2 Legislative Obligations
WSIAT 0.021
Office of Worker Advisor 0.010
Office of Employer Advisor 0.003
OHSA 0.099
Mine Rescue 0.000
Construction Certification Training 0.000
Program Administration 0.001
Institute of Work & Health 0.004
Sub-Total 0.138
B.3 Prevention Workplace Safety and
Prevention Services
0.059
B.4 TOTAL OVERHEAD EXPENSES 0.600
Section 6I - ©WSIB Ontario 543

2011 PREMIUM RATES
SUB-COMPONENTS OF OVERHEAD EXPENSES
RATE GROUP 981: MEMBERSHIP ORGANIZATIONS
(CLASS I: OTHER SERVICES)
Overhead Expenses
Component
Overhead Expenses
Sub-Component
Premium Rate
Component
B.1 WSIB Administrative 0.137
B.2 Legislative Obligations
WSIAT 0.007
Office of Worker Advisor 0.003
Office of Employer Advisor 0.001
OHSA 0.033
Mine Rescue 0.000
Construction Certification Training 0.000
Program Administration 0.000
Institute of Work & Health 0.001
Sub-Total 0.046
B.3 Prevention Workplace Safety and
Prevention Services
0.025
B.4 TOTAL OVERHEAD EXPENSES 0.208
Section 6I - ©WSIB Ontario 544

2011 PREMIUM RATES
SUB-COMPONENTS OF OVERHEAD EXPENSES
RATE GROUP 983: COMMUNICATIONS INDUSTRIES
(CLASS I: OTHER SERVICES)
Overhead Expenses
Component
Overhead Expenses
Sub-Component
Premium Rate
Component
B.1 WSIB Administrative 0.083
B.2 Legislative Obligations
WSIAT 0.004
Office of Worker Advisor 0.002
Office of Employer Advisor 0.001
OHSA 0.000
Mine Rescue 0.000
Construction Certification Training 0.000
Program Administration 0.000
Institute of Work & Health 0.001
Sub-Total 0.008
B.3 Prevention Workplace Safety and
Prevention Services
0.000
B.4 TOTAL OVERHEAD EXPENSES 0.091
Section 6I - ©WSIB Ontario 545

2011 PREMIUM RATES
SUB-COMPONENTS OF OVERHEAD EXPENSES
CLASS I: OTHER SERVICES
Overhead Expenses
Component
Overhead Expenses
Sub-Component
Premium Rate
Component
B.1 WSIB Administrative 0.170
B.2 Legislative Obligations
WSIAT 0.009
Office of Worker Advisor 0.004
Office of Employer Advisor 0.001
OHSA 0.040
Mine Rescue 0.000
Construction Certification Training 0.000
Program Administration 0.000
Institute of Work & Health 0.002
Sub-Total 0.056
B.3 Prevention 0.029
B.4 TOTAL OVERHEAD EXPENSES 0.255
Section 6I - ©WSIB Ontario 546

2011 PREMIUM RATE COMPONENTS
RATE GROUP 905: APARTMENT AND CONDOMINIUM SERVICES
(CLASS I: OTHER SERVICES)
Component
2011 Premium Rate
Per $100 Of
Insurable Earnings
Percentage
of 2011
Premium Rate
2010 Premium Rate
Per $100 Of
Insurable Earnings
Percentage
of 2010
Premium Rate
A. NEW CLAIMS COST
1. New Claims Cost 1.314 1.314 45% 1.337 1.337 51%
B. OVERHEAD EXPENSES
1. WSIB Administrative 0.332 0.310
2. Legislative Obligations 0.113 0.108
3. Prevention 0.048 0.047
4. TOTAL OVERHEAD EXPENSES 0.493 0.493 17% 0.465 0.465 18%
C. PAST CLAIMS COST
1. Unfunded Liability 0.969 0.726
2. (Gain)/Loss 0.085 0.069
3. Bad Debts 0.048 N/A
4. TOTAL PAST CLAIMS COST 1.102 1.102 38% 0.795 0.795 31%
D. TOTAL PREMIUM RATE (A+B+C) 2.91 100% 2.60 100%
Section 6I - ©WSIB Ontario 547

2011 PREMIUM RATE COMPONENTS
RATE GROUP 908: OTHER REAL ESTATE SERVICES
(CLASS I: OTHER SERVICES)
Component
2011 Premium Rate
Per $100 Of
Insurable Earnings
Percentage
of 2011
Premium Rate
2010 Premium Rate
Per $100 Of
Insurable Earnings
Percentage
of 2010
Premium Rate
A. NEW CLAIMS COST
1. New Claims Cost 0.501 0.501 40% 0.580 0.580 46%
B. OVERHEAD EXPENSES
1. WSIB Administrative 0.218 0.216
2. Legislative Obligations 0.074 0.075
3. Prevention 0.029 0.031
4. TOTAL OVERHEAD EXPENSES 0.321 0.321 26% 0.322 0.322 26%
C. PAST CLAIMS COST
1. Unfunded Liability 0.373 0.315
2. (Gain)/Loss 0.033 0.030
3. Bad Debts 0.023 N/A
4. TOTAL PAST CLAIMS COST 0.429 0.429 34% 0.345 0.345 28%
D. TOTAL PREMIUM RATE (A+B+C) 1.25 100% 1.25 100%
Section 6I - ©WSIB Ontario 548

2011 PREMIUM RATE COMPONENTS
RATE GROUP 911: SECURITY AND INVESTIGATION SERVICES
(CLASS I: OTHER SERVICES)
Component
2011 Premium Rate
Per $100 Of
Insurable Earnings
Percentage
of 2011
Premium Rate
2010 Premium Rate
Per $100 Of
Insurable Earnings
Percentage
of 2010
Premium Rate
A. NEW CLAIMS COST
1. New Claims Cost 0.706 0.706 42% 0.746 0.746 48%
B. OVERHEAD EXPENSES
1. WSIB Administrative 0.246 0.237
2. Legislative Obligations 0.084 0.082
3. Prevention 0.034 0.035
4. TOTAL OVERHEAD EXPENSES 0.364 0.364 22% 0.354 0.354 23%
C. PAST CLAIMS COST
1. Unfunded Liability 0.523 0.405
2. (Gain)/Loss 0.046 0.038
3. Bad Debts 0.029 N/A
4. TOTAL PAST CLAIMS COST 0.598 0.598 36% 0.443 0.443 29%
D. TOTAL PREMIUM RATE (A+B+C) 1.67 100% 1.54 100%
Section 6I - ©WSIB Ontario 549

2011 PREMIUM RATE COMPONENTS
RATE GROUP 919: RESTAURANTS AND CATERING
(CLASS I: OTHER SERVICES)
Component
2011 Premium Rate
Per $100 Of
Insurable Earnings
Percentage
of 2011
Premium Rate
2010 Premium Rate
Per $100 Of
Insurable Earnings
Percentage
of 2010
Premium Rate
A. NEW CLAIMS COST
1. New Claims Cost 0.693 0.693 42% 0.815 0.815 49%
B. OVERHEAD EXPENSES
1. WSIB Administrative 0.245 0.245
2. Legislative Obligations 0.083 0.085
3. Prevention 0.034 0.023
4. TOTAL OVERHEAD EXPENSES 0.362 0.362 22% 0.353 0.353 21%
C. PAST CLAIMS COST
1. Unfunded Liability 0.515 0.443
2. (Gain)/Loss 0.045 0.042
3. Bad Debts 0.031 N/A
4. TOTAL PAST CLAIMS COST 0.591 0.591 36% 0.485 0.485 29%
D. TOTAL PREMIUM RATE (A+B+C) 1.65 100% 1.65 100%
Section 6I - ©WSIB Ontario 550

2011 PREMIUM RATE COMPONENTS
RATE GROUP 921: HOTELS, MOTELS AND CAMPING
(CLASS I: OTHER SERVICES)
Component
2011 Premium Rate
Per $100 Of
Insurable Earnings
Percentage
of 2011
Premium Rate
2010 Premium Rate
Per $100 Of
Insurable Earnings
Percentage
of 2010
Premium Rate
A. NEW CLAIMS COST
1. New Claims Cost 1.344 1.344 45% 1.391 1.391 52%
B. OVERHEAD EXPENSES
1. WSIB Administrative 0.337 0.317
2. Legislative Obligations 0.115 0.110
3. Prevention 0.049 0.031
4. TOTAL OVERHEAD EXPENSES 0.501 0.501 17% 0.458 0.458 17%
C. PAST CLAIMS COST
1. Unfunded Liability 0.992 0.755
2. (Gain)/Loss 0.087 0.072
3. Bad Debts 0.050 N/A
4. TOTAL PAST CLAIMS COST 1.129 1.129 38% 0.827 0.827 31%
D. TOTAL PREMIUM RATE (A+B+C) 2.97 100% 2.68 100%
Section 6I - ©WSIB Ontario 551

2011 PREMIUM RATE COMPONENTS
RATE GROUP 923: JANITORIAL SERVICES
(CLASS I: OTHER SERVICES)
Component
2011 Premium Rate
Per $100 Of
Insurable Earnings
Percentage
of 2011
Premium Rate
2010 Premium Rate
Per $100 Of
Insurable Earnings
Percentage
of 2010
Premium Rate
A. NEW CLAIMS COST
1. New Claims Cost 1.633 1.633 46% 1.790 1.790 52%
B. OVERHEAD EXPENSES
1. WSIB Administrative 0.378 0.367
2. Legislative Obligations 0.129 0.128
3. Prevention 0.055 0.056
4. TOTAL OVERHEAD EXPENSES 0.562 0.562 16% 0.551 0.551 16%
C. PAST CLAIMS COST
1. Unfunded Liability 1.207 0.972
2. (Gain)/Loss 0.106 0.092
3. Bad Debts 0.063 N/A
4. TOTAL PAST CLAIMS COST 1.376 1.376 39% 1.064 1.064 31%
D. TOTAL PREMIUM RATE (A+B+C) 3.57 100% 3.41 100%
Section 6I - ©WSIB Ontario 552

2011 PREMIUM RATE COMPONENTS
RATE GROUP 929: SUPPLY OF NON-CLERICAL LABOUR
(CLASS I: OTHER SERVICES)
Component
2011 Premium Rate
Per $100 Of
Insurable Earnings
Percentage
of 2011
Premium Rate
2010 Premium Rate
Per $100 Of
Insurable Earnings
Percentage
of 2010
Premium Rate
A. NEW CLAIMS COST
1. New Claims Cost 2.245 2.245 46% 2.471 2.471 53%
B. OVERHEAD EXPENSES
1. WSIB Administrative 0.465 0.452
2. Legislative Obligations 0.159 0.158
3. Prevention 0.069 0.070
4. TOTAL OVERHEAD EXPENSES 0.693 0.693 14% 0.680 0.680 15%
C. PAST CLAIMS COST
1. Unfunded Liability 1.659 1.342
2. (Gain)/Loss 0.146 0.127
3. Bad Debts 0.085 N/A
4. TOTAL PAST CLAIMS COST 1.890 1.890 39% 1.469 1.469 32%
D. TOTAL PREMIUM RATE (A+B+C) 4.83 100% 4.62 100%
Section 6I - ©WSIB Ontario 553

2011 PREMIUM RATE COMPONENTS
RATE GROUP 933: EQUIPMENT RENTAL AND REPAIR SERVICES
(CLASS I: OTHER SERVICES)
Component
2011 Premium Rate
Per $100 Of
Insurable Earnings
Percentage
of 2011
Premium Rate
2010 Premium Rate
Per $100 Of
Insurable Earnings
Percentage
of 2010
Premium Rate
A. NEW CLAIMS COST
1. New Claims Cost 1.327 1.327 45% 1.544 1.544 52%
B. OVERHEAD EXPENSES
1. WSIB Administrative 0.335 0.336
2. Legislative Obligations 0.114 0.117
3. Prevention 0.048 0.033
4. TOTAL OVERHEAD EXPENSES 0.497 0.497 17% 0.486 0.486 16%
C. PAST CLAIMS COST
1. Unfunded Liability 0.983 0.838
2. (Gain)/Loss 0.086 0.079
3. Bad Debts 0.055 N/A
4. TOTAL PAST CLAIMS COST 1.124 1.124 38% 0.917 0.917 31%
D. TOTAL PREMIUM RATE (A+B+C) 2.95 100% 2.95 100%
Section 6I - ©WSIB Ontario 554

2011 PREMIUM RATE COMPONENTS
RATE GROUP 937: RECREATIONAL SERVICES AND FACILITIES
(CLASS I: OTHER SERVICES)
Component
2011 Premium Rate
Per $100 Of
Insurable Earnings
Percentage
of 2011
Premium Rate
2010 Premium Rate
Per $100 Of
Insurable Earnings
Percentage
of 2010
Premium Rate
A. NEW CLAIMS COST
1. New Claims Cost 0.918 0.918 44% 0.916 0.916 50%
B. OVERHEAD EXPENSES
1. WSIB Administrative 0.276 0.258
2. Legislative Obligations 0.094 0.090
3. Prevention 0.039 0.024
4. TOTAL OVERHEAD EXPENSES 0.409 0.409 19% 0.372 0.372 20%
C. PAST CLAIMS COST
1. Unfunded Liability 0.677 0.498
2. (Gain)/Loss 0.059 0.047
3. Bad Debts 0.034 N/A
4. TOTAL PAST CLAIMS COST 0.770 0.770 37% 0.545 0.545 30%
D. TOTAL PREMIUM RATE (A+B+C) 2.10 100% 1.83 100%
Section 6I - ©WSIB Ontario 555

2011 PREMIUM RATE COMPONENTS
RATE GROUP 944: PERSONAL SERVICES
(CLASS I: OTHER SERVICES)
Component
2011 Premium Rate
Per $100 Of
Insurable Earnings
Percentage
of 2011
Premium Rate
2010 Premium Rate
Per $100 Of
Insurable Earnings
Percentage
of 2010
Premium Rate
A. NEW CLAIMS COST
1. New Claims Cost 1.412 1.412 45% 1.563 1.563 52%
B. OVERHEAD EXPENSES
1. WSIB Administrative 0.347 0.338
2. Legislative Obligations 0.118 0.118
3. Prevention 0.050 0.034
4. TOTAL OVERHEAD EXPENSES 0.515 0.515 17% 0.490 0.490 16%
C. PAST CLAIMS COST
1. Unfunded Liability 1.044 0.849
2. (Gain)/Loss 0.092 0.080
3. Bad Debts 0.055 N/A
4. TOTAL PAST CLAIMS COST 1.191 1.191 38% 0.929 0.929 31%
D. TOTAL PREMIUM RATE (A+B+C) 3.12 100% 2.98 100%
Section 6I - ©WSIB Ontario 556

2011 PREMIUM RATE COMPONENTS
RATE GROUP 956: LEGAL AND FINANCIAL SERVICES
(CLASS I: OTHER SERVICES)
Component
2011 Premium Rate
Per $100 Of
Insurable Earnings
Percentage
of 2011
Premium Rate
2010 Premium Rate
Per $100 Of
Insurable Earnings
Percentage
of 2010
Premium Rate
A. NEW CLAIMS COST
1. New Claims Cost 0.078 0.078 37% 0.077 0.077 43%
B. OVERHEAD EXPENSES
1. WSIB Administrative 0.035 0.035
2. Legislative Obligations 0.012 0.012
3. Prevention 0.020 0.012
4. TOTAL OVERHEAD EXPENSES 0.067 0.067 32% 0.059 0.059 33%
C. PAST CLAIMS COST
1. Unfunded Liability 0.058 0.042
2. (Gain)/Loss 0.005 0.004
3. Bad Debts 0.003 N/A
4. TOTAL PAST CLAIMS COST 0.066 0.066 31% 0.046 0.046 26%
D. TOTAL PREMIUM RATE (A+B+C) 0.21 100% 0.18 100%
Section 6I - ©WSIB Ontario 557

2011 PREMIUM RATE COMPONENTS
RATE GROUP 958: TECHNICAL AND BUSINESS SERVICES
(CLASS I: OTHER SERVICES)
Component
2011 Premium Rate
Per $100 Of
Insurable Earnings
Percentage
of 2011
Premium Rate
2010 Premium Rate
Per $100 Of
Insurable Earnings
Percentage
of 2010
Premium Rate
A. NEW CLAIMS COST
1. New Claims Cost 0.147 0.147 39% 0.162 0.162 43%
B. OVERHEAD EXPENSES
1. WSIB Administrative 0.066 0.072
2. Legislative Obligations 0.022 0.025
3. Prevention 0.021 0.023
4. TOTAL OVERHEAD EXPENSES 0.109 0.109 29% 0.120 0.120 32%
C. PAST CLAIMS COST
1. Unfunded Liability 0.110 0.088
2. (Gain)/Loss 0.010 0.008
3. Bad Debts 0.007 N/A
4. TOTAL PAST CLAIMS COST 0.127 0.127 33% 0.096 0.096 25%
D. TOTAL PREMIUM RATE (A+B+C) 0.38 100% 0.38 100%
Section 6I - ©WSIB Ontario 558

2011 PREMIUM RATE COMPONENTS
RATE GROUP 962: ADVERTISING AND ENTERTAINMENT
(CLASS I: OTHER SERVICES)
Component
2011 Premium Rate
Per $100 Of
Insurable Earnings
Percentage
of 2011
Premium Rate
2010 Premium Rate
Per $100 Of
Insurable Earnings
Percentage
of 2010
Premium Rate
A. NEW CLAIMS COST
1. New Claims Cost 0.419 0.419 40% 0.420 0.420 45%
B. OVERHEAD EXPENSES
1. WSIB Administrative 0.188 0.187
2. Legislative Obligations 0.064 0.065
3. Prevention 0.027 0.017
4. TOTAL OVERHEAD EXPENSES 0.279 0.279 27% 0.269 0.269 29%
C. PAST CLAIMS COST
1. Unfunded Liability 0.310 0.228
2. (Gain)/Loss 0.027 0.022
3. Bad Debts 0.017 N/A
4. TOTAL PAST CLAIMS COST 0.354 0.354 34% 0.250 0.250 27%
D. TOTAL PREMIUM RATE (A+B+C) 1.05 100% 0.94 100%
Section 6I - ©WSIB Ontario 559

2011 PREMIUM RATE COMPONENTS
RATE GROUP 975: LINEN AND LAUNDRY SERVICES
(CLASS I: OTHER SERVICES)
Component
2011 Premium Rate
Per $100 Of
Insurable Earnings
Percentage
of 2011
Premium Rate
2010 Premium Rate
Per $100 Of
Insurable Earnings
Percentage
of 2010
Premium Rate
A. NEW CLAIMS COST
1. New Claims Cost 1.819 1.819 46% 1.725 1.725 52%
B. OVERHEAD EXPENSES
1. WSIB Administrative 0.403 0.359
2. Legislative Obligations 0.138 0.125
3. Prevention 0.059 0.054
4. TOTAL OVERHEAD EXPENSES 0.600 0.600 15% 0.538 0.538 16%
C. PAST CLAIMS COST
1. Unfunded Liability 1.338 0.937
2. (Gain)/Loss 0.117 0.089
3. Bad Debts 0.061 N/A
4. TOTAL PAST CLAIMS COST 1.516 1.516 38% 1.026 1.026 31%
D. TOTAL PREMIUM RATE (A+B+C) 3.94 100% 3.29 100%
Section 6I - ©WSIB Ontario 560

2011 PREMIUM RATE COMPONENTS
RATE GROUP 981: MEMBERSHIP ORGANIZATIONS
(CLASS I: OTHER SERVICES)
Component
2011 Premium Rate
Per $100 Of
Insurable Earnings
Percentage
of 2011
Premium Rate
2010 Premium Rate
Per $100 Of
Insurable Earnings
Percentage
of 2010
Premium Rate
A. NEW CLAIMS COST
1. New Claims Cost 0.306 0.306 40% 0.297 0.297 44%
B. OVERHEAD EXPENSES
1. WSIB Administrative 0.137 0.133
2. Legislative Obligations 0.046 0.046
3. Prevention 0.025 0.015
4. TOTAL OVERHEAD EXPENSES 0.208 0.208 27% 0.194 0.194 29%
C. PAST CLAIMS COST
1. Unfunded Liability 0.227 0.161
2. (Gain)/Loss 0.020 0.015
3. Bad Debts 0.012 N/A
4. TOTAL PAST CLAIMS COST 0.259 0.259 34% 0.176 0.176 26%
D. TOTAL PREMIUM RATE (A+B+C) 0.77 100% 0.67 100%
Section 6I - ©WSIB Ontario 561

2011 PREMIUM RATE COMPONENTS
RATE GROUP 983: COMMUNICATIONS INDUSTRIES
(CLASS I: OTHER SERVICES)
Component
2011 Premium Rate
Per $100 Of
Insurable Earnings
Percentage
of 2011
Premium Rate
2010 Premium Rate
Per $100 Of
Insurable Earnings
Percentage
of 2010
Premium Rate
A. NEW CLAIMS COST
1. New Claims Cost 0.151 0.151 41% 0.151 0.151 46%
B. OVERHEAD EXPENSES
1. WSIB Administrative 0.083 0.082
2. Legislative Obligations 0.008 0.008
3. Prevention 0.000 0.000
4. TOTAL OVERHEAD EXPENSES 0.091 0.091 25% 0.090 0.090 27%
C. PAST CLAIMS COST
1. Unfunded Liability 0.112 0.082
2. (Gain)/Loss 0.010 0.008
3. Bad Debts 0.006 N/A
4. TOTAL PAST CLAIMS COST 0.128 0.128 35% 0.090 0.090 27%
D. TOTAL PREMIUM RATE (A+B+C) 0.37 100% 0.33 100%
Section 6I - ©WSIB Ontario 562

2011 PREMIUM RATE COMPONENTS
CLASS I: OTHER SERVICES
Component
2011 Premium Rate
Per $100 Of
Insurable Earnings
Percentage
of 2011
Premium Rate
2010 Premium Rate
Per $100 Of
Insurable Earnings
Percentage
of 2010
Premium Rate
A. NEW CLAIMS COST
1. New Claims Cost 0.537 0.537 43% 0.584 0.584 49%
B. OVERHEAD EXPENSES
1. WSIB Administrative 0.170 0.166
2. Legislative Obligations 0.056 0.056
3. Prevention 0.029 0.024
4. TOTAL OVERHEAD EXPENSES 0.255 0.255 20% 0.246 0.246 21%
C. PAST CLAIMS COST
1. Unfunded Liability 0.398 0.317
2. (Gain)/Loss 0.035 0.030
3. Bad Debts 0.022 N/A
4. TOTAL PAST CLAIMS COST 0.455 0.455 36% 0.347 0.347 29%
D. TOTAL PREMIUM RATE (A+B+C) 1.25 100% 1.18 100%
Section 6I - ©WSIB Ontario 563

2011 PREMIUM RATES
Summary of Premium Rate Components by Rate Group
per $100 of Insurable Earnings
New Past 2011
Rate
Group Description
Claims
Cost
($)
Overhead
($)
Claims
Cost
($)
Premium
Rate
($)
905 APARTMENT AND CONDOMINIUM SERVICES 1.314 0.493 1.102 2.91
908 OTHER REAL ESTATE SERVICES 0.501 0.321 0.429 1.25
911 SECURITY AND INVESTIGATION SERVICES 0.706 0.364 0.598 1.67
919 RESTAURANTS AND CATERING 0.693 0.362 0.591 1.65
921 HOTELS, MOTELS AND CAMPING 1.344 0.501 1.129 2.97
923 JANITORIAL SERVICES 1.633 0.562 1.376 3.57
929 SUPPLY OF NON-CLERICAL LABOUR 2.245 0.693 1.890 4.83
933 EQUIPMENT RENTAL AND REPAIR SERVICES 1.327 0.497 1.124 2.95
937 RECREATIONAL SERVICES AND FACILITIES 0.918 0.409 0.770 2.10
944 PERSONAL SERVICES 1.412 0.515 1.191 3.12
956 LEGAL AND FINANCIAL SERVICES 0.078 0.067 0.066 0.21
958 TECHNICAL AND BUSINESS SERVICES 0.147 0.109 0.127 0.38
962 ADVERTISING AND ENTERTAINMENT 0.419 0.279 0.354 1.05
975 LINEN AND LAUNDRY SERVICES 1.819 0.600 1.516 3.94
981 MEMBERSHIP ORGANIZATIONS 0.306 0.208 0.259 0.77
983 COMMUNICATIONS INDUSTRIES 0.151 0.091 0.128 0.37
CLASS I OTHER SERVICES 0.537 0.255 0.455 1.25
Section 6I - ©WSIB Ontario 564

2011Premium Rates M
ANUAL
SECTION 7Supporting Documentation
for Schedule 1

2011 PREMIUM RATES
6-YEAR HISTORICAL SUMMARY AND 2-YEAR PROJECTION
SCHEDULE 1
Year
Insurable
Earnings
Maximum
Insurable
Earnings
Ceiling
Average
Insurable
Earnings Employment
Total
Number of
Injuries
Total Injury
Rate
2004 $132,281,725,459 $66,800 $32,814 4,031,222 247,200 6.13%
2005 $136,883,292,340 $67,700 $33,725 4,058,861 247,600 6.10%
2006 $142,109,775,426 $69,400 $34,459 4,123,975 231,401 5.61%
2007 $147,337,818,913 $71,800 $35,372 4,165,398 222,600 5.34%
2008 $150,991,446,958 $73,300 $36,093 4,183,365 211,000 5.04%
2009 $145,348,028,053 $74,600 $36,248 4,009,805 172,900 4.31%
2010 $150,469,934,000 $77,600 $37,191 4,045,900 165,734 4.10%
2011 $155,014,377,000 $79,600 $37,935 4,086,365 159,022 3.89%
Section 7 - ©WSIB Ontario 565

2011 Premium RatesNEW CLAIMS COST BY CLASS
2011 New Claims Cost 2011
Class Description Cost per Claim
($)
Premium
Rate
($)
A FOREST PRODUCTS 14,064 4.71
B MINING AND RELATED INDUSTRIES 26,698 6.29
C OTHER PRIMARY INDUSTRIES 10,377 4.01
D MANUFACTURING 8,389 2.41
E TRANSPORTATION AND STORAGE 14,002 4.83
F RETAIL AND WHOLESALE TRADES 7,073 1.74
G CONSTRUCTION 21,285 6.36
H GOVERNMENT AND RELATED SERVICES 6,441 1.30
I OTHER SERVICES 6,804 1.25
1 SCHEDULE 1 9,702 2.35
Section 7 - ©WSIB Ontario 566

2011 PREMIUM RATES
SUB-COMPONENTS OF OVERHEAD EXPENSES
SCHEDULE 1
Overhead Expenses
Component
Overhead Expenses
Sub-Component
Premium Rate
Component
B.1 WSIB Administrative 0.265
B.2 Legislative Obligations
WSIAT 0.014
Office of Worker Advisor 0.007
Office of Employer Advisor 0.002
OHSA 0.060
Mine Rescue 0.003
Construction Certification Training 0.000
Program Administration 0.000
Institute of Work & Health 0.003
Sub-Total 0.088
B.3 Prevention 0.047
B.4 TOTAL OVERHEAD EXPENSES 0.400
Section 7 - ©WSIB Ontario 567

2011 PREMIUM RATE COMPONENTS
SCHEDULE 1
Component
2011 Premium Rate
Per $100 Of
Insurable Earnings
Percentage
of 2011
Premium Rate
2010 Premium Rate
Per $100 Of
Insurable Earnings
Percentage
of 2010
Premium Rate
A. NEW CLAIMS COST
1. New Claims Cost 1.010 1.010 43% 1.131 1.131 49%
B. OVERHEAD EXPENSES
1. WSIB Administrative 0.265 0.264
2. Legislative Obligations 0.088 0.090
3. Prevention 0.047 0.046
4. TOTAL OVERHEAD EXPENSES 0.400 0.400 17% 0.400 0.400 17%
C. PAST CLAIMS COST
1. Unfunded Liability 0.741 0.614
2. (Gain)/Loss 0.168 0.152
3. Bad Debts 0.033 N/A
4. TOTAL PAST CLAIMS COST 0.942 0.942 40% 0.766 0.766 33%
D. TOTAL PREMIUM RATE (A+B+C) 2.35 100% 2.30 100%
Section 7 - ©WSIB Ontario 568

2011 PREMIUM RATES
Summary of Premium Rate Components by Class
per $100 of Insurable Earnings
New Past 2011
Class Description
Claims
Cost
($)
Overhead
($)
Claims
Cost
($)
Premium
Rate
($)
A FOREST PRODUCTS 1.803 0.708 2.197 4.71
B MINING AND RELATED INDUSTRIES 2.518 1.109 2.662 6.29
C OTHER PRIMARY INDUSTRIES 1.825 0.606 1.579 4.01
D MANUFACTURING 0.969 0.403 1.040 2.41
E TRANSPORTATION AND STORAGE 2.163 0.624 2.046 4.83
F RETAIL AND WHOLESALE TRADES 0.754 0.351 0.635 1.74
G CONSTRUCTION 2.893 0.886 2.582 6.36
H GOVERNMENT AND RELATED SERVICES 0.547 0.271 0.485 1.30
I OTHER SERVICES 0.537 0.255 0.455 1.25
1 SCHEDULE 1 1.010 0.400 0.942 2.35
Section 7 - ©WSIB Ontario 569

2011Premium Rates M
ANUAL
SECTION 8Classification Scheme Changes

2011 CLASSIFICATION SCHEME CHANGES
The Workplace Safety and Insurance Board (WSIB) reviews the classification scheme each
year. For 2011, there is no change to the classification scheme.
Section 8 - ©WSIB Ontario 570

2011Premium Rates M
ANUAL
SECTION 9Non-Credible Rate Groups

NON-CREDIBLE RATE GROUPS
Ideally, each rate group defined in the Workplace Safety and Insurance Board’s
classification scheme should be credible, that is, large enough so that reasonably reliable
estimates can be made for deriving premium rates from a rate group’s own claims
experience. Although this is generally the case, particular industries or services in Ontario
can decline substantially as the economy undergoes changes and this can lead to a
situation where a previously credible rate group becomes non-credible. In addition, some
rate groups have reduced the number of injuries to a level where there is not enough
information available to estimate the average cost of a claim and, as a result, the rate
group becomes non-credible. As part of the ongoing activity of rate making, the Workplace
Safety and Insurance Board (WSIB) monitors the credibility of rate groups.
When the WSIB is concerned that a particular rate group has become non-credible, and is
likely to remain non-credible, the WSIB may decide to remove such a rate group from the
classification scheme through some form of rate group merger, as of a specified date.
Employers in the affected industries or services would continue to be insured, but under
another rate group.
Since the original development of the WSIB’s current classification scheme, which was
introduced in 1993, a number of rate groups have become non-credible. Different
approaches have been used to address the issue of non-credibility, depending on the
circumstances of each rate group.
Data supporting the 2011 premium rates shows that under current criteria four rate groups
are not fully credible.
It is possible that the experience of some of the non-credible rate groups may return to a
fully credible level, eliminating the need for additional review. However, it is expected that
for some of these rate groups, the lack of credibility would need to be addressed more
formally by the WSIB, possibly through reclassifications or rate group mergers.
Section 9 - ©WSIB Ontario 571

2011Premium Rates M
ANUAL
SECTION 10Glossary of Acronyms

GLOSSARY OF ACRONYMS
ACRONYM
DEFINITION
CSPAAT Commission de la sécurité professionelle et de
l’assurance contre les accidents du travail
IHSA Infrastructure Health and Safety Association
PSHSA Public Services Health and Safety Association
SWA Safe Workplace Association
UFL Unfunded Liability
WSIB Workplace Safety and Insurance Board
WSN Workplace Safety North
WSPS Workplace Safety and Prevention Services
Section 10 - ©WSIB Ontario 572

2011Premium Rates M
ANUAL
SECTION 11Contact Information

CONTACT INFORMATION
1. Premium Rates Information
For more information about the premium rates or the supporting documentation presented
in this manual, please contact:
Actuarial Services Division
Workplace Safety and Insurance Board
Telephone: (416) 344-3332
Facsimile: (416) 344-4499
2. Premium Information and Data Requests
For more information about individual employer accounts, or for current data requests,
contact your WSIB account representative in your local WSIB office or call:
Workplace Safety and Insurance Board
Telephone: (416) 344-1000
Toll Free (Ontario): 1-800-387-0750
Toll Free (Canada-Wide): 1-800-387-5540
Facsimile: (416) 344-4684
Toll Free Facsimile: 1-888-313-7373
3. WSIB Website
For further information for both employers and employees, including prevention initiatives,
forms and policy reports, please visit our website at:
www.wsib.on.ca
The information contained on the website is continuously maintained and regularly
updated.
Section 11 - ©WSIB Ontario 573

ISSN 1492-0050 (Online) ISBN 978-1-4435-5443-5 (PDF, 2011 ed.)
ISSN 1492-0042 (Print)
ISBN 978-1-4435-5442-8 (Print, 2011 ed.)2123 (01/11)