
PREMIEREISSUE ADVANTAGE - · PDF fileADVANTAGE EXCELLENCE IN ... AUTODYN, FLUENT,...
68
ADVANTAGE EXCELLENCE IN ENGINEERING SIMULATION VOLUME I ISSUE 1 2007 FLEXIBLE RACE CAR WINGS PAGE 9 DEFORMING BLOOD VESSELS PAGE 12 GAS TURBINE BLADE COOLING PAGE 6 USING MULTIPLE ANALYSIS TOOLS NEXT-GENERATION SUBMERSIBLES PAGE 3 PREMIERE ISSUE
Transcript of PREMIEREISSUE ADVANTAGE - · PDF fileADVANTAGE EXCELLENCE IN ... AUTODYN, FLUENT,...

A D V A N T A G EE X C E L L E N C E I N E N G I N E E R I N G S I M U L A T I O N
V O L U M E I I S S U E 1 2 0 0 7
FLEXIBLE RACE CAR WINGSPAGE 9
DEFORMINGBLOOD VESSELS
PAGE 12
GAS TURBINEBLADE COOLING
PAGE 6
USING MULTIPLE ANALYSIS TOOLSNEXT-GENERATION SUBMERSIBLESPAGE 3
PREMIER
E
ISSUE

EDITORS’ NOTE
Welcome to ANSYS Advantage!With the strategic acquisition of
Fluent Inc. and blending of their leading-edge CFD technologies withits existing core software offerings,ANSYS, Inc. has further strengthenedits position in having one of the broadest, most comprehensive, inde-pendent engineering simulationsoftware offerings in the industry. The combined user base is vast, comprising one of the world’s largestsimulation communities with com-mercial seats at more than 10,000companies, including 94 of the topFORTUNE 100 industrial companies.
One of the best ways to serve thisgrowing simulation community is witha single publication providing a forum
for the exchange of ideas, a conduit for technology transferbetween disciplines and a common framework for inte-grating so many diverse areas of interest. With this in mind,the former Fluent News and ANSYS Solutions publicationshave been merged into the new quarterly ANSYS Advan-tage magazine covering the entire range of ANSYStechnologies and applications.
One of the greatest benefits of a single magazine is theopportunity for readers to become familiar with software andapplications beyond their usual fields of interest. Mechanicalengineers accustomed to using ANSYS primarily for structural analysis may see how the use of CFD could be
used in their development efforts, for example. Likewise,CFD analysts can better understand the tools used to gaininsight into the mechanical behavior of products.
Our editorial team is proud to present this premierissue. The feature articles highlight applications in which multiple simulation technologies are used. For example,our cover story discusses how Hawkes Ocean Technologiesused ANSYS CFX software to minimize drag in the designof an innovative two-man oceanographic craft and ANSYSMechanical tools to ensure that composite parts withstandunderwater pressure without being overdesigned withexcess material. At the center of the magazine, a 16-pagesupplement shines a spotlight on applications in the sportsand leisure industry that range from the design of alpineskis to fitness equipment.
We invite you to consider ANSYS Advantage your magazine, not only providing information about softwareproducts and technology applications but also giving you away to share your work with colleagues in the simulationcommunity. We welcome your feedback and ideas for articles you might want to contribute. Most importantly, wehope you find the publication to be a valuable asset inimplementing simulation-based product development inyour own workplace. n
Liz Marshall and John Krouse, Editors
For ANSYS, Inc. sales information, call 1.866.267.9724, or visit www.ansys.com.To subscribe to ANSYS Advantage, go to www.ansys.com/subscribe.
ANSYS Advantage is published for ANSYS, Inc. customers, partners and others interested in the field of design and analysis applications.
EditorLiz Marshall
Consulting EditorJohn Krouse
Assistant Editor/Art DirectorSusan Wheeler
Contributing EditorsErik FergusonKeith HannaFran HenslerMarty MundyChris Reeves
Ad Sales ManagerBeth Mazurak
Editorial AdvisorKelly Wall
Circulation ManagerElaine Travers
DesignersMiller Creative Group
Neither ANSYS, Inc. nor the editorial director nor Miller Creative Group guarantees or warrants accuracy or completeness of the material contained in this publication.ANSYS, ANSYS Workbench, CFX, AUTODYN, FLUENT, DesignModeler, ANSYS Mechanical, DesignSpace, ANSYS Structural, TGrid, GAMBIT and any and all ANSYS, Inc.brand, product, service, and feature names, logos and slogans are registered trademarks or trademarks of ANSYS, Inc. or its subisdiaries located in the United States or other countries. ICEM CFD is a trademark licensed by ANSYS, Inc. All other brand, product, service and feature names or trademarks are the property of their respective owners.
© 2007 ANSYS, Inc. All rights reserved.
About the Cover:Contours of pressureon the surface of anunderwater craft developed by HawkesOcean Technologies
About the sportssupplement:The flow field in thevicinity of a golf ballimmediately after being struck by a club
Email: [email protected]

ANSYS Advantage • Volume I, Issue 1, 2007
TABLE OF CONTENTS
www.ansys.com 1
Multi-Tool Analysis3 Taking Next-Generation Submersibles to New Depths
ANSYS simulation tools help minimize drag and reduce weight by half in two-man oceanographic craft.
6 Fluid Structure Interaction Makes for Cool Gas Turbine BladesAn integrated simulation process improves performance without sacrificing longevity.
9 Race Cars Flex Their MuscleAn Indy car rear wing is designed for aeroelastic response using multidisciplinary optimization.
12 Modern Medicine Takes Simulation to HeartA fluid structure interaction simulation is performed to capture patient-specific modeling of hypertensive hemodynamics.
Applications14 CONSUMER PRODUCTS
CAE Takes a Front SeatEngineers use ANSYS software to meet complex and potentially conflicting requirements to design a chair for a wide range of body types and postures.
16 PHARMACEUTICALS
Transport of Fragile GranulesPneumatic conveying systems in the pharmaceutical industry can lead to unwanted particle breakup.
18 CHEMICAL PROCESSING
Solid Suspensions Get a LiftA high-efficiency hydrofoil is designed using CFD and multi-objective optimization software.
20 GLASS
The Many Colors of GlassNumerical simulation helps guide the color change process in the glass industry.
22 POWER GENERATION
Developing Power Systems that Can Take the HeatIntegrating ANSYS technology with other software enabled researchers to efficiently assess component reliability for ceramic microturbine rotors.
25 AUTOMOTIVE
No Shivers While Developing the ShiverTools within the ANSYS Workbench Environment have allowed engineers to get a handle on crankshaft behavior before a motorcycle is built.
26 Putting the Spin on Air Pre-CleanersDust and dirt particles are removed from the air intakes of off-highway vehicles using a novel air pre-cleaner.
ContentsFEATURES
6
12
14
18
20
22
9
3
(Continued on next page)

www.ansys.comANSYS Advantage • Volume I, Issue 1, 20072
TABLE OF CONTENTS
s2 Sporting Swifter, Higher and Stronger Performances withEngineering SimulationComputer-aided engineering plays a major role in the world of sports.
s4 Catching the Simulation WaveSurfers are using engineering simulation to improve their gear.
s6 Giving Ski Racers an EdgeANSYS Mechanical software is used to analyze the dynamic properties of skis.
s8 Ice Axe ImpactsFinite element analysis is used to study crack initiation on a serrated blade.
s9 Tour de Force!Aerodynamic gains can be realized by studying the interaction between a bicycle and rider.
s10 Speeding Up Development Time for Racing CyclesTrek Bicycle Corporation cuts product launch delays with simulation-based design using ANSYS Mechanical software.
s11 Scoring an HVAC Goal for Hockey SpectatorsCFD is used to design ventilation systems for sports arenas.
s13 Taking a Bite out of Sports InjuriesFinite element analysis illustrates that both cushioning and support are needed to adequately protect teeth and surrounding tissue from impact injuries.
s15 Designing Fitness Equipment to Withstand the WorkoutKeeping bushing wear rates under control allows Life Fitnessto maintain some of the highest equipment reliability standards in the fitness industry.
s16 Catching a Better Oar DesignEngineers use CFD and a spreadsheet model to assess prospective oar blade designs.
29 METALLURGY
Blast Furnace Air Pre-Heater Gets a Thermal BoostEngineers use CFD to improve heat exchanger performance.
30 Fire Tests for Molten Metal ConvertersNumerical simulation helps engineers peer into a metallurgical converter in which high temperatures and adverse conditions make realistic measurements impossible to perform.
32 EQUIPMENT MANUFACTURING
Neutrino Detection in AntarcticaSimulation helps speed up drilling through ice so that optic monitors can be installed.
34 MATERIALS
Making Sure Wood Gets Heat Treated with RespectThe ANSYS Parametric Design Language helps establish the thermal conductivity of wood and composites to enable more effective heat treatment processes.
Departments
36 THOUGHT LEADERS
Accelerated Product Development in a Global EnterpriseWith the goal of compressing cycle times by up to 50 percent, the Velocity Product Development (VPD™) initiative at Honeywell Aerospace uses engineering simulation to eliminate delays while lowering cost and maintaining high quality standards for innovative designs.
38 ACADEMIC NEWS
Stent Analysis Expand Students’ Exposureto Biomedical EngineeringEngineering students gain insight into the physics of medical devices and add to the body of knowledge on stenting procedures.
40 Designing a Course for Future DesignersStudents use Volvo concept car to learn about simulation tools.
42 ANALYSIS TOOLS
Introducing the PCG Lanczos EigensolverA new eigensolver in ANSYS 11.0 determines natural frequenciesand mode shapes using less computational power, often in shorter total elapsed times than other tools on the market.
44 TIPS & TRICKS
CAE Cross TrainingEngineers today need to be proficient in not one, but many analysis tools.
46 View-Factoring Radiation into ANSYSWorkbench SimulationThe ANSYS Radiosity Solution Method accounts for heat exchange between surfaces using Named Selections and a Command object.
48 PARTNERSHIPS
Going to the SourceMatWeb material property data is seamlessly available to ANSYS Workbench users.
Spotlight on Engineering Simulation in theSports and Leisure Industry

ANSYS Advantage • Volume I, Issue 1, 2007
MULTI-TOOL ANALYSIS
www.ansys.com 3
The world beneath the ocean surface is teeming withmost of earth’s animal and plant species. While three-quarters of our planet lies under water, less than 5 percenthas been explored, mainly because of shortcomings intoday’s research equipment. Scuba limits divers to the topmost slice of the oceans. Conventional submersibles, onthe other hand, are designed to drop like bricks into theocean depths using variable buoyancy to control dive depthwith bulky air tanks, compressors, pumps and piping. As aresult, they have limited maneuverability and need a dedicated mother ship to transport and maintain them. Furthermore, the loud operational noise and bright lights associated with these crafts scare away many sea organisms.
Hawkes Ocean Technologies has come up with a solution to move beyond these constraints: a new class ofsmall, highly maneuverable craft that can be piloted throughthe water to a desired depth using controls, wings andthrusters for undersea flight similar to that of a jet aircraft.
Taking Next-GenerationSubmersibles to New DepthsANSYS simulation tools help minimize drag and reduceweight by half in two-man oceanographic craft.
By Adam WrightHawkes Ocean TechnologiesCalifornia, U.S.A.
Winged-submersibles designed by Hawkes Ocean Technologies “fly” throughwater to depths of 1,500 feet using controls, wings and thrusters similar to jetaircraft. To identify critical forces such as drag, weight, pressure and stresses aswell as optimize design, the engineering team used ANSYS simulation softwareincluding ANSYS CFX and ANSYS Mechanical. Access to simulation applicationsand Hawkes’ chosen CAD through a single, integrated platform — ANSYSWorkbench — helped streamline the development process.
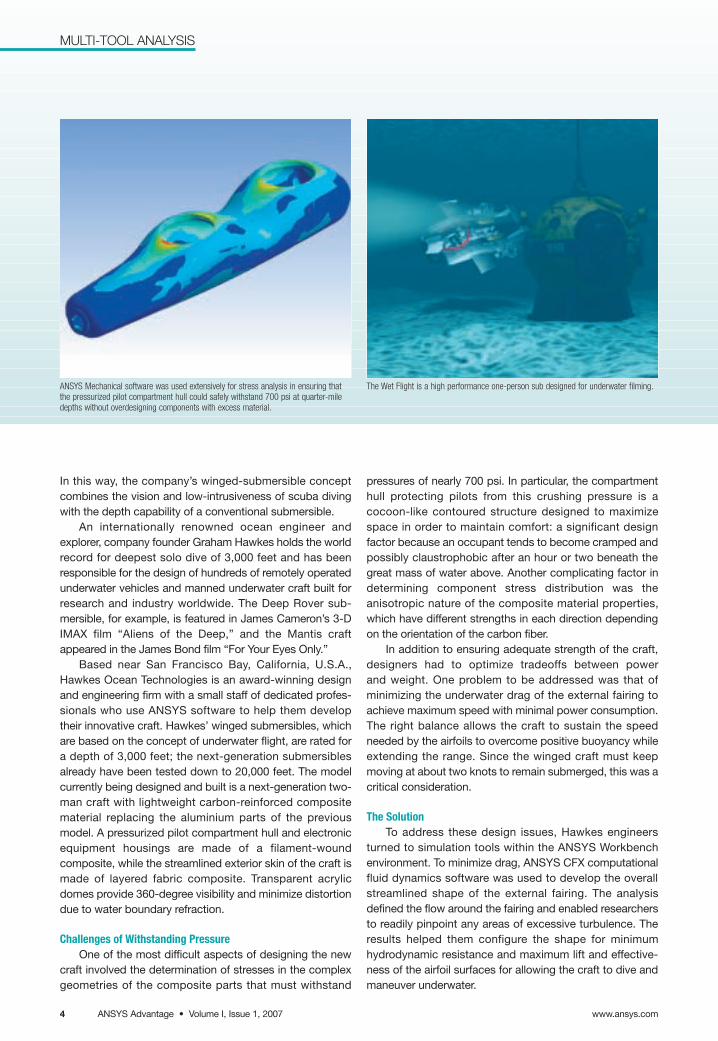
ANSYS CFX computational fluid dynamics software helped develop the overallstreamlined shape of the external fairing to minimize underwater drag.
www.ansys.comANSYS Advantage • Volume I, Issue 1, 20074
MULTI-TOOL ANALYSIS
In this way, the company’s winged-submersible conceptcombines the vision and low-intrusiveness of scuba divingwith the depth capability of a conventional submersible.
An internationally renowned ocean engineer and explorer, company founder Graham Hawkes holds the worldrecord for deepest solo dive of 3,000 feet and has beenresponsible for the design of hundreds of remotely operatedunderwater vehicles and manned underwater craft built forresearch and industry worldwide. The Deep Rover sub-mersible, for example, is featured in James Cameron’s 3-DIMAX film “Aliens of the Deep,” and the Mantis craftappeared in the James Bond film “For Your Eyes Only.”
Based near San Francisco Bay, California, U.S.A.,Hawkes Ocean Technologies is an award-winning designand engineering firm with a small staff of dedicated profes-sionals who use ANSYS software to help them developtheir innovative craft. Hawkes’ winged submersibles, whichare based on the concept of underwater flight, are rated fora depth of 3,000 feet; the next-generation submersibles already have been tested down to 20,000 feet. The modelcurrently being designed and built is a next-generation two-man craft with lightweight carbon-reinforced compositematerial replacing the aluminium parts of the previousmodel. A pressurized pilot compartment hull and electronicequipment housings are made of a filament-wound composite, while the streamlined exterior skin of the craft ismade of layered fabric composite. Transparent acrylicdomes provide 360-degree visibility and minimize distortiondue to water boundary refraction.
Challenges of Withstanding PressureOne of the most difficult aspects of designing the new
craft involved the determination of stresses in the complexgeometries of the composite parts that must withstand
pressures of nearly 700 psi. In particular, the compartmenthull protecting pilots from this crushing pressure is acocoon-like contoured structure designed to maximizespace in order to maintain comfort: a significant design factor because an occupant tends to become cramped andpossibly claustrophobic after an hour or two beneath thegreat mass of water above. Another complicating factor indetermining component stress distribution was theanisotropic nature of the composite material properties,which have different strengths in each direction dependingon the orientation of the carbon fiber.
In addition to ensuring adequate strength of the craft,designers had to optimize tradeoffs between power and weight. One problem to be addressed was that of minimizing the underwater drag of the external fairing toachieve maximum speed with minimal power consumption.The right balance allows the craft to sustain the speedneeded by the airfoils to overcome positive buoyancy whileextending the range. Since the winged craft must keepmoving at about two knots to remain submerged, this was acritical consideration.
The SolutionTo address these design issues, Hawkes engineers
turned to simulation tools within the ANSYS Workbenchenvironment. To minimize drag, ANSYS CFX computationalfluid dynamics software was used to develop the overallstreamlined shape of the external fairing. The analysisdefined the flow around the fairing and enabled researchersto readily pinpoint any areas of excessive turbulence. Theresults helped them configure the shape for minimumhydrodynamic resistance and maximum lift and effective-ness of the airfoil surfaces for allowing the craft to dive andmaneuver underwater.
ANSYS Mechanical software was used extensively for stress analysis in ensuring thatthe pressurized pilot compartment hull could safely withstand 700 psi at quarter-miledepths without overdesigning components with excess material.
The Wet Flight is a high performance one-person sub designed for underwater filming.

ANSYS Advantage • Volume I, Issue 1, 2007www.ansys.com 5
MULTI-TOOL ANALYSIS
When diving to 1,500 feet and deeper depths, there isno room for error, so Hawkes used ANSYS Mechanical software for stress analysis to ensure that composite parts could withstand underwater pressure without beingoverdesigned with excess material. The program readilyaccounted for the anisotropic material properties of thecomposite parts and clearly showed directional stressesgraphically as well as numerically with precise von Missesvalues. The capability helped engineers determine theproper carbon fiber orientation and wall thickness neededto strengthen high-stress areas of composite parts, particu-larly the pressurized pilot hull.
The stress levels of assemblies of individual parts madeof different materials also were analyzed. For example, oneassembly included the metal locking ring that clamps thefittings and seal of the acrylic dome to the composite hull,along with the dome and hull. In generating these assemblymodels, the ANSYS surface-to-surface contact elementfeature automatically detected the contact points, allowedfor different material properties and adjusted mesh densities instead of requiring users to perform these tasksmanually. Moreover, convenient element-sizing functionsenabled engineers to readily increase mesh density in localized regions in which they wanted to study stresses ingreater detail.
Easy access to computer-aided design (CAD) softwareand simulation applications through the integrated ANSYSWorkbench platform allowed Hawkes engineers to becomeproductive on the first day. Simulation models were createdbased on part geometry from the Autodesk® InventorTM
design system. Direct associativity with the CAD systemenabled engineers to readily change the design based on
an analysis and quickly perform another simulation on thenew part geometry without having to re-apply loads, supports and boundary conditions. For some cases, morethan 40 design iterations were tested. The approach savedconsiderable time and effort, allowed numerous alternativeconfigurations to be studied, guided engineers toward theuniquely contoured compartment hull shape, and, perhapsmost importantly, minimized mistakes. In this way, theresearchers were able to quickly arrive at a not-intuitively-obvious optimal design for a craft that could withstandprescribed pressure limits with minimal weight and fit withinthe tight space constraints of the two-man submersible.
Significant Weight ReductionBy using ANSYS software in the design of components
to be made with composites instead of aluminium, engineers were able to reduce the overall weight of the craftby 50 percent. This significant weight reduction is expectedto increase maximum underwater speed and save batterylife to increase the time the craft can spend underwater.Because the lightweight submersible does not need a dedicated mother ship, operational costs are reduced by 70 percent and the craft can operate freely worldwide off ofa variety of launch platforms. This greatly expands theunderwater exploration possibilities of the craft. Further-more, these next-generation submersibles hold thepotential of unlocking new biotechnology from the oceandepths that may help cure disease, discovering new aquatic species, finding new mineral and food reserves,studying weather, and providing a means to monitor andprevent further pollution at sea. n
The Deep Flight II can house one or two persons in a prone positionand can travel for up to eight hours.
The Wet Flight submersible rises to the surface.

www.ansys.comANSYS Advantage • Volume I, Issue 1, 20076
MULTI-TOOL ANALYSIS
Fluid Structure Interaction Makesfor Cool Gas Turbine BladesAn integrated simulation process improves performancewithout sacrificing longevity.
By Michel Arnal, Christian Precht and Thomas Sprunk, Wood Group Heavy Industrial Turbines AG, SwitzerlandTobias Danninger and John Stokes, ANSYS, Inc.
In gas turbines, hot gas from thecombustion system flows past therotating turbine blades, expanding inthe process. In order to reach desiredlevels of efficiency and power output,advanced gas turbines operate at veryhigh temperatures. As a result, thecomponents subjected to these hightemperatures often require cooling.One method of cooling the turbineblades involves extracting air from acompressor and forcing it through aplenum and into channels inside theblade. While effective cooling of theblades can increase their lifespan, itcan also reduce the thermal efficiencyof the engine. It is therefore importantto develop designs that extend com-ponent life while having a minimaleffect on engine thermal efficiency.Numerical simulations that accuratelycapture the interaction between thefluid and thermal effects can play animportant role in the design process.
Wood Group Heavy Industrial Turbines provides a comprehensiverange of support solutions, includingre-engineered replacement parts andmaintenance, repair and overhaul services for industrial gas turbines andrelated high-speed rotating equipmentused in the global power generationand oil and gas markets. One exampleof the work done by Wood Group is a recent project involving the re-engineering of the blade from thefirst stage of a gas turbine. The goal ofthe project was to optimize the bladedesign and improve its longevity. Thenumerical simulation process coupledANSYS CFX software for the fluid flow,ANSYS Mechanical software for the
The blade geometry
The internal features of the blade geometry include theplenum (blue) and the cooling channels (gold).
ANSYS Advantage • Volume I, Issue 1, 2007www.ansys.com 7
MULTI-TOOL ANALYSIS
structural response of the blade, and the1-D thermal and fluid flow simulationpackage Flowmaster2. This set of simulation tools provided an efficient virtual prototype that was used toassess the performance of the turbineblade under actual operating conditions.
CFD ModelThe original 3-D CAD geometry,
which is intended for manufacturing, was extended for the purpose of the simulation using ANSYS DesignModeler.The extensions served to better representthe true operating conditions of the rotor.For example, gaps not present under normal operating conditions were closed.This extended CAD model then served asthe basis for the CFD mesh.
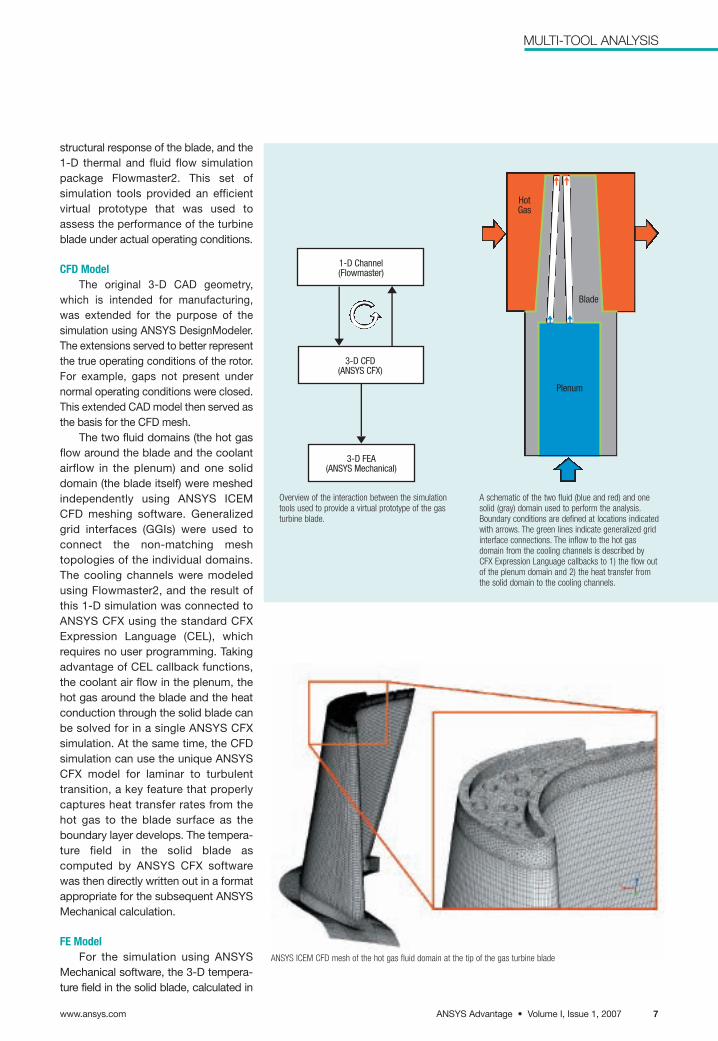
The two fluid domains (the hot gasflow around the blade and the coolantairflow in the plenum) and one soliddomain (the blade itself) were meshedindependently using ANSYS ICEM CFD meshing software. Generalizedgrid interfaces (GGIs) were used toconnect the non-matching meshtopologies of the individual domains.The cooling channels were modeledusing Flowmaster2, and the result ofthis 1-D simulation was connected toANSYS CFX using the standard CFXExpression Language (CEL), whichrequires no user programming. Takingadvantage of CEL callback functions,the coolant air flow in the plenum, thehot gas around the blade and the heatconduction through the solid blade canbe solved for in a single ANSYS CFXsimulation. At the same time, the CFDsimulation can use the unique ANSYSCFX model for laminar to turbulenttransition, a key feature that properlycaptures heat transfer rates from thehot gas to the blade surface as theboundary layer develops. The tempera-ture field in the solid blade ascomputed by ANSYS CFX softwarewas then directly written out in a formatappropriate for the subsequent ANSYSMechanical calculation.
FE ModelFor the simulation using ANSYS
Mechanical software, the 3-D tempera-ture field in the solid blade, calculated in
Overview of the interaction between the simulationtools used to provide a virtual prototype of the gasturbine blade.
A schematic of the two fluid (blue and red) and one solid (gray) domain used to perform the analysis.Boundary conditions are defined at locations indicatedwith arrows. The green lines indicate generalized gridinterface connections. The inflow to the hot gasdomain from the cooling channels is described by CFX Expression Language callbacks to 1) the flow outof the plenum domain and 2) the heat transfer fromthe solid domain to the cooling channels.
ANSYS ICEM CFD mesh of the hot gas fluid domain at the tip of the gas turbine blade
3-D FEA(ANSYS Mechanical)
3-D CFD(ANSYS CFX)
Plenum
Blade
HotGas
1-D Channel(Flowmaster)

ANSYS CFX temperature simulation of theblade surface. Streamlines show flow fromthe inlet into the plenum and from the coolingchannel outlets into the hot gas. Where theinternal cooling channels are close to theblade surface on the suction side of the bladenear the trailing edge, areas of lower temper-ature are shown in blue.
CFD simulation of heat flux distribution. Theheat transfer is from the hot gas to the bladesurface in most areas, but in the tip regionthe heat transfer is positive corresponding towhere the cooling air from the cooling holescomes into contact with the blade surface.
Temperature contours in the flow field and through the blade at a radial locationnear the blade platform (left) and outer casing (right)
The finite element mesh
a)
b)
c)
the ANSYS CFX conjugate heat transferanalysis, was used as input for thethermal load. This, along with the rota-tional load on the blade at operatingconditions, determined the stress distribution. Together, the resultingthermal and mechanical stress distri-butions in the blade were used todetermine component life. Applyingthese loads, life-limiting elements ofthe blade design could be determinedand new design alternatives evaluated.
The ability to combine the entirefluid and thermal analysis through theuse of standard functionality, especiallythe powerful CFX Expression Languageand its callback functions, are key to making simulations such as this feasible. By combining both CFD andstructural analysis with a 1-D thermal
Stress distribution in the directionally solidified bladedue to a) temperature variations (but not includingrotational effects), b) centripetal forces (assuming aconstant temperature) and c) the combination of temperature variations and centripetal forces
simulation, this virtual prototype hasprovided a more complete under-standing of the performance of eachblade design in a given set of operating conditions. This allows mod-ifications to be made early in thedesign process, and therefore isessential in the efforts to help improveefficiency and increase longevity. n
Suggested ReadingArnal, Michel; Precht, Christian; Sprunk,Thomas; Danninger, Tobias; and Stokes, John:Analysis of a Virtual Prototype First-StageRotor Blade Using Integrated Computer-BasedDesign Tools. Proceedings of ESDA2006 8thBiennial ASME Conference on EngineeringSystems Design and Analysis, Torino, Italy,July 2006.
www.ansys.comANSYS Advantage • Volume I, Issue 1, 20078
MULTI-TOOL ANALYSIS

ANSYS Advantage • Volume I, Issue 1, 2007www.ansys.com 9
MULTI-TOOL ANALYSIS
Race Cars Flex Their MuscleAn Indy car rear wing is designed for aeroelastic response using multidisciplinary optimization.
By David Massegur, Giuseppe Quaranta and Luca Cavagna, Department of Aerospace EngineeringPolitecnico di Milano, Italy
Aerodynamics play a crucial role in the perform-ance of race cars, such as Indy and Formula 1, andfor years, teams have spent a great deal of time andmoney on wind-tunnel testing. Nowadays, thanks toincreases in computational power, CFD has becomea valuable tool for fine-tuning both the external andinternal shape of these cars. The goal is to maximizedownforce, in order to increase cornering speeds,and to reduce drag to be faster on the straights.Thus, the highest aerodynamic efficiency is soughtthat represents the optimal trade-off between highdownforce at low speeds (for cornering) and lowdrag at high speeds (for driving on the straights) [1].
To improve car performance at the differentoperating conditions, the flexibility of aerodynamicdevices (aeroelastic effects) can be exploited. In fact,the changes in the shape of such devices due todeformation may cause a modification of the flow field around the car. Despite being severelyrestricted by technical regulations, this currently isthe only way to optimize the car for different regions
Pathlines illustrate the presence of the flow recirculation behind the gurney flap.
¨
¨
¨
¨¨
¨
¨
¨
www.ansys.comANSYS Advantage • Volume I, Issue 1, 200710
MULTI-TOOL ANALYSIS
of the track because any servo-aided device aimed at moving an element of the car is strictly forbidden. Sinceaerodynamic loads increase quadratically with speed, aero-elastic phenomena can be exploited more easily at highspeed, where the pressure loads cause larger deformations.
A multidisciplinary computational model has beendeveloped at the Politecnico di Milano to evaluate, bymeans of numerical optimization, possible geometric andstructural configurations of race car rear wings in order totailor aeroelastic phenomena to maximize car performance.
The model has been applied to the DALLARA Indy carrear wing. The focus of the study has been on the influenceof the structural deformation of the carbon-fiber flap on theaerodynamic loads of the whole rear wing assembly. Futureapplications will investigate the effects of other deformableparts, such as the pillar junctions.
The multidisciplinary optimization requires the develop-ment of a static aeroelastic algorithm to compute thecorrect loads. In this case, CFD is the perfect tool for predicting the complex flow phenomena around the wings,such as the flap influence on the main wing and the twin-vortex recirculation around the gurney flap [1]. FLUENT hasbeen used for the CFD calculation, because it is able to runsteady-state, Reynolds-averaged Navier-Stokes (RANS)models with relatively modest computational resources.
The aeroelastic problem is solved by applying an itera-tive procedure based on a sequence of load calculations bymeans of CFD for a given shape followed by an FEM calcu-lation to compute the deformation based on the CFD loads.The software NASTRAN® is used for the structural calcula-tion, and the sequence is run until convergence is reached.The adoption of two different solvers for the fluid and struc-ture provides the freedom to choose the optimaldiscretization method for each, but it requires the imple-mentation of an interface scheme to transfer the necessary information between the two calculations [2]. To transfer thestructural displacements from the FEM model to the surfaces of the CFD grid and the aerodynamic loads to thestructural nodes, an algorithm based on the weighed movingleast squares (WMLS) method has been developed [3].
The aeroelastic solution is managed in FLUENT soft-ware through a number of user-defined functions (UDFs)that execute the different tasks required by the iterativesolver. Of all the tasks, the most expensive one, requiringalmost half of the solution time, is the deformation of theCFD grid, used to adapt to the new wing shape after eachiteration. The spring-based method in FLUENT software isused for remeshing. It is based on the analogy between thecomputational grid and a network of linear elastic springs,with stiffness inversely proportional to the distance betweenthe respective adjacent nodes. However, the deformationrequired by each time step typically is greater than thedimensions of the cells close to the walls, giving rise to the
The iterative method used to solve the static aeroelastic problem
Compute aerodynamic loads of the deformed body
Compute aerodynamic loads of the rigid body
Transfer aerodynamic loads to structural nodes
Compute structural nodes displacement with the
FEM solver
Check structural convergence STOP
Check FLUENT convergence
Let FLUENT iterate
Move aerodynamic grid
Compute aerodynamic gridwall vertices displacement
Yes
Yes
No
No
¨
¨¨
¨
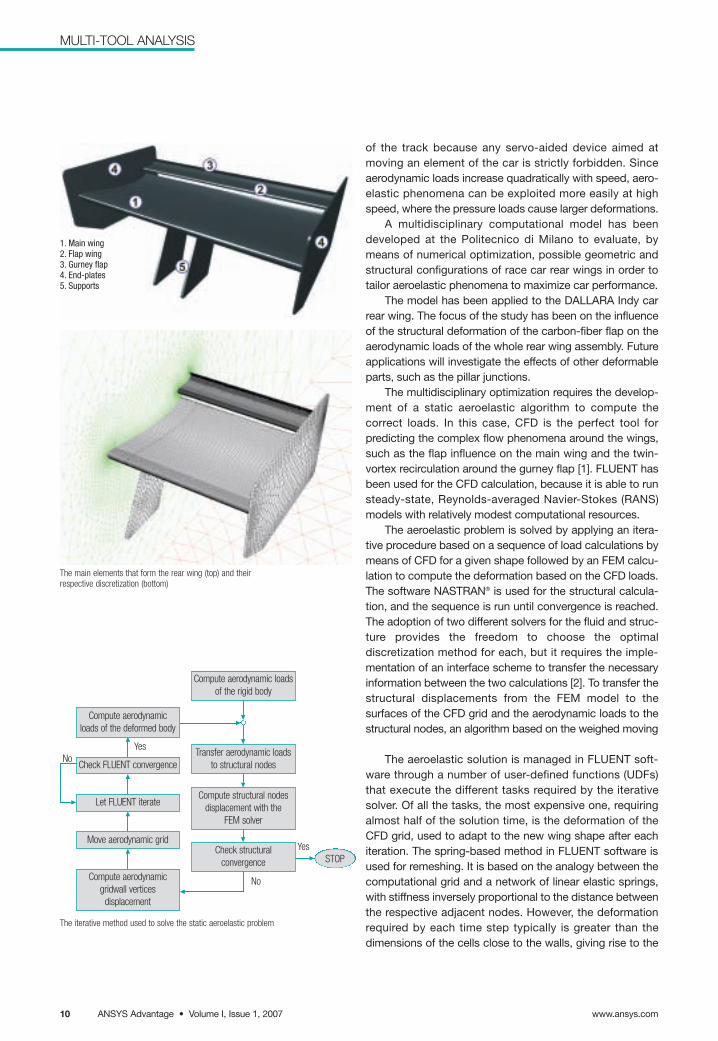
1. Main wing2. Flap wing3. Gurney flap4. End-plates5. Supports
The main elements that form the rear wing (top) and their respective discretization (bottom)

ANSYS Advantage • Volume I, Issue 1, 2007www.ansys.com 11
MULTI-TOOL ANALYSIS
Two examples of a swept wing, introduced as a variable of the multi-objective optimization, are a back-swept (left) and a front-swept (right) wing.
appearance of negative cell sizes. To improve the robust-ness of the method, an algorithm has been implemented toadaptively subdivide the required deformation into sub-steps with achievable deformations.
The net result of the approach has been a multi-objective optimization of both the wing geometry and structural characteristics to increase downforce at lowspeeds and decrease drag at high speeds. The responsesurface method (RSM), driven by the Design of Experiments(DOE) technique [4], has been used to run the cases. Thisapproach limits the total number of required analysis yetallows up to 20 design variables, such as the compositematerial properties, number and orientation of the plies indifferent zones of the wing, the wing angle of attack, thewing sweep and spanwise twist. The optimization [5] is subject to design constraints relative to the fulfillment offlexibility tests required by regulations and material strength.
The results from the calculations show that variations of25 percent on both downforce and drag can be obtained,depending on the aerodynamic configuration. Keeping thesame level of downforce delivered while cornering, wingdrag can be reduced by 3 percent. As a result, the car topspeed can be improved by 1 km/hr, which represents a gainof half a tenth of a second per lap in tracks such as
Barcelona. This initial application has shown the high gainsthat can be potentially achieved by multidisciplinary optimization for race cars. Significant improvements areexpected by applying the proposed method to other aero-dynamic surfaces, such as the front wing and the diffusers. n
AcknowledgmentThe authors wish to acknowledge the help of Ing. Toso of DALLARAfor supporting this research.
References
[1] Aerodynamics of Race Cars, Annual Review of Fluid Mechanics,University of California, U.S.A. (2006).
[2] L. Cavagna, G. Quaranta, P. Mantegazza, E. Merlo, D. Marchetti, M.Martegani: Flexible Flyers in the Transonic Regime, Fluent News,Spring 2006.
[3] G. Quaranta, P. Masarati, P. Mantegazza: A Conservative Mesh-FreeApproach for Fluid-Structure Interface Problems, InternationalConference for Coupled Problems in Science and Engineering,Greece (2005).
[4] D. C. Montgomery: Design and Analysis of Experiments, WileyInternational Edition, New York, U.S.A. (2001).
[5] I. Das, J. Dennis: Normal-Boundary Intersection: An Alternate Methodfor Generating {Pareto} Optimal Points in Multicriteria OptimizationProblems},SIAM Journal on Optimization, 8 (1998).
Pressure coefficient distribution comparison between the rigid (left) and deformed (right) wings
www.ansys.comANSYS Advantage • Volume I, Issue 1, 200712
MULTI-TOOL ANALYSIS
Modern Medicine TakesSimulation to Heart
Could simulation technology more commonly associated with rocket scienceand race cars someday provide insight into the inner workings of the vascularsystem that would help doctors provide improved diagnosis treatment in clinicalsituations? Researchers at the University of Colorado Health Sciences Center(UCHSC) have taken the first steps toward that end, and the ANSYS fluid struc-ture interaction (FSI) solution is proving to be a key enabling technology.
The pulmonary arteries are the blood vessels that carry oxygen-poor bloodfrom the right ventricle of the heart to the small arteries in the lungs. For a healthyindividual, the normal average pressure in the pulmonary artery is about 14 mmHg. For individuals with pulmonary arterial hypertension (PAH), the average pres-sure is usually greater than 25 mm Hg. This increases the load on the right side ofthe heart and can lead to eventual heart failure and death.
Diagnosis and evaluation of PAH typically is accomplished with a combina-tion of cardiac catheterization (in which a plastic tube is passed through the iliacvein in the leg and weaved up the body, through the right side of the heart, andout into the main pulmonary artery) and imaging techniques such as angiography
A fluid structure interaction simulation is performed to capturepatient-specific modeling of hypertensive hemodynamics.
By Kendall S. Hunter, Department of Pediatrics, Section of Cardiology, University of Colorado Health Sciences Center, Colorado, U.S.A.
and magnetic resonance imaging(MRI). While these methods are effective in the diagnosis of vascularpathologies, they cannot currently provide enough detail or be performedwith sufficient frequency to elucidatethe causes of disease progression and are hard pressed to predict the out-come of clinical interventions. To date,clinicians have mainly characterizedPAH by evaluating pulmonary vascularresistance (PVR), defined as the meanpressure drop divided by the meanflow rate. In considering only meanconditions, the effects of vascular stiff-ness are ignored; in patients with PAH,however, these effects can amount to40 percent of the total right heart after-load. Over time, the vasculature canthicken in response to the increasedpressure. Such proximal thickeningand stiffening is believed to changedistal flow and further increase pres-sures; thus, it may be part of afeedback loop by which PAH worsens.
At UCHSC, researchers are investi-gating the impact of proximal arterystiffness by using ANSYS software to simulate the transient fluid struc-ture interaction of the blood flow and vascular walls of the pulmonaryartery. By using numerical simulation,researchers can gain a better funda-mental understanding of the physicsinvolved in PAH and insight into theeffects of vascular stiffness on proxi-mal, and, perhaps more importantly,distal hemodynamics. Eventually, theregular clinical use of patient-specific
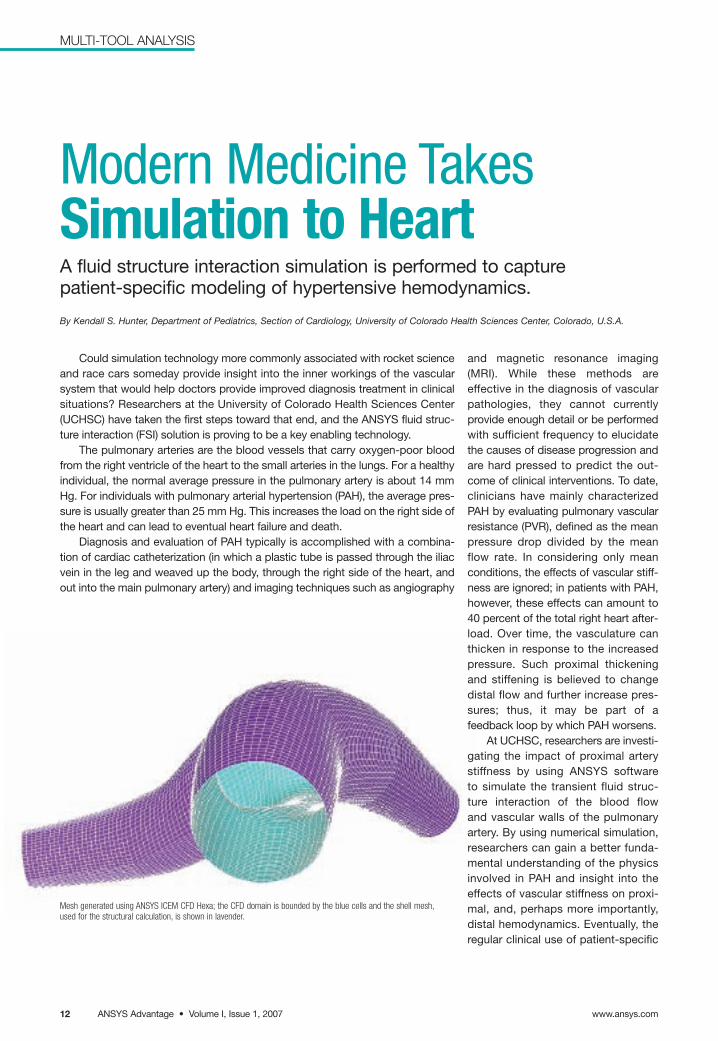
Mesh generated using ANSYS ICEM CFD Hexa; the CFD domain is bounded by the blue cells and the shell mesh,used for the structural calculation, is shown in lavender.
simulation, in which the vasculargeometry is extracted from medicalimaging, could provide better insightinto the progression of PAH andimprove predictions of the outcome ofsurgical intervention.
For the ANSYS FSI simulationsreported here, geometry acquisitionbegins with bi-plane angiography ofthe proximal pulmonary tree performedduring cardiac catheterization of an 18month-old male patient. This providesdata describing the vessel centerlineand diameter. A CAD system is used toturn this skeletal data into a smoothrepresentation of the vessel geometry.The geometry is imported into ANSYSICEM CFD software and the Hexameshing module is used to construct ahigh-quality hexahedral volume mesh.The resulting mesh uses an O-gridinflation layer from all walls so that themesh is nearly orthogonal with excellentcontrol over near-wall spacing. Thismesh is used for the CFD componentof the FSI simulation, solved usingANSYS CFX software. The quad surfaceelements from that same mesh areimported into ANSYS as a shell elementrepresentation of the vessel. This type of representation is a significant advan-
ANSYS Advantage • Volume I, Issue 1, 2007
MULTI-TOOL ANALYSIS
www.ansys.com 13
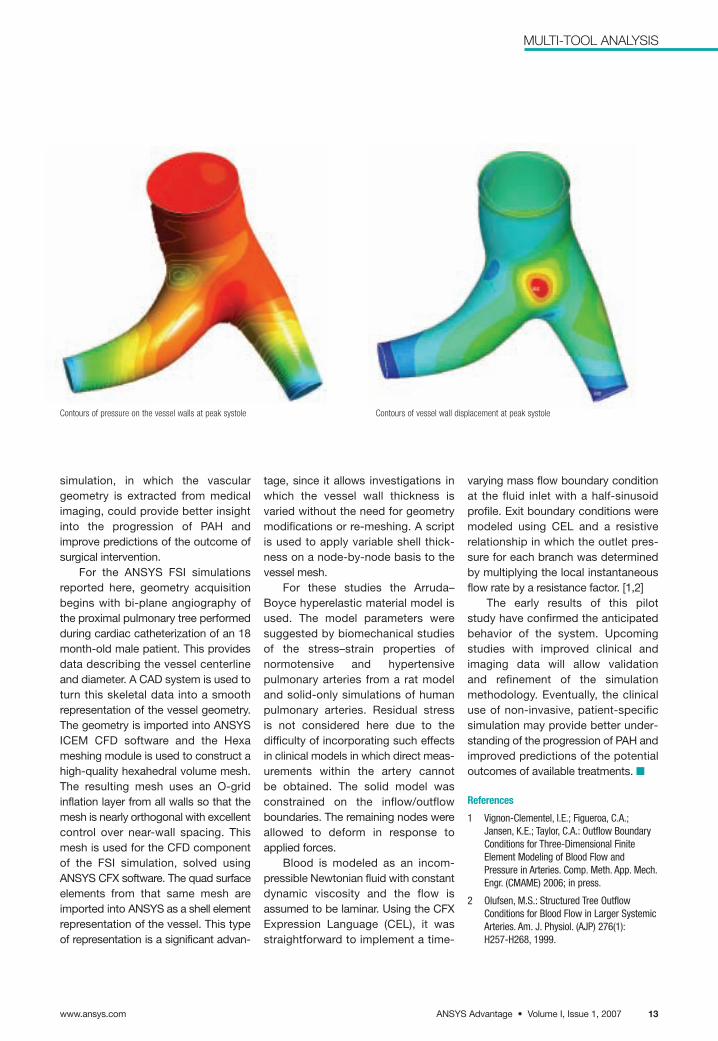
Contours of pressure on the vessel walls at peak systole Contours of vessel wall displacement at peak systole
tage, since it allows investigations inwhich the vessel wall thickness is varied without the need for geometrymodifications or re-meshing. A script is used to apply variable shell thick-ness on a node-by-node basis to thevessel mesh.
For these studies the Arruda–Boyce hyperelastic material model isused. The model parameters were suggested by biomechanical studies of the stress–strain properties of normotensive and hypertensive pulmonary arteries from a rat modeland solid-only simulations of humanpulmonary arteries. Residual stress is not considered here due to the difficulty of incorporating such effectsin clinical models in which direct meas-urements within the artery cannot be obtained. The solid model was constrained on the inflow/outflowboundaries. The remaining nodes wereallowed to deform in response toapplied forces.
Blood is modeled as an incom-pressible Newtonian fluid with constantdynamic viscosity and the flow isassumed to be laminar. Using the CFXExpression Language (CEL), it wasstraightforward to implement a time-
varying mass flow boundary conditionat the fluid inlet with a half-sinusoidprofile. Exit boundary conditions weremodeled using CEL and a resistiverelationship in which the outlet pres-sure for each branch was determinedby multiplying the local instantaneousflow rate by a resistance factor. [1,2]
The early results of this pilot study have confirmed the anticipatedbehavior of the system. Upcomingstudies with improved clinical and imaging data will allow validation and refinement of the simulationmethodology. Eventually, the clinicaluse of non-invasive, patient-specificsimulation may provide better under-standing of the progression of PAH andimproved predictions of the potentialoutcomes of available treatments. n
References
1 Vignon-Clementel, I.E.; Figueroa, C.A.;Jansen, K.E.; Taylor, C.A.: Outflow BoundaryConditions for Three-Dimensional FiniteElement Modeling of Blood Flow andPressure in Arteries. Comp. Meth. App. Mech.Engr. (CMAME) 2006; in press.
2 Olufsen, M.S.: Structured Tree OutflowConditions for Blood Flow in Larger SystemicArteries. Am. J. Physiol. (AJP) 276(1):H257-H268, 1999.

www.ansys.comANSYS Advantage • Volume I, Issue 1, 200714
CONSUMER PRODUCTS
Herman Miller Inc. transformed theresidential furniture industry as Ameri-ca’s first proponent of modern design,beginning in the early 1930s throughcollaborations with iconic figures likeGilbert Rohde, George Nelson, Charlesand Ray Eames, Isamu Noguchi andAlexander Girard. Later the companytransformed the modern office with the world’s first open-plan office systems in the 1960s and the conceptof ergonomic office seating in 1976with the introduction of the Ergon®
chair, followed by the Equa® chair in1984. In 1994, the company launchedthe groundbreaking Aeron® chair.Founded in 1923, the company is oneof the oldest and most respectednames in American design. It has been recognized as a design leader,receiving the Smithsonian’s “NationalDesign Award.” Dozens of its designsare in the permanent collections atmajor museums worldwide, includingthe New York Museum of Modern Art,the Whitney Museum, the Henry Fordand the Smithsonian Institution.
As one of the leaders in high-performance office furniture, HermanMiller set its sights in 2000 on the long-neglected and potentially lucrativemid-priced segment of the market,representing half of all office chairssold worldwide. The goal was to develop the MirraTM chair as an entirelynew reference point for mid-priced
office seating offering ergonomic comfort for a wide range of body typesand postures and easy adjustability for fit and feel. The cost also needed to be kept as low as possible throughreduced part counts and effective useof structural materials, developedcompletely under Design for the Environment (DFE) protocols.
Given these many complex andpotentially conflicting requirements,developing the chair through cycles of trial-and-error physical testing was considered impractical because the approach is expensive, time-consuming, and limits the number ofdesign alternatives to be evaluated.Engineers needed a way to optimize
CAE Takes a Front Seat
By Larry Larder and Jeff WiersmaHerman Miller Inc., Michigan, U.S.A.
The TriFlex back that automatically adjusts to each user was developed as a single composite plasticstructure using analysis to determine the coupled response of the back and its supporting spine.
Herman Miller’s new award-winning Mirra office chairwas developed through virtual prototyping using ANSYS software.
Engineers use ANSYS software to meet complex and potentiallyconflicting requirements to design a chair for a wide range of body types and postures.

ANSYS Advantage • Volume I, Issue 1, 2007
CONSUMER PRODUCTS
www.ansys.com 15
the design early in the development by investigating a wide range of possibilities at that stage. These challenges were met through the useof virtual prototyping, in which “what-if” scenarios can be readily studied inthe computer and hardware testing ismore of a verification of the design atthe end of the cycle.
One of the key virtual prototypingtechnologies selected was ANSYSstructural analysis software, used as the primary tool for determiningstress and deflection on every part of the chair. Engineers routinely used ANSYS DesignSpace to develop major components such as the base,arms, and pedestal. For more complexanalysis, ANSYS DesignSpace modelswere used by an analyst as the basisfor detailed simulation with ANSYSStructural software.
ANSYS Structural played animportant role in the development ofone of the chair’s key assemblies: acantilever leaf spring and moving ful-crum tilt mechanism that provideresistive force so that a person canlean back comfortably. Torque curveswere generated to represent the forcerequired to support various body typesin three seat positions: upright, fully tilted and midway. The analyst wrote atext script file to simulate a range of spring and fulcrum combinations to operate within this torque-curvedesign envelope. Output from ANSYSsoftware included spring deflectionand stress distributions, giving engineers insight into each design sothat they could select and refine theconfiguration that worked best. Theresult was an optimal mechanism thatprovided the range of torque requiredwith only a few simple adjustments.Guided by the simulation, the designmet the company’s objectives of com-fort and adjustability. Moreover, thetext script file will be used as a basis
for developing similar mechanisms inother chair models.
Another major feature of the chairis a “passively adjustable” polypropy-lene back. In contrast to conventionalrigid-back chairs, the pliable TriFlexTM
back design provides the properdeflection according to the user’s posture and movements. This conceptevenly distributes seating forces, thusreducing load concentrations andfatigue. Engineers used ANSYS Structural software to determine thecoupled response of the back and itssupporting spine based on the materialcharacteristics of each part togetherwith the size and geometric pattern ofthe perforated back. Analysis wasused extensively to engineer a singlecomposite plastic structure that deliv-ered the required coupled deflectionresponse, reduced the parts count forthe assembly and conformed to theDFE environmental criteria.
With the aid of simulation, HermanMiller developed an optimal chairdesign that delivered the requiredfunctionality while maintaining thecompany’s high quality standards ofwear and reliability. Prototype testingtime was minimized, with a physicalmock-up used to verify the functionalperformance established throughanalysis. Simulation also enabled
engineers to consolidate parts intointegral modules, thus minimizing partcounts and lowering manufacturingcosts significantly. Due to these andother cost efficiencies, product marginsfor the Mirra have met target objec-tives. In terms of market acceptance,the chair has consistently exceeded the company’s targets for orders andshipments.
Introduced in 2003, the Mirra chairreceived the Gold Award in the Best ofNeoCon industry competition. It wasnamed by FORTUNE magazine as oneof the “Best Products of the Year” andreceived the Chicago AthenaeumMuseum of Architecture and Design’sGood Design Award. The goal of theMirra chair was to set a new referencepoint for the mid-price seating market in terms of ergonomics andadjustability. Simulation with ANSYSsoftware certainly allowed HermanMiller to meet these objectives withadvanced technology that could beintegrated easily into its productdevelopment process. Rather thanmerely fix problems toward the end ofthe development cycle, simulationwas used to guide the design. As aresult, the Mirra is probably one ofHerman Miller’s most successful andhighly engineered products. n
ANSYS Structural software played a key role in the development of the cantilever leaf spring andmoving fulcrum tilt mechanism.

www.ansys.comANSYS Advantage • Volume I, Issue 1, 200716
PHARMACEUTICALS
Transport of Fragile GranulesPneumatic conveying systems in the pharmaceuticalindustry can lead to unwanted particle breakup.By Pavol Rajniak and Rey Chern, Pharmaceutical CommercializationTechnology, Merck & Company, Inc.; U.S.A., Kumar Dhanasekharan, ANSYS,Inc.; Csaba Sinka and Neil MacPhail, Merck Sharp and Dohme, U.K.
Another mimics well-defined stress conditions in simplesetups to identify basic attrition mechanisms [3–5].
The current study demonstrates the use of a more fundamental and scientific approach to study particle attri-tion [6]. It incorporates an experimental program with CFDmodeling of the gas–solid system. Experiments are carriedout on the Malvern Mastersizer DPF, a laboratory-scale drypowder feeder and particle size analyzer from MalvernInstruments, U.K. The Eulerian granular multiphase model isused with the new population balance (PB) module in FLUENT 6.3 software to simulate the motion of the solidand gas phases and attrition within the device. The numerical model makes use of a semi-empirical expressionfor computing the breakage of solid particles. This expres-sion involves the impact velocity of solid phase particles asthey strike the wall and a small set of parameters that areobtained by fitting the model to experimental data.
The particle size distribution (PSD) is an important characteristic of a powder system because it plays a role inthe final product quality. It is routinely measured by laser diffraction using bench-top equipment such as the MalvernMastersizer. The powder under test is fed using a vibratingfeeder and then suspended by a jet of compressed airwhose pressure can be varied. Increasing the air jet pressure produces a finer PSD as a consequence of moreextensive attrition. Below the suspending jet but upstreamof the laser diffraction measurement chamber is a pipebend, a key part of this lab-scale pneumatic conveying system. It generally is recognized that during pneumaticconveying, the particles experience extensive impact loadsat the bends because the flow direction is changing [2]. Forthis reason, the initial CFD calculations were of the bendwhere the particle size distribution could be computedusing the population balance module.
For the experiments, granule samples were analyzed atdifferent inlet air jet pressures ranging from 0.5 to 2 barg
The Malvern Mastersizer particle size analyzer and its dry powder feeder (DPF)
Contours of the solid phase volume fraction with solid phase velocityvectors (left), and Sauter mean diameter (right) in the vicinity of thebend for an inlet jet pressure of 1.5 barg, inlet gas velocity of 30 m/s,average inlet granule diameter of 57.8 µm and granular material density of 1200 kg/m3. The results show the solids collecting near the outer wall of the bend and lowering the Sauter mean diameterbecause of increased attrition.
Laser diffractionmeasurement
chamberTo vacuum
Flexible tube
Regulated airpressure inlet
Inlet for dry powder from
vibrating feeder plate
Pneumatic conveying systems are used at pharmaceu-tical manufacturing sites to transport granular materials.These materials — the active ingredient and various inactiveingredients — are combined to produce granules and thenare transported to tablet presses, where pills are formed.Granule attrition, in which the particles suffer wear as aresult of collisions and friction, can occur during the transport of materials. Even for a dilute mixture, attrition canreduce characteristic particle sizes by as much as 50 per-cent [1] leading to a deterioration in the granule propertiesand potentially compromising the quality attributes of thepharmaceutical product. Experimental and theoretical studies to understand the mechanical impact of conveyingon granules are needed so that formulations, the processingparameters and the pneumatic conveying systems can beoptimized to avoid problems at the large scale. To addressattrition phenomena, different experimental and theoreticalapproaches have been followed. One experimentalapproach has been carried out at various bends, providingstress conditions closely related to industrial processes [2].

ANSYS Advantage • Volume I, Issue 1, 2007www.ansys.com 17
PHARMACEUTICALS
Comparison of the Sauter mean diameter computed from experimentaldata with that predicted by the CFD model using three different sets offitting parameters
Calculated Sauter diameter of solid particles along the lower wall of thepowder feeder at different inlet jet pressures, illustrating the increasedattrition at higher pressures
Inlet jet pressure Pin [barg]
0.00 0.25 0.50 0.75 1.00 1.25 1.50 1.75 2.00
60
50
40
30
20
Experimental data
CFD-PB: v0 = 0.5, kv = 2.0e+9
CFD-PB: v0 = 1.0, kv = 2.0e+9
CFD-PB: v0 = 1.0, kv = 3.1e+9
Curve length of the lower wall
0.00 0.02 0.04 0.06 0.08 0.10 0.12 0.14
6.0e-5
5.5e-5
5.0e-5
4.5e-5
4.0e-5
3.5e-5
3.0e-5
2.5e-5
Pin = 0.50 barg
Pin = 1.00 barg
Pin = 1.50 barg
Pin = 2.00 barg
models can be employed after fitting to experimental datafor predicting attrition and breakage in large-scale pneumaticconveying systems and to assess the suitability of a givenbatch of granular material for larger scale processing. n
References
[1] Chapelle, P.; Abou-Chakra, N.; Christakis, N.; Bridle, I.; Patel, M. K.;Baxter, J.; Tuzun, U.; Cross, M.: Numerical Predictions of ParticleDegradation in Industrial-scale Pneumatic Conveyors. PowderTechnology 143-144: 321–330, 2004.
[2] Kalman, H.: Attrition of Powders at Various Bends During PneumaticConveying. Powder Technology 112: 244 – 250, 2000.
[3] Salman, A. D.; Hounslow, M. J.; Verba, A.: Particle Fragmentation inDilute Phase Pneumatic Conveying. Powder Technology 126:109–115, 2002.
[4] Zhang, Z.; Ghadiri, M.: Impact Attrition of Particulate Solids: Part 2.Experimental Work. Chem. Eng. Sci. 57: 3671–3686, 2002.
[5] Gentzler, M.; Michaels, J. N.: Impact Attrition of Brittle StructuredParticles at Low Velocities: Rigorous Use of a Laboratory VibrationalImpact Tester. Chem. Eng. Sci. 59: 5949–5958, 2004.
[6] Rajniak, P.; Dhanasekharan, K.; Sinka, C.; MacPhail, N.; Chern, R.;Fitzpatrick, S.. Modeling and Measurement of Granule Friability. FifthWorld Congress on Particle Technology (Conference Proceedings CDVol.2): 23-27, Orlando, FL, U.S.A., April 2006.
[7] Diemer, R. B.; Spahr, D. E.; Olson, J. H.; Magan R. V.: Interpretation ofSize Reduction Data via Moment Models. Powder Technology 156:83–94, 2005.
(bars gauge). Moments m0, m1, m2, and m3 of the originalPSDs were evaluated using the relationship:
in which ni is the volumetric number of particles in class i having characteristic size (diameter) Li. The moments arecompared in Table 1 for the range of jet pressures tested. Allof the moments increase with increasing inlet jet pressure asa consequence of attrition, with the exception of m3. Thismoment is a relative measure of the preserved volume ofgranules, so should be independent of the inlet pressure. Acomparison of the Sauter mean diameter, d32 = m3 /m2, widelyused to characterize a PSD, also is presented in the table. Asexpected, the increased attrition at higher jet pressures is inevidence as the Sauter mean diameter steadily drops.
Pin (barg) 0.5 1.0 1.3 1.5 2.0
m0 .10-15 [ #/m3] 7.744 9.982 13.010 14.442 20.468
m1 .10-9 [m/m3] 6.164 8.301 11.198 12.884 17.762
m2 .10-4 [m2/m3] 3.304 3.978 4.672 5.120 5.950
m3 [m3/m3] 1.910 1.910 1.910 1.910 1.910
d32 .106 [m] 57.81 48.01 40.88 37.30 32.10
Table 1: First moments of the particle size distribution for a range of experimental inlet pressures
CFD results from a 2-D model of the bend were used toprovide insight on the behavior of the solids as they travelthrough this region of the dry powder feeder. In particular,they show that the velocity gradients are highest in thebend. Contours of the Sauter mean diameter and volumefraction of solids, also computed using the CFD model,show a significant decrease of the particle diameter at thebend, suggesting increased attrition in this region. X-Y plotsof the solid velocity magnitude and of d32 along the lowerwall provide further insight into the flow and breakage phenomena in the process. These plots also indicate breakage around the bend of the transport pipe, suggesting that improvements to the transport system are needed.Currently, Merck and ANSYS are continuing studies that incorporate multiple breakage in 3-D geometries to further evaluate both lab-scale and plant-scale powderhandling equipment.
Parametric studies also were performed to investigatethe impact of different model parameters on the extent ofbreakage and resulting shape of the PSDs, as characterizedby the PSD moments. The particle breakup model satisfac-torily predicted the experimental Sauter mean diameter, butthe lower moments, m0 and m1, were under-predicted. Thiscould be due to breakage that results from an erosionmechanism similar to that reported in the literature for astirred ball milling application [7].
The methodology illustrated here allows engineers tocorrelate the observed changes in particle size with theshear forces or impact velocities within the system. It is assumed that analogous physically based models combining properties of the gas–solid flow with the PB
www.ansys.comANSYS Advantage • Volume I, Issue 1, 200718
CHEMICAL PROCESSING
Mixing vessels are widely used inthe chemical, petrochemical, pharma-ceutical, biotechnology and foodprocessing industries to optimize mixing and/or heat transfer. Mixingmust be efficient, precise and reproducible to ensure optimum product quality. Quantities of interestmay include mixing times, power draw,local shear and strain rates, and solidsdistribution. In the chemical industry, for example, fast mixing of reactive substances is desired to achieve anefficient reaction. The optimum impellershould produce a highly turbulent flowto reduce segregation and minimize themass and energy transport limitation for
Solid Suspensions Get a LiftA high efficiency hydrofoil is designed using CFD and multi-objective optimization software.
By Nicolas Spogis, Engineering Simulationand Scientific Software (ESSS), InternationalTrade Center, Brazil and José Roberto Nunhez, Department ofChemical Engineering, University ofCampinas (UNICAMP), Brazil
the chemical reaction. For biochemicalapplications, on the other hand, there isa need to carefully suspend micro-organisms in bioreactors so the cells arenot exposed to high shear rates, whichcan lead to their destruction. Over the years, the wide variety of mixing applications has led to a widevariety of impellers and vessels, making the choice of the right mixingequipment a challenge for the processengineer. In a project recently completedat the University of Campinas (UNICAMP) in Brazil, an optimizationprocedure was applied to the design ofan impeller to illustrate how thisapproach can lead to more efficient mixing processes in general.
The suspension of solid particles in a stirred tank was used to illustratethe methodology. Solid–liquid mixturesappear in applications ranging from themining industry to the pharmaceuticalindustry. The parameters that affectsolid suspensions are the shape andsize distribution of the solid particles,the solid concentration and density,and the liquid density and viscosity.When choosing the right equipment forsolid–liquid mixing, it is important tounderstand how the flow pattern gener-ated by the impeller affects the solidsdistribution within the vessel. Abrasionand impeller wear also are importantfactors to consider. On the economicside, minimization of the powerrequired to achieve a desired distribu-tion is important, as is the cost andexpected lifetime of the impeller andvessel materials. All of these aspects ofmixing depend on the geometry of theequipment, the solid and liquid proper-ties, and the impeller speed.
The engineers at UNICAMP usedANSYS CFX software for the projectalong with modeFRONTIERTM, a multi-objective design optimization tool from
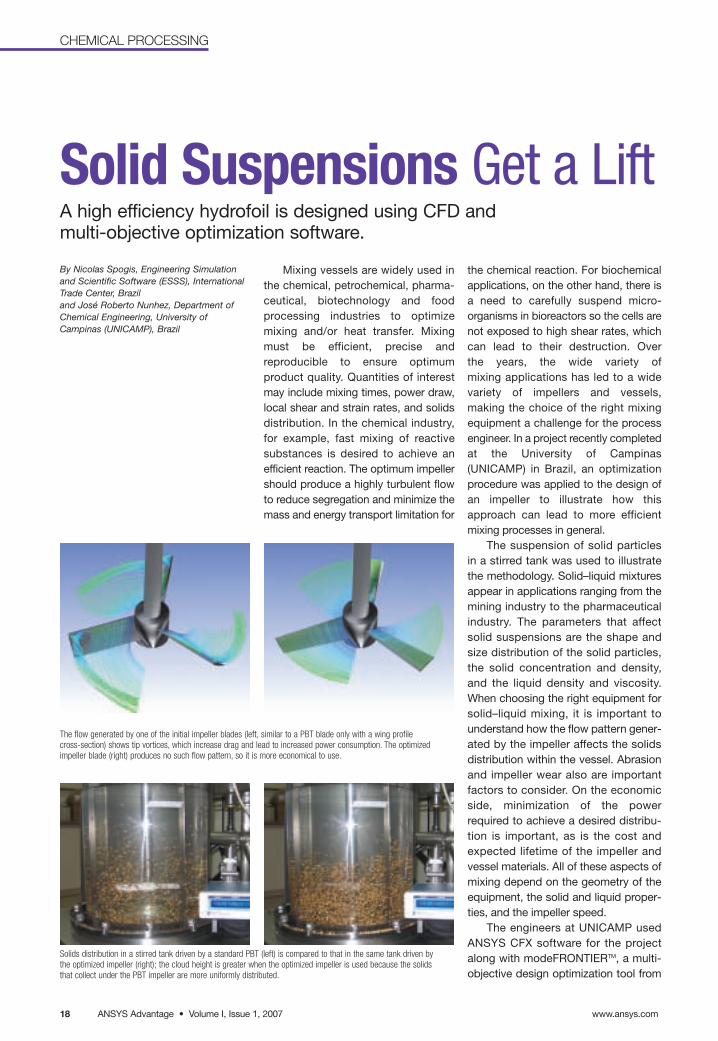
Solids distribution in a stirred tank driven by a standard PBT (left) is compared to that in the same tank driven bythe optimized impeller (right); the cloud height is greater when the optimized impeller is used because the solidsthat collect under the PBT impeller are more uniformly distributed.
The flow generated by one of the initial impeller blades (left, similar to a PBT blade only with a wing profile cross-section) shows tip vortices, which increase drag and lead to increased power consumption. The optimizedimpeller blade (right) produces no such flow pattern, so it is more economical to use.
ANSYS Advantage • Volume I, Issue 1, 2007
CHEMICAL PROCESSING
www.ansys.com
the Italian company ESTECO. CFD haslong been used in the process indus-tries for mixing analysis because it ismore cost-effective than experimentalwork and provides a reliable alternativeto the guess-work associated withprocess scale-up. The use of CFD forimpeller optimization makes the technology even more powerful fordelivering benefits ranging from cost-savings to improved product quality.
For the system of interest, a 120°sector tank model was created and ahybrid mesh of approximately 700,000cells was created. Turbulence wastaken into account through theshear–stress transport (SST) k-ωmodel coupled with the streamline cur-vature option. These modeling choiceswere made so that the impeller bladeflow separation could be captured inan accurate manner. The SST k-ωmodel combines the advantages ofboth the k-ε and standard k-ωapproaches, ensuring a proper rela-tionship between the turbulent stressand turbulent kinetic energy. The multiple frames of reference optionwas used for the steady-state model of the rotating impeller, with a frozen
rotor reference frame change appliedat the interface.
A robust, stochastic algorithm inmodeFRONTIER called MOGAII wasused for the automated optimizationprocess. This multi-objective, con-strained shape approach allowed forseven design variables with two nonlinear constraints. The designswere compared in their ability to meettwo objectives: to increase the impellereffectiveness, defined as the ratio ofpumping number to power number (inother words, the ratio of the pumpingcapacity to power consumed, normal-ized to be dimensionless), and toimprove the homogeneity of the liquid–solid mixture (by increasing thecloud height). The initial group ofimpeller shapes had well-known pro-files, such as the NACA0012. Theperformance of the final optimizeddesign was compared to that of a stan-dard four (flat)-bladed, 45˚ pitchedblade turbine (PBT45).
MOGAII’s search method has twodesirable aspects. First, it allows global solutions to be found and second, it guarantees an actual multi-objective optimization and allows for
the definition of the Pareto frontier, a set of equally optimal designs, at the end of the procedure. Traditionaloptimization algorithms transformmulti-objective problems into mono-objective ones using weighted sums ofobjective functions. This research didnot select the best impeller shape inthese terms. Rather, the optimizationalgorithm allowed for the entire Paretofrontier, that is, the complete set ofacceptable solutions, to be determined,so that all designs that were not domi-nated by others could be analyzed.
The optimization process wasdivided into two main steps:
1. A real optimization step, in whichthe objective functions and constraints were evaluated by theCFD approach.
2. A virtual optimization step, inwhich well-behaved responsesurfaces were used to extra-polate the initial results, savingcomputational time.
The PBT45 has a low dischargeangle and, hence, a low pumpingeffectiveness and poor solid suspen-sion. The optimized impeller, on theother hand, determined by the processdescribed above, was found to have ahigh discharge angle (parallel to the shaft), resulting in both a higherpumping effectiveness and a more uniform solid suspension. When compared to the PBT45, the optimizedimpeller has a reduced solid accumu-lation at the bottom of the vessel, evendirectly below the shaft. The varianceof the concentration is low as well,indicating a more homogenous sus-pension. Specifically, for the optimizedimpeller, the solid concentration vari-ance was reduced by 48.5 percent andpower consumption was reduced by84.4 percent while pumping effective-ness was increased by 410.2 percent.In addition, an experimental validationwas carried out to validate the numerical results, and very goodagreement was obtained. n
www.feq.unicamp.br/~nunhez
19
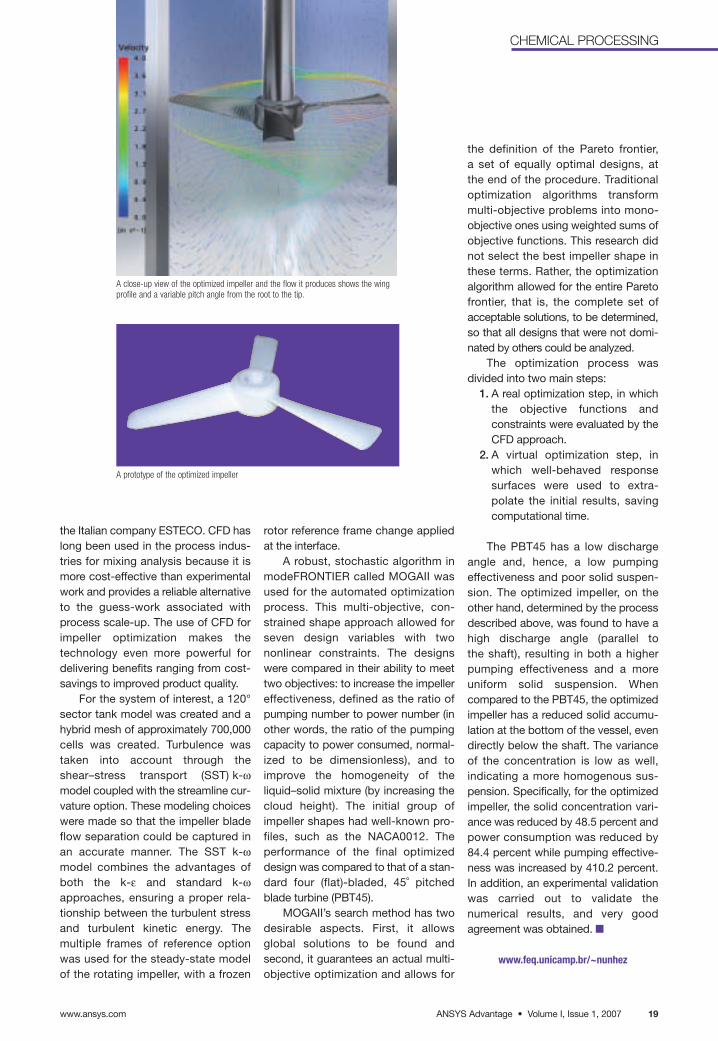
A close-up view of the optimized impeller and the flow it produces shows the wingprofile and a variable pitch angle from the root to the tip.
A prototype of the optimized impeller

www.ansys.comANSYS Advantage • Volume I, Issue 1, 200720
GLASS
Colored glass products have manycommercial applications. One way tochange the color of molten glass is to add a colorant material to one particular channel of the glass furnacecalled the forehearth (F/H). The fore-hearth is where molten glass isconditioned while being transported tothe downstream forming machines. Byadding colorant to one of the fore-hearth channels, the original color ofglass can remain unchanged in themelting tank. A CFD project has beenunder way at the Research Center ofSISECAM to develop a numericalmodel for the coloration of glass meltin an F/H for the production of table-
ware products. The model simulatesthe coloration phenomenon of theglass melt by calculating the distribu-tion of the colorant agent in the glassmelt as it flows through the channel.
Coloration is essentially anunsteady mixing process of two ormore fluids resulting from natural (diffusion) and forced (advection)mechanisms. Molecular diffusion canbe from a point source in a static fieldor from a point source in a velocity fieldin which relative motion exists betweenthe source and the field. Therefore, thespread of a colorant, referred to as“frit,” in molten glass can be obtainedby solving Fick’s second law for
diffusion when the source and otherboundary conditions are defined. Theadvection process is driven by themovement of the fluid, which is moltenglass in the case of the forehearth.Because the colorant is carried in alldirections by the flow in the F/H, a 3-Dtime-dependent species transportequation must be solved to track itsdistribution throughout the glass melt.
In addition to the CFD work, a setof experimental studies also has beenperformed at SISECAM to obtain thediffusion coefficient of the frit in themolten glass. Measurements madeuse of a laboratory setup based onimage processing of a time-lapsed
Two views showing the pathlines of molten glass flow in the vicinity of the stirrers in the forehearth
The forehearth channel of afurnace, showing the exitspout in the lower right corner
TheMany Colorsof GlassNumerical simulation helps guidethe color change process in theglass industry.By Mustafa Oran, SISECAM Research Center, Turkey
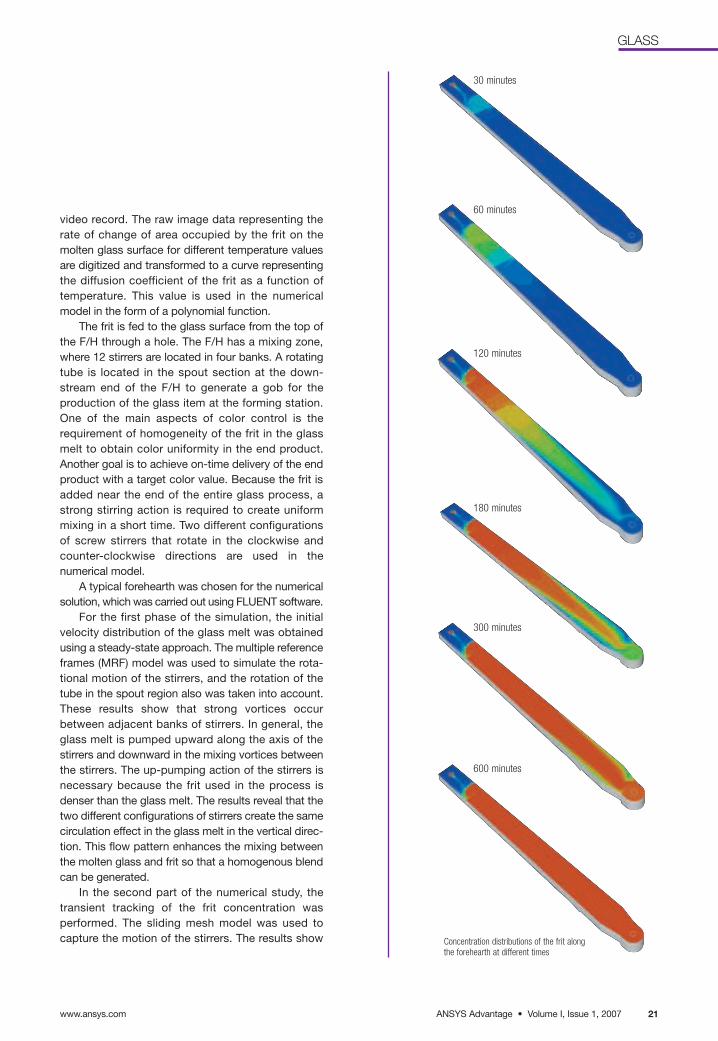
Concentration distributions of the frit alongthe forehearth at different times
30 minutes
60 minutes
120 minutes
180 minutes
300 minutes
600 minutes
ANSYS Advantage • Volume I, Issue 1, 2007
GLASS
www.ansys.com 21
video record. The raw image data representing therate of change of area occupied by the frit on themolten glass surface for different temperature valuesare digitized and transformed to a curve representingthe diffusion coefficient of the frit as a function of temperature. This value is used in the numericalmodel in the form of a polynomial function.
The frit is fed to the glass surface from the top ofthe F/H through a hole. The F/H has a mixing zone,where 12 stirrers are located in four banks. A rotatingtube is located in the spout section at the down-stream end of the F/H to generate a gob for theproduction of the glass item at the forming station.One of the main aspects of color control is therequirement of homogeneity of the frit in the glassmelt to obtain color uniformity in the end product.Another goal is to achieve on-time delivery of the endproduct with a target color value. Because the frit isadded near the end of the entire glass process, astrong stirring action is required to create uniformmixing in a short time. Two different configurations of screw stirrers that rotate in the clockwise andcounter-clockwise directions are used in the numerical model.
A typical forehearth was chosen for the numericalsolution, which was carried out using FLUENT software.
For the first phase of the simulation, the initialvelocity distribution of the glass melt was obtainedusing a steady-state approach. The multiple referenceframes (MRF) model was used to simulate the rota-tional motion of the stirrers, and the rotation of thetube in the spout region also was taken into account.These results show that strong vortices occurbetween adjacent banks of stirrers. In general, theglass melt is pumped upward along the axis of thestirrers and downward in the mixing vortices betweenthe stirrers. The up-pumping action of the stirrers isnecessary because the frit used in the process isdenser than the glass melt. The results reveal that thetwo different configurations of stirrers create the samecirculation effect in the glass melt in the vertical direc-tion. This flow pattern enhances the mixing betweenthe molten glass and frit so that a homogenous blendcan be generated.
In the second part of the numerical study, thetransient tracking of the frit concentration was performed. The sliding mesh model was used to capture the motion of the stirrers. The results show

www.ansys.comANSYS Advantage • Volume I, Issue 1, 200722
GLASS
that a considerable amount of frit reaches the stirringzone 30 minutes after feeding, following the flow pat-tern of the glass melt. Axial slices of frit concentrationshow that the initial direction of the frit motion istoward the bottom of the channel while only a smallamount of frit travels near the glass surface. Thisresult occurs because of the high density of the frit,which tends to sink toward the bottom of glass immediately after feeding. As the time proceeds, mostof the frit is pumped upward as it passes through thestirring zone. There, the frit and molten glass are progressively mixed and a uniform distribution isgradually achieved.
Mixing between the glass melt and frit is acceler-ated in the stirring zone and, after one hour, a cross-sectional view of each stirrer bank shows a more orless homogenous frit distribution. As the colorationprocess continues, the target concentration of frit isobtained homogenously in the stirring zone beforethree hours have passed. The simulation shows thatthe target value of frit (0.5 percent of the pull rate) is uniformly distributed along the F/H well before 10 hours.
The color of the final glass gob does not changeduring the first 90 minutes. After that point the glassgradually changes color, but the production glass isnot discarded because the early color changes arenot visible and the product can still be accepted com-mercially. The simulations show that the target valueof frit concentration at the end of the forehearth isobtained after nine to 10 hours, whereas the realprocess in the plant starts to accept the new colorvalue after eight to nine hours. Since the variation infrit concentration during the final hour is very small,the numerical simulations can be safely accepted forpractical use. n
www.sisecam.com
Developing Power30 minutes 180 minutes
300 minutes 600 minutes
Integrating ANSYS technologywith other software enabledresearchers to efficiently assesscomponent reliability for ceramicmicroturbine rotors.
By Stephen Duffy, Connecticut Reserve Technologies Inc. Ohio, U.S.A.
Microturbines a few inches in diameter are criticalcomponents in compact co-generation units that produce electrical power. These modular distributedpower systems are intended to operate on-site atmanufacturing plants and other facilities as a source ofeconomical and reliable electrical power, thus avoidingthe high cost and vulnerability to power outage of public utility lines.
Advanced structural ceramics such as siliconnitride enable microturbines to operate at higher temperatures than conventional metal alloys, whichtranslates into significant fuel savings and emissionsreductions. However, ceramics exhibit large variationsin fracture strength, particularly with inherent flawsresulting from various surface treatments. Accountingfor these complex statistical strength distributions willlead to more accurate predictions of expected compo-nent life, expressed as component reliability as afunction of time.
Two algorithms work in conjunction with oneanother to provide the probabilistic design approachesrequired to determine ceramic reliability predictions.The ceramic analysis and reliability evaluation (CARES)algorithm originally was developed at NASA GlennResearch Center to determine component reliabilitybased on temperature and stress fields. The CRTWeibPar algorithm was developed at ConnecticutReserved Technologies Inc. to determine the prob-ability of failure for ceramic components.
These algorithms were upgraded under the U.S. Department of Energy (DOE) Distributed Energy Program to specifically utilize features of ANSYSStructural analysis software. As part of the program,which is administered by Oak Ridge National Laboratory, engineering consulting firm Connecticut
The vertical spread of the frit below the glass surface at different times

ANSYS Advantage • Volume I, Issue 1, 2007
POWER GENERATION
www.ansys.com 23
Reserve Technologies used the software in a project todetermine the material requirements for a blade that wasbeing developed for a microturbine manufactured byIngersoll-Rand Company.
One of the challenges in the project has been definingand implementing a method that establishes Weibull distribution metrics for silicon nitride suppliers based onthe particular component. In establishing these metrics,service stress states from the various treated surfaces of a
First principle stress (psi) from a cold start on Ingersoll-Rand’s ceramicmicroturbine vane
The mesh used for the rotor vane analysis
Photos of the Ingersoll-Rand microturbine rotor shown from the bottom (left) and top (right). All surfaces on the bottomand three surfaces on the top are ground. All others are as-fired.
rotor blade must be combined with a stipulated componentreliability to develop material performance curves. Thesecurves must be scaled to standard ceramic bend bar testspecimens, making component requirements more readilyunderstood by material suppliers.
Through the use of ANSYS Parametric Design Language(APDL), surfaces of a rotor component with specified finishesare identified, the ANSYS results file is queried and stressesare mapped to the relevant element surfaces. Failure data isanalyzed using WeibPar. Using information generated byANSYS (geometry and stress state), the CARES algorithmcomputes component reliability. The openness of ANSYStechnology and the ease of integration with other softwareenabled the ANSYS, CARES and WeibPar programs to oper-ate together in a smooth and efficient manner.
The resulting design approach has allowed changes andimprovements in system requirements to take place readilyin parallel with enhancements in material properties. In thepast, this was typically a series process in which systemengineering would follow improvements in ceramic materials.Now material characterization maps can be quickly generatedfor a given component under specified operating conditions.The information can influence the goals of a ceramic materialsdevelopment program and better guide engineers toward anoptimal design.
“ANSYS continues to be critical iterative software fordesign optimization and probabilistic lifing of structuralceramic components under consideration for advanced turbine engines,” notes Dr. Andrew Wereszczak, senior staffscientist at Oak Ridge National Laboratory. “Ultimately, theever-increasing versatility and capabilities of ANSYS areallowing structural designers to increase their confidence in,and rate component designs.” n
Surface Type 2Ground surfaces
Surface Type 2As-fired surfaces
Systems that Can Take the Heat

Client PENGUIN COMPUTING
Ad Title CAE – High Density Cluster
JOB#
Publication ANSYS MAGAZINE
Issue FEBRUARY 2007
Agency Big Arrow Group 917-513-2405
OK Agency
OK Client
T H E P E N G U I N
F L I E S F I R S T
PENGUIN HIGH DENSITY CLUSTER. The highest density, modular blade server architecture on the market. With powerful Scyld ClusterWareTM HPC for single point command and control, and AMD Dual Core OpteronTM for a highly productive user experience.
PENGUINCOMPUTING
REALLIFELINUX
Penguin Computing and the Penguin Computing logo are registered trademarks of Penguin Computing Inc. Scyld ClusterWare and the Highly Scyld logo are trademarks of Scyld Computing Corporation. AMD Opteron and the AMD logo are trademarks or registered trademarks of Advanced Micro Devices, Inc. Linux is a registered trademark of Linus Torvalds. ©2006 Penguin Computing, Inc. All rights reserved.
www.penguincomputing.com
Skip the distal prototype phase and get your designs o�the ground faster. With Penguin, it’s plane and simple. Penguin Computing® Clusters combine the economy of Linux with the ease of Scyld. Unique, centrally-managed Scyld ClusterWare HPCTM makes large pools
of Linux servers act like a single virtual system. So you get supercomputer power, manageability and scalabil-ity, without the supercomputer price. So upgrade your design cycle. Let the simulations �y. And whatever you do, don’t eat the �sh.

Spotlight on Engineering Simulation in the
Sports and LeisureIndustry
A D V A N T A G E
s10 Speeding Up Development Time for Racing Cycles
s11 Scoring an HVAC Goal for Hockey Spectators
s13 Taking a Bite out of Sports Injuries
s15 Designing Fitness Equipment to Withstand the Workout
s16 Catching a Better Oar Design
s2 Sporting Swifter, Higher andStronger Performances withEngineering Simulation
s4 Catching the Simulation Wave
s6 Giving Ski Racers an Edge
s8 Ice Axe Impacts
s9 Tour de Force!

www.ansys.comANSYS Advantage • Volume I, Issue 1, 2007s2
Sporting Swifter, Higher and
Stronger Performanceswith Engineering SimulationComputer-aided engineering plays a major role in the world of sports.
SPORTS: OVERVIEW
Close up of airflow vectors and surface pressure predictions on a golf balland #3 iron just after being struck, computed using ANSYS CFX software
The sports and leisure Industry has seen some profoundchanges during the last 25 years, especially in the areas ofnew product design, innovation and development. Indeed,there has been an explosion of professional sporting andleisure activities, driven by consumers having more disposable income to spend and multi-channel 24-hour TV,hungry for content and information. In the last decade alone,the amount of money pouring into elite sport has hit staggering heights. The seven-time German Formula 1Motor Racing World Champion, Michael Schumacher, hasbeen estimated to have earned $1 billion throughout his 15-year career, and the American golfer, Tiger Woods, is notthat far behind. Major sporting events are now linked withmajor business opportunities, and the worldwide sports andleisure industry is estimated to be worth about $500 billionper year while growing at 3 percent per annum.
The push to involve science and engineering in sportshas been led by motor racing in a quest for that elusivefraction of a pecentage point improvement in performancethat can lead to victory. New engineering tools and disci-plines like computer-aided engineering (CAE) are nowmajor transforming agents for this industry. CAE allows forvirtual design and testing techniques to be applied to allaspects of sport and leisure equipment development.Modern CAE software tools provide a cost-effective way ofassessing new products and product innovations in whatwere previously lengthy product design turnaround times.
Many elite athletes, teams and sports equipment manufacturers now are realizing that they can derive competitive aerodynamic and structural advantages fromadvanced fluid flow and structural modeling technologies.Computational fluid dynamics (CFD) in particular is an integral part of the CAE process in many sports today,where the technology leads to performance gains that easily justify the financial outlays for hardware and software.
By Keith Hanna, ANSYS, Inc.
Close up of a golf ball deforming after being struck in a fluid structure interaction simulation, computed using ANSYS AUTODYN software

ANSYS Advantage • Volume I, Issue 1, 2007www.ansys.com s3
An increasing drive toward cheaper, easier to use CAE soft-ware coupled with the ready availability of increasinglymore powerful computers have led to an expansion innumerical simulation for numerous sporting applications.CAE now is being used routinely to help explain physicalphenomena in both competition and training scenarios. It isindispensable in the design of better equipment, where it isused to improve safety, comfort and efficiency.
In the world of Formula 1 racing, for example, the leading teams are pushing toward once unimaginable 1 billion cell CFD calculations. The BMW Sauber F1 Teamrecently announced the launch of its 1,056 processorsupercomputer, Albert2, one of the largest industrial com-puting installations in the world, aimed solely at doing CFD calculations. Indeed, the team chose the supercomputerroute rather than building a second wind tunnel as theirpreferred way forward for aerodynamic race car design andimprovement.
In the world of America’s Cup Yachting, the coast ofValencia, Spain, soon will see some of the richest multi-national teams vying to win one of the oldest and mostprestigious sports trophies in the world. ANSYS has hadthe privilege of supplying two teams in the last decadewho, between them, have been winners of the last three America’s Cups: Team New Zealand (twice) and the Swissteam Alinghi. These teams have used ANSYS software todesign their ship hulls, appendages and sails to millimeter
tolerances. In 2007, nearly all of the Americas Cup competitors will have used ANSYS software in one form oranother prior to the start of the competition.
In this sports and leisure industry supplement, a varietyof CAE applications are illustrated that emphasize the widespread use and importance of this exciting tech-nology. Both solid mechanics and fluid dynamicsphenomena are represented in applications that range frombicycles to alpine skis, ice axes to racing oars, and surfboards to mouthguards. Ventilation schemes for sportsarenas are reviewed, as are important design considera-tions for fitness equipment. In each case, the applicationhas benefited in some way from ANSYS engineering simulation software. With the Summer Olympics in Beijingfast approaching in 2008 and the soccer World Cup inSouth Africa in 2010, computer simulation will be stronglyimpacting this industry in the years to come. Whether it ismultinational equipment giants or niche elite sport teams,many will recognize the benefits that Simulation DrivenProduct Development can bring to their business or sporting goals. n
Suggested ReadingHanna, R.K.: Going Faster, Higher and Longer in Sport with CFD.1st International Conference on Engineering in Sport, Sheffield,U.K., 1996.
It is generally known that cyclists riding in a pack expend significantly less energy when drafting behind another rider. In a recent study by Dale Apgar at Dartmouth College, CFD wasused to study four cyclists in a line (left) and in a small peloton (right). The results showed that in the line configuration, the last cyclist experiences 46 percent less drag than the leadrider. In the four-man peloton, the two side riders experience more drag than the first rider, suggesting difficulty for other cyclists to overtake the leader. The result may not be true forlarger pelotons. Pressure contours on the individual cyclists, shown above, were used to compute the drag.
SPORTS: OVERVIEW
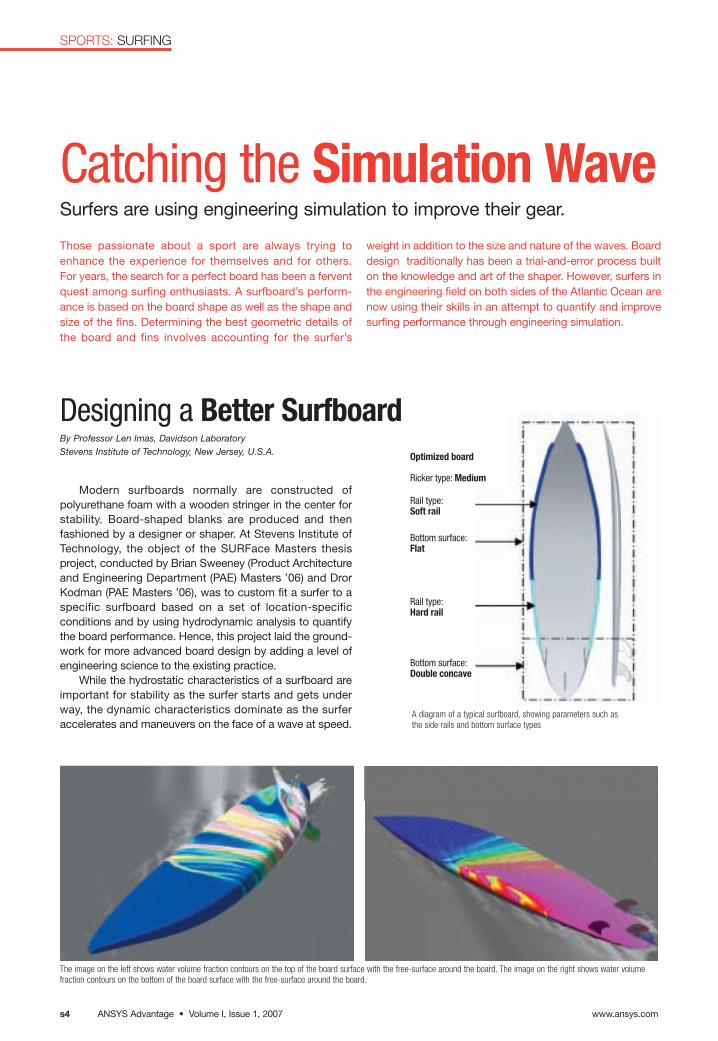
www.ansys.comANSYS Advantage • Volume I, Issue 1, 2007s4
SPORTS: SURFING
Catching the Simulation WaveSurfers are using engineering simulation to improve their gear.
Those passionate about a sport are always trying toenhance the experience for themselves and for others. For years, the search for a perfect board has been a ferventquest among surfing enthusiasts. A surfboard’s perform-ance is based on the board shape as well as the shape andsize of the fins. Determining the best geometric details ofthe board and fins involves accounting for the surfer’s
weight in addition to the size and nature of the waves. Boarddesign traditionally has been a trial-and-error process builton the knowledge and art of the shaper. However, surfers inthe engineering field on both sides of the Atlantic Ocean arenow using their skills in an attempt to quantify and improvesurfing performance through engineering simulation.
Modern surfboards normally are constructed ofpolyurethane foam with a wooden stringer in the center for stability. Board-shaped blanks are produced and thenfashioned by a designer or shaper. At Stevens Institute ofTechnology, the object of the SURFace Masters thesis project, conducted by Brian Sweeney (Product Architectureand Engineering Department (PAE) Masters ’06) and DrorKodman (PAE Masters ’06), was to custom fit a surfer to aspecific surfboard based on a set of location-specific conditions and by using hydrodynamic analysis to quantifythe board performance. Hence, this project laid the ground-work for more advanced board design by adding a level ofengineering science to the existing practice.
While the hydrostatic characteristics of a surfboard areimportant for stability as the surfer starts and gets underway, the dynamic characteristics dominate as the surferaccelerates and maneuvers on the face of a wave at speed.
Designing a Better SurfboardBy Professor Len Imas, Davidson LaboratoryStevens Institute of Technology, New Jersey, U.S.A.
A diagram of a typical surfboard, showing parameters such asthe side rails and bottom surface types
The image on the left shows water volume fraction contours on the top of the board surface with the free-surface around the board. The image on the right shows water volumefraction contours on the bottom of the board surface with the free-surface around the board.
Optimized board
Ricker type: Medium
Rail type:Soft rail
Bottom surface:Flat
Rail type:Hard rail
Bottom surface:Double concave

Research on the hydrodynamics ofsurfboard fins has been under way atthe University of Wales, Swansea, for anumber of years. The primary aim hasbeen to gain a better understanding ofhow the moving water interacts withdifferent shapes and sizes of fins andhow the hydrofoil shape of the finaffects the drag and lift forces that aregenerated. The underlying philosophyis that higher lift-to-drag ratios may result in greater velocities in the water when surfing and hence better performance.
Surfboard fins are complex three-dimensional hydrofoils. Creating solidmodels of fins, which are essentiallyscaled down versions of aircraft wings,can take a long time using comm-ercial CAD programs. As a remedy, custom software called Fin DesignerTM
(www.datdesigner.co.uk/index.htm) hasbeen developed specifically to reducefin design time to a matter of minutes,while allowing the designer to retainparametric information on componentsthat are important in design analysis,such as the NACA foil shapes at various cross-sections.
An experimental apparatus hasbeen built to measure lift and dragforces on objects in an existingsquare-section flume, and FLUENTsoftware is successfully predictingthese forces at experimentally limitedReynolds number flows, substantiallylower than those found in reality. However, once the CFD models havebeen fully validated, the research team
ANSYS Advantage • Volume I, Issue 1, 2007www.ansys.com s5
SPORTS: SURFING
As the board speed increases to thepoint where the board planes across the wave surface, the contribution ofbuoyancy becomes small in comparisonto the dynamic lift generated.
Surfboard design is a complexassociation of many variables, all ofwhich are relevant to the performance characteristics of the board. Some ofthe key features evaluated in this studythat directly affect performance are theside rails (which define the outershape), the rocker dimensions (whichdefine the curvature at the front end)and the bottom surface configuration(which defines the overall contour ofthe underside of the board). In additionto speed, these parameters affect theboard’s orientation in the water andhence the resulting dynamic pressureon the bottom surface. This in turndrives the dynamic loads generated bythe surfboard that allow it to plane andperform maneuvers.
A matrix of these features was created and configurations were simu-lated using ANSYS CFX software. Thetransient CFD model included turbu-lence, free surface prediction (betweenthe air and water) and buoyancy.
Fixed values for the trim angle andyaw angle were used, while the rollangle was varied from a low value tothe most extreme value observed. Theroll angles were chosen to correspondto three standard surfing scenarios —speed generation, basic maneuveringand extreme redirection. The relevanceof each of these is dependent uponwave type and user surfing abilities.The CFD simulations generated data inthe form of lift force, drag force, andmoment coefficients. From the datagathered it was possible to quantifythe performance of each board config-uration in the form of maneuverability,stability and drive. The results for eachcalculation then were graded and fromthese results it was possible to deter-mine an optimal board based on surferskills and wave type. The study wenteven further. From the results table,hybrids between the local ranges ofdrive and sensitivity were used to construct an optimized board for arange surfing conditions. n
Developing More Adaptive FinsBy Dave Carswell, Nick Lavery and Steve Brown, Department of Materials Engineering University of Wales, U.K.
Contours of dynamic pressure on a plane slicing throughthe fin
Pathlines, colored by velocity magnitude, illustrate thestrong recirculation that occurs on the downstream sideof the fin.
A finite element analysis is used to computethe deformation on the fin, illustrated here as displacement magnitude, the majorcomponent being the displacement in the z-direction (into the page).
will use FLUENT tools to examinehigher flow rates (up to 12 to 15 m/s)that are not achievable in the laboratoryusing the current equipment.
Of particular interest at higher flowrates are the effects of fin deformationon the fin hydrodynamics. Throughuser-defined functions (UDFs) in FLUENT software, a customized finiteelement stress analysis code has beencoupled to the transient flow analysis.This allows the researchers to compute the dynamic deformationscaused by the surface pressures onthe fins and the subsequent effect ofthe deformations on the surface pressures and related hydrodynamics.The objective of this phase of the project is to help design a new generation of fins which will have intelligently adaptive sub-structuresthat retain hydrodynamic lift evenwhen deforming. This new evolution offin design would greatly enhance finperformance. n

GivingSki Racersan EdgeANSYS Mechanical software is used toanalyze the dynamic properties of skis.
Cross-section schematic of a ski’s sandwich structure. Image courtesy StöckliSwiss Sports AG.
Images generated by FEA for (top) the second flexural mode of the front part ofa ski and (bottom) the first torsional mode
Christian Fischer1, Mathieu Fauve2, Etienne Combaz1,2, Dènes Szabo2,Pierre-Etienne Bourban1, Vèronique Michaud1, Christopher J.G. Plummer1,Hansueli Rhyner2 and Jan-Anders E. Manson1
1Laboratoire de Technologie des Composites et Polymères (LTC)Ecole Polytechnique Fèdèrale de Lausanne (EPFL), Switzerland2WSL, Institute for Snow and Avalanche Research (SLF), Switzerland
As in most sports, successful performance in top-level skiing requires a combination of highly developed motor andperceptual skills from the athletes in addition to outstandingequipment. A principal aim of ski manufacturers in recent yearshas been to control vibration in various ways. By observingdownhill racers on icy slopes in slow-motion, one concludesthat low-frequency high-amplitude deformation has a detrimental effect on the ski-snow contact, decreasing controland speed. Skis completely devoid of vibration nevertheless donot provide adequate sensitivity for the athlete, making it crucialto discriminate between those frequencies that should bedamped to increase performance and those that are importantfor the skier’s “feel.” Though numerical simulations have shownpromise for the investigation of ski properties [1,2], little attention has been paid to the influence of the constituent materials on the dynamic response of skis.
Each constituent material of the ski has a particular purpose. The top sheet, usually polyamide (PA) or acrylonitrilebutadiene styrene (ABS), is mainly a protective layer. Thewood core, which has a non-uniform thickness that providesa smooth bending profile, plays an important role in damping,whereas aluminum and glass fiber reinforced polymers(GFRPs), which constitute the upper and lower faces, providestiffness in bending and torsion. The running base is commonly made of ultra-high molecular weight polyethylene(UHMWPE) to give optimum sliding behavior. Finally, hardenedsteel edges are positioned on both sides of the ski to providegood control during a turn. In the present work, the influenceof the topsheet on the ski’s dynamic properties has beeninvestigated using a combination of numerical simulations and
Image courtesy Stöckli Swiss Sports AG.
GFRP Wood Aluminum Top sheet Top core sheet (PA,ABS) sandwich face
Steel edge UHMWPE Bottom sandwich face
www.ansys.comANSYS Advantage • Volume I, Issue 1, 2007s6
SPORTS: SKIING
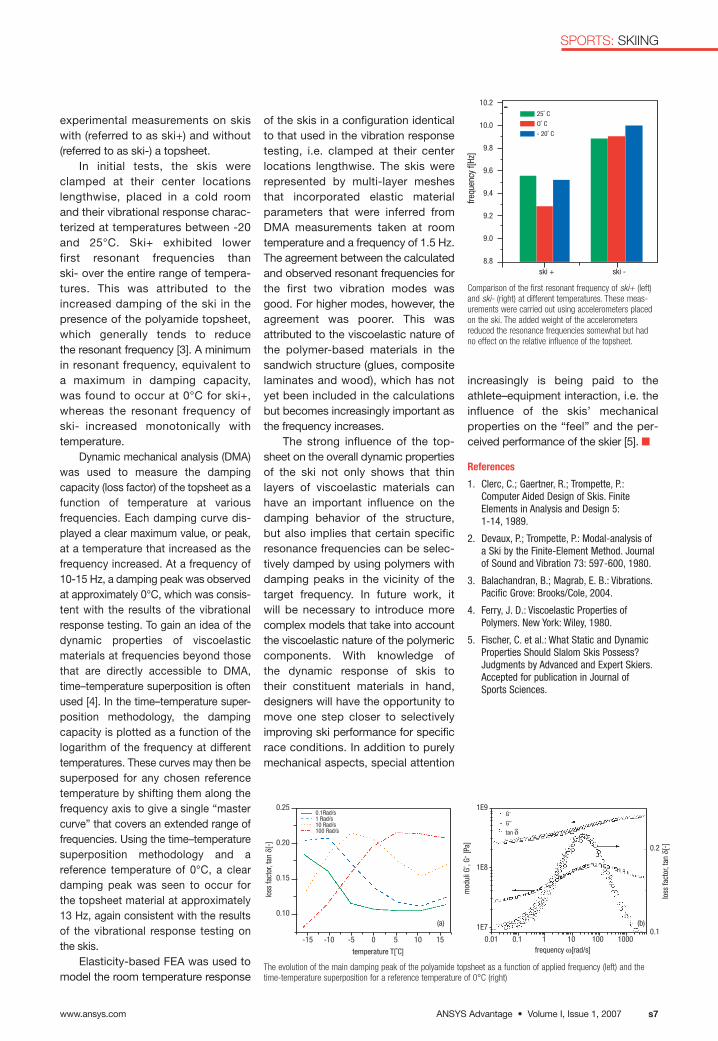
frequ
ency
f[Hz
]
10.2
10.0
9.8
9.6
9.4
9.2
9.0
8.8
-experimental measurements on skiswith (referred to as ski+) and without(referred to as ski-) a topsheet.
In initial tests, the skis wereclamped at their center locationslengthwise, placed in a cold room and their vibrational response charac-terized at temperatures between -20 and 25°C. Ski+ exhibited lower first resonant frequencies than ski- over the entire range of tempera-tures. This was attributed to theincreased damping of the ski in thepresence of the polyamide topsheet,which generally tends to reduce the resonant frequency [3]. A minimum in resonant frequency, equivalent to a maximum in damping capacity, was found to occur at 0°C for ski+,whereas the resonant frequency of ski- increased monotonically with temperature.
Dynamic mechanical analysis (DMA)was used to measure the dampingcapacity (loss factor) of the topsheet as afunction of temperature at various frequencies. Each damping curve dis-played a clear maximum value, or peak,at a temperature that increased as thefrequency increased. At a frequency of10-15 Hz, a damping peak was observedat approximately 0°C, which was consis-tent with the results of the vibrationalresponse testing. To gain an idea of thedynamic properties of viscoelastic materials at frequencies beyond thosethat are directly accessible to DMA,time–temperature superposition is oftenused [4]. In the time–temperature super-position methodology, the dampingcapacity is plotted as a function of thelogarithm of the frequency at differenttemperatures. These curves may then besuperposed for any chosen referencetemperature by shifting them along thefrequency axis to give a single “mastercurve” that covers an extended range offrequencies. Using the time–temperaturesuperposition methodology and a reference temperature of 0°C, a cleardamping peak was seen to occur for the topsheet material at approximately13 Hz, again consistent with the results of the vibrational response testing on the skis.
Elasticity-based FEA was used tomodel the room temperature response
of the skis in a configuration identicalto that used in the vibration responsetesting, i.e. clamped at their centerlocations lengthwise. The skis wererepresented by multi-layer meshes that incorporated elastic materialparameters that were inferred fromDMA measurements taken at roomtemperature and a frequency of 1.5 Hz.The agreement between the calculatedand observed resonant frequencies forthe first two vibration modes wasgood. For higher modes, however, theagreement was poorer. This was attributed to the viscoelastic nature ofthe polymer-based materials in thesandwich structure (glues, compositelaminates and wood), which has notyet been included in the calculationsbut becomes increasingly important asthe frequency increases.
The strong influence of the top-sheet on the overall dynamic propertiesof the ski not only shows that thin layers of viscoelastic materials canhave an important influence on thedamping behavior of the structure, but also implies that certain specificresonance frequencies can be selec-tively damped by using polymers withdamping peaks in the vicinity of the target frequency. In future work, it will be necessary to introduce more complex models that take into accountthe viscoelastic nature of the polymericcomponents. With knowledge of the dynamic response of skis to their constituent materials in hand,designers will have the opportunity tomove one step closer to selectivelyimproving ski performance for specificrace conditions. In addition to purelymechanical aspects, special attention
-15 -10 -5 0 5 10 15
(a) (b)
temperature T[˚C] frequency ω[rad/s]
loss
fact
or,t
an δ
[-]
mod
uli G
’,G"
[Pa]
loss
fact
or,t
an δ
[-]
Comparison of the first resonant frequency of ski+ (left)and ski- (right) at different temperatures. These meas-urements were carried out using accelerometers placedon the ski. The added weight of the accelerometersreduced the resonance frequencies somewhat but hadno effect on the relative influence of the topsheet.
The evolution of the main damping peak of the polyamide topsheet as a function of applied frequency (left) and thetime-temperature superposition for a reference temperature of 0°C (right)
increasingly is being paid to the athlete–equipment interaction, i.e. theinfluence of the skis’ mechanical properties on the “feel” and the per-ceived performance of the skier [5]. n
References
1. Clerc, C.; Gaertner, R.; Trompette, P.:Computer Aided Design of Skis. FiniteElements in Analysis and Design 5:1-14, 1989.
2. Devaux, P.; Trompette, P.: Modal-analysis ofa Ski by the Finite-Element Method. Journalof Sound and Vibration 73: 597-600, 1980.
3. Balachandran, B.; Magrab, E. B.: Vibrations.Pacific Grove: Brooks/Cole, 2004.
4. Ferry, J. D.: Viscoelastic Properties ofPolymers. New York: Wiley, 1980.
5. Fischer, C. et al.: What Static and DynamicProperties Should Slalom Skis Possess?Judgments by Advanced and Expert Skiers.Accepted for publication in Journal of Sports Sciences.
ski + ski -
0.25
0.20
0.15
0.10
0.01 0.1 1 10 100 1000
1E9
1E8
1E7
0.2
0.1
0.1Rad/s1 Rad/s10 Rad/s100 Rad/s
G’
G"
tan δ
25˚ C
O˚ C
- 20˚ C
ANSYS Advantage • Volume I, Issue 1, 2007
SPORTS: SKIING
www.ansys.com s7
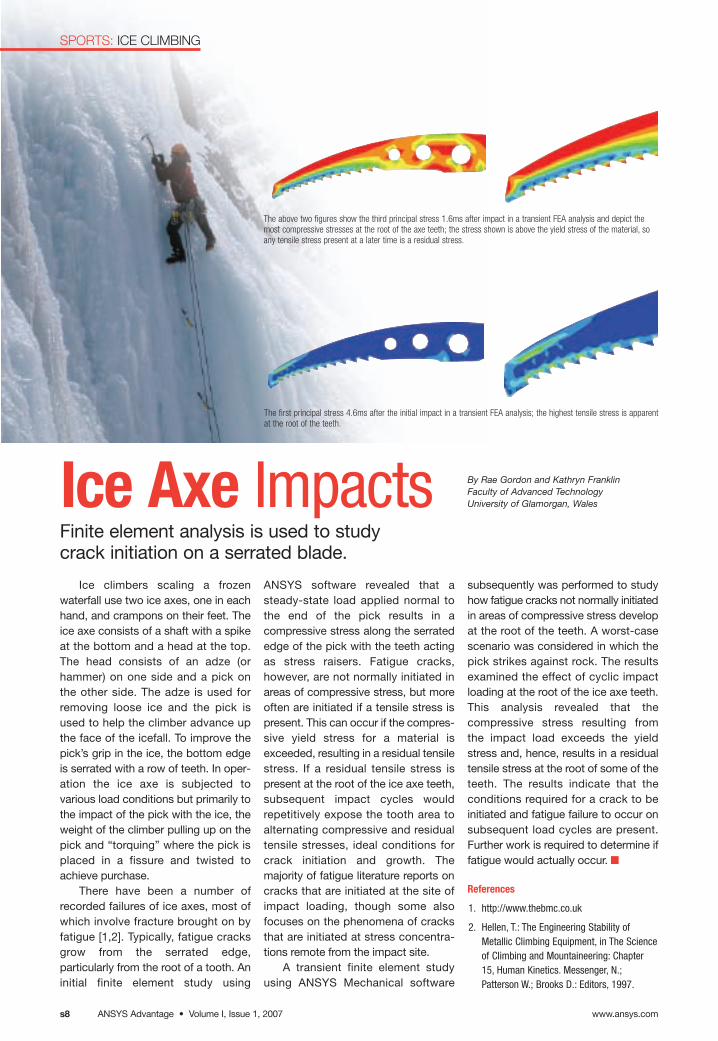
www.ansys.comANSYS Advantage • Volume I, Issue 1, 2007s8
SPORTS: ICE CLIMBING
Ice Axe ImpactsIce climbers scaling a frozen
waterfall use two ice axes, one in eachhand, and crampons on their feet. Theice axe consists of a shaft with a spikeat the bottom and a head at the top.The head consists of an adze (or hammer) on one side and a pick on the other side. The adze is used forremoving loose ice and the pick isused to help the climber advance upthe face of the icefall. To improve thepick’s grip in the ice, the bottom edgeis serrated with a row of teeth. In oper-ation the ice axe is subjected tovarious load conditions but primarily tothe impact of the pick with the ice, theweight of the climber pulling up on thepick and “torquing” where the pick isplaced in a fissure and twisted toachieve purchase.
There have been a number ofrecorded failures of ice axes, most ofwhich involve fracture brought on byfatigue [1,2]. Typically, fatigue cracksgrow from the serrated edge, particularly from the root of a tooth. Aninitial finite element study using
The above two figures show the third principal stress 1.6ms after impact in a transient FEA analysis and depict themost compressive stresses at the root of the axe teeth; the stress shown is above the yield stress of the material, soany tensile stress present at a later time is a residual stress.
The first principal stress 4.6ms after the initial impact in a transient FEA analysis; the highest tensile stress is apparentat the root of the teeth.
By Rae Gordon and Kathryn FranklinFaculty of Advanced TechnologyUniversity of Glamorgan, Wales
ANSYS software revealed that asteady-state load applied normal tothe end of the pick results in a compressive stress along the serratededge of the pick with the teeth actingas stress raisers. Fatigue cracks, however, are not normally initiated inareas of compressive stress, but moreoften are initiated if a tensile stress ispresent. This can occur if the compres-sive yield stress for a material isexceeded, resulting in a residual tensilestress. If a residual tensile stress ispresent at the root of the ice axe teeth,subsequent impact cycles wouldrepetitively expose the tooth area toalternating compressive and residualtensile stresses, ideal conditions forcrack initiation and growth. The majority of fatigue literature reports oncracks that are initiated at the site ofimpact loading, though some alsofocuses on the phenomena of cracksthat are initiated at stress concentra-tions remote from the impact site.
A transient finite element studyusing ANSYS Mechanical software
subsequently was performed to studyhow fatigue cracks not normally initiatedin areas of compressive stress developat the root of the teeth. A worst-casescenario was considered in which thepick strikes against rock. The resultsexamined the effect of cyclic impactloading at the root of the ice axe teeth.This analysis revealed that the compressive stress resulting from the impact load exceeds the yieldstress and, hence, results in a residualtensile stress at the root of some of theteeth. The results indicate that the conditions required for a crack to beinitiated and fatigue failure to occur onsubsequent load cycles are present.Further work is required to determine iffatigue would actually occur. n
References
1. http://www.thebmc.co.uk
2. Hellen, T.: The Engineering Stability ofMetallic Climbing Equipment, in The Scienceof Climbing and Mountaineering: Chapter15, Human Kinetics. Messenger, N.;Patterson W.; Brooks D.: Editors, 1997.
Finite element analysis is used to studycrack initiation on a serrated blade.

ANSYS Advantage • Volume I, Issue 1, 2007
SPORTS: CYCLING
www.ansys.com s9
Tour de Force!Aerodynamic gains can be realized by studyingthe interaction between a bicycle and rider.By Keith Hanna, ANSYS, Inc.
Cervélo Cycles was formed in1995 when two engineers, Phil Whiteand Gérard Vroomen, decided to taketheir fast time trial bikes to market.Involved in bicycle and human- powered vehicle design since 1986,Vroomen realized that professionalcyclists did not have the interest orexpertise to develop leading-edgedesigns with a focus on time trialingand aerodynamics. He also realizedthat he could not look at the manynovel designs put before him andknow if they were better or just different. Hence, when an Italian procyclist’s team approached him to evaluate bikes then available on theopen market, he set a design goal for anew bike design: to be unbeatable interms of its aerodynamics, weight andstiffness characteristics. The one-offdesign for this particular rider turnedout to be a radical bike that pushed theboundaries of existing bikes and tested well. This customized Cervélobike attracted attention and started tosell itself at triathlon and road racingevents. The duo set up their own company, and within two years theirbicycles had won numerous triathlonsand time trials.
Today many professional athletesuse Cervélo bicycles. With eight full-time engineers in their small company, they continue to push thebike design envelope in every waypossible while keeping a focus ontechnology and innovation. Today therate of development has to be fast in order to stay competitive. The company has a simple mission statement: “To help our customers winraces.” This mission has come true fortheir cycling team, Team CSC, which is
currently ranked first in the world. TheirP3 bike is the most successful triathlonmodel in Ironman history with morethan 20 victories. Other Cervélo bicycles are used by racers in the Tourde France and amateurs touring alongcity streets and country roads.
Recently, Cervélo approached theANSYS, Inc. office in Michigan, U.S.A.,to employ their extensive aerodynamicexperience to fashion a virtual designprocess using the computational fluiddynamics (CFD) package FLUENT. PhilWhite notes that in a typical one-hourtime trial, perhaps 30 to 60 secondscan be taken off times through aerodynamic improvements to a givenbike. Indeed, the biggest aerodynamicgain is usually in the design of thelower half of the bike, where manycomplex flow interactions occur. The
CFD studies demonstrated the bene-fits to be gained by this approach.Cervélo has acquired a wealth of windtunnel data over the last decade and isnow using it for benchmarking thenumerical predictions. CFD is provingto be less expensive than wind tunnelmeasurements for the amount of datagenerated and is free of probe interference errors. It can pick up manyeffects associated with riders interacting with bike frames and cancapture rotating wheels and movingground effects. Looking forward,Cervélo believes that CFD will providea better understanding of critical sidewind effects with yaw angles in crossflows, overall aerodynamics and cyclist packages, racing tactics,and many other riding equipmentenhancements. n
Flow ribbons illustrate the flowthrough the lower half of a Cervélobicycle and athlete’s legs.
Lisa Bentley — one of the most successful Ironman triathlon athletes — riding a Cervélo bicycle
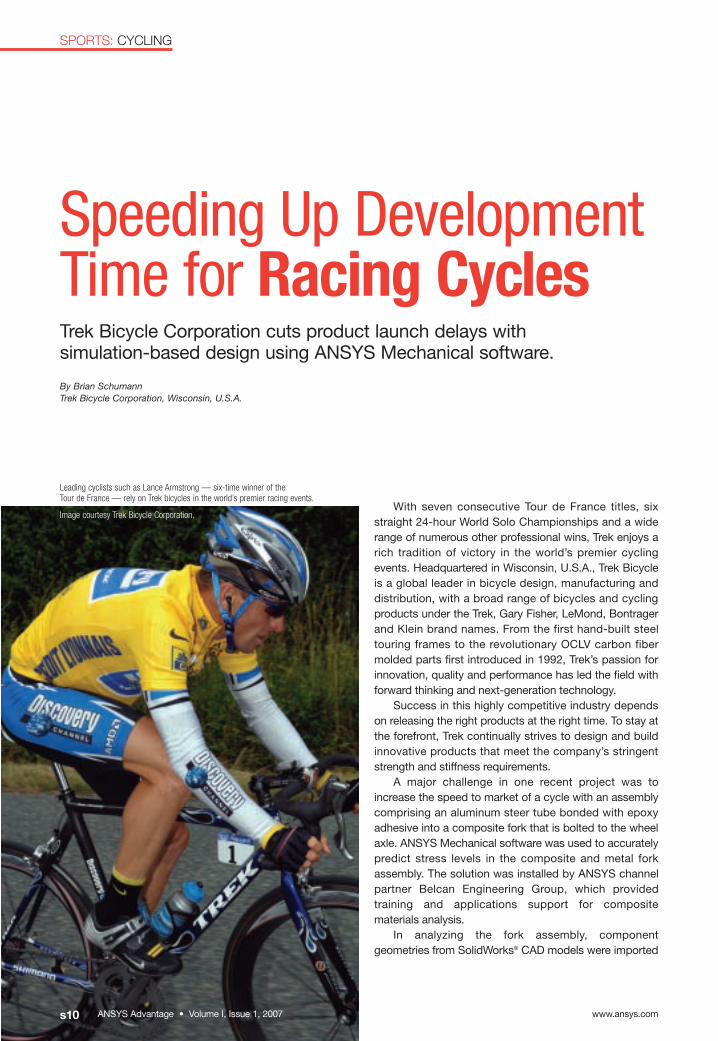
www.ansys.comANSYS Advantage • Volume I, Issue 1, 2007s10
SPORTS: CYCLING
Speeding Up DevelopmentTime for Racing Cycles
By Brian Schumann Trek Bicycle Corporation, Wisconsin, U.S.A.
With seven consecutive Tour de France titles, sixstraight 24-hour World Solo Championships and a widerange of numerous other professional wins, Trek enjoys arich tradition of victory in the world’s premier cyclingevents. Headquartered in Wisconsin, U.S.A., Trek Bicycleis a global leader in bicycle design, manufacturing anddistribution, with a broad range of bicycles and cyclingproducts under the Trek, Gary Fisher, LeMond, Bontragerand Klein brand names. From the first hand-built steeltouring frames to the revolutionary OCLV carbon fibermolded parts first introduced in 1992, Trek’s passion forinnovation, quality and performance has led the field withforward thinking and next-generation technology.
Success in this highly competitive industry dependson releasing the right products at the right time. To stay atthe forefront, Trek continually strives to design and buildinnovative products that meet the company’s stringentstrength and stiffness requirements.
A major challenge in one recent project was toincrease the speed to market of a cycle with an assemblycomprising an aluminum steer tube bonded with epoxyadhesive into a composite fork that is bolted to the wheelaxle. ANSYS Mechanical software was used to accuratelypredict stress levels in the composite and metal forkassembly. The solution was installed by ANSYS channelpartner Belcan Engineering Group, which provided training and applications support for composite materials analysis.
In analyzing the fork assembly, component geometries from SolidWorks® CAD models were imported
Leading cyclists such as Lance Armstrong — six-time winner of the Tour de France — rely on Trek bicycles in the world’s premier racing events.
Image courtesy Trek Bicycle Corporation.
Trek Bicycle Corporation cuts product launch delays withsimulation-based design using ANSYS Mechanical software.

ANSYS Advantage • Volume I, Issue 1, 2007
SPORTS: ARENAS
www.ansys.com s11
into ANSYS software, in which the Virtual Topology fea-ture was used to construct a unified mesh representingthe entire assembly of composite and metal parts.Bonded contact elements automatically configured themesh to account for epoxied parts, thus avoiding thedifficult task of manually adjusting mesh densities andselecting element types. The shell lay-up capabilities ofANSYS software were of particular value in representingthe complex material properties of composites inregions containing different numbers of layers alignedin various orientations.
The analysis allowed engineers to simulate changesin the lay-up of the composite parts as well as wallthickness of the aluminum parts much faster. The laboratory test setup was accurately simulated and acomposite fork assembly ultimately was created thatmet all of the design parameters and safety standards.This saved considerable time in developing these com-ponents and is allowing critical product launchdeadlines to be met. Trek engineers are leveraging thisknowledge and experience so that the process can beapplied to the design of future products.
Trek recognizes the value of Simulation Driven Product Development and is successfully implementingthe approach with ANSYS Mechanical software. As thecompany moves increasingly toward more globalizationin its supply chain, the value of analysis becomes evengreater as a way of refining innovative designs beforebuilding hardware. n
Component geometry from a SolidWorks CAD model (top) was imported intoANSYS Mechanical software (bottom) to determined the stresses in the forkassembly made of aluminum and composite parts. The simulation reduced thenumber of lengthy hardware prototype iterations and enabled the company tomeet critical product launch deadlines.
Scoring an HVACGoal for HockeySpectators
By Sami Lestinen, Tuomas Laine and Tom L SundmanOlof Granlund Oy, Finland
In today’s world, the design of auditoriums, stadiumsand sports arenas is not complete without one or moresimulations of the interior air flow. Analyses of this type areused to determine the best heating and air conditioningsystems, analyze smoke removal in the event of a fire andensure that the occupants are exposed to a predefinedthermal comfort range most or all of the time.
Several year-round indoor ice hockey arenas wererecently designed in Russia. CFD simulations of the HVACsystems were carried out by Olof Granlund Oy, Finland’sleading building services consulting firm. Hodynka Arenain Moscow is the main venue for the International IceHockey Federation (IIHF) World Championships, to beplayed on April 27 to May 13, 2007. This 62,000 square-meter arena has a capacity for 12,000 spectators duringthe championship finals. The indoor air conditions in thearena are based on a displacement ventilation system,which is well-suited to large, fully occupied stands.
CFD is used to design ventilationsystems for sports arenas.
The Hodynka Arena in Moscow;CFD was used for designing theindoor air conditions.
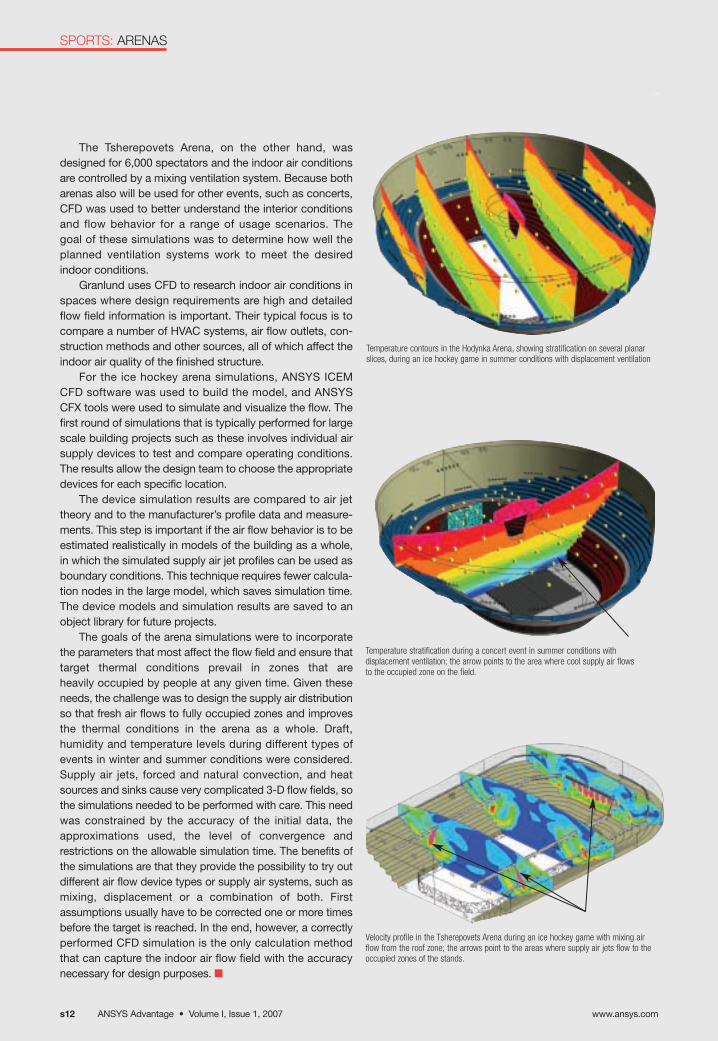
www.ansys.comANSYS Advantage • Volume I, Issue 1, 2007s12
SPORTS: ARENAS
The Tsherepovets Arena, on the other hand, wasdesigned for 6,000 spectators and the indoor air conditionsare controlled by a mixing ventilation system. Because botharenas also will be used for other events, such as concerts,CFD was used to better understand the interior conditionsand flow behavior for a range of usage scenarios. The goal of these simulations was to determine how well theplanned ventilation systems work to meet the desiredindoor conditions.
Granlund uses CFD to research indoor air conditions inspaces where design requirements are high and detailedflow field information is important. Their typical focus is tocompare a number of HVAC systems, air flow outlets, con-struction methods and other sources, all of which affect theindoor air quality of the finished structure.
For the ice hockey arena simulations, ANSYS ICEMCFD software was used to build the model, and ANSYSCFX tools were used to simulate and visualize the flow. Thefirst round of simulations that is typically performed for largescale building projects such as these involves individual airsupply devices to test and compare operating conditions.The results allow the design team to choose the appropriatedevices for each specific location.
The device simulation results are compared to air jettheory and to the manufacturer’s profile data and measure-ments. This step is important if the air flow behavior is to beestimated realistically in models of the building as a whole,in which the simulated supply air jet profiles can be used asboundary conditions. This technique requires fewer calcula-tion nodes in the large model, which saves simulation time.The device models and simulation results are saved to anobject library for future projects.
The goals of the arena simulations were to incorporatethe parameters that most affect the flow field and ensure thattarget thermal conditions prevail in zones that are heavily occupied by people at any given time. Given theseneeds, the challenge was to design the supply air distributionso that fresh air flows to fully occupied zones and improvesthe thermal conditions in the arena as a whole. Draft, humidity and temperature levels during different types ofevents in winter and summer conditions were considered.Supply air jets, forced and natural convection, and heatsources and sinks cause very complicated 3-D flow fields, sothe simulations needed to be performed with care. This needwas constrained by the accuracy of the initial data, theapproximations used, the level of convergence and restrictions on the allowable simulation time. The benefits ofthe simulations are that they provide the possibility to try outdifferent air flow device types or supply air systems, such asmixing, displacement or a combination of both. Firstassumptions usually have to be corrected one or more timesbefore the target is reached. In the end, however, a correctlyperformed CFD simulation is the only calculation method that can capture the indoor air flow field with the accuracynecessary for design purposes. n
Temperature contours in the Hodynka Arena, showing stratification on several planarslices, during an ice hockey game in summer conditions with displacement ventilation
Velocity profile in the Tsherepovets Arena during an ice hockey game with mixing airflow from the roof zone; the arrows point to the areas where supply air jets flow to theoccupied zones of the stands.
Temperature stratification during a concert event in summer conditions with displacement ventilation; the arrow points to the area where cool supply air flows to the occupied zone on the field.
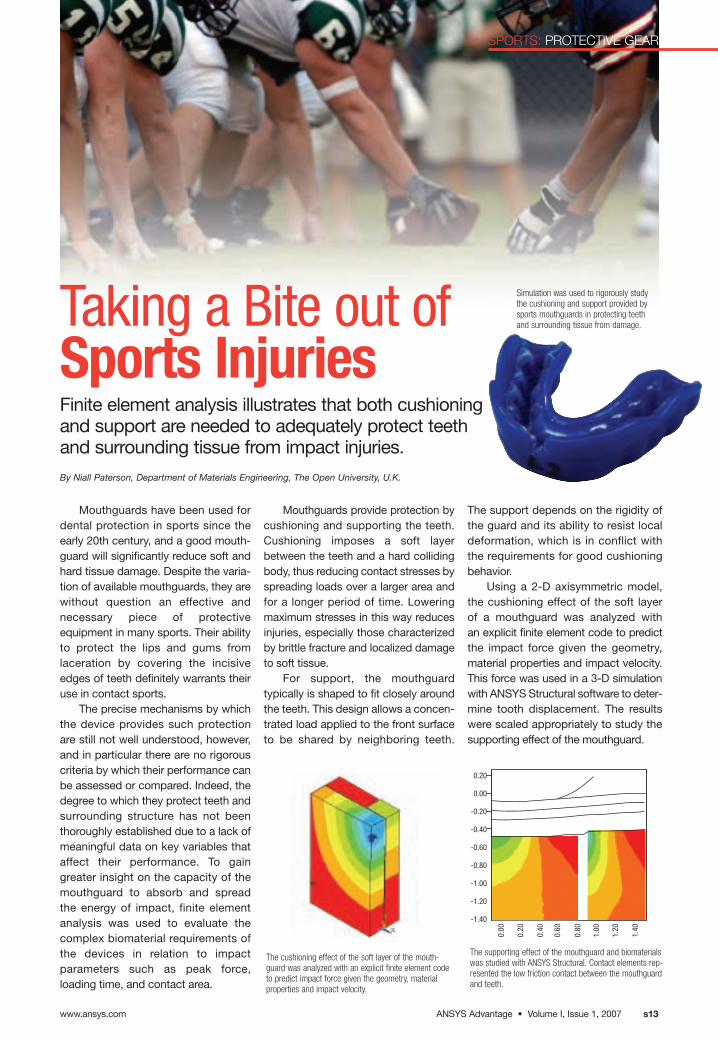
ANSYS Advantage • Volume I, Issue 1, 2007
SPORTS: PROTECTIVE GEAR
www.ansys.com s13
Simulation was used to rigorously studythe cushioning and support provided bysports mouthguards in protecting teethand surrounding tissue from damage.
The cushioning effect of the soft layer of the mouth-guard was analyzed with an explicit finite element codeto predict impact force given the geometry, materialproperties and impact velocity.
The supporting effect of the mouthguard and biomaterialswas studied with ANSYS Structural. Contact elements rep-resented the low friction contact between the mouthguardand teeth.
Mouthguards have been used fordental protection in sports since theearly 20th century, and a good mouth-guard will significantly reduce soft andhard tissue damage. Despite the varia-tion of available mouthguards, they arewithout question an effective and necessary piece of protective equipment in many sports. Their abilityto protect the lips and gums from laceration by covering the incisiveedges of teeth definitely warrants theiruse in contact sports.
The precise mechanisms by whichthe device provides such protectionare still not well understood, however,and in particular there are no rigorouscriteria by which their performance canbe assessed or compared. Indeed, thedegree to which they protect teeth andsurrounding structure has not beenthoroughly established due to a lack ofmeaningful data on key variables thataffect their performance. To gaingreater insight on the capacity of themouthguard to absorb and spread the energy of impact, finite elementanalysis was used to evaluate thecomplex biomaterial requirements ofthe devices in relation to impactparameters such as peak force, loading time, and contact area.
By Niall Paterson, Department of Materials Engineering, The Open University, U.K.
Mouthguards provide protection bycushioning and supporting the teeth.Cushioning imposes a soft layerbetween the teeth and a hard collidingbody, thus reducing contact stresses byspreading loads over a larger area andfor a longer period of time. Loweringmaximum stresses in this way reducesinjuries, especially those characterizedby brittle fracture and localized damageto soft tissue.
For support, the mouthguard typically is shaped to fit closely aroundthe teeth. This design allows a concen-trated load applied to the front surfaceto be shared by neighboring teeth.
The support depends on the rigidity ofthe guard and its ability to resist localdeformation, which is in conflict withthe requirements for good cushioningbehavior.
Using a 2-D axisymmetric model,the cushioning effect of the soft layer of a mouthguard was analyzed with an explicit finite element code to predictthe impact force given the geometry,material properties and impact velocity.This force was used in a 3-D simulationwith ANSYS Structural software to deter-mine tooth displacement. The resultswere scaled appropriately to study thesupporting effect of the mouthguard.
Taking a Bite out ofSports InjuriesFinite element analysis illustrates that both cushioningand support are needed to adequately protect teeth and surrounding tissue from impact injuries.
0.20
0.00
-0.20
-0.40
-0.60
-0.80
-1.00
-1.20
-1.40
0.00
0.20
0.40
0.60
0.80
1.00
1.20
1.40
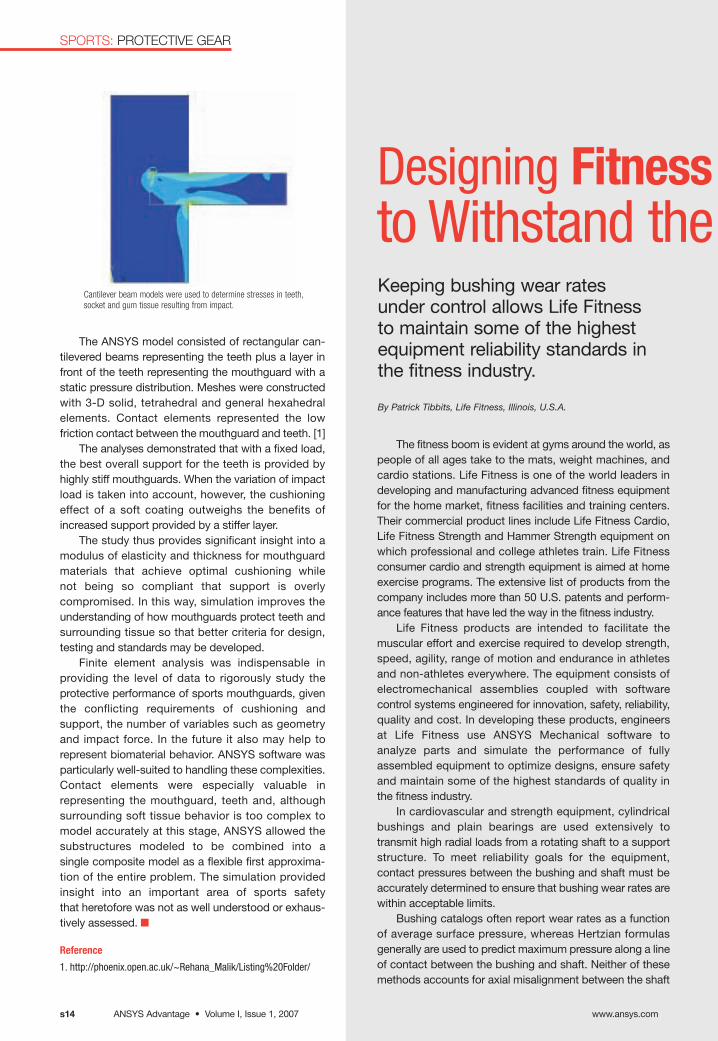
www.ansys.comANSYS Advantage • Volume I, Issue 1, 2007s14
SPORTS: PROTECTIVE GEAR
The fitness boom is evident at gyms around the world, aspeople of all ages take to the mats, weight machines, andcardio stations. Life Fitness is one of the world leaders indeveloping and manufacturing advanced fitness equipmentfor the home market, fitness facilities and training centers.Their commercial product lines include Life Fitness Cardio,Life Fitness Strength and Hammer Strength equipment onwhich professional and college athletes train. Life Fitnessconsumer cardio and strength equipment is aimed at homeexercise programs. The extensive list of products from thecompany includes more than 50 U.S. patents and perform-ance features that have led the way in the fitness industry.
Life Fitness products are intended to facilitate the muscular effort and exercise required to develop strength,speed, agility, range of motion and endurance in athletesand non-athletes everywhere. The equipment consists ofelectromechanical assemblies coupled with software control systems engineered for innovation, safety, reliability,quality and cost. In developing these products, engineers at Life Fitness use ANSYS Mechanical software to analyze parts and simulate the performance of fully assembled equipment to optimize designs, ensure safetyand maintain some of the highest standards of quality in the fitness industry.
In cardiovascular and strength equipment, cylindricalbushings and plain bearings are used extensively to transmit high radial loads from a rotating shaft to a supportstructure. To meet reliability goals for the equipment, contact pressures between the bushing and shaft must beaccurately determined to ensure that bushing wear rates arewithin acceptable limits.
Bushing catalogs often report wear rates as a functionof average surface pressure, whereas Hertzian formulasgenerally are used to predict maximum pressure along a lineof contact between the bushing and shaft. Neither of thesemethods accounts for axial misalignment between the shaft
Designing Fitnessto Withstand the
By Patrick Tibbits, Life Fitness, Illinois, U.S.A.
The ANSYS model consisted of rectangular can-tilevered beams representing the teeth plus a layer infront of the teeth representing the mouthguard with astatic pressure distribution. Meshes were constructedwith 3-D solid, tetrahedral and general hexahedral elements. Contact elements represented the low friction contact between the mouthguard and teeth. [1]
The analyses demonstrated that with a fixed load,the best overall support for the teeth is provided byhighly stiff mouthguards. When the variation of impactload is taken into account, however, the cushioningeffect of a soft coating outweighs the benefits ofincreased support provided by a stiffer layer.
The study thus provides significant insight into amodulus of elasticity and thickness for mouthguardmaterials that achieve optimal cushioning while not being so compliant that support is overly compromised. In this way, simulation improves theunderstanding of how mouthguards protect teeth andsurrounding tissue so that better criteria for design,testing and standards may be developed.
Finite element analysis was indispensable in providing the level of data to rigorously study the protective performance of sports mouthguards, giventhe conflicting requirements of cushioning and support, the number of variables such as geometryand impact force. In the future it also may help to represent biomaterial behavior. ANSYS software wasparticularly well-suited to handling these complexities.Contact elements were especially valuable in representing the mouthguard, teeth and, although surrounding soft tissue behavior is too complex tomodel accurately at this stage, ANSYS allowed thesubstructures modeled to be combined into a single composite model as a flexible first approxima-tion of the entire problem. The simulation providedinsight into an important area of sports safety that heretofore was not as well understood or exhaus-tively assessed. n
Reference
1. http://phoenix.open.ac.uk/~Rehana_Malik/Listing%20Folder/
Keeping bushing wear rates under control allows Life Fitness to maintain some of the highestequipment reliability standards inthe fitness industry.
Cantilever beam models were used to determine stresses in teeth,socket and gum tissue resulting from impact.

ANSYS Advantage • Volume I, Issue 1, 2007www.ansys.com s15
SPORTS: FITNESS EQUIPMENT
EquipmentWorkout
and bushing, however, which develops extremely high non-uniform pressure distributions that are difficult to determinefrom traditional methods.
Determining such contact pressure can be done withfinite element analysis, but with many conventional codesthe task is somewhat time-consuming because users mustmanually define which surfaces are touching and line upnodes of contacting part meshes. In contrast, ANSYS sur-face-to-surface contact element technology automaticallydetects regions where parts touch. Furthermore, higher-order elements are used that do not require nodes ofcontacting parts to line up.
In this way, ANSYS contact element technology readilyhandles solutions of such numerically difficult contact problems. TARGE170 and CONTA174 elements were usedto simulate three-dimensional contact between the shaftand bushing, which get modeled with second-order solidelements with mid-side nodes. Extensive facilities for setting real constants and KEYOPTS for the contact elements greatly improve the detection of initial contact.The model of the bushing/shaft/housing assembly requiredno artificial constraints to prevent rigid-body motion.
Surface-to-surface contact element technology enabledLife Fitness engineers to accurately determine the contactpressure due to axial misalignment between the shaft andbushing. The maximum pressure predicted by ANSYS software exceeded the Hertzian line-contact pressure of1,700 psi by 35 percent and was nearly 10 times greater thanthe average pressure of 250 psi computed by traditional formulas. Moreover, simulation showed how the distributionof non-uniform pressure varied from one point to anotherover the entire surface, providing valuable insight into potential bushing wear patterns and material behavior. In thisrespect, ANSYS technology is a microscope to examinepressure variations in the bushing/shaft contact.
Since bushing wear rate is proportional to contact pressure, integrating these ANSYS values for non-uniformpressure distribution in the shaft/bearing contact provides amore accurate calculation of wear rate. By clearly showingthe effect of misalignment loading on the wear rate of thebushing, ANSYS analysis helped guide design decisions inthe selection of bushing and shaft materials and surface finishes for a new model of fitness equipment. In this way,the predictive capabilities of advanced solutions such asANSYS software play a critical role in enabling Life Fitnessto develop some of the most innovative and reliable equipment in the industry. n
Non-uniform contact pressure distribution between the shaft and bushing enables engineers to accurately calculate bushing wear rates and thus guide decisions on theselection of component materials and surface finishes to maintain overall reliability ofthe fitness equipment.
Bushings get a real workout in equipment such as this Life Fitness Cable Motion seriesof strength training machines. Twenty adjustments per column on the equipment’s dualadjustable pulley system create a variety of exercises, and the mechanism allows forhigher speed movements for sport-specific training.

www.ansys.comANSYS Advantage • Volume I, Issue 1, 2007s16
SPORTS: ROWING
Catching a BetterOar DesignEngineers use CFD and aspreadsheet model to assessprospective oar blade designs.
Rowing is a highly competitive international sport that isexperiencing rapid growth in all parts of the world. As withmost other sports, it has seen a number of changes inequipment during the past three decades, as compositematerials have replaced wood and stainless steel for hulls,oars and riggers. While changes to the shape of hulls mayelude the casual observer, changes to the shape of oarshave not. The symmetric, tulip-shaped oar blades of thepast have been replaced with a hatchet design that offers astraight edge as the oar enters the water. The increased surface area allows for a more effective transfer of powerfrom the rower to the water.
A manufacturer of high performance rowing oarswished to develop a design tool to aid the development andevaluation of sophisticated geometries being considered forfuture oar designs. The primary objective was to overcomethe cost and time constraints normally associated with thetypical build-and-test development approach. The clientapproached engineers at Intelligent Fluid Solutions, aunique consulting service that specializes in fluids-basedengineering design.
The design effort used a mixture of spreadsheet modeling and CFD analysis. Initially a spreadsheet model ofthe performance of a typical racing eight was developed.This tool was calibrated with race data and was used to linkthe ultimate performance of the eight to the characteristicsof the oar. CFD analysis was used to examine the perform-ance of the oar in detail. The approach used ANSYS ICEMCFD software to develop the computational model and
By Jim Shaikh, Intelligent Fluid Solutions, U.K.
A photo (left) showing the geometry of an oar blade manufactured from composites.The CAD geometry of the blade (right) is used for the CFD analysis.
Pathlines in the wake of the oar showrecirculating flow emanating from theinside edge and smoothly varying flowissuing from the outer edge.
As expected, the pressure distribution onthe front face of the oar shows the largestvalue at the outer edge, where the radiusof rotation is maximum.
ANSYS CFX tools to obtain the flow solution. Using the k-εturbulence model, the oar blade was assumed to be fullysubmersed in water, and its motion was simulated at threelocations: the catch, when the oar first enters the water; themiddle of the drive; and finally, the finish, just before the oaris removed from the water. The open-water boundarieswere placed far from the blade to avoid edge effects. Usinga rotating frame of reference, the pivot point was adjustedfor each of the three positions to most accurately simulatethe compound lever behavior of an oar as it propels a boatthrough the water.
The results of the CFD simulations were used to construct and calibrate an additional spreadsheet model ofoar performance. The results also permitted visualization ofthe flows that develop around the oar in each position. This,along with reports for lift and drag, led to a deeper understanding of the complex oar system. The combinedmodeling approach greatly enhanced the client’s apprecia-tion of the mechanism of oar propulsion and offered a toolthat could be used to quantify the benefits of alternative oardesign concepts. n
For ANSYS, Inc. sales information, call 1.866.267.9724, or visit www.ansys.com.To subscribe to ANSYS Advantage, go to www.ansys.com/subscribe.
ANSYS Advantage is published for ANSYS, Inc. customers, partners and othersinterested in the field of design and analysis applications. Neither ANSYS, Inc.nor the editorial director nor Miller Creative Group guarantees or warrants accu-racy or completeness of the material contained in this publication. ANSYS,ANSYS Workbench, CFX, AUTODYN, FLUENT, DesignModeler, ANSYSMechanical, DesignSpace, ANSYS Structural, TGrid, GAMBIT, and any and allANSYS, Inc. brand, product, service and feature names, logos and slogans areregistered trademarks or trademarks of ANSYS, Inc. or its subisdiaries located inthe United States or other countries. ICEM CFD is a trademark licensed byANSYS, Inc. All other brand, product, service and feature names or trademarksare the property of their respective owners.
© 2007 ANSYS, Inc. All rights reserved.
About the Supplement
Cover image: The flow field in the vicinity of a golf ball immediately after beingstruck by a club
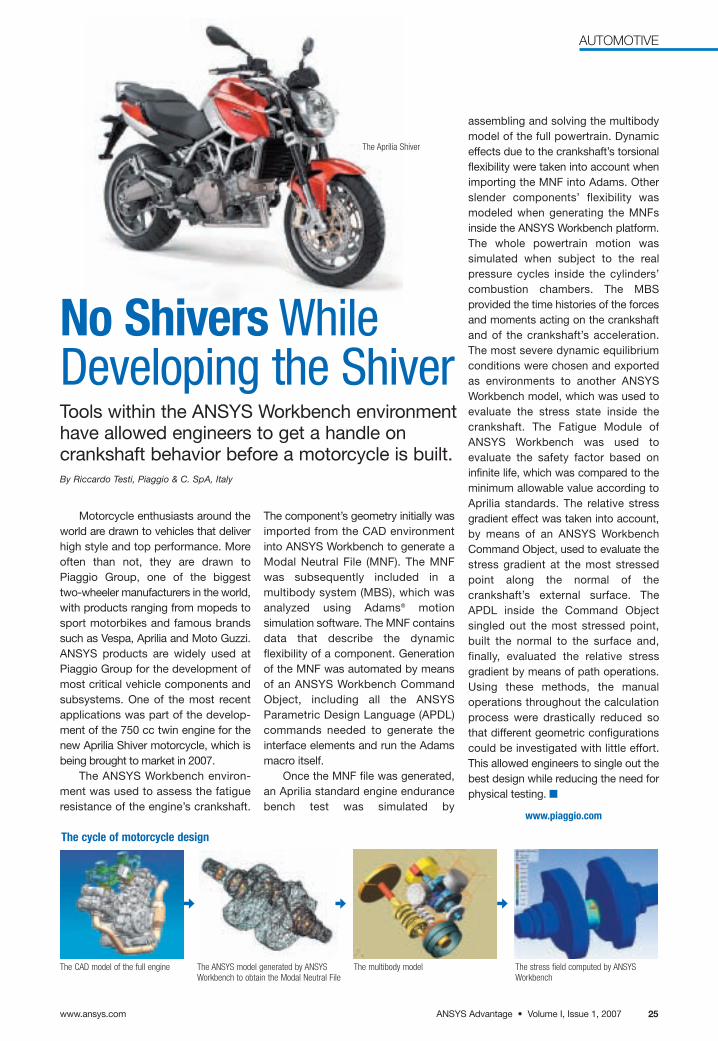
ANSYS Advantage • Volume I, Issue 1, 2007
AUTOMOTIVE
www.ansys.com 25
Motorcycle enthusiasts around theworld are drawn to vehicles that deliverhigh style and top performance. Moreoften than not, they are drawn to Piaggio Group, one of the biggest two-wheeler manufacturers in the world,with products ranging from mopeds tosport motorbikes and famous brandssuch as Vespa, Aprilia and Moto Guzzi.ANSYS products are widely used atPiaggio Group for the development ofmost critical vehicle components andsubsystems. One of the most recentapplications was part of the develop-ment of the 750 cc twin engine for thenew Aprilia Shiver motorcycle, which isbeing brought to market in 2007.
The ANSYS Workbench environ-ment was used to assess the fatigueresistance of the engine’s crankshaft.
The component’s geometry initially wasimported from the CAD environmentinto ANSYS Workbench to generate aModal Neutral File (MNF). The MNFwas subsequently included in a multibody system (MBS), which wasanalyzed using Adams® motion simulation software. The MNF containsdata that describe the dynamic flexibility of a component. Generationof the MNF was automated by meansof an ANSYS Workbench CommandObject, including all the ANSYS Parametric Design Language (APDL)commands needed to generate theinterface elements and run the Adamsmacro itself.
Once the MNF file was generated,an Aprilia standard engine endurancebench test was simulated by
assembling and solving the multibodymodel of the full powertrain. Dynamiceffects due to the crankshaft’s torsional flexibility were taken into account whenimporting the MNF into Adams. Otherslender components’ flexibility wasmodeled when generating the MNFsinside the ANSYS Workbench platform.The whole powertrain motion was simulated when subject to the real pressure cycles inside the cylinders’combustion chambers. The MBS provided the time histories of the forcesand moments acting on the crankshaftand of the crankshaft’s acceleration.The most severe dynamic equilibriumconditions were chosen and exportedas environments to another ANSYS Workbench model, which was used toevaluate the stress state inside thecrankshaft. The Fatigue Module ofANSYS Workbench was used to evaluate the safety factor based on infinite life, which was compared to theminimum allowable value according toAprilia standards. The relative stressgradient effect was taken into account,by means of an ANSYS WorkbenchCommand Object, used to evaluate thestress gradient at the most stressedpoint along the normal of the crankshaft’s external surface. TheAPDL inside the Command Object singled out the most stressed point,built the normal to the surface and, finally, evaluated the relative stress gradient by means of path operations.Using these methods, the manual operations throughout the calculationprocess were drastically reduced sothat different geometric configurationscould be investigated with little effort.This allowed engineers to single out thebest design while reducing the need forphysical testing. n
www.piaggio.com
The ANSYS model generated by ANSYSWorkbench to obtain the Modal Neutral File
The multibody modelThe CAD model of the full engine The stress field computed by ANSYSWorkbench
The cycle of motorcycle design
The Aprilia Shiver
No Shivers While Developing the ShiverTools within the ANSYS Workbench environmenthave allowed engineers to get a handle on crankshaft behavior before a motorcycle is built.By Riccardo Testi, Piaggio & C. SpA, Italy

www.ansys.comANSYS Advantage • Volume I, Issue 1, 200726
AUTOMOTIVE
Off-highway vehicles spend muchof their lives in dirty surroundings. Thistype of work environment poses achallenge for the engine and compo-nents, particularly the air pre-cleanerthat separates dirt, sand and otherlarge particles and debris from the airbefore it passes through the filter andinto the engine. At Donaldson, an airpre-cleaner product line has beendeveloped and optimized with the helpof CFD. As a result of this effort, theTopSpinTM air pre-cleaner has beenshown to extend air filter life andimprove fuel economy for this specialclass of vehicles.
Air enters the TopSpin pre-cleanerchamber through stationary vanes thatimpart a tornado-like (free vortex) rotational velocity. This velocity
generates centrifugal force that separates particle contaminants to theoutside of the chamber. After the vanes,the air moving into the chamber passesthrough a conical section, which accelerates the flow. Accelerated airincreases the particle separation efficiency and a larger chamber outletdecreases the system pressure drop.By the time the rotating air reaches thecenter of the pre-cleaner chamber,most of the particles from the incomingflow are spinning along the outer wall.
To remove the spinning particles,Donaldson engineers added a smallnumber of paddles that sweep aroundthe outer wall of the chamber. Theinner vanes are designed so that theouter wall paddles rotate faster thanthe outer wall air flow. This causeseach paddle to generate a positivepressure wave as it sweeps the outerwall of the pre-cleaner chamber. As thepaddle assembly rotates, the particlesare ejected by the positive pressurewave into the lower pressure atmos-phere. In other words, dirty air ispushed out while the cleaned airmoves inward and exits through thecenter of the pre-cleaner chamber.
Until very recently, the design of airpre-cleaners was much more of an artthan a science. The only way to deter-mine what dimensions were needed tooptimize a design was to perform along and expensive series of build andtest cycles. Once a design was found,further testing was needed to see howthe design scaled across a productline. The cost and time involved inbuilding prototypes limited the numberof prototypes that could be built andoften forced engineers to settle for
Putting the Spin on
Air Pre-CleanersDust and dirt particles are removed from the air intakes of off-highway vehicles using a novel air pre-cleaner.
By Gary RocklitzDonaldson Company, Inc.Minnesota, U.S.A.
The Donaldson TopSpin air pre-cleaner

ANSYS Advantage • Volume I, Issue 1, 2007
AUTOMOTIVE
www.ansys.com 27
good enough rather than optimizeddesigns. The limitations in the physicalmeasurements that could be obtainedfrom an operating pre-cleaner meantthat engineers gained minimal informa-tion from each build and test cycle, somany iterations usually were requiredto optimize the design.
Donaldson engineers have avoidedthese problems for the past severalyears by using CFD to evaluate newdesigns and optimize their performanceprior to the prototype phase. CFD has allowed the engineers to quicklyevaluate alternate configurations andget a much better understanding of whyeach one performs the way it does. Forthis project, simplified pre-cleanerdesigns were built using GAMBIT software. Unnecessary mechanicaldetails were removed to save on computational time and focus on accu-rately depicting the passageways where fluids flow through the pre-cleaner. Arotating reference frame was used tomodel the rotating vanes and paddles.
Each of the 70 models was solvedusing four processors of a 32-processorHewlett Packard Superdome computer.The paths of many differently sized particles were tracked and analyzed.Separation efficiencies were calculatedfor each particle size, and from the individual particle size efficiencies, anoverall mass efficiency was calculated.The particle tracks also were used to graphically illustrate the path of each particle entering the pre-cleaner,
providing valuable information thatengineers used to improve separationefficiency on future designs.
Donaldson engineers first opti-mized the pre-cleaner design withoutincluding the rotating elements. Thegoal at this stage was simply to moveas many particles as possible to thewalls of the pre-cleaner chamber whileminimizing the pressure drop. The veryfirst simulation provided far more infor-mation about the flow regime inside thepre-cleaner than could have beengained from a dozen physical tests. Itshowed the transition of the flow insidethe pre-cleaner chamber from irrota-tional near the outside walls torotational in the center. FLUENT software predicted the size of the “eyeof the hurricane,” information that wassubsequently used to place the rotatingvanes and paddles.
Some other key design parametersthat were adjusted at this stage werethe dimensions of the pre-cleanerchamber, the angle of the conic section used to accelerate the air as it enters the pre-cleaner and the dimensions of the vanes used to swirl the flow. Donaldson engineers madeadjustments to the chamber geometryto provide the highest spin velocity forthe lowest pressure drop.
The model dimensions of the rotating assembly and paddle angleswere adjusted so that the paddlesrotate faster than the swirling air insidethe chamber. This created a pressure
wave high enough to remove the particles. They accomplished this byadjusting the number, size and shapeof the paddles while also performingfurther fine tuning of the vane and conic section angles.
After each design change, they re-ran the simulation in order to measure the impact on the pre-cleanerperformance and the flow regime. Aftercompleting their investigation of 70configurations, Donaldson engineerswere confident that they had optimizedthe design and had good knowledge ofdesign trade-offs. Engineers also usedthe CFD results to calculate the forcesacting on the paddles, which in turnprovided loads for ANSYS finite element analysis software that wasused to validate the mechanical designof the paddles.
The resulting TopSpin pre-cleaneris designed for use with many differenttypes of equipment, ranging fromcrawlers and farm tractors to skid steerloaders. The TopSpin line is available in13 models with outlets ranging fromtwo to seven inches and air flow rangesfrom 100 to 1,600 cubic feet perminute. ISO 5011/SAE J726 testsshowed that, as predicted by the simulation, the pre-cleaner separates99 percent of contaminants 20 micronsand larger. This greatly extends air filter service life. These performancebenefits can largely be attributed to theuse of CFD to optimize the design. n
Velocity vectors on the mid-plane of the air pre-cleaner Particle trajectories in the air pre-cleaner, colored by residence time


ANSYS Advantage • Volume I, Issue 1, 2007www.ansys.com 29
METALLURGY
The blast furnace is perhaps the oldest, but still most widely used, technology for extracting iron from ironore. Inside the brick-lined furnace, acombustion process takes place producing a raw form of iron (pig iron)that subsequently can be refined tomore useful forms through otherprocesses. Since the combustion offuel can be made more efficient usingpre-heated air in any combustionprocess, heat exchangers often arepositioned before the blast furnace.
Vallourec & Mannesmann (V & M)Tubes, the largest manufacturer ofseamless steel tubes in Brazil, togetherwith engineers at Federal University ofMinas Gerais (UFMG) and ESSS, aleading ANSYS software distributor in South America, used FLUENT software to analyze the air flow inside aheat exchanger used in one of V&M’sblast furnaces. The main objective ofthe analysis was to verify the flow con-figuration in the current geometry andsuggest possible improvements thatwould increase the exit temperaturefrom the air pre-heater.
The heat exchanger consists of an array of tubes, each of which is alinear series of U-bends. The tubes areheated by the combustion gases in thefurnace. In the steady-state CFD simu-lation, the standard k-ε model wasused for the turbulent flow and the discrete ordinates (DO) model wasused to account for radiation heattransfer. Combustion was not modeled. Instead, the combustion
gases were approximated by air ofcomparable temperature. The airinside the tubes was modeled as well.
The heat exchanger is large (15 x 4x 2 m3), but the existing geometry issymmetric, so only half of the originalgeometry was analyzed using a tetra-hedral mesh of about 6 million cells. Toreduce the cell count, the tubes weremodeled as zero-thickness walls andthe shell conduction boundary condi-tion was employed to account for thethermal mass of the tube material. Following the CFD simulation, the surface temperature predictions wereused as input to ABAQUSTM to obtainthe deformations and thermal stresseson the tube array that would arise fromsuch a severe thermal load.
The analysis of the heat exchangershowed good agreement with experi-mental data. In particular, the resultsreproduced experimental observationsthat the tube-side air was not beingheated properly. One reason for theproblem was the tendency of the combustion gases to flow over the U-bends of the coils, resulting in limited surface area for heat transfer. To improve the combustion-side flow,modifications were suggested, such as the inclusion of baffles to promotecross-flow of the combustion gasesthrough the coils. A new simulationwas performed on the entire (non-symmetric) geometry of the newly proposed design using about 12.5 million cells. The results showed thatthe new configuration increased
Blast Furnace Air Pre-Heater Gets a Thermal BoostEngineers use CFD to improve heat exchanger performance.
the exit air temperature significantlybecause the baffles successfully modified the flow of the combustiongases through the coils, improving theheat transfer. The modifications havebeen approved by V & M Tubes andwill become effective in the blast furnace design revamp in 2007. n
Temperature inside the heat exchanger tubes as the air flowstoward the front left; the heated air is subsequently used forcombustion in the blast furnace.
Pathlines, colored by temperature, show the improvedflow of combustion gases through the heat exchangertube array and the resultant transfer of heat to the tube array.
By Charles Assunção, V&M do Brazil; Profressor Geraldo Augusto Campolina Franca, Federal University of Minas Gerais, Brazil;and Cesareo de La Rosa Siqueira, Martin Poulsen Kessler and Tales Adriano Ferreira, ESSS, Brazil
Man standing beside the pig iron channel, adjacent to where the hot metal flows

www.ansys.comANSYS Advantage • Volume I, Issue 1, 200730
METALLURGY
Fire Tests for Molten Metal ConvertersNumerical simulation helps engineers peer into a metallurgicalconverter in which high temperatures and adverse conditionsmake realistic measurements impossible to perform.By Hans-Jürgen Odenthal and Norbert Vogl, SMS Demag AG, Germanyand Mark Pelzer, ANSYS Fluent Germany
A basic oxygen furnace converter in operation
In a steel mill, partially processed iron from the blast furnace is transported to a basic oxygen furnace, alsoknown as a converter, to produce liquid steel. The converteris a refractory-lined steel vessel with a holding capacity of up to 400 tons of molten metal at temperatures above1600 °C (2900 °F). In the converter, several jets of oxygen areblown onto the melt surface, and the subsequent oxidation process helps remove undesired secondary elements such as carbon, manganese, silicon, phosphorusand sulphur. Efficient mixing of the melts is helped by additionally introducing inert gases, such as nitrogen orargon, from the floor of the vessel, where they bubble to thesurface. Optimization of the converting process depends ona number of variables, but operating trials and parameterstudies on water models cannot be carried out realisticallyusing experimental methods. Steel producers as well assteel equipment manufacturers therefore are switching tonumerical simulations of the process to optimize the qualityof the final product while minimizing the time and cost ofsteel production.
SMS Demag AG, Düsseldorf, is a leading installationbuilder for the steel and non-ferrous metal industries. Besidesmaking individual components, SMS Demag plans and buildscomplete production lines and turnkey plants. It is a part ofthe SMS Group GmbH, which has interests in metallurgy,forging, casting and rolling technology, engineering services,and plastics engineering. At SMS Demag, a group of expertshas been successfully working in the 100-employee CentralDevelopment area, studying the mutual relationships of individual process parameters with FLUENT software andusing them in industrial applications. The bandwidth stretchesfrom long-term development projects to project-relatedorders and fault analysis on operating plants. Using CFD, theflow and thermal mechanisms taking place in the melt can beanalyzed in detail and displayed, thus considerably facilitatingthe understanding of the process. Three-dimensional projections have been used to augment spatial visualization.The Cave Automatic Virtual Environment (CAVE) at RWTHAachen University in Germany is used for particularly important projects, such as the demonstration of completevirtual plants.

ANSYS Advantage • Volume I, Issue 1, 2007
METALLURGY
www.ansys.com 31
the volume of fluid (VOF) model for tracking the evolution ofthe free surface of the melt and slag, and the discrete phasemodel (DPM) for tracking the trajectories of the inert gas bubbles used for mixing. A Linux® cluster of up to 10 computers was deployed for two weeks to perform a 20 second-long simulation of the 20 minute-long blowingprocess. The high computation times are due, for the most
part, to the complexity of the physicalmodels rather than the size of the mesh.User-defined functions (UDFs) wereemployed to couple the models togetherand incorporate effects such as a varying drag coefficient for the bubbles.
The results provided informationabout the design of the nozzles, the pen-etration of the oxygen jets into the melt,the effectiveness of the agitation schemeand heat transfer into the refractorywalls. Despite the comparatively shortspan of the simulation, the results todate have been sufficient to make cleardecisions about the basic sequences inthe melt and to introduce optimizationmeasures. Thus, each converter can beadapted to the individual requirements ofthe customer. n
Instantaneous images of the molten metal (yellow) and slag (red) free surface after 0.5, 1.5, 2.5, and 3.5 seconds of operation, showing the penetrating oxygen jetsand resulting flow field
One of the primary objectives of the CFD work has centered on the blowing of oxygen into the converter and thesubsequent phenomena induced by this process. The oxygen is delivered into the converter by a top lance, whichterminates in a fitting that contains several Laval nozzles.Each nozzle produces a jet at approximately twice the speedof sound. The jets penetrate deeply into the melt and createoscillation blowing cavities with largereaction surfaces. The top lance isdesigned to avoid undesirable effects,such as metal back-splashing, whichleads to increased wear. The inert gasconduit on the floor is designed to avoidplugging so that sufficient gas can continually be introduced to the melt toachieve the desired agitation.
The process being simulated is ahot, highly turbulent, ever-changing multiphase flow. The model generationbegins with ANSYS ICEM CFD Hexa forthe creation of a 500,000-cell hexahedralmesh with aligned cell layers. In additionto making use of models for turbulenceand heat transfer, the numerical simulation couples together two multiphase models in FLUENT software:
The geometry of a converter, showing therefractory lining and oxygen top lance,terminated with an array of six Laval nozzles.The steel melt is agitated by argon bubblesreleased from several locations on the con-verter floor. During the conversion process,a slag layer forms on the melt surface.

EQUIPMENT MANUFACTURING
www.ansys.comANSYS Advantage • Volume I, Issue 1, 200732
Neutrinos are elusive particles. Nearly massless, theytravel cosmological distances at nearly the speed of light,passing through most material without making a mark. Neutrinos are produced in nuclear reactions in the sun or indying stars; by studying them, scientists can learn aboutextra-galactic events such as supernova explosions,gamma-ray bursts and black holes. Polar ice, which is exceptionally pure, transparent and free of radiation, has emerged as an ideal medium for detecting elementaryparticles like neutrinos. Rather than capture neutrinosdirectly, evidence of collisions between the particles and icecan provide important information about the particles andtheir history.
To take advantage of the special properties of Antarcticice, the IceCube Neutrino Observatory is currently underconstruction at the South Pole. The observatory, designedby the University of Wisconsin and funded by the NationalScience Foundation in the United States, will gather information from cosmic neutrinos that originated in outerspace above the earth’s northern hemisphere. The earthitself will be used as a filter to exclude atmospheric neutrinos, and high-energy cosmic neutrinos will passthrough the earth’s layers, on to the ice cap of the SouthPole, and upward to the IceCube detectors.
The neutrino observatory will consist of a matrix of digital optic monitors (DOMs) buried in the ice. To create thismatrix, 4,800 DOMS are being suspended on vertical stringsin 80 holes that have to be individually drilled into the ice.Each hole is 2,400 meters deep. The holes are created with ahot water drill consisting of a nozzle and 2,400 meters of
Neutrino Detectionin Antarctica Simulation helps speed up
drilling through ice so thatoptic monitors can be installed.
By Dick Martin and Tim Thompson, HYTEC Inc., New Mexico, U.S.A.and Naseem Ansari and Chokri Guetari, ANSYS, Inc.
A diagram of the IceCube Neutrino Observatory
A hose going down into an IceCube hole drilled with thehot-water nozzle
Images courtesy NSF (IceCube).
The IceCube Laboratory at sunriseImage courtesy Katherine Rawlins/NSF (IceCube).

EQUIPMENT MANUFACTURING
ANSYS Advantage • Volume I, Issue 1, 2007www.ansys.com 33
hose connected to a water heatingplant on the surface. The descendinghose melts through the ice as 90°Cwater is pumped through the nozzle ata given spray angle. The water cools toabout 1 to 2°C as the ice melts to create the hole and this water ispumped out the top of the hole. Afterthe string of 60 DOMs is lowered in thehole, the water freezes around them,creating a permanent installation.
The drilling phase of the processoccurs as the drill melts through the ice.During the ream phase, the drill israised with the hot water continuing toflow, enlarging the hole and providingmore time for the heat to conduct intothe ice. By warming the ice surroundingthe hole, it takes longer for the hole toclose. This is critical, as there must beadequate time after producing the holeto insert and lower the optical modulestring before the hole gets too small.
HYTEC Inc. took on the challengeof performing a CFD study to examinethe complex drilling process. HYTEC’sengineering teams conceive, design,build and test ingenious solutions tounique challenges. They meet cus-tomers’ technical, cost and qualityexpectations in a wide range of hightechnology projects. For the IceCubeproject, they focused on the water–icemelting process at the bottom of thedrill hole in hopes of better under-standing the influence of nozzle size,spray angle, water flow rate and watertemperature on hole shape in order toincrease the drilling speed. Because
Pathlines illustrate the flow of water emanating from thenozzle, stagnating at the bottom of the hole, flowingupward, and being partially re-entrained into the jet.
Hosing transports hot water to the drill tower.
the drilling season is limited (fromDecember through February) and thecost to fuel a water-heating plant at theSouth Pole is extremely high, even a 10 percent increase in drilling speedcould save the project large amountsof time and money.
ANSYS CFX software was appliedto this problem because it has the ability to solve turbulent multiphaseflow with conjugate heat transfer in an axisymmetric domain. Multiphase sensitivity studies determined that theheat transfer coefficients on either sideof the water-ice interface were the most influential parameters inobtaining results that compare wellwith site data. A series of steady-statecomputations were performed for twonozzle diameters, two drill speeds andone spray angle. The runs were modeled at 1,292 meters, to allowcomparison with site data.
By reducing the nozzle diameterfrom 1 in to 0.75 inches at the sameflow rate, the hole depth was increasedby 16 to 20 percent. The ANSYS CFX
Velocity vectors showing the hot water jet and the flow ofmelted water surrounded by ice
results showed that using a sprayangle of 25° made little difference inhole depth or diameter. Increasing thedrill speed at a fixed nozzle diametercaused the drill hole depth and holediameter to decrease. Thus, an Ice-Cube drill model was developed toevaluate the performance of nozzledesigns and to specify drill speed versus depth.
During the 2004-2005 South Poledrilling season, drilling speed wasbetween 3.5 and 4.0 ft/min. During the2005-2006 season, a smaller diameternozzle was used based on the ANSYSCFX analysis. The drilling speedalmost doubled to 6.9 ft/min, which will save the project over 1 million dollars. n
Suggested ReadingMartin, Richard A.; Thompson, Tim; Ansari,Naseem; Guetari, Chokri: IceCube CFDDrilling Model. Proceedings of 2006 ASMEJoint U.S.-European Fluids EngineeringSummer Meeting: FEDSM2006-98042.Miami, FL, July 17-20, 2006.

www.ansys.comANSYS Advantage • Volume I, Issue 1, 200734
MATERIALS
By John Krouse, ANSYS Advantage
Established in 1910 by the U.S.Department of Agriculture Forests Ser-vice, the Forest Products Laboratoryserves the public as the nation’s leading wood research institute and isinternationally recognized as an unbiased technical authority on woodscience and utilization. The lab is thepublic side of the public-private part-nership needed to create technologyfor the long-term sustainability offorests. According to a recent study,tax dollar investment in forest productsresearch generates as much as a 300 percent return to society.
One particular area of research atthe lab is focused on more preciselyestablishing the thermal conductivityof wood. This property is of criticalimportance in the drying process sincetoo little heat treatment results inretained moisture and long dryingtimes while too much treatment maydamage the structure of the wood.Conventional models developed morethan 50 years ago serve as a roughguideline for calculating an averagethermal conductivity for certain typesof wood. However, because of theinherent inaccuracies of this approach,lumber mills and wood processingcompanies must perform trial-and-error tests to determine propertemperatures and drying times — acostly, time-consuming process thatoften results in high scrap rates.
The heat transfer coefficients ofwood depend on many variables,including ring density, the age of thetree, initial moisture content and orien-tation of the cells. Porosity can rangefrom 70 to 90 percent in earlywood andfrom 10 to 30 percent in latewood
growth. Moreover, in softwood, thecells tend to align in straight rows in theradial direction and are offset in the tangential direction. Compounding thedifficulty, these characteristics usuallyare not uniform across all sections ofthe same tree, since wood structure
The ANSYS Parametric Design Language helps establish the thermalconductivity of wood and composites to enable more effective heattreatment processes.
Making Sure Wood Gets Heat Treated with Respect
Micro-level analysis models represent different wood cell orientations, with softwood cells aligning in straightrows (top) and hardwoods having cells offset by perhaps 50 percent (bottom).
Radial Fluxpath
Radial Fluxpath
Radial Direction
Radial Direction
Tangential Fluxpath
Tangential Fluxpath
Tangential Direction
Tangential Direction
Line
Line
Line
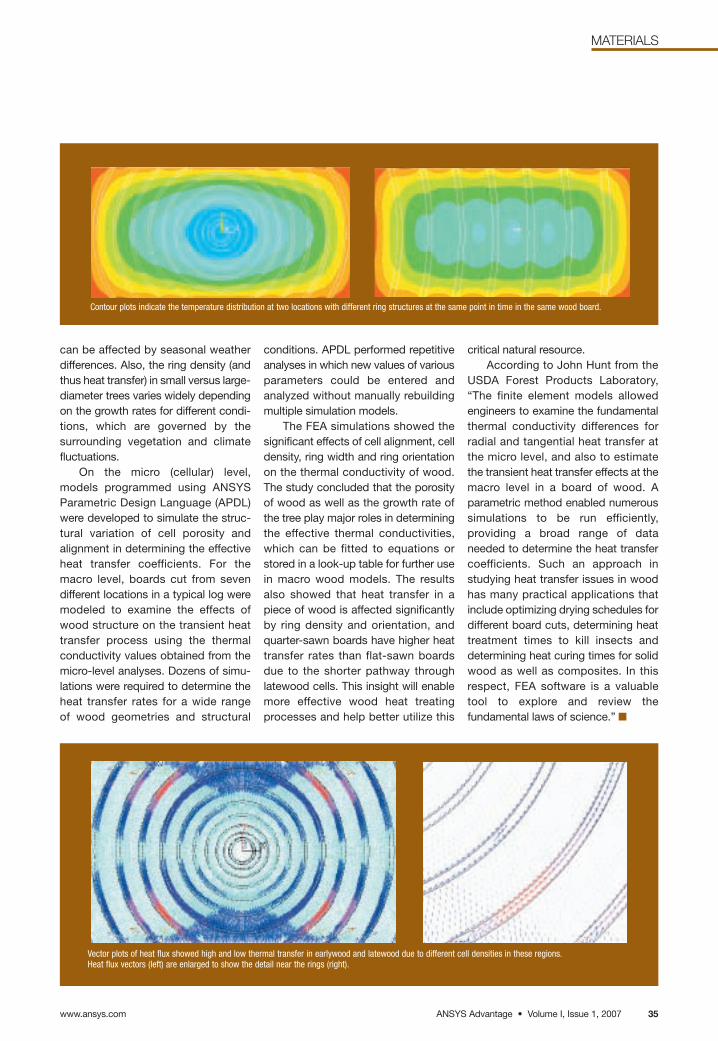
ANSYS Advantage • Volume I, Issue 1, 2007
MATERIALS
www.ansys.com 35
can be affected by seasonal weatherdifferences. Also, the ring density (andthus heat transfer) in small versus large-diameter trees varies widely dependingon the growth rates for different condi-tions, which are governed by thesurrounding vegetation and climatefluctuations.
On the micro (cellular) level, models programmed using ANSYSParametric Design Language (APDL)were developed to simulate the struc-tural variation of cell porosity andalignment in determining the effectiveheat transfer coefficients. For themacro level, boards cut from seven different locations in a typical log weremodeled to examine the effects ofwood structure on the transient heattransfer process using the thermalconductivity values obtained from themicro-level analyses. Dozens of simu-lations were required to determine theheat transfer rates for a wide range of wood geometries and structural
conditions. APDL performed repetitiveanalyses in which new values of variousparameters could be entered and analyzed without manually rebuildingmultiple simulation models.
The FEA simulations showed thesignificant effects of cell alignment, celldensity, ring width and ring orientationon the thermal conductivity of wood.The study concluded that the porosityof wood as well as the growth rate ofthe tree play major roles in determiningthe effective thermal conductivities,which can be fitted to equations orstored in a look-up table for further usein macro wood models. The resultsalso showed that heat transfer in apiece of wood is affected significantlyby ring density and orientation, andquarter-sawn boards have higher heattransfer rates than flat-sawn boardsdue to the shorter pathway throughlatewood cells. This insight will enablemore effective wood heat treatingprocesses and help better utilize this
critical natural resource.According to John Hunt from the
USDA Forest Products Laboratory,“The finite element models allowedengineers to examine the fundamentalthermal conductivity differences forradial and tangential heat transfer atthe micro level, and also to estimatethe transient heat transfer effects at themacro level in a board of wood. Aparametric method enabled numeroussimulations to be run efficiently, providing a broad range of data needed to determine the heat transfercoefficients. Such an approach instudying heat transfer issues in woodhas many practical applications thatinclude optimizing drying schedules fordifferent board cuts, determining heattreatment times to kill insects anddetermining heat curing times for solidwood as well as composites. In thisrespect, FEA software is a valuabletool to explore and review the fundamental laws of science.” n
Contour plots indicate the temperature distribution at two locations with different ring structures at the same point in time in the same wood board.
Vector plots of heat flux showed high and low thermal transfer in earlywood and latewood due to different cell densities in these regions.Heat flux vectors (left) are enlarged to show the detail near the rings (right).
www.ansys.comANSYS Advantage • Volume I, Issue 1, 200736
THOUGHT LEADERS
Honeywell Aerospace is a leadingglobal provider of integrated avionics,engines, systems and service solutionsfor aircraft manufacturers, airlines,business and general aviation, military,space and airport operations. A strategic business unit of parent firmHoneywell International, the companyemploys 40,000 people in 97 manufac-turing plants, design centers andservice sites around the world.
Despite initiatives such as Designfor Six Sigma (DFSS), typical problemsexperienced by a global organizationof this type in developing complexproducts include lengthy designcycles, the inability to predict product performance early in design, missingproduct release schedules, cost over-runs, slowness to adapt to marketchange and inefficiencies in utilizingdesign centers around the world.Competitive pressures demand thatend-to-end cycle times be com-pressed while lowering costs andmaintaining high quality standards forinnovative product designs.
In July 2005, Honeywell Aerospacereorganized to address these chal-lenges. At the foundation of this change
was Velocity Product Development(VPD™), a process for making dramaticimprovements in cycle times and success rates for new products. With a lean focus on engineering and development, VPD is based on DFSSand works synergistically with the company’s advanced manufacturingand marketing groups to ensure astreamlined and quality-focused product development process.
Engineering simulation plays a critical role in enabling Honeywell Aero-space to reach the ambitious goal ofVPD to reduce cycle times up to 50 percent. Through the use of analysistools from ANSYS, engineers addressseveral areas that often cause delaysand other problems in the productintroduction cycle. Simulation allowsproduct performance and risk to beassessed and mitigated early in devel-opment so that troubleshooting andcorrecting problems with hardware pro-totypes can be avoided. Problems arefixed up front rather than later in thedesign cycle, so re-work is reduced.Simulation-driven development guidesthe design and enables engineers tocreate and assess innovative ideas
AcceleratingProduct Development in a Global EnterpriseWith the goal of compressing cycle times by up to 50 percent, theVelocity Product Development (VPD™) initiative at Honeywell Aerospaceuses engineering simulation to eliminate delays while lowering cost and maintaining high quality standards for innovative designs.
By Lee Williams, Vice President (ret.)Defense and Space Business Honeywell Aerospace, Arizona, U.S.A.
Lee Williams

ANSYS Advantage • Volume I, Issue 1, 2007
THOUGHT LEADERS
www.ansys.com 37
that might not otherwise have emergedby studying various alternatives andoptimizing the best ones.
At the inception of VPD, the ToyotaProduct Development System wasstudied to help formulate the processesto be used in Honeywell’s approach.While the Toyota system is not a drop-in solution for aerospace productdesign, there are applicable methodsand disciplines. In particular, their Set-Based Concurrent Engineering (SBCE)method and culture of disciplinedKnowledge Management (KM) wereidentified for adoption by Honeywell.
For example, a chief engineer orsystems design lead submits a targetspecification to subsystem designteams. The specification is highlyaligned to the “Critical to Quality” customer requirements of the designoffering. Initially, each subsystem teamdefines a design space of alternativeapproaches to achieve a robust systemdesign offering. The subsystem teamsthen meet to present their design alter-natives and collectively performsuccessive system-level experimentsdesigned to find the optimal solution.These specifications are then succes-sively cascaded down to the design ofindividual components. Simulation isessential in executing this process efficiently. Analysis at the system levelis necessary to determine loads onsubsystems and assemblies and com-
ponent parts — with all designs studiedcarefully with computer models.
Within Honeywell’s VPD initiative,ANSYS technology is particularly valuable for stress, vibration and heat-transfer analyses of rotating hardwaresuch as fans and compressors, as wellas static equipment such as engineframes and cases. Linear and non-linear analysis is done, often taking intoaccount creep, plasticity and contactforces. Optimization and design ofexperiment (DOE) studies are done to evaluate and refine designs. Themodels carry a fair amount of detail and make use of fine meshes to accurately represent the complex contours of aerospace components.
In one study to predict vibration inmistuned jet-engine turbines, a para-metric finite element model of animpeller blade was created with a specified range of variables defining itsshape. ANSYS Probabilistic DesignSystem (PDS) then automatically wentthrough numerous iterations in whichmodal deformation and stress weredetermined for various blade geome-tries. A transfer function based on thePDS database of the results helpeddefine the regions of the airfoil in whichgeometric variations have the greatestimpact on vibration. This informationthen was used to optimize the design ofthe blade for minimal stress and vibration within a range of operating
frequencies. In this way, the best designof the blade for a particular applicationcould be determined. The use of simulation to achieve this goal savedmonths of time and tens of thousands of dollars in hardware testing.
As Honeywell Aerospace movesforward with VPD, the focus will be onthe following:
• Establishing one set of development processes todeploy globally
• Using common design and simulation tools
• Assuring technology readinessbefore starting detailed design
• Improving the development estimating processes and disciplines
• Becoming obsessive about“Design to Unit Cost”
• Significantly increasing “DesignRe-use”
At Honeywell, VPD is a key part ofthe “Lean Enterprise” in which valuefrom the customer’s perspective drivesthe process, waste is eliminated, andthe workforce is involved in an atmos-phere of continuous improvement.Engineering simulation is a key elementenabling the company to meet theseobjectives and strengthen its competi-tive position in the aerospace market. n
ANSYS software is used by Honeywell Aerospace in its Velocity ProductDevelopment processes for analysis of hardware such as this jet-engine impeller,in which the blade design was optimized for minimal stress and vibration within arange of operating frequencies.

With medical costs skyrocketing and health care systems overburdenedby an aging population, experts acknowledge that the way diseases are treated must be changed radically. Undoubtedly, heavy investments must bemade into addressing largely preventable diseases such as diabetes, heartdisease and lung cancer. Furthermore, approaches must be established todetect diseases earlier in their course and regenerate functions as much aspossible in patients rather than solely ameliorate symptoms.
One significant barrier for the medical community in this critical cycle ofeffective prevention, early diagnosis and functional regeneration has been alack of sufficient analysis capability and computer processing power for real-time simulations of these procedures, which typically include complexmechanical structures and biomaterials. Recently, however, advanced analysis technologies and powerful computational resources have converged,enabling engineers and scientists to simulate device performance and regenerative medical procedures in ways previously thought unimaginable.
Stent Analyses Expand Students’ Exposureto Biomedical EngineeringEngineering students gain insight into thephysics of medical devices and add to thebody of knowledge on stenting procedures.
By Dr. Michael Lovell, Associate Dean forResearch and Director, Swanson Institute forTechnical ExcellenceUniversity of Pittsburgh, Pennsylvania, U.S.A.
Students at the University of Pittsburgh used the ANSYS Workbench platform in modeling the complex weave geometry of an intravascular stent (left) as well as the deployment procedure (right) in which a balloon expands the device against the artery wall.
Professor Michael Lovell directed the studentresearch on intravascular stents
www.ansys.comANSYS Advantage • Volume I, Issue 1, 200738
ACADEMIC NEWS

The ability to use commercial analysis packages such asANSYS software has allowed the scientific community totreat diseases in radical new ways using a broad range ofmultidisciplinary approaches. By having the capability of simulating complex medical treatments that include phenomena such as dynamic contact, nonlinear materialsand fluid structure interaction, the bioengineering communityhas been able to bring products and technology from thebench to the bedside in a fraction of time that it did a fewyears ago.
At the University of Pittsburgh in the United States,these critical issues are being integrated into engineeringcurricula. In one class research project, students utilized theANSYS Workbench suite of design and structural analysissoftware to simulate the deployment of intravascular stents:devices inserted into blocked arteries and radially expandedwith a small balloon to open the artery and enhance bloodflow. Through these simulations, the design of the devicewas optimized to maintain proper blood flow while preventing elastic recoil of the artery. ANSYS Workbenchalso provided a better understanding of the stresses devel-oped between the stent and artery so that mechanical injuryto the artery can be reduced. Such insight is significant in minimizing the risk of neointimal hyperplasia, an inflammation and subsequent build-up of excess cells thateventually result in restonosis, the narrowing and eventualclosing of the artery.
Based on solid models of the device at various stagesof the deployment, finite element models of the stent — aswell as the deployment balloon and arterial wall — wereeffectively developed, with the quality of the mesh produced by the ANSYS Workbench platform having a dramatic impact on the solution time and accuracy of
the simulations. Utilizing an advanced material model thatincludes elastin and collagen fibers for the artery, a hyper-elastic model for the balloon and an isotropic model for thestent, student researchers were able to obtain detailed stressdistributions in the artery wall when the balloon was expandedinto the stent. Such information is critical to optimizing thedesign of the stent and the stenting procedure, which will ultimately eliminate the occurrence of restonosis.
Projects such as this add significantly to the body ofinformation in the medical community on stenting procedures while having a tremendous education value forengineering students. Simulation provides insight into thephysics of stents, better understanding of the behavior ofartery walls so potential problems can be spotted quicklyand alternative designs readily evaluated. Moreover, whileperforming this work, students learn firsthand how to useadvanced analysis tools such as ANSYS software that arewidely used throughout industry. n
The detailed ANSYS model includes elastin and collagen fibers for the artery,a hyperelastic model for the balloon and an isotropic model for the stent.
ANSYS simulation provided detailed stress distributions in the artery wallwhen the balloon expanded the intravascular stent.
ANSYS Advantage • Volume I, Issue 1, 2007
ACADEMIC NEWS
www.ansys.com 39
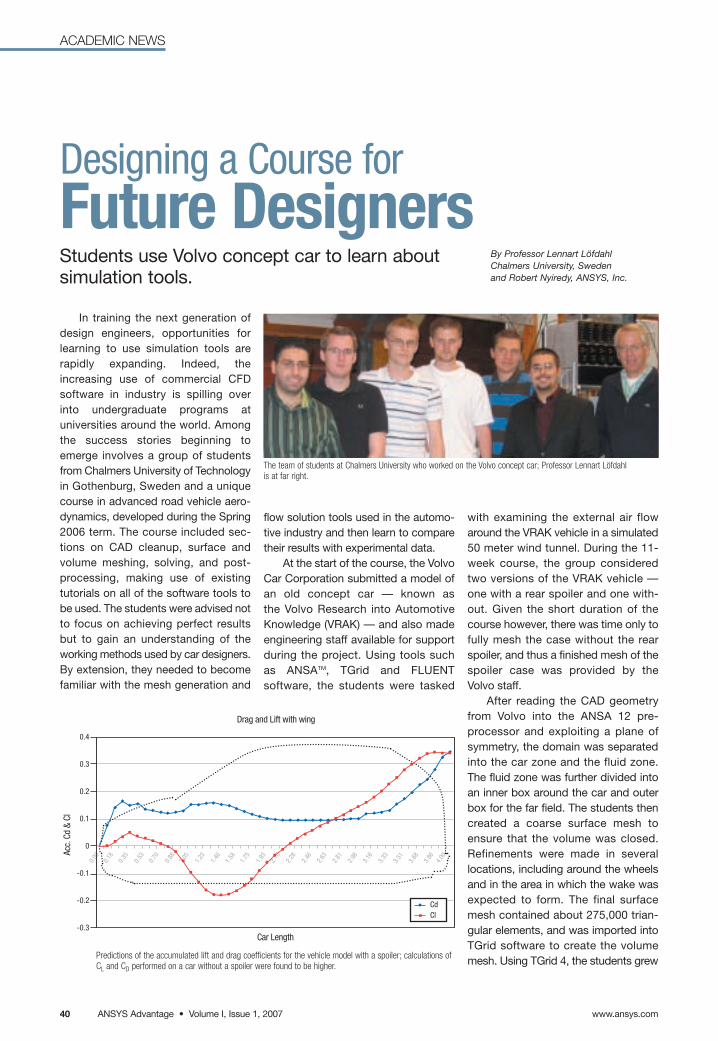
www.ansys.comANSYS Advantage • Volume I, Issue 1, 200740
ACADEMIC NEWS
Designing a Course forFuture Designers
By Professor Lennart Löfdahl Chalmers University, Sweden and Robert Nyiredy, ANSYS, Inc.
In training the next generation ofdesign engineers, opportunities forlearning to use simulation tools are rapidly expanding. Indeed, the increasing use of commercial CFD software in industry is spilling over into undergraduate programs at universities around the world. Amongthe success stories beginning toemerge involves a group of studentsfrom Chalmers University of Technologyin Gothenburg, Sweden and a uniquecourse in advanced road vehicle aero-dynamics, developed during the Spring2006 term. The course included sec-tions on CAD cleanup, surface andvolume meshing, solving, and post-processing, making use of existingtutorials on all of the software tools tobe used. The students were advised notto focus on achieving perfect resultsbut to gain an understanding of theworking methods used by car designers.By extension, they needed to becomefamiliar with the mesh generation and
flow solution tools used in the automo-tive industry and then learn to comparetheir results with experimental data.
At the start of the course, the VolvoCar Corporation submitted a model ofan old concept car — known as the Volvo Research into AutomotiveKnowledge (VRAK) — and also madeengineering staff available for supportduring the project. Using tools such as ANSATM, TGrid and FLUENT software, the students were tasked
with examining the external air flowaround the VRAK vehicle in a simulated50 meter wind tunnel. During the 11-week course, the group consideredtwo versions of the VRAK vehicle —one with a rear spoiler and one with-out. Given the short duration of thecourse however, there was time only tofully mesh the case without the rearspoiler, and thus a finished mesh of thespoiler case was provided by the Volvo staff.
After reading the CAD geometryfrom Volvo into the ANSA 12 pre-processor and exploiting a plane ofsymmetry, the domain was separatedinto the car zone and the fluid zone.The fluid zone was further divided intoan inner box around the car and outerbox for the far field. The students thencreated a coarse surface mesh toensure that the volume was closed.Refinements were made in severallocations, including around the wheelsand in the area in which the wake wasexpected to form. The final surfacemesh contained about 275,000 trian-gular elements, and was imported intoTGrid software to create the volumemesh. Using TGrid 4, the students grew
The team of students at Chalmers University who worked on the Volvo concept car; Professor Lennart Löfdahlis at far right.
Predictions of the accumulated lift and drag coefficients for the vehicle model with a spoiler; calculations ofCL and CD performed on a car without a spoiler were found to be higher.
Car Length
Drag and Lift with wing
Acc.
Cd &
Cl
0.4
0.3
0.2
0.1
0
-0.1
-0.2
-0.3
0.00
0.18
0.35
0.53
0.70
0.88
1.05
1.23
1.40
1.58
1.75
1.93
2.10
2.28
2.46
2.63
2.81
2.98
3.16
3.33
3.51
3.68
3.86
4.00
CdCl
Students use Volvo concept car to learn about simulation tools.

ANSYS Advantage • Volume I, Issue 1, 2007
ACADEMIC NEWS
www.ansys.com 41
Pathlines colored by velocity magnitude were used to visualize the flow features in the wake of the car, including a pair of trailing vortices (left) and flow separation (right).
prisms from the surfaces of the vehicleto get good resolution of the boundarylayer zones and then generated a tetra-hedral mesh for the fluid regioncontaining about 3.4 million cells.
The group next loaded the finishedmesh into FLUENT 6.3 and simulatedthe viscous effects by using the realiz-able k-ε model. They chose this modelbecause it limits the prediction of normal stresses, which they felt was appropriate given the heavily bentstreamlines that were expected. A constant velocity inlet boundary condi-tion of 140 km/h (87 mph) was used. To follow Volvo’s wind tunnel experimentsas closely as possible, both the roadand the wheels were stationary in the simulation, and boundary layer suction was not considered due totime considerations.
Results of the simulations showedthat the addition of a rear spoilercaused the values for the drag and liftcoefficients to decrease in the wakeregion behind the vehicle by 4 percentand 7 percent, respectively. With orwithout a spoiler however, both coeffi-cient values increased at the back endof the vehicle relative to the front. Thedrag increase was due to the samerear wake region. The increase in liftwas due to the higher velocities on thetop side of the vehicle, which had the consequence that the pressure on topwas smaller than on the underside.
Also of interest to the group wereoil flow visualizations, with which thestudents could investigate the flowpatterns over the rear body in theregion of the wake. These visualiza-tions helped the group find where theflow separation occurred. With the
Oil film visualization was used to illustrate the different flow separation patterns.
addition of the rear spoiler, the flowseparation occurred farther behind the vehicle. Physically this meant thatthe drag force was reduced at thatlocation, which agreed with the calcu-lated values of the coefficients.Velocity pathlines served to furtherillustrate the point of separation.
With the analysis completed, theproject results were presented to anaudience that included representativesfrom the Chalmers faculty, Volvo andANSYS. With little or no experiencewith commercial CFD tools prior to thecourse, the general impression wasthat the group had done good work.Although the students are on different career tracks, it is likely that all of them will continue to work withCFD in the future and use the softwarethat helped them succeed in this memorable exercise. n

www.ansys.comANSYS Advantage • Volume I, Issue 1, 200742
ANALYSIS TOOLS
Eigensolvers determine natural frequencies and modeshapes of structures, typically some of the most computa-tionally demanding tasks in structural analysis. ANSYS 11.0software improves upon its extensive selection of thesetools with a new eigensolver that combines the speed andmemory savings of the ANSYS PCG iterative solver with therobustness of the Lanczos algorithm. This powerful combi-nation allows users to solve for the natural frequencies andmode shapes of their model using fewer computationalresources, often in shorter total elapsed times than othereigensolvers available on the CAE market.
Starting Up PCG LanczosThe PCG Lanczos eigensolver can be selected using
the LANPCG label with the MODOPT command (or in the Analysis Options dialog box). ANSYS Workbench userscan choose this eigensolver simply by selecting the Iterativeoption in the Analysis Settings details pane.
The PCG Lanczos eigensolver works with the PCGoptions command (PCGOPT) as well as with the memory
Introducing the PCG Lanczos EigensolverA new eigensolver in ANSYS 11.0 determines natural frequencies andmode shapes using less computational power, often in shorter totalelapsed times than other tools on the market.
By Jeff Beisheim, Senior Development Engineer, ANSYS, Inc.
saving feature (MSAVE). Both shared- and distributed-memory parallel performance can benefit from this eigen-solver. Note that in version 11.0, Distributed ANSYS softwaresupports modal analyses, and the PCG Lanczos eigensolveris the only eigensolver available that runs in a distributedfashion in this software.
Controlling the ParametersThe PCG Lanczos eigensolver can be controlled using
several options on the PCGOPT command. The first of theseoptions is the Level of Difficulty value (Lev_Diff). In mostcases, choosing the default value of AUTO for Lev_Diff is sufficient to obtain an efficient solution time. However, insome cases you may find that manually adjusting theLev_Diff value further reduces the total solution time. Settinghigher Lev_Diff values (e.g., 3 or 4) can help for problems thatcause the PCG solver to have some difficulty in convergence.This typically occurs when elements are poorly shaped or arevery elong-ated. A new Lev_Diff value of 5 is available in version 11.0 and warrants further explanation.
An automotive suspension model with more than 8 million nodes demonstratedthe power of the PCG Lanczos eigensolver and its performance in DistributedANSYS software.

ANSYS Advantage • Volume I, Issue 1, 2007www.ansys.com 43
ANALYSIS TOOLS
A Lev_Diff value of 5 causes a fundamental change tothe equation solver being used by the PCG Lanczos eigen-solver. It replaces the PCG iterative solver with a directsolver similar to the Sparse direct solver making the PCGLanczos eigensolver behave more like the Block Lanczoseigensolver. Due to the amount of computer resourcesneeded by the direct solver, choosing a Lev_Diff value of 5essentially eliminates the reduction in computer resourcesobtained by using the PCG Lanczos eigensolver comparedto using the Block Lanczos eigensolver. Thus, this option isgenerally only recommended for problems that have lessthan 1 million degrees of freedom (DOF), although its efficiency is highly dependent on several factors such as thenumber of modes requested and I/O performance, forexample. A larger number of modes may increase the sizeof problem for which a value of 5 should be used whileslower I/O performance may decrease the size of problemfor which a value of 5 should be used.
While the PCG Lanczos eigensolver has many innova-tive algorithms to guarantee that no modes are missed,another new option on the PCGOPT command allows usersto force a Sturm sequence check that helps guarantee thatthis is the case. It is important that users keep in mind that aSturm sequence check works by using a direct solver toperform a numeric factorization after the Lanczos algorithmfinishes. This factorization involves a large number of com-putations. It should also be noted that if using a Lev_Diffvalue of 1 through 4, executing a Sturm sequence check willeliminate the savings in computer resources obtained byusing the PCG Lanczos eigensolver compared to using theBlock Lanczos eigensolver.
Guidelines on Using the ToolTypically, the following conditions must be met for the
PCG Lanczos eigensolver to be most efficient:• The model would be a good candidate for using the
PCG solver in a similar static or full transient analysis.
• The number of requested modes is less than 100.
• The beginning frequency input on the MODOPT command is zero (or near zero).
Like all iterative solvers, the PCG Lanczos eigensolver ismost efficient when the solution converges quickly. If a modelwould not converge quickly in a similar static or full transientanalysis, the PCG Lanczos eigensolver would not be expected to converge quickly either and would therefore beless efficient. Other factors such as the size of the problemand the hardware being used can affect the decision of whicheigensolver to use. For example, on machines with slow I/Operformance or limited hard drive space, the PCG Lanczoseigensolver may be the better choice.
A comparison of the Block Lanczos and PCG Lanczos solvers for a problem with 1 million degrees of freedom. The simulations were run on a Dell® 670 workstation running Windows® x64 with a 3.6 GHz single-core Xeon® EM64T chip and 4 GB RAM.
Comparing EigensolversThe accompanying chart shows a sample comparison
of solution times between the Block Lanczos and PCGLanczos eigensolvers for a 1-million DOF model. Whenrequesting 10 modes for this model, the PCG Lanczoseigensolver is faster. At higher numbers of modes, however,the Block Lanczos eigensolver becomes the faster option.
In other runs, as problem size increased the PCG Lanc-zos eigensolver was faster than the Block Lanczoseigensolver at a higher number of requested modes. Forexample, when solving this model with 500,000 DOF, thePCG Lanczos eigensolver was faster when computing lessthan 20 modes. At 1 million DOF, the PCG Lanczos eigen-solver was faster when computing less than 40 modes.
Parallel Performance in Distributed ANSYSA suspension model with more than 8 million nodes was
used to demonstrate the power of the PCG Lanczos tech-nology along with the performance of this eigensolver inDistributed ANSYS. This model was solved on an SGI®
Altix® Linux server with Itanium®-II processors. Requesting10 modes with a model of this size would likely take several days using the Block Lanczos eigensolver.
Using one processor, the PCG Lanczos eigensolver wasable to find the requested modes in 37 hours. Using 10processors dropped the elapsed time to six hours, demon-strating how the combination of the powerful PCG Lanczosalgorithm along with the parallel performance of DistributedANSYS makes the PCG Lanczos eigensolver one of thefastest eigensolvers available in the CAE market today. n
Number of Requested Modes
100
80000
70000
60000
50000
40000
30000
20000
10000
05010
Block Lanczos
PCG Lanczos

www.ansys.comANSYS Advantage • Volume I, Issue 1, 200744
TIPS & TRICKS
Historically, there have been occa-sions when the right combination ofpeople and events has spawned tech-nological advances that have effectedgreat change in history. For numericalsimulation, the mid-20th century wasone such period. At that time, numeri-cal simulation began to move to theforefront of engineering design anddevelopment. Since then, the scope ofsimulation tools available, computingcapabilities and interest in using computer-aided engineering (CAE) tosolve problems has grown. As designengineers consider how many environ-mental, structural, thermal and otherfactors to take into account in thedevelopment of a new product or theanalysis of an existing one, they knowthat more is usually better. That is,more factors and a larger systemmodel generally will produce morevaluable information and allow for thedevelopment of a better final product.Unfortunately, this potential gain hashad to be balanced by the reality that
CAE Cross TrainingEngineers today need to be proficient in not one, but many analysis tools.
By Marty Mundy, ANSYS, Inc.
more comprehensive analyses takemore time to perform and ultimatelycost more money. During the past 10years, however, CAE software andcomputational capabilities have devel-oped to a point where such types ofanalyses have become routine. As aresult, designers are in a position inwhich they can consider performingmore complex multidisciplinary analyses than ever before. To be successful in this new environment,they need to understand the variety oftools available, what those tools canaccomplish and how they can worktogether. In short, the analyst of todayis in need of CAE cross training.
For starters, all CAE tools aredesigned to reduce the costs of alter-native efforts, like prototype testing,and to provide more detailed informa-tion than can be gathered byexperimental means. At a core level,most CAE methodologies follow thesame basic steps:
• Pre-processing: the proceduresused to set up a simulation,such as defining the geometry, boundary conditions and initialconditions
• Performing the calculation: themeat of the analysis, in whichthe problem is solved to answer one or more questions
• Post-processing: the proceduresand tools used to visualize andanalyze the results of the calculation
Because the same basic steps areused in most types of CAE, if oneunderstands the process followed for
one type of analysis, it is a fairlystraightforward matter to understandthe others.
Structural AnalysisIn the 1940s, structural simulation
tools based on finite element analysis(FEA) initially were developed to studyvibration. Further developments forapplications in the automobile andaerospace industries soon followed.Over the years, FEA applications have broadened to include the studyof loading, failure limits, materialresponse, thermal applications andmore. The FEA calculation uses thefinite element method to calculate thestress and strain responses of a struc-ture to initial or external conditions,analyzed as a series of smaller sub-structures or elements. Theseresponses are analyzed as stress con-centrations, displacements, vibrationresponses, and the prediction of reso-nant frequencies. During the solution,the initial loads, referred to as thestructure load vector, are used to calculate a stiffness matrix for eachelement. The stiffness matrix consistsof proportionality constants that relateapplied forces to resultant displace-ments. These displacements are used,in turn, to determine the behavior ofthe entire structure under analysis.The calculation is performed eitherthrough a direct or iterative process.For a thermal analysis, load vectors inthe form of heat fluxes or nodal temperature constraints are used andan overall energy balance throughoutthe domain is sought. The finite element method, while initially
FEA simulations, such as the spring plate shown here,take into account factors such as contact between com-ponents and loading in order to predict displacement.The initial mesh is shown on the left while the contourplot on the right depicts displacement.

ANSYS Advantage • Volume I, Issue 1, 2007
TIPS & TRICKS
www.ansys.com 45
In this example, CFD is used to study the reactionof a puddle as a car travels through it.
developed for structural analyses, alsois used in fluid mechanics and forother numerical analyses.
Computational Fluid DynamicsThe development of computational
fluid dynamics (CFD) began in the1950s and was introduced into theaerospace industry in the 1960s. CFDsolvers implement one or more of threeprimary numerical techniques: finitevolume, finite element or spectral element, in order to solve a series ofcoupled, non-linear differential equa-tions. The differential equations areused to describe the conservation ofmass and momentum, for example, orthe transport of quantities such as heatand turbulence. In general, the equa-tions include terms that represent thechange of a quantity though mecha-nisms like convection, diffusion andsource or sink terms. CFD simulationscan be performed for equilibrium(steady-state) or transient (time-marching) conditions. Turbulencemodels have played an important rolein the development of CFD. The robustk-ε model was introduced by the FluidDynamics Group at Los AlamosNational Laboratory in the UnitedStates in the 1960s and is still widelyused today. It was not until the 1980sthat CFD entered the mainstreamindustrial market. Its presence in theindustrial community has laggedbehind that of FEA, primarily due to the
An FSI simulation was done using FIDAP to predict thedeformation of the outer trachea wall, with velocity vectors shown at the bronchi exits. The shadow of theinner trachea wall is also shown. (CT data courtesy Dr. Thomas Frauenfelder, University Hospital of Zurich,Switzerland.)
computational demands of the under-lying physics and chemistry, which canbe difficult to solve simultaneously.
Fluid Structure InteractionCoupled CAE simulations combine
two or more different types of simula-tion and allow the engineer to betterunderstand certain scenarios. The ability to combine tools together canenable design optimization to its fullestextent, giving a competitive edge to those who pursue this route. Forexample, fluid structure interaction(FSI) tools have enjoyed a rapid gain inpopularity for applications rangingfrom sail design to artificial heart valveanalysis.
As the name suggests, FSI is acoupled fluid–structural analysis thatallows a structure to have a physicalresponse to fluid behavior. Often, theproblems faced by engineers are notindependent of the environmental conditions, but rather factors of them.In the FSI methodology, the mechanicalload that a fluid imparts on a solid bodyis used to predict the deformation,motion or vibrational response of thatbody. The deformation of the solidsimultaneously changes the boundaryconditions that affect the fluid behaviorand are thus taken into account in asubsequent iteration of the fluid analysis. Additional applications of FSIinclude the study of airplane wingfatigue, the effect of detonation
on a structure, airbag or parachutedeployment, and the effect of wind onurban structures.
The CAE spectrum of tools is usedevery day in the design, guidance andoptimization of applications that areused in the manufacturing, environ-mental and nuclear industries, to namea few. With the goals of reducing prototype costs, reducing product timeto market, and providing insight intootherwise less understood phenomena,CAE developments are ever advancingand broadening the scope of capabilitiesof the engineer. n

www.ansys.comANSYS Advantage • Volume I, Issue 1, 200746
TIPS & TRICKS
Radiation can play an important rolein heat transfer analyses. In ANSYSWorkbench Simulation, a “Radiation”load is available that allows users toaccount for losses to the surroundings,although this does not include radiationexchange between surfaces. To utilizethe ANSYS surface-to-surface radiationcapabilities, an easy method is availableto include these effects within ANSYSWorkbench Simulation via NamedSelections and a Command object.
How Heat RadiatesRadiation is a highly nonlinear
mode of heat transfer. A simplifiedform of the equation describing radia-tion from one surface to another is:
in which A is the surface area, ε is theemissivity of the surface, F is the viewfactor between surfaces, σ is the Stefan–Boltzmann constant, and Ti
and Tj are the two surface temperaturesin absolute temperature units.
When using the Radiation load inANSYS Workbench Simulation, theuser enters the emissivity and ambienttemperature, while the form factor Fij isassumed to be 1.0. In this situation, Ti
reflects the absolute temperature of anode on the surface while Tj representsthe ambient temperature. Temperaturevalues are specified in °C or °F, andANSYS Workbench Simulation auto-matically converts these values toKelvin or Rankine, respectively.
View-Factoring Radiationinto ANSYS Workbench SimulationThe ANSYS Radiosity Solution Method accounts for heat exchangebetween surfaces using Named Selections and a Command object.
By Sheldon Imaoka, ANSYS, Inc.
This method is suitable when radi-ation only occurs to space and nosurfaces are assumed to radiatebetween one another. In cases inwhich radiation occurs between sur-faces of the model, however, thisbuilt-in ANSYS Workbench SimulationRadiation load is not sufficient, andsurface-to-surface radiation utilizingthe ANSYS Radiosity Solution Methodis needed instead.
Performing Radiosity SolutionsThe Radiosity Solution Method
differentiates each independent regionof radiation as an enclosure. Withineach enclosure, view factors are deter-mined, and the radiated heat flux iscomputed between each element faceas well as to space, if the enclosure is open.
It is worthwhile to note that con-duction and radiation calculations areperformed in a segregated fashion.Depending on the degree of radiationheat flow in the model, the solutionmay require more iterations than regular ANSYS conduction-basedsolutions.
To use the Radiosity SolutionMethod, the following two steps areperformed:
1. Designate surfaces that willradiate to each other via NamedSelections.
2. Insert necessary ANSYS Parametric Design Language(APDL) commands using aCommand object.
To create Named Selections, sur-faces (or edges in 2-D) are selected andthe “Create Selection Group” icon onthe Named Selection toolbar is chosen.Surfaces that radiate between eachother in an enclosure can be defined inone or several Named Selections. Theonly point the user needs to keep inmind is that all surfaces in a givenNamed Selection will be assumed tohave the same emissivity values. Withmultiple Named Selections, however,each set of surfaces can have differentvalues of emissivity.
As an example, consider one hollow block positioned inside another.Two Named Selections (REGION_Aand REGION_B — one for each block)are needed to represent all surfacesthat can radiate between each other.By making use of two Named Selec-tions, the emissivity values of theREGION_A surfaces can be specifiedindependent of those of theREGION_B surfaces.
In addition to specifying the surfaces of the blocks that can radiatebetween each other, a Commandobject also needs to be inserted underthe “Environment” branch in ANSYSWorkbench Simulation. Only a fewAPDL commands are required to specify the parameters needed for theRadiosity Solution Method:
sf,REGION_A,rdsf,0.9,1
sf,REGION_B,rdsf,0.8,1
stef,5.67e-8
toffst,273.15
hemiopt,10
tunif,20

ANSYS Advantage • Volume I, Issue 1, 2007
TIPS & TRICKS
www.ansys.com 47
The meaning of these commandsis explained below:
• The first two commands (SF)group Named Selections (in thiscase “REGION_A” and“REGION_B”) to a given enclo-sure (1) with emissivity values of“0.9” and “0.8,” respectively. Ifthe enclosure is open, theSPCTEMP command also shouldbe used to designate the space(ambient) temperature.
• The next two commands, STEFand TOFFST, specify the Stefan-Boltzmann constant and thetemperature offset to absolutezero. These are unit-dependent,so users should make sure thatthe active unit system is setaccordingly from the “Units”menu.
• The HEMIOPT command isoptional, but it is used to set theresolution of the viewfactor calculations Fij. The default value
is 10, but it may be increased formore accurate viewfactor calculations at the expense ofadditional CPU time. (For 2-Danalyses, the analogous command is V2DOPT instead of HEMIOPT.)
• The last command, TUNIF, specifies the initial temperaturein ºC or ºF. For a nonlinear steady-state thermal analysis,specifying a reasonable initial temperature will help convergence.
Handling Multiple EnclosuresIf multiple enclosures (i.e., inde-
pendent radiating regions) are present,SF commands may be repeated for theother Named Selections but referencinga different enclosure ID.
Users also are advised to turn on “Auto Time Stepping” and to specify the number of initial, minimumand maximum substeps under the
Two Named Selections (REGION_A and REGION_B) represent surfaces that can radiateheat between each other.
The temperature distribution of three blocks radiating between each other is shownin the figure above. In this case, the center small block (transparent) has a fixedtemperature and is radiating to the middle block (displayed). This block, in turn,radiates to another block (transparent) that encloses it, and the third block radiatesto space. This model illustrates the use of three radiation enclosures — two areclosed while one is open. Radiation is the only mode of heat transfer between thethree blocks, yet the Radiosity Solution Method can be incorporated easily insideANSYS Workbench Simulation to solve these types of problems.
“Solution” branch since radiation problems can be highly nonlinear.
A number of advanced RadiositySolution Method options also are available:
• RADOPT to specify solver controls
• VFOPT to write or read the viewfactor file
• RSYMM and RSURF to takeadvantage of planar or cyclicsymmetry
• RDEC and RSURF to coarsen theelement faces for radiation calculations only
• Temperature-dependent emissivity specification is alsopossible
All of the APDL commands aredocumented in the ANSYS CommandsReference, and additional details ofRadiosity Solution Method options canbe found in Sections 4.6 and 4.7 of theANSYS Thermal Analysis Guide. n
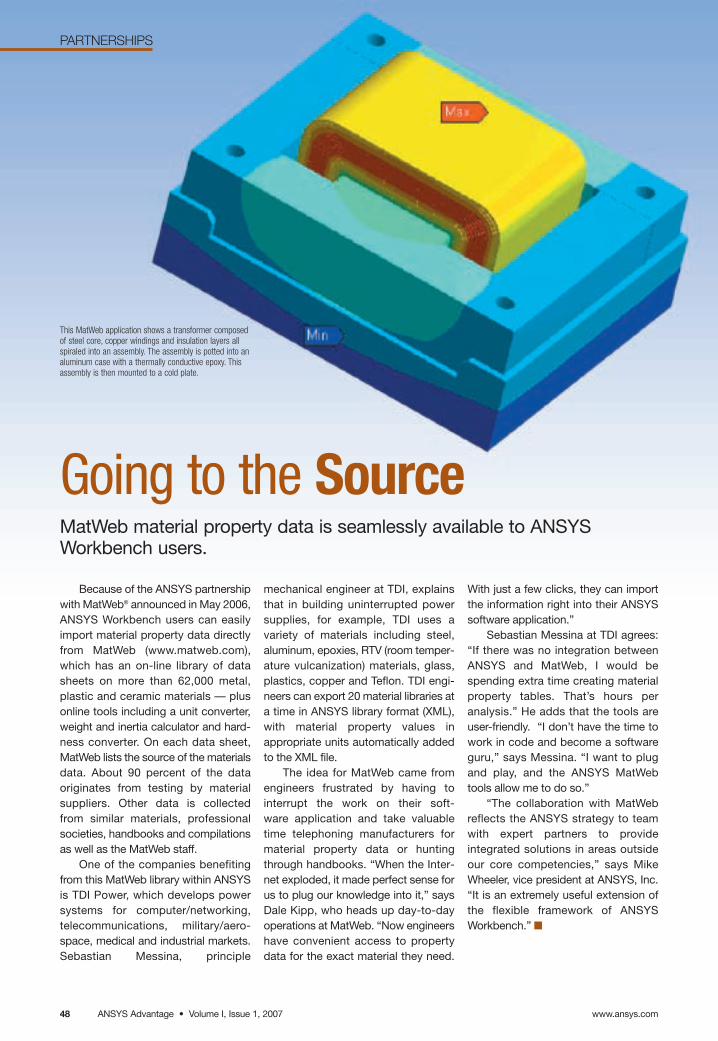
Going to the SourceMatWeb material property data is seamlessly available to ANSYSWorkbench users.
Because of the ANSYS partnershipwith MatWeb® announced in May 2006,ANSYS Workbench users can easilyimport material property data directlyfrom MatWeb (www.matweb.com),which has an on-line library of datasheets on more than 62,000 metal,plastic and ceramic materials — plusonline tools including a unit converter,weight and inertia calculator and hard-ness converter. On each data sheet,MatWeb lists the source of the materialsdata. About 90 percent of the dataoriginates from testing by material suppliers. Other data is collected from similar materials, professional societies, handbooks and compilationsas well as the MatWeb staff.
One of the companies benefitingfrom this MatWeb library within ANSYSis TDI Power, which develops powersystems for computer/networking,telecommunications, military/aero-space, medical and industrial markets.Sebastian Messina, principle
mechanical engineer at TDI, explainsthat in building uninterrupted powersupplies, for example, TDI uses a variety of materials including steel, aluminum, epoxies, RTV (room temper-ature vulcanization) materials, glass,plastics, copper and Teflon. TDI engi-neers can export 20 material libraries ata time in ANSYS library format (XML),with material property values in appropriate units automatically addedto the XML file.
The idea for MatWeb came fromengineers frustrated by having to interrupt the work on their soft-ware application and take valuabletime telephoning manufacturers formaterial property data or huntingthrough handbooks. “When the Inter-net exploded, it made perfect sense forus to plug our knowledge into it,” saysDale Kipp, who heads up day-to-dayoperations at MatWeb. “Now engineershave convenient access to propertydata for the exact material they need.
With just a few clicks, they can importthe information right into their ANSYSsoftware application.”
Sebastian Messina at TDI agrees:“If there was no integration betweenANSYS and MatWeb, I would bespending extra time creating materialproperty tables. That’s hours per analysis.” He adds that the tools areuser-friendly. “I don’t have the time towork in code and become a softwareguru,” says Messina. “I want to plugand play, and the ANSYS MatWebtools allow me to do so.”
“The collaboration with MatWebreflects the ANSYS strategy to teamwith expert partners to provide integrated solutions in areas outsideour core competencies,” says MikeWheeler, vice president at ANSYS, Inc.“It is an extremely useful extension ofthe flexible framework of ANSYS Workbench.” n
This MatWeb application shows a transformer composedof steel core, copper windings and insulation layers allspiraled into an assembly. The assembly is potted into analuminum case with a thermally conductive epoxy. Thisassembly is then mounted to a cold plate.
www.ansys.comANSYS Advantage • Volume I, Issue 1, 200748
PARTNERSHIPS
C
M
Y
CM
MY
CY
CMY
K
msft-ansys_ad_final.pdf 2/21/07 8:20:49 AM


![[Challenge:Future] designspace: Fun + Meaning2 = 2030 finals](https://static.fdocuments.net/doc/165x107/5a677eba7f8b9a656a8b597d/challengefuture-designspace-fun-meaning2-2030-finals.jpg)