
Preliminary Results Please do not circulate or cite ... · PDF filePreliminary Results –...
21
Preliminary Results – Please do not circulate or cite without permission from authors 1 Advantageous or Adverse Selection in Emerging Health Insurance Markets: Evidence from a Micro Health Insurance Program in Pakistan 1 Yi Yao Joan T. Schmit Justin R. Sydnor 1 Yi Yao (corresponding author [email protected]) is a PhD candidate at School of Business, University of Wisconsin at Madison. Joan Schmit is a professor and American Family Insurance Chair in Risk Management and Insurance at University of Wisconsin at Madison. Justin Sydnor is an assistant professor of Risk Management and Insurance at University of Wisconsin at Madison.
-
Upload
trinhtuong -
Category
Documents
-
view
217 -
download
1
Transcript of Preliminary Results Please do not circulate or cite ... · PDF filePreliminary Results –...

Preliminary Results – Please do not circulate or cite without permission from authors
1
Advantageous or Adverse Selection in Emerging Health Insurance Markets:
Evidence from a Micro Health Insurance Program in Pakistan1
Yi Yao
Joan T. Schmit
Justin R. Sydnor
1Yi Yao (corresponding author [email protected]) is a PhD candidate at School of Business, University of Wisconsin at
Madison. Joan Schmit is a professor and American Family Insurance Chair in Risk Management and Insurance at University of Wisconsin at Madison. Justin Sydnor is an assistant professor of Risk Management and Insurance at University of Wisconsin at Madison.

Preliminary Results – Please do not circulate or cite without permission from authors
2
Abstract
Despite widespread interest in microinsurance programs in developing countries, little is known
about the nature of information asymmetries and selection in these emerging markets. We use
data from a micro health insurance program in Pakistan to investigate the degree of adverse
selection in the program. We analyze how claim rates evolve as households renew their policies
and find that households who have larger claims during the policy period are slightly more likely
to renew their policies for the next period. Although that pattern is on the surface consistent with
adverse selection, we instead find that when compared to households joining the insurance in the
same period, renewed households have significantly lower claim frequency and total claim
amounts. Taken together these results suggest that a) households who experience claims
perceive higher value to insurance, b) that households do not seem to be acting (at least on the
margin of renewals) on private information about their risk types and c) that there are forces
affecting insurance demand that lead to advantageous selection in the policyholders that retain
coverage over time.

Preliminary Results – Please do not circulate or cite without permission from authors
3
I: Introduction
In recent years there has been an explosion of interest in the creation of new insurance products in
developing countries. Closely related to the growth of “microfinance,” these new “microinsurance”
programs are often created by non-profit organizations to provide insurance in the developing world. To
achieve their goals, however, these organizations must find a sustainable business model. This paper
focuses on the viability of micro health insurance in particular. Because there are generally data
limitations, high transaction costs (relative to premium and income), and low levels of education in
developing countries, insurance policies of all kinds need to be simple. That need for simplicity in both
underwriting (to limit distribution expenses) and policy language (both to limit administrative expenses as
well as to develop product demand) may be a particular challenge for the development of health insurance
because most private health insurance markets require extensive underwriting and further employ
somewhat complex policy provisions to limit both adverse selection as well as moral hazard.
Although there is a significant body of empirical literature on detecting adverse selection in health
insurance markets in developed countries (see Cohen and Siegelman, 2010 for a review), there is little
empirical evidence on the role adverse selection plays in developing microinsurance markets. The small
existing literature paints somewhat conflicting views of the potential for sustainable micro health
insurance. Pauly et.al (2008) used data from the World Health Survey for 14 developing countries to
compare the risk premium that local people would be willing to pay with likely values for the
administrative expense. Without taking adverse selection and moral hazard into consideration, they
concluded that a voluntary health insurance market might be feasible. In contrast, Biener and Eling (2009)
examined the problems and solutions for microinsurance markets using Berliner’s (1982) set of criteria to
identify significant problems discussed in existing studies on microinsurance. Based on a survey of
studies that looked at hypothetical decisions to join an insurance program, they concluded that problems
of information asymmetry were “epidemic” in micro health insurance, providing evidence ranging from
adverse selection, moral hazard to fraud in the previous literatures.
In this paper, we help address this debate about the viability of micro health insurance by examining
household renewal decisions to understand better the development of a microinsurer’s risk portfolio in its
early years of operations. The results reveal the essence of selection in the given micro health insurance
market.
Resolving this debate is important because of all the microinsurance programs being provided, micro
health insurance programs are among the most needed but least provided. Both acute and chronic
diseases are serious problems for the poor in developing countries, where poor sanitation, low nutrition,
and inadequate preventative care are widespread. As a result, the life expectancy for those living in low
and middle income countries is 20% lower than those living in high income countries. In an extreme
comparison, the life expectancy for people living in Sub-Saharan African is only 46, compared with 75.5
in high income countries2. The consequences of illness for the poor not only include reduced current
standards of living, but may also lead them to reduce investments in their future human capital. With that
backdrop, it is perhaps not surprising that people with low income also have an interest in health
2 Table 2.3 Selected mortality characteristics by sex and World Bank region in 2001, Global burden of disease and
risk factors, Oxford University Press and The World Bank, 2006.

Preliminary Results – Please do not circulate or cite without permission from authors
4
insurance programs. Despite that interest, however, it is estimated that only 20% have access to adequate
health insurance3 (Bockstal, 2008).
For this study we use data from the Aga Khan Agency for Microfinance (AKAM), which has run a simple
micro health insurance program in Pakistan since 2007. Testing for the nature of selection issues in
microinsurance markets presents unique challenges. Most studies of selection issues in insurance have to
overcome the inability to observe outcomes for people who do not purchase any insurance. In developed
markets, researchers typically approach the issues by using tests for adverse selection that analyze
differences in claim experience across insureds who purchase different amounts of insurance (see
Chiapporri and Salanie, 2000). In developing markets, like the AKAM product studied here, customers
are given only one option in coverage in order to hold down administrative costs and keep the products
simple for a population inexperienced in insurance purchasing. The standard “positive correlation” test
between coverage level and risk, therefore, is not feasible.
Other methods to detect adverse selection in the micro health insurance market, however, are available.
In this paper we analyze the nature of selection by measuring the development of claim experience in
renewal policies. We use a two-part model to compare the microinsurer’s new book of business to its
renewed book of business and test whether the risk pool has deteriorated over time, which could
demonstrate the existence of adverse selection. From a theoretical standpoint, the selection and evolution
of renewal policies could result in either adverse or advantageous selection. On the one hand, there are
forces leading to adverse selection in a sense that riskier people might be more likely to stay with the
insurer. One classic version of the adverse selection story here would be if policyholders have private
information about their risk type and suffer unrelated income shocks that affect whether they can afford
insurance. In that case, we would expect that those who know they are especially high risk would be less
likely to cancel insurance due to an income shock, which would result in a deteriorating book of business
when looking at renewed policies. Another possibility is that people might learn about their risk type
over time – for instance learning that they are pregnant. If people act on that new information, we would
expect adverse selection as those who have learned they are higher risk choose to renew while low risks
do not. On the other hand, there are also other forces affecting the decision to be insured that may be
unrelated to risk type and could even result in advantageous selection. In new markets, like that in
Pakistan, people start to learn about the value of insurance and how it protects their financial stability and
flexibility. People who happened to have a claim that was well-handled might be more likely to renew,
not because they are high risk but because they better understand the value of insurance. In addition,
more financially savvy people tend to be healthier ones and might be more likely to stay in the program.
Ultimately, the direction of any selection effects in this type of micro insurance market is an open
empirical question.
We analyze how claim rates evolve as households renew their policies and find that households who have
larger claims during the policy period are slightly more likely to renew their policy for the next period.
Although that pattern is on the surface consistent with adverse selection, we instead find that when
compared to households joining the insurance in the same period, renewed households have significantly
lower claim frequency and total claim amounts. Taken together these results suggest that a) households
who experience claims perceive higher value to insurance, b) that households do not seem to be acting (at
3 Bockstal, Christine. 2008, “HMIS in national social protection strategies: Experiences from francophone African
countries.” Presentation in the 4th International Microinsurance Conference.

Preliminary Results – Please do not circulate or cite without permission from authors
5
least on the margin of renewals) on private information about their risk type and c) that there are forces
affecting insurance demand that lead to advantageous selection in the policyholders that retain coverage
over time.
The remainder of this paper proceeds as follows. Section 2 presents a literature review highlighting work
on adverse selection generally and the small literature on micro insurance. Section 3 introduces the
AKAM micro insurance program and our data, while Section 4 discusses our models and results. We
conclude in Section 5 about our findings.
II: Literature Review
2.1 Introduction to theory of adverse selection
The theory of asymmetric information was first established in 1970s with the seminal work of Akerlof
(1970), Pauly (1974), and Rothchild and Stigliz (1976), and it was further developed by generations of
scholars (see Miyazaki 1977, Wilson 1977, Finkelstein and McGarry 2006). In the classic Rothchild-
Stigliz model, insureds were assumed to be of different risk types, and the resulting market equilibrium
was a separating one where low risk individuals bought partial insurance with reduced welfare, and high
risk individuals bought full insurance. The results of these theories motivated the need of risk
classification as a solution to overcome adverse selection, since if the insurance company could
differentiate the low risk from the high risk, it could offer different contracts to both groups and improve
the welfare of society. In addition, these theories established the rationale of testing for adverse selection
in a given market using the “positive correlation test” between risk type and insurance coverage
purchased. For example, in Puelz and Snow (1994), they used data from auto insurance market of the
United States, and found those with higher accident risk choose lower deductibles (more insurance
coverage), following the “positive correlation test.”
To alleviate the effect of adverse selection, the insurance industry has developed techniques in risk
classification; however, they are still not able to prevent adverse selection completely. Numerous
empirical studies have tested for the existence of adverse selection in different types of insurance markets
around the globe (see Cohen and Siegelman, 2010 for a review), with mixed results. In some cases,
scholars even found empirically it was the low risk individuals who bought more insurance coverage,
which has been referred to as “advantageous selection” (Finkelstein and McGarry, 2006).
2.2 Adverse selection in microinsurance markets
Though the basic predictions from insurance theory should largely function similarly for microinsurance,
the nature of the product imposes a number of challenges in developing the market (Brau et.al, 2009).
Microinsurance as an emerging product for low-income people in developing countries could suffer from
adverse selection in a vital way, in particular because of its limited ability in classifying risks. Due to the
need to reduce administrative costs while keeping the product simple, microinsurance products are often
designed to be universal, without deductible or coinsurance options. There are mainly two reasons for
that. First, it fits the financial literacy of low income individuals. Usually a microinsurance policy is the
first insurance policy that the low income individual purchases, and having deductibles and coinsurance
requires more sophisticated knowledge about insurance. Without proper education and claim handling,
there could be misunderstandings that ruin the reputation of the insurer and insurance overall before the

Preliminary Results – Please do not circulate or cite without permission from authors
6
market can fully develop. Second, insurers are reluctant to implement more sophisticated policy features
because they want to hold down administrative costs. Effectively administering policies with deductibles
and coinsurance requires electronic record keeping and it may be necessary to implement a system for
tracking and verify claims on site at every clinic. Most microinsurers have not yet invested in these
technologies and infrastructure.
2.3 Empirical tests for adverse selection in “traditional” insurance markets
The traditional approach of empirical tests for adverse selection is a “positive correlation test,” i.e., a
positive correlation between risk type and insurance coverage is expected with the existence of adverse
selection.
Scholars tested for adverse selection in various markets using different proxies for risk type and insurance
coverage (see Cohen and Siegelman, 2010 for a review). The most common proxies of insurance
coverage are policies with different levels of deductibles and copayments, the decision to opt in and out of
insurance, and the decision to purchase supplemental insurance. Proxies for risk type ranged from
subjective measurement (self-evaluated health condition) to objective ones (indicators such as age and
medical history) and predicted risk type (see Browne, 1992 & 2006, Gao et.al 2009).
Others (see Fang et.al 2008, Bolhaar et.al 2008, Gao et.al 2009) have found a negative, rather than
positive, relationship between risk type and insurance coverage, which indicates that low risk individuals
purchased more insurance coverage. This negative relationship observed in empirical tests was referred
to as advantageous selection, in contrast to the traditional term of adverse selection. Besides risk
preference, various other sources of advantageous selection have been proposed, including heterogeneity
in income, education, health preferences, financial planning horizons, and cognitive ability.
2.4 Empirical tests for adverse selection in micro health insurance market
Since the development of microinsurance markets remains relatively immature, and data are often
inaccessible and imperfect, the empirical studies on the topic of adverse selection in this market are still
limited. The limited range of studies using various methods, however, all found evidence to support the
existence of adverse selection in micro health insurance markets of different countries in different time
periods.
A series of studies on adverse selection have been conducted using data from a rural mutual healthcare
insurance scheme in China. Wang et al. (2006) followed a voluntary mutual healthcare insurance scheme
in a rural county in China and carried out a panel data analysis over the period of 2002 to 2006. Using
individual level data, they found strong evidence of adverse selection despite a high enrollment rate and
the requirement of having the entire household enroll as a unit. In particular, they found the pre-enrolled
medical expenditure for enrolled individuals were 9.6% higher than average expenditure of all residents.
In addition, the enrolled members of the partially-enrolled family spent 1.7 times more than those non-
enrolled members of the partial enrolled family. Zhang and Wang (2008) also observed that people with
chronic condition history, with fair or poor health were more likely to enroll in the program, showing the
existence of adverse selection. The extent of adverse selection, however, seemed to be stable over the
study period.
Similarly, Ito and Kono (2010) found evidence of adverse selection in a micro health insurance program
in India, based on the result that households with a higher ratio of sick members were more likely to

Preliminary Results – Please do not circulate or cite without permission from authors
7
purchase insurance. Using data from Masisi district in Zaire, Noterman et.al (1995) also found evidence
for adverse selection. They examined the null hypothesis that the increase in hospital utilization by
insureds can be attributable equally to predictable and unpredictable risk conditions and rejected the null
hypothesis.
With a historical survey data of American short-term disability microinsurance back in the early
twentieth-century, Murray (2011) found prima facie evidence of asymmetric information, with evidence
for the presence of adverse selection stronger than that of moral hazard. In addition, it was shown that the
countermeasures taken by the microinsurers, including the enforcement of a trial period and waiting
period, effectively reduced claims.
Besides the effect of adverse selection in explaining the demand for micro health insurance, there are also
other factors affecting the purchase decision which are studied empirically in numerous research studies,
including income, wealth, education, history with insurance, gender, family composition, residence
district, etc. (see Dror et.al, 2006; Ito and Kono, 2010; Bhat and Jain, 2006; Donfouet and Makaudze,
2010, Msuya and Asfaw, 2004; Rao et.al, 2009; Schneider and Diop, 2001).
III: AKAM Micro Health Insurance Program and Data Description
3.1 AKAM program background
AKAM micro health insurance program in Pakistan
The AKAM Microinsurance Initiative commenced in 2006, with support from the Bill and Melinda Gates
Foundation. AKAM is owned by the Aga Khan Development Network (AKDN) and it started its pilot
enrollment period for an annual micro health insurance policy in the Northern Area (NA)4of Pakistan in
Nov 2007. NA is the northernmost political entity located in the mountainous part of Pakistan, with an
estimated population of 1.35 million scattered across six districts. The provision of health insurance is a
milestone in that it is the first effort to make health insurance available to the poor in the area. In the
three years since the program first launched, there were over 100,000 members enrolled, which accounted
for around 7.5% of the local population.
The coverage and premium are the same for every member and the individual annual premium of 400
Pakistan Rupees (PKR) (approximately $5.60) is paid up front5. There is no individual risk classification
in underwriting. In exchange for this premium, the policy provides the following coverage: annual
hospitalization coverage (the core of the product) up to 25,000 PKR (approximately $400)6, life insurance
of 25,000 PKR (approximately $400) on the head of the family and one outpatient voucher valid for a
one-time physician visit. The hospitalization coverage and the life insurance coverage increase to 30,000
PKR for renewed insureds for the same premium, providing motivation for policyholders to renew their
policies. The average annual income per person in NA is around 50,000 PKR in 20097, so the insurance
coverage is equivalent to about half of their annual income.
4 The Northern Areas (NA) is now known as Gilgit-Baltistan(GB).
5 The premium was 350 in Nov 2007, and increased to 400 for Nov 2008, July 2009 and Nov 2009. It increased to
450 PKR for new insureds in ZADO and Danyore in July 2010, but stayed the same for all the other insureds. 6 25000PKR convert to $400 in Nov 2007, $312 in Nov 2008, and $293 in Feb 2011.
7http://www.unicef.org

Preliminary Results – Please do not circulate or cite without permission from authors
8
Distribution of micro insurance and provision of health service
Figure1:Flow chart for AKAM micro health insurance program
AKAM partnered with local supporting organizations (LSOs) to distribute the product to voluntary
groups. There were two purposes for selling group policies. First, the local supporting organizations
have an existing network for disseminating information and hence greatly reduce underwriting and
distribution costs. Second, as the way it works in developed markets, selling group policies helps to
address concerns of adverse selection because these groups are not formed solely for purchasing health
insurance. The major types of group are village organizations (VOs) and women’s organizations (WOs),
and their members could purchase health insurance through the VO/WO if at least 50% of the households
in the organization agreed, in the test survey, to purchase the product if it were available. In addition, the
entire household is required to enroll in the program in order to alleviate adverse selection.
AKAM initiated policies for New Jubilee Life Insurance Company (NJLI), which is a commercial insurer
based in Karachi, Pakistan, owned also by AKDN8. The LSO enters into an agreement with AKAM,
which has been appointed by NJLI to represent it in all matters pertaining to the health microinsurance
program. The LSO contracts with NJLI on behalf of their village member households.
8In regard to the reinsurance arrangement, AKAM arranged a stop loss contract with Swiss Re.
Parent organization
Policyholders
Healthcare providers
Aga Khan Agent of
Microfinance-
Microinsurance
Initiative
(AKAM-MI)
Financial institutions
Reinsurance provider:
Swiss Re
Seller of insurance policy
(insurer): New Jubilee
Life Insurance (NJLI)
Legal representative for
buyers of group contract:
Local supporting organization
(LSO)
Members of LSO: Village
organizations and women’s
organizations (VO/WOs)
Policyholder: Households in
qualified VO/WOs
Other healthcare provider:
Combined military
hospital (CMH) and
government hospital
Main healthcare
provider: Aga Khan
Health Services Pakistan
(AKHSP)
Aga Khan Development
Network (AKDN)

Preliminary Results – Please do not circulate or cite without permission from authors
9
AKAM chose NA to be the first area to provide health insurance because the AKDN intensity is very high.
The main health service provider (Aga Khan Health Services Pakistan, AKHSP), which is a part of
AKDN, operated in NA for over thirty years. It has three hospitals and twenty-five primary care facilities
in NA, and over 90% of the claims from AKAM micro health insurance program are handled within
AKHSP systems. In addition, there are the Combined Military Hospital (CMH) and the government
hospital located in NA, which altogether take less than 10% of the claims, mostly for emergency service.
Background of VO/WO/LSO
AKAM relies on an existing network for village organizations and women’s organizations for product
distribution. By the end of 2005, there were more than 4,000 Village Organizations (VOs) and Women’s
Organizations (WOs) in Northern Areas, covering more than 78 percent of the total households9.
VO/WOs are grass root community organizations that were first built to improve the households’ capacity
for undertaking village development initiative. For example, projects include obtaining funding and
organizing the villagers to work on infrastructure project such as minor irrigation works, flood protection,
erosion control and link roads. In addition, VO/WOs were also involved in organizing informal
community-based micro loans among their members before AKAM started its formal microfinance
service in the area. More recently, those organizations have become key players in providing supportive
networks to enlarge communities’ assets and harness individual skills to generate income in a sustainable
manner.
Local Supporting Organizations (LSOs) are large organizations working for the member organizations in
the area, which may consist of 50 or more villages. They are nonprofit organizations set up in joint effort
with the Aga Khan Rural Support Program (AKRSP) and local population, serving as registered legal
entities under the Pakistan law. LSOs are the umbrellas under whom VOs and WOs could enter into any
legal agreement as a group or sub-group since VOs and WOs are not registered organizations. Gradually,
LSOs have obtained project funding and expanded their service to a wide coverage. Currently, there are
around 40 LSOs in the region.
3.2 Data description
The empirical application utilizes a dataset comprised of household level information, including some
basic demographics on the head of the household’s age and gender, members’ age and gender
decomposition, household size, village organization and local supporting organization to which the
household belongs. It also has some policy level information such as policy limit, renewal status and
enrollment date. Moreover, it contains detailed information on claims made during the policy periods,
including diagnosis, whether it was a pre-existing condition, hospital stayed, date of admission, length of
stay, total bill and bill divided into subcategories of medicine, surgical procedure, surgical supply, bed
charge, inpatient consultation, lab test, and others.
There were in total six enrollment periods since the program first launched in November 2007. Each
policy lasts for one year, and the enrollment window was fixed to November at the beginning, so that it
helped alleviate adverse selection by not allowing people to speculate in purchasing an insurance policy
9The Aga Khan Rural Support programme, an assessment of institutional development of village and women’s
organizations, results of the AKRSP’s Institutional Development Survey 2006.

Preliminary Results – Please do not circulate or cite without permission from authors
10
right before a surgery was needed. In addition, it helped reduce the administrative and distribution costs.
Besides the four November waves of enrollment from 2007 through 2010, a new July enrollment window
was opened in 2009 due to the increasing demand for health insurance as well as the improved
recognition of income cycle for local households.
The first enrollment period starting in Nov 2007 was a pilot period; therefore detailed information was not
collected at the time. As a consequence, we could not include the first period into the data analysis. For
the fifth enrollment period starting from July 2010, claim data is available only through Nov 2010. Since
we only have part-year claim data for that enrollment window, for any analysis based on that period we
scale the available claim data to an annual basis.
To sum up, the data analysis is based on data from four available periods, which are Nov 2008, July 2009,
Nov 2009 and July 2010, with a total member observation of 64,29010
.
Because the two key variables we examine are claim experience (both frequency and severity) and
renewal status, we summarize detailed information over different enrollment periods on those variables in
table 1 and 2 respectively.
Table 1: Summary of household level claim information and loss ratio for all enrollment periods
Enrollment time
# of HH enrolled
# of members enrolled
# of claim total claim amount (in PKR)
total premium (in PKR)
loss ratio
2007-Nov 1,715 6,044 768 2,820,595 2,115,400 1.33
2008-Nov 5,273 19,492 3,380 15,012,412 7,796,800 1.93
2009-July 2,200 9,107 1,910 8,953,674 3,642,800 2.46
2009-Nov 5,785 23,268 3,066 15,676,527 9,307,200 1.68
2010-July11 2,932 12,423 930 9,720,866 5,157,900 1.88
Overall 17,905 70,334 11,356 52,184,074 28,020,100 1.86
Table1 shows that the claim experience and loss ratio fluctuated across different enrollment periods. On
average, each enrolled household made 0.63 claims during the policy year, and claim amounts averaged at
2,914 PKR. The overall loss ratio for five periods was 1.86.
For the three November waves of enrollment, the claim experience and its corresponding loss ratio
increased in 2009 and then decreased in 2010. While for the two July waves of enrollment, the claim
experience was very high at first and then decreased.
Since the major analysis is on the household level, and the key variable of interest is the renewal status,
table 2 summarizes the household level renewal information across periods.
10
We are expecting the data from the sixth enrollment period for Nov 2010. 11
This is a partial data since the policy lasts till June 2011. The available claim data runs till the end of Nov 2010.

Preliminary Results – Please do not circulate or cite without permission from authors
11
Table 2: summary of household renewal information across periods
Enrollment
time total HH
new
HH #
new
HH %
renewed
HH #
renewed
HH %
% of HH choosing to renew
policy at the end of period
2007-Nov 1,715 1,715 100% 0 0 44%
2008-Nov 5,273 4,521 86% 751 14% 56%
2009-Jul 2,200 2,200 100% 0 0% 42%
2009-Nov 5,785 2,828 49% 2957 51% n.a.
2010-Jul 2,932 2,007 68% 925 32% n.a.
For the first enrollment period in both July and November waves, all households were new, while for the
other three enrollment periods, it was a combination of new households and households renewed from the
previous periods. The renewal rate, defined as the percentage of household who choose to renew their
policies at the end of the current period, shows that the program has retained about half of the enrolled
households on average. Out of those who had renewed their policies once in Nov 2008, 64.3% (483 out
of 751 households) of them renewed for a second time in Nov 2009. However, the program was
expanding rapidly from period to period, so new households still were weighed more heavily than
renewed households in general.
IV: Empirical Model and Results
4.1 Analytical model
The AKAM health insurance program uses no underwriting, and as a consequence classic models of
adverse selection would predict that high risk individuals would be more likely to purchase and renew
coverage than lower-risk individuals. On the other hand, there are a number of empirical studies in
developed insurance markets that document “advantageous selection,” in which lower risk individuals are
more likely to purchase and retain the most insurance. As such, while our initial hypothesis is that
adverse selection will be a problem in this market, theory and empirical evidence in other settings suggest
that either pattern is possible – making it all the more important to test for the nature of selection in
developing health insurance markets.
Our main focus is on the relationship between policy renewal decision and claim experience, in terms of
both frequency and severity, and we examined the relationship through three models in total.
Our first model is to test how claim experience impacts the decision to renew the policy. The regression
model takes the following form:
Model 1 (probability of renewing):
Renewal decision for period n+1=f(whether they are new at the beginning of period n, total claim amount
at period n, household level demographics)
where f( ) is a discrete-choice function, such as logit or probit.

Preliminary Results – Please do not circulate or cite without permission from authors
12
In addition, we include a number of control variables on the household level demographics. They are
family size, age and gender of the head of the household, the percentage of child, teenager, adult, elderly
and female in the family, LSO that the household belongs to and a renewal dummy to indicate whether
the household were new or renewed at the beginning of the period.
The other two models focus on measuring how claim experience is affected by renewal status. The first
approach (model 2) uses a two-part frequency severity model while the second approach in model 3
examines the total claim amount.
Finding a positive relationship between policy renewal and claims would be consistent with adverse
selection in the decision to retain insurance. If instead there were a negative correlation between renewal
and claims, it would suggest that there are forces of positive selection leading lower-risk insured to retain
insurance.
In summary, model 2 and 3 take the following forms:
Model 2 (two-part model):
Claim frequency=f(renewal status, HH demographics, enrollment period dummy)
Claim severity=f(renewal status, claim frequency, HH demographics, enrollment period dummy)
Model 3 (total claim amount):
Total claim=f(renewal status, HH demographics, enrollment period dummy)
Our primary measures of claim experience are claim frequency, claim severity, and the total claim
amount, which equals the product of claim frequency and severity. In the two-part model, we use claim
frequency as the dependent variable, and model it in various specifications with linear, Poisson and
negative binomial distribution in the first part. Then conditional on the household having a claim, we use
claim severity (average claim amount) as the dependent variable, and model it with a gamma distribution
using general linear model (GLM). As an alternative to, as well as a sensitivity test for the two-part
model, we also include model 3 using total claim amounts as the dependent variable. For this
specification we use a Tobit model left censored at zero to take into account that there are a large portion
of zeros in the dependent variable.
For both models 2 and 3, we start with using only renewal status and a dummy variable indicating July
cohort as the independent variables in specification [1], and then we also include the following control
variables to measure other policyholder characteristics that may affect claim experience throughout
models 2 and 3 in specification [2]. These control variables are log of family size, age of the head of the
household, gender of the head of the household, family structure (percentage of members that are children,
teenagers, adults, elderly and female) and geographical variable (LSO that insured household belongs to).

Preliminary Results – Please do not circulate or cite without permission from authors
13
4.2 Results
Table 3 summarizes variable description and statistics by enrollment period, and table 4 summarizes
statistics by renewal status.
Table 3: variable description and summary statistics
Variable name Description
Full sample 2008 Nov 2009 July 2009 Nov 2010 July
Demographics
HH size # of members in the HH 3.99 3.73 4.21 4.01 4.27
(1.76) (1.67) (1.70) (1.76) (1.87)
head age age of HH head 44.84 44.07 42.79 46.10 45.27
(16.62) (14.22) (13.96) (18.36) (18.49)
head male 1 if male, 0 if female 0.74 0.74 0.74 0.72 0.76
(0.44) (0.44) (0.44) (0.45) (0.43)
% renewed % of HH renewed from n.a. 0.14 0.00 0.50 0.29
last period n.a. (0.35) 0.00 (0.50) (0.45)
child % % of HH age btw 0 and 5 0.14 0.13 0.14 0.14 0.13
(0.19) (0.19) (0.18) (0.19) (0.18)
teenager % % of HH age btw 6 and 16 0.18 0.19 0.16 0.17 0.18
(0.22) (0.23) (0.21) (0.21) (0.21)
adult % % of HH age btw 17 and 0.56 0.57 0.60 0.55 0.56
59 (0.26) (0.26) (0.25) (0.26) (0.26)
elderly % % of HH age btw 60 and 0.10 0.11 0.10 0.10 0.10
99 (0.20) (0.22) (0.17) (0.20) (0.19)
over100 % % of HH age above 100 0.02 0.00 0.00 0.04 0.03
(0.10) (0.02) (0.03) (0.14) (0.13)
male % % of HH male 0.45 0.44 0.45 0.44 0.46
(0.20) (0.21) (0.19) (0.21) (0.19)
Claim
total bill total claim amount 2,685.33 2,844.51 4,053.58 2,683.50 1,374.40
(5,969.31) (5,851.72) (7,118.47) (6,173.13) (4,332.88)
loss # of claims 0.57 0.64 0.87 0.52 0.32
frequency
(0.98) (1.02) (1.23) (0.91) (0.69)
loss severity average amount of claims 4,931.89 4,734.02 4,991.18 5,307.00 4,332.30
(5,334.41) (5,090.41) (5,095.08) (5,678.66) (5,328.50)
# of obs. # of households 16,225 5,272 2,197 5,831 2,925
Notes: mean is shown on top and standard deviation is shown in brackets for each variable.

Preliminary Results – Please do not circulate or cite without permission from authors
14
Table 4: summary statistics of mean by renewal status
Variables new HH renewed HH
# of CLAIM 0.60 0.51
SEVERITY 1,883.56 1,535.98
TOTAL BILL 2,814.13 2,350.37
FAMILY SIZE 3.86 4.34
HEAD AGE 44.82 44.91
HEAD MALE 0.73 0.76
CHILD% 0.13 0.15
TEENAGER% 0.17 0.19
ADULT% 0.58 0.53
ELDERLY% 0.10 0.11
FEMALE% 0.56 0.55
Observations 11,719 4,506
From table 4, it is clear that the renewal households have a better claim experience than the new
households enrolled, with lower mean in average number of claims (claim frequency), claim severity, and
the total claim amount. Also the renewed households in general are larger than those new households on
average, with more male being the head of the family, more percentage of households being child,
teenager, elderly and male. Furthermore, figure 1 shows the histogram comparison for claim frequency
and severity between new and renewed households respectively.
Figure1: Histograms comparison between new insured and renewed insured in their claim frequency and
severity (average loss per claim)
Figure 1 shows that renewed households have lower claim frequency than the newly enrolled households;
however, the claim severity differences are not as significant as it is in frequency.
022
4466
Perc
ent
0 5 10 15frequency
Not Renewed Renewed
0
5.75
11.5
17.2
5
23
Perc
ent
0 10000 20000 30000severity
Not Renewed Renewed

Preliminary Results – Please do not circulate or cite without permission from authors
15
Our regression results for three models are shown in table 5, 6, and 7 respectively. In table 5, using the
enrollment data from Nov 2008 and July 2009 separately, we found that in both periods, the total bill
during the policy year was positively related to the renewal decision for the next period. Every 1000PKR
increase in current period claim increases the probability of renewing by 1%. Households with larger
claim amounts in the current period are more likely to renew their policy, and this could happen due to
multiple reasons. First, it could be a traditional “adverse selection” story in which high risk households
had private information thus chose to renew their policies. The other explanation could be that the
households which utilized more insurance coverage valued their insurance policy more, and had more
knowledge in the service and potential benefit it could provide, thus leading to their renewal decision. To
delineate between these two possibilities, we further examine the relationship in models 2 and 3, with the
results reported in tables 6 and 7 respectively.
Table 5: regression results from model 1 (probability of renewing)
Dependent variable=1 if HH renewed for the next period
Nov-08 Jul-09
OLS Logit OLS Logit
PREVIOUSLY RENEWED 0.19*** 0.18***
(0.020) (0.020)
TOTAL BILL (in thousands) 0.01*** 0.01*** 0.01*** 0.01***
(0.000) (0.000) (0.000) (0.000)
FAMILY SIZE 0.09*** 0.10*** 0.13*** 0.14***
(0.021) (0.023) (0.030) (0.031)
HEAD AGE 0.00 0.00 0.00 0.00
(0.001) (0.001) (0.001) (0.001)
HEAD GENDER 0.01 0.01 -0.01 -0.01
(0.019) (0.021) (0.029) (0.031)
CHILD% 0.05 0.05 0.07 0.07
(0.045) (0.048) (0.066) (0.069)
TEENAGER% -0.14*** -0.15*** -0.04 -0.05
(0.040) (0.043) (0.060) (0.064)
ELDERLY% 0.08** 0.09** 0.15** 0.16**
(0.040) (0.043) (0.069) (0.071)
FEMALE% -0.04 -0.05 -0.19*** -0.20***
(0.037) (0.039) (0.058) (0.062)
LSO FIXED EFFECT X X X X
R square 0.58 0.43
Observations 5,272 5,272 2,197 2,197
Notes: Coefficient values and standard errors clustered by family are presented using both OLS and Logit
regressions-marginal effects reported. The dependent variable is a dummy variable indicating whether a household
renewed for the next period.
*significant at 10 percent; **significant at 5 percent; ***significant at 1 percent

Preliminary Results – Please do not circulate or cite without permission from authors
16
In table 5, we also observe that the renewal decision for the following period is positively impacted by the
renewal decision in the previous period. Those household that were renewed at the beginning of Nov 08
are 18% more likely to renew again for the Nov 09 period.
Family size is another important factor that affects the decision of renewing the policy. We used log of
the total member count in a household as a measurement of family size, in order to account the
nonlinearity between member count and decision making. We found that every 10% increase in family
size will result in an average 1% increase in the probability of renewing the policy for Nov 2008 period.
And this impact increased to 1.4% in July 2010.
As to the impact of age composition, the percentage of elderly in the family has a consistently positive
impact on the renewal decision. In Nov 2008, every 10% increase in elderly percentage, holding other
factors constant, will increase the probability of policy renewal by 0.9%. And in July 2009 this impact
increased to 1.6%. The impact of teenager percentage is negative, but it is only significant for Nov 2008.
Each 10% increase in teenager percentage decreases the probability of renewing by 1.5%, while the
children percentage doesn’t have a significant impact on renewal decision making.
Female percentage consistently yields a negative impact on renewal probability, and it was significant for
July 2009. Each 10% increases in percentage of household being female decreases the probability of
renewing by 2%.
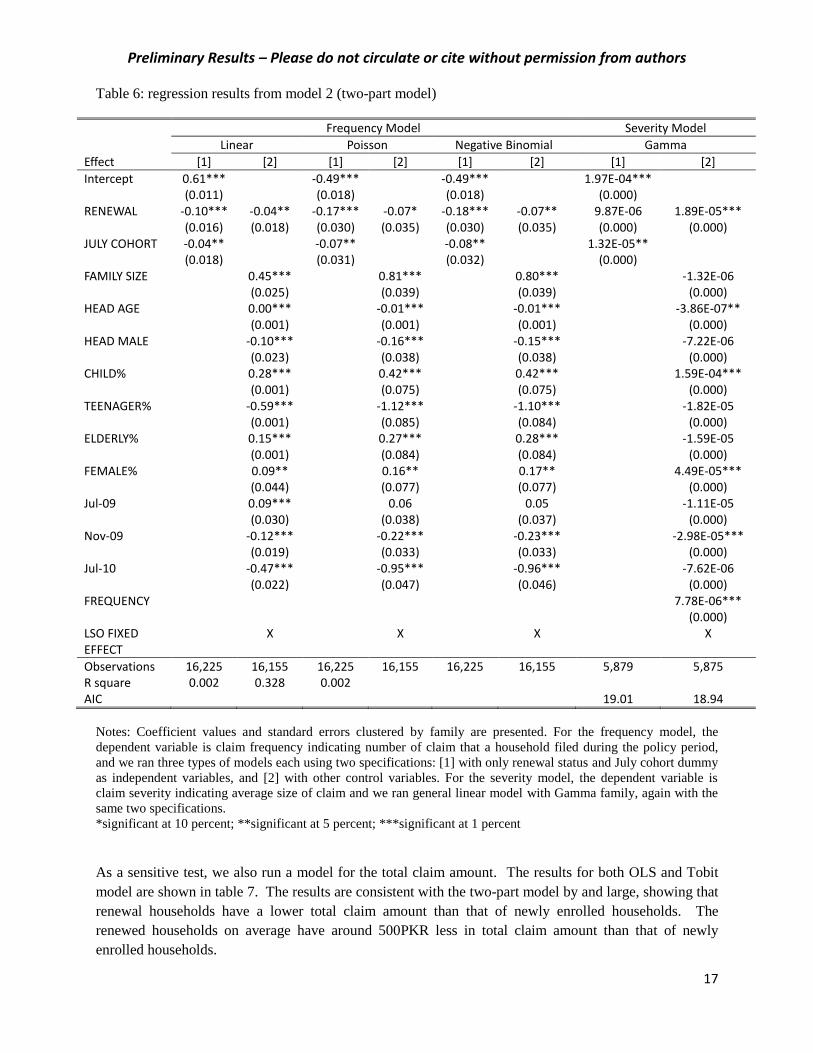
Table 6 demonstrates the regression results for the two-part model. The analysis of claim frequency
shows that renewed households file fewer claims than new customers. That pattern is confirmed in each
of the three specifications in table 6. On average, the renewed households had about 0.07 fewer claims
than newly enrolled households.
We also found that larger families have a higher claim frequency, which is intuitive. Each 1% increase in
family size leads to a 0.008 increase in number of claims. Households where the head is male make
fewer claims than households with female heads by 0.10. One possible explanation is that households
with male head might be better off than female head financially, leading to better nutrition and fewer
claims. In addition, families with higher fractions of children, elderly and female have more claims, each
1% increase on average affect number of claim by 0.004, 0.003 and 0.002 respectively. As to time trend
in claims, compared to Nov 08 enrolled households July 09 cohort had more claims while Nov 09 and
July 10 had less claims.
In the severity model, all estimates of the coefficients are of a small scale; however, we found that
renewed households have a slightly higher claim severity than the newly enrolled households and it is
statistically significant when all control variables were included. The effects of control variables were
largely consistent with the results in the frequency model, with more family members being children and
female positively correlated to claim severity. However, the magnitude of impact both remained very
small.
The results of the two-part model are consistent with health literature on selection. We expect to find
selection problem in frequency analysis since households are making decision to seek for medical
services, but not in severity analysis because it was also driven by the decision of physician, which is
exogenous of households’ decisions.
Preliminary Results – Please do not circulate or cite without permission from authors
17
Table 6: regression results from model 2 (two-part model)
Frequency Model Severity Model
Linear Poisson Negative Binomial Gamma
Effect [1] [2] [1] [2] [1] [2] [1] [2]
Intercept 0.61*** -0.49*** -0.49*** 1.97E-04*** (0.011) (0.018) (0.018) (0.000) RENEWAL -0.10*** -0.04** -0.17*** -0.07* -0.18*** -0.07** 9.87E-06 1.89E-05*** (0.016) (0.018) (0.030) (0.035) (0.030) (0.035) (0.000) (0.000) JULY COHORT -0.04** -0.07** -0.08** 1.32E-05** (0.018) (0.031) (0.032) (0.000) FAMILY SIZE 0.45*** 0.81*** 0.80*** -1.32E-06 (0.025) (0.039) (0.039) (0.000) HEAD AGE 0.00*** -0.01*** -0.01*** -3.86E-07** (0.001) (0.001) (0.001) (0.000) HEAD MALE -0.10*** -0.16*** -0.15*** -7.22E-06 (0.023) (0.038) (0.038) (0.000) CHILD% 0.28*** 0.42*** 0.42*** 1.59E-04*** (0.001) (0.075) (0.075) (0.000) TEENAGER% -0.59*** -1.12*** -1.10*** -1.82E-05 (0.001) (0.085) (0.084) (0.000) ELDERLY% 0.15*** 0.27*** 0.28*** -1.59E-05 (0.001) (0.084) (0.084) (0.000) FEMALE% 0.09** 0.16** 0.17** 4.49E-05*** (0.044) (0.077) (0.077) (0.000) Jul-09 0.09*** 0.06 0.05 -1.11E-05 (0.030) (0.038) (0.037) (0.000) Nov-09 -0.12*** -0.22*** -0.23*** -2.98E-05*** (0.019) (0.033) (0.033) (0.000) Jul-10 -0.47*** -0.95*** -0.96*** -7.62E-06 (0.022) (0.047) (0.046) (0.000) FREQUENCY 7.78E-06*** (0.000) LSO FIXED EFFECT
X X X X
Observations 16,225 16,155 16,225 16,155 16,225 16,155 5,879 5,875 R square 0.002 0.328 0.002 AIC 19.01 18.94
Notes: Coefficient values and standard errors clustered by family are presented. For the frequency model, the
dependent variable is claim frequency indicating number of claim that a household filed during the policy period,
and we ran three types of models each using two specifications: [1] with only renewal status and July cohort dummy
as independent variables, and [2] with other control variables. For the severity model, the dependent variable is
claim severity indicating average size of claim and we ran general linear model with Gamma family, again with the
same two specifications.
*significant at 10 percent; **significant at 5 percent; ***significant at 1 percent
As a sensitive test, we also run a model for the total claim amount. The results for both OLS and Tobit
model are shown in table 7. The results are consistent with the two-part model by and large, showing that
renewal households have a lower total claim amount than that of newly enrolled households. The
renewed households on average have around 500PKR less in total claim amount than that of newly
enrolled households.

Preliminary Results – Please do not circulate or cite without permission from authors
18
Table 7: regression results from model 3 (total loss amount model)
Dependent variable: total claim
OLS Tobit
[1] [2] [1] [2]
intercept 2,931.18***
-4,065.34***
(66.431)
(180.683)
RENEWAL -520.15*** -507.70*** -1,896.38*** -1,407.17***
(101.348) (117.175) (267.289) (303.826)
JULY COHORT -321.16***
-1,116.25***
(99.524)
(253.080)
FAMILY SIZE
1,955.85***
5,458.34***
(145.813)
(351.819)
HEAD AGE
-10.97***
-57.90***
(3.211)
(8.674)
HEAD MALE
-286.22**
-700.10**
(127.356)
(311.255)
CHILD%
-686.14**
407.74
(281.388)
(673.722)
TEENAGER%
-2,894.91***
-9,588.16***
(263.321)
(706.005)
ELDERLY%
845.59***
1,677.23**
(269.641)
(702.258)
FEMALE%
44.39**
1,269.43**
(255.979)
(636.623)
Jul-09
582.38***
964.93***
(175.523)
(353.706)
Nov-09
-28.67
-790.75***
(127.448)
(303.832)
Jul-10
-1,801.61***
-6,855.28***
(127.556)
(382.940)
LSO FIXED EFFECT
X
X
R square 0.0018 0.2049 0.0004 Observations 16,225 16,155 16,225 16,155
Notes: Coefficient values and robust standard errors are presented for both OLS and Tobit regressions. The
dependent variable is total claim amount that a household incurred during the policy period. We ran it with the same
two specifications in Table 6.
*significant at 10 percent; **significant at 5 percent; ***significant at 1 percent
The coefficients estimate for the other control variables are also consistent with the results in the previous
model. Family size has a significant positive impact on total claim, with 1% increase in family size
bringing 19.56PKR increase in total claim. The age of head and the gender of head being male both have
a negative effect on total claim amount. As to age composition, having a larger percentage of family
members being teenager decreases the total claim amount, while having more elderly in the household

Preliminary Results – Please do not circulate or cite without permission from authors
19
increases the total claim amount significantly. A larger percentage of family members being female also
increases the total claim amount.
In conclusion, though households having more claims during the policy period are slightly more likely to
renew their policy for the next period, which is a likely adverse selection scenario. Interestingly, however,
we found that renewed households actually have lower claim frequency and total claim amount than those
of the newly enrolled households; therefore, it appears to be advantageous selection rather than adverse
selection in the long run.
V: Conclusion
The market with asymmetric information has been studied extensively in the insurance literature. Yet
most empirical studies focus on traditional insurance markets in developed countries, and there is little
evidence on the infant microinsurance industries in developing countries. We used data from a micro
health insurance program in Pakistan, and examined the relationship between the renewal decision and
claim history to observe the development of renewal policies. We found that though households with
more claim amount filed were more likely to renew their policies, the renewed households actually had
fewer numbers of claims and less total claim amounts than those of newly enrolled households. Thus, the
entire risk portfolio actually was getting better, instead of deteriorating as it was in a classic adverse
selection process.
In response to the need for affordable and quality health insurance for the poor, micro health insurance
programs have been established with financial aid from donors, in the hope that they will become
sustainable in the long run. Adverse selection is potentially a significant barrier to sustainability for these
programs. Our finding shed light on the possibility of a successful micro insurance program in a long run,
despite of lack of underwriting.
We expect that our analysis will help providers of microinsurance to better evaluate their performance
and by determining the degree to which adverse selection is a problem in this market will help them to
clarify the potential value to alternative program designs aimed at mitigating adverse selection.

Preliminary Results – Please do not circulate or cite without permission from authors
20
References
Akerlof, George. 1970. “The market for "lemons": quality uncertainty and the market mechanism.” The
Quarterly Journal of Economics 84(3): 488-500.
Bhat, R., and Jain, N.. 2006. “Factoring affecting the demand for health insurance in a microinsurance
scheme.” Indian Institute of Management Working Paper No. 2006-07-02.
Biener, Christian, and Martin Eling. 2009. “Insurability in microinsurance markets and analysis of
problems and potential solutions.” Working paper.
Bockstal, Christine. 2008. “HMIS in national social protection strategies: Experiences from francophone
African countries.” Presentation in the 4th International Microinsurance Conference.
Bolhaar, Jonneke, Maarten Lindeboom, and Bas van der Klaauw. 2008. “A dynamic analysis of the
demand for health insurance and health care.” Tinbergen institute discussion paper, TI 2008-084/3.
Brau, James, Craig Merrill, and Kim Staking. 2009. “Insurance theory and challenges facing the
development of microinsurance markets.” Working paper.
Browne, Mark. 1992. “Evidence of adverse selection in the individual health insurance market.” Journal
of Risk and Insurance 59:13-33.
Browne, Mark. 2006. “Adverse selection in the long-term care insurance market.” Competitive Failures in
Insurance Markets: Theory and Evidence, edited by Pierre-Andre Chiappori and Christian Gollier, CESifo
Seminar Series, MIT Press, 97-112.
Chiappori, Pierre, and Bernard Salanie. 2000. “Testing for asymmetric information in insurance markets.”
Journal of Political Economy 108: 56-78.
Cohen, Alma, and Peter Siegelman. 2010. “Testing for adverse selection in insurance markets.” The
Journal of Risk and Insurance77 (1): 39-84.
Donfouet, H.P.P., and Makaudze, E. M.. 2010. “Economics value of willingness to pay for a community-
based prepayment scheme in rural Cameroon.” Microinsurance Research Paper No.3. Geneva:
International Labour Organisation Microinsurance Innovation Facility.
Dror, David, Ralf Radermacher, and Ruth Koren. 2006. “Willingness to pay for health insurance among
rural and poor persons: field evidence from seven micro health insurance units in India.” Health Policy
doi: 10.1016/j.healthpol.2006.07.011.
Fang, Hanming, Michael Keane, and Dan Silverman. 2008. “Sources of advantageous selection: evidence
from the Medigap insurance market.” Journal of political Economy, 116 (2): 303-350.
Finkelstein, Amy and Kathleen McGarry. 2006. “Multiple dimensions of private information: evidence
from the long-term care insurance market.” American Economics Review, 96(4): 938-958.

Preliminary Results – Please do not circulate or cite without permission from authors
21
Gao, Feng, Michael Powers and Jun Wang. 2009. “Adverse selection or advantageous selection? Risk and
underwriting in China’s health-insurance market.” Insurance: Mathematics and Economics 44:505-510.
Ito, Seiro, and Hisaki Kono. 2010. “Why is the take-up of microinsurance so low? Evidence from a health
insurance scheme in India.” The Developing Economies 48 (1): 74-101.
Lopez, A, Colin Mathers, Majid Ezzati, Dean Jamison, and Christopher Murray. 2006. “Global burden of
disease and risk factors.” Oxford University Press and The World Bank Table 2.3: 26.
Miyazaki, Hajime. 1977. “The Rat Race and Internal Labor Markets.” The Bell Journal of Economics 8:
394-418.
Msuya, J., and Asfaw, A. 2004. “Impacts of community health insurance schemes on health care
provision in rural Tanzania.” ZEF Discussion paper on development policy No. 82.
Murray, John. 2011. “Asymmetric information and countermeasures in early twentieth-century American
short-term disability microinsurance.” The Journal of Risk and Insurance 78 (1):117-138.
Noterman, J.P., Criel, B., Kegels, G., and Isu, K. 1995. “A prepayment scheme for hospital care in the
Masisi district in Zaire: A critical evaluation.” Social Science and Medicine 40: 919-930.
Pauly, Mark, Fredric E. Blavin and Sudha Meghan. 2008. “Is there a market for voluntary health
insurance in developing countries?” NBER working paper 14095.
Pauly, M.V.. 1974. “Overinsurance and public provision of insurance: the role of moral hazard and
adverse selection.” Quarterly Journal of Economics 88(1):44-62.
Puelz, Robert, and Arthur Snow. 1994. “Evidence on adverse selection: equilibrium signaling and cross-
subsidization in the insurance market.” Journal of Political Economy 102(2): 236-257.
Rao, K. D., Waters, H., Steinhardt, L., Alam, S., Hansen, P., and Naeem, A. J. 2009. “An experiment with
community health funds in Afghanistan.” Health Policy and Planning 24: 301-311.
Rothschild, Michael and Joseph Stiglitz. 1976. “Equilibrium in competitive insurance markets: an essay
on the economics of imperfect information.” Quarterly Journal of Economics 90: 629-49.
Schneider, P., and Diop, F. 2001. “Synopsis of results on the impact of community-based health insurance
on financial accessibility to health care in Rwanda.” Health, Nutrition and Population Family Discussion
Paper, Washington, DC: World Bank.
Wang, Hong, Licheng Zhang, Winnie Yip, and William Hsiao. 2006. “Adverse selection in a voluntary
rural mutual health care health insurance scheme in China.” Social Science & Medicine 63: 1236-1245.
Wilson, Charles. 1977. “A model of insurance markets with incomplete information.” Journal of
Economic Theory 97: 167-207.
Zhang, Licheng, and Hong Wang. 2008. “Dynamic process of adverse selection: evidence from a
subsidized community-based health insurance in rural China.” Social Science & Medicine 67:1173-1182.


