Preliminary report on ground water resources of the ... report on ground-water resources of the...
90
COOPERATIVE GROUND-WATER REPORT I Urbana, Illinois 1959 STATE WATER SURVEY STATE GEOLOGICAL SURVEY William C. Ackermann, Chief John C. Frye, Chief Preliminary Report on GROUND-WATER RESOURCES OF THE CHICAGO REGION, ILLINOIS Max Suter Robert E. Bergstrom H. F. Smith Grover H. Emrich W. C. Walton T. E. Larson STATE OF ILLINOIS William G. Stratton, Governor DEPARTMENT OF REGISTRATION AND EDUCATION Vera M. Rinks, Director
-
Upload
nguyentram -
Category
Documents
-
view
232 -
download
5
Transcript of Preliminary report on ground water resources of the ... report on ground-water resources of the...

C O O P E R A T I V E G R O U N D - W A T E R R E P O R T I Urbana, Ill inois 1959
STATE WATER SURVEY STATE GEOLOGICAL SURVEY William C. Ackermann, Chief John C. Frye, Chief
Preliminary Report on
GROUND-WATER RESOURCES OF
THE CHICAGO REGION, ILLINOIS
Max Suter Robert E. Bergstrom H. F. Smith Grover H. Emrich W. C. Walton T. E. Larson
STATE OF ILLINOIS William G. Stratton, Governor DEPARTMENT OF REGISTRATION AND EDUCATION Vera M. Rinks, Director

PRELIMINARY REPORT ON GROUND-WATER RESOURCES
OF THE CHICAGO REGION, ILLINOIS
MAX SUTER, ROBERT E. BERGSTROM, H. F. SMITH, GROVER H. EMRICH, W. C. WALTON, and T. E. LARSON
STATE WATER SURVEY STATE GEOLOGICAL SURVEY
C O O P E R A T I V E G R O U N D - W A T E R R E P O R T I
U R B A N A , I L L I N O I S 1959

S T A T E OF I L L I N O I S WILLIAM G. STRATTON, Governor
DEPARTMENT OP REGISTRATION AND EDUCATION VERA M. B I N K S , Director
BOARD OP NATURAL RESOURCES AND CONSERVATION H O N . VERA M. B I N K S , Chairman
ROGER ADAMS, Ph.D., D.Sc., LL.D., Chemistry
ROBERT H. ANDERSON, B. S., Engineering
ALFRED E. EMERSON, Ph.D., Biology
WALTER H. NEWHOUSE, Ph.D., Geology
L E W I S H. TIFFANY, Ph.D., Pd.D., Forestry
DEAN WILLIAM L. EVERITT, E.E., Ph.D., University of Illinois
PRESIDENT DELYTE W. MORRIS, Ph.D., Southern Illinois University
STATE WATER SURVEY STATE GEOLOGICAL SURVEY WILLIAM C. ACKERMANN, Chief J O H N C. FRYE, Chief
Printed by Authority of the State of Illinois
F O R E W O R D
This report initiates a joint series of publications designed to
present results of ground-water resource investigations carried on
cooperatively by the State Water Survey and the State Geological
Survey. It is indeed fitting that the first in this series deals with the
ground-water resources of the Chicago region in Illinois. Within this
part of Illinois there occurs not only the greatest concentration of
people and of industries, but also the largest withdrawals of ground
water in relation to area.
It should be pointed out that this report presents preliminary
findings based largely on data collected independently by the two
Surveys over a period of several decades. The urgent need for
continuing integrated research on ground-water resources of this
region is clearly apparent, and, within the limitations of their finan
cial resources, the Geological and Water Surveys are planning to
carry forward a series of such joint studies.
It also is anticipated that cooperative studies already started or
in the planning stage for other parts of the state will result in
reports in this new series, with the ultimate objective of a satisfac
torily thorough knowledge of the ground-water resources of all parts
of Illinois.
WILLIAM C. ACKERMANN . Chief, Illinois State Water Survey
JOHN C. FRYE Chief, Illinois State Geological Survey
[ 3 ]

C O N T E N T S PAGE
Summary 7 Introduction 9
Purpose and scope 9 Previous reports 9 Acknowledgments 9 Location and general features 9
Geography 12 Topography 12 Drainage 12 Climate 13 Population 14 Economy 14
Source, movement, and occurrence of ground water 16 Geology 17
Bedrock stratigraphy 17 Precambrian ; 17 Cambrian : 19 Ordovician 21 Silurian 33 Devonian and Mississippian 33 Pennsylvanian 33
Bedrock structure 36 Structure contour maps 36 Eegional structure 36 Folds 36 Faults 36
History of bedrock 36 Bedrock topography 36 Unconsolidated deposits 38
Glacial drift 38 Recent deposits 39 Thickness 39 History 39
Relationship of geology to ground water 40 General relations 40 Cambrian-Ordovician and Mt. Simon Aquifers 40 Maquoketa Formation 41 Shallow dolomite aquifers 41 Glacial drift aquifers 42 Structure 43
Pumpage. 43 Public supplies 44
Municipal 44 Institutional .44
Industrial supplies 44 Rural non-irrigation supplies 45 Irrigation supplies 45
Farms 45 Golf courses and cemeteries 45
Total pumpage 45 Distribution and density of pumpage 47
Hydrology of aquifers 48 Cambrian-Ordovician and Mt. Simon Aquifers 48
Hydraulic properties 48 Pumping tests 48 Summary of results of pumping tests 50
Theoretical effects of pumping 50 Influence of geohydrologic boundaries 51
[ 4 ]
Piezometric surface of Cambrian-Ordovician Aquifer 52 Artesian pressure about 1864 and 1895 53 Artesian pressure about 1915 54 Artesian pressure in 1958 54
Recharge to Cambrian-Ordovician Aquifer 59 Movement of water in Cambrian-Ordovician Aquifer 60
Quantity of water from recharge areas in 1958 60 Quantity of water moving into cones of depression in 1958 60
Discharge from deep wells 61 Pumpage 61 Quantity of water derived from Silurian age dolomite and Mt. Simon Aquifer. 62
Decline of artesian pressure in Cambrian-Ordovician Aquifer 63 Quantity of water taken from storage in Cambrian-Ordovician Aquifer 63
Application of hydrologic system to past records 63 Potential ground-water development and its effects 65 Practical sustained yield of Cambrian-Ordovician Aquifer 66
Shallow dolomite aquifers 66 Glacial drift aquifers ,71
Water quality 74 Temperature 74 Mineral quality 75
Shallow drift and dolomite aquifers 75 Cambrian-Ordovician Aquifer 75 Mt. Simon Aquifer 77
Recommendations for further study 77 Selected references 78 Appendix A—Selected mineral analyses of water 79 Appendix B—Selected well records 81
I L L U S T R A T I O N S FIGURE PAGE
1. Location of Chicago region and physiographic divisions of Illinois 8 2. Chicago region with location of selected wells 10 3. Quadrangle topographic maps of the Chicago region 11 4. Drainage and watersheds of the Chicago region. . . . : 12 5. Glacial geology In pocket 6. Cross sections of the glacial deposits In pocket 7. Average annual precipitation 13 8. Mean annual temperature 14 9. Cooling degree days at Chicago 14
10. Growth of population by county (except Cook) 15 11. Growth of population of region compared with that of state of Illinois 15 12. Thickness of the unconsolidated deposits in the Chicago region 18 13. Bedrock topography. 20 14. Bedrock valleys 21 15. Cross sections of the bedrock 22 16. Areal geology of the bedrock surface and major structures 23 17. Stratigraphy and water-yielding properties of the rocks and character of the
ground water. 24 18. Stratigraphic nomenclature used in this and previous reports relating
to the Chicago region 26 19. Elevation of the top of the Mt. Simon Aquifer 27 20. Elevation of the top (A) and thickness of the upper and middle units
(B) of the Eau Claire Formation 28 21. Elevation of the top (A) and thickness (B) of the Ironton-Galesville Sandstone. . . . 29 22. Elevation of the top (A) and thickness (B) of the Glenwood-St. Peter Sandstone. . . 30 23. Thickness of the rocks between the top of the Glenwood-St. Peter Sandstone
and the top of the Ironton-Galesville Sandstone 31 24. Elevation of the top (A) and thickness (B) of the Galena-Platteville Dolomite 32
[ 5 ]
FIGURE PAGE
25. Lithologie character and thickness of the upper (A) , middle (B) , and lower (C) units of the Maquoketa Formation 34
26. Elevation of the top (A) and thickness (B) of the Maquoketa Formation 35 27. Thickness of the Silurian rocks 37 28. Pumpage per square mile from shallow aquifers 46 29. Pumpage per square mile from deep aquifers 46 30. Coefficients of transmissibility of Cambrian-Ordovician Aquifer 50 3 1 . G r a p h s of theoretical distance-drawdown (A) , time-drawdown (B) , and time-
drawdown considering boundaries (C) for Cambrian-Ordovician Aquifer 51 32. Piezometric surface of Cambrian-Ordovician Aquifer about 1864 and 1895 52 33. Piezometric surface of Cambrian-Ordovician Aquifer about 1915 54 34. Piezometric surface of Cambrian-Ordovician Aquifer in 1958 54 35. Sulfate content of waters from the Cambrian-Ordovician Aquifer 59 36. Pumpage from the deep wells for the period of record 61 37. Distribution of estimated pumpage from deep wells in 1958 62 38. Decline of artesian pressure in deep wells in the Chicago region for period of record. 64 39. Decline of artesian pressure in deep wells at Joliet for period of record 64 40. Decline of artesian pressure in Cambrian-Ordovician Aquifer, 1864-1958 65 41. Depth-frequency histogram (A) and depth-cumulative percentage curve (B) of
wells completed in shallow dolomite in 17 townships in Will and Cook counties. . . 67 42. Penetration versus specific capacity of wells in shallow dolomite aquifers 67 43. Water levels compared with departure from normal precipitation at Chicago Heights 71 44. Hydrographs of water levels in the shallow aquifers 72 45. Temperature of water from Ironton-Galesville Sandstone 74 46. Elevation versus water temperature in the deep aquifers 75 47. Hardness of water from shallow drift and dolomite aquifers 76 48. Hardness of water from Cambrian-Ordovician Aquifer 76 49. Chloride content of water from Cambrian-Ordovician Aquifer 77 50. Elevation versus chlorides in the Mt. Simon Aquifer 77
T A B L E S TABLE PAGE
1. Area and population of the Chicago region by county 11 2. Highest and lowest monthly precipitation during 1938-1957 13 3. Wells to Precambrian rocks near the Chicago region 17 4. Characteristics of glaciofluvial deposits 39 5. Municipal ground-water pumpage 44 6. Municipal pumpage by apparent source, 1957 44 7. Estimated institutional pumpage by apparent source, 1957 44 8. Estimated industrial pumpage by apparent source, 1957 45 9. Estimated rural non-irrigation pumpage by apparent source, 1957 45
10. Estimated farm irrigation pumpage by apparent source, 1957 45 11. Estimated golf course and cemetery irrigation pumpage by apparent source, 1957. . . 45 12. Summary of estimated total pumpage by use, 1957 46 13. Summary of estimated total pumpage by apparent source, 1957 46 14. Geographic distribution and density of pumpage, 1957 47 15. Representative coefficients of transmissibility of the Cambrian-Ordovician Aquifer. . 49 16. Coefficients of storage of the Cambrian-Ordovician Aquifer 50 17. Water levels in deep wells about 1895 53 18. Water levels in.deep wells about 1915 55 1 9 . Water levels in deep wells in 1958 56 20. Amount of water moving into cones of depression in 1958. 61 21. Distribution of pumpage from deep wells in 1908 and 1958 :. 61 22. Computed nonpumping water-level decline in the Lisle area 65
2 3 . Computed future nonpumping. water-level decline, 1958-1980 65 24. Specific-capacity data for wells in shallow dolomite 68 25. Specific-capacity data for wells in shallow dolomite, summary by county 71 26. Specific-capacity data for wells in glacial drift 73
[ 6 ]

PRELIMINARY REPORT ON
GROUND-WATER RESOURCES OF THE CHICAGO REGION, ILLINOIS
MAX SUTER, ROBERT E. BERGSTROM, H. F. SMITH, GROVER H. EMRICH, W. C. WALTON, and T. E. LARSON
ABSTRACT The purpose of this study was to make an evaluation of the ground-water resources of the
Chicago region on the basis of available data. Such an evaluation is particularly urgent at this time due to the progressively increasing demands for water supplies and the continuing decline of water levels in some aquifers.
Ground-water resources in the Chicago region of Illinois are developed from four water-yielding units: 1) glacial drift aquifers; 2) shallow dolomite aquifers; 3) Cambrian-Ordovician Aquifer; and 4) the Mt. Simon Aquifer.
The Cambrian-Ordovician Aquifer has been the most highly developed source of large ground-water supplies. I ts estimated yield in 1958 of more than 43 million gallons a day (mgd) approaches the amount that can be withdrawn without dewatering the Ironton-Galesville Sandstone, the lowermost and most productive formation in the aquifer. Artesian pressure in the Cambrian-Ordovician Aquifer at Chicago has declined as much as 660 feet since 1864 as a result of pumpage.
The glacial drift and shallow dolomite aquifers yielded more than half of the 127.9 mgd of ground water pumped in the region in 1957. This withdrawal resulted in no general decline in nonpumping water levels, indicating that the potential yield is considerably larger than present withdrawal. Future ground-water supplies should be taken from the shallow aquifers wherever possible.
SUMMARY The Chicago region as defined in this report consists
of Cook, DuPage, Kane, Kendall, Lake, McHenry, and a portion of Will and Grundy Counties of northeastern Illinois. The region is the most densely populated and heavily industrialized area in Illinois. Compared to the state as a whole, the region contains only 7.5 percent of the land area but has 61.3 percent of the population. It has been one of the most favorable ground-water areas in the state. However, the tremendous industrial and municipal growth in the region has brought about local problems of water supply.
Some 110 municipalities not served by water from Lake Michigan obtain supplies from wells. Many industries, including a large number of plants within the area served by Lake Michigan water, have private wells and use ground water for processing and cooling.
Ground-water resources in the region are developed from four aquifer systems: 1) sand and gravel deposits of the glacial drift; 2) shallow dolomite formations, mainly of Silurian age; 3) Cambrian-Ordovician Aquifer, of which the Ironton-Galesville and Glenwood-St. Peter Sandstones are the most productive formations; and 4) the Mt. Simon Aquifer, consisting of the sandstone of the Mt. Simon and lower Eau Claire Formations of Cambrian age.
Unconsolidated deposits, mainly glacial drift, ranging in thickness from a foot or less to more than 400 feet, overlie the. bedrock in the Chicago region. Water-yielding sand and gravel deposits locally occur in the drift, particularly in valleys cut in the bedrock.
Silurian age dolomite, which is widely used as a source of ground water, is the uppermost bedrock formation in most of the region. The bedrock formations dip slightly-south of east at a rate of about 10 feet per mile. They are warped into minor folds and at some places are faulted. There is no indication that the folds or faults act as barriers to the regional movement of ground water. .
The glacial drift and shallow dolomite aquifers are connected hydrologically and are separated from the Cambrian-Ordovician Aquifer in most of the region by the Maquoketa Formation, mainly shale, of Ordovician age. The relatively impermeable parts of the Eau Claire Formation separate the Cambrian-Ordovician from the Mt. Simon Aquifer.
Pumpage in the region in 1957 was 127.9 million gallons per day (mgd) of which 72.4 mgd were from deep wells penetrating the Cambrian-Ordovician Aquifer and, locally, the Mt. Simon Aquifer, 41.2 mgd were from wells finished in the shallow dolomite, and 14.2 mgd were from wells finished in the glacial drift. It was estimated that about 27 percent of the water pumped from deep wells comes from the shallow dolomite or glacial drift aquifers, thus making the present yield of the shallow aquifers about 60 percent of the total pumpage in the region.
The Cambrian-Ordovician Aquifer has been the most highly developed aquifer for large ground-water supplies in the Chicago region and is considered in most detail in this report. Artesian pressure in the aquifer at Chicago has declined as much as 660 feet since 1864 to a low of 50 feet above sea level, an average rate of decline of about seven feet per year. There are now six pro-
[ 7 ]
8 CHICAGO REGION GROUND-WATER RESOURCES
nounced cones of depression in the region. Little decline has occurred west of the border of the Maquoketa Formation, and the presence there of a hydrologic connection between the Cambrian-Ordovician Aquifer and the shallow aquifers is indicated. A large part of the recharge to the Cambrian-Ordovician Aquifer is from this area. This is further substantiated by the low temperature and low sulfate content of water from the Cambrian-Ordovician Aquifer in the area. This part of the Chicago region is the most favorable for further development of deep wells.
Data from 63 pumping tests were analyzed to determine the hydraulic properties of the Cambrian-Ordovician Aquifer. The average coefficient of transmissi-bility was determined to be 17,400 gallons per day per foot. Coefficients of transmissibility decrease to the southeast. A coefficient of storage of 0.0006 applies for periods of pumping involving several years or more.
In making estimates of future water levels in the Cambrian-Ordovician Aquifer, a recharge boundary 47 miles west of Chicago and two barrier boundaries, one 37 miles east, and one 60 miles south of Chicago, were assumed. It was estimated that the practical sustained yield of the aquifer is about the present rate of withdrawal.
Based on the assumption that total pumpage from deep wells will increase to about 92 mgd in 1980, water levels will decline at Chicago to an elevation of about 250 feet below sea level, which will be sufficient to de-water much of the upper part of the Cambrian-Ordovician Aquifer. Predictions of future water levels are based in part on extrapolations of past ground-water use in the region. Future conditions may vary from the general findings of the report in local areas where the distribution and rates of pumping are not as assumed.
The Mt. Simon Aquifer contains water that is under greater artesian pressure but is more highly mineralized than water in the Cambrian-Ordovician Aquifer. Proper plugging of abandoned deep wells to prevent upward movement of the water from the Mt. Simon Aquifer is necessary to protect the highly developed Cambrian-Ordovician Aquifer.
Hydrographs indicate no general or permanent decline in water levels in wells finished in the shallow aquifers. The fact that there has been no water-level decline even in the areas of heaviest pumpage indicates that the potential yield of the shallow aquifers probably is considerably larger than the present withdrawal of more than 75 mgd. Therefore the shallow aquifers are the most likely sources to investigate for additional ground-water supplies. Additional study is necessary to delineate favorable areas for further ground-water development and to determine the potential yield of the shallow aquifers.
The temperature of water from the shallow aquifers averages 51.6°F. The hardness of the water ranges from less than 100 parts per million (ppm) to more thau 1000 ppm.
The temperature of water from the Cambrian-Ordovician Aouifer ranges from about 53°F. in the western part of the region to about 62°F. in the eastern part.
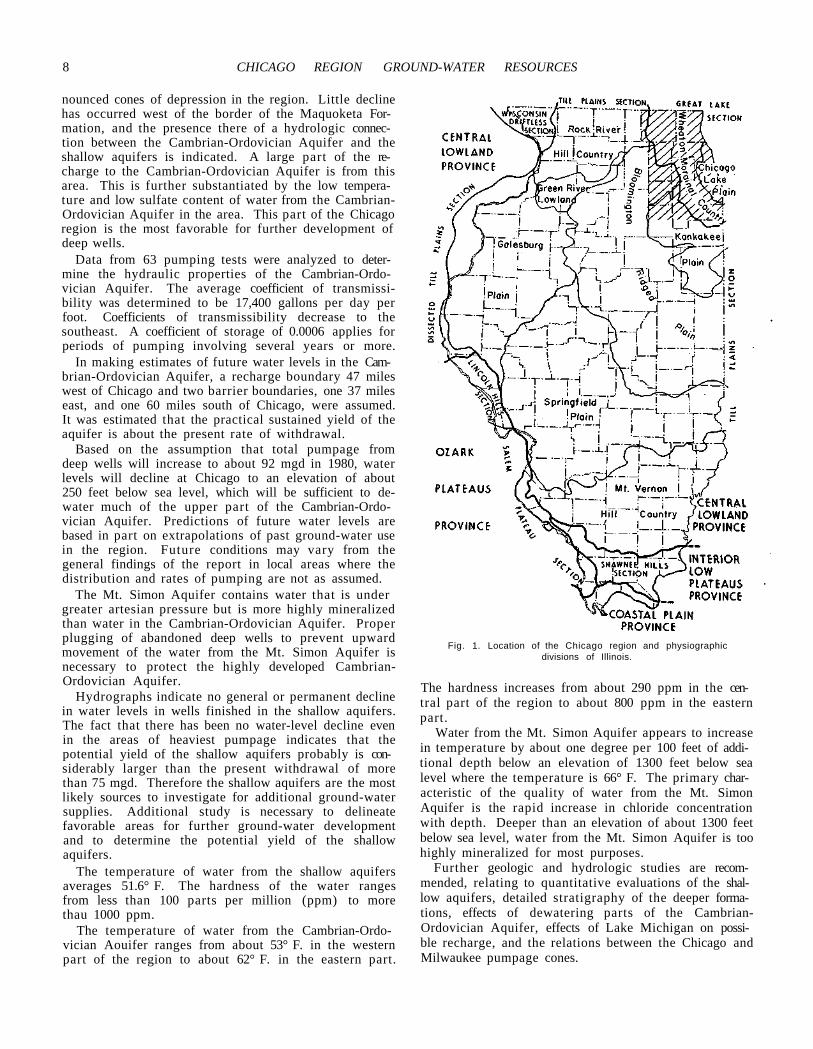
Fig. 1. Location of the Chicago region and physiographic divisions of Illinois.
The hardness increases from about 290 ppm in the central part of the region to about 800 ppm in the eastern part.
Water from the Mt. Simon Aquifer appears to increase in temperature by about one degree per 100 feet of additional depth below an elevation of 1300 feet below sea level where the temperature is 66°F. The primary characteristic of the quality of water from the Mt. Simon Aquifer is the rapid increase in chloride concentration with depth. Deeper than an elevation of about 1300 feet below sea level, water from the Mt. Simon Aquifer is too highly mineralized for most purposes.
Further geologic and hydrologic studies are recommended, relating to quantitative evaluations of the shallow aquifers, detailed stratigraphy of the deeper formations, effects of dewatering parts of the Cambrian-Ordovician Aquifer, effects of Lake Michigan on possible recharge, and the relations between the Chicago and Milwaukee pumpage cones.

INTRODUCTION 9
INTRODUCTION
The Chicago region has been one of the most favorable ground-water areas in Illinois. I t is under la in at depths of 500 feet and more by sandstone aquifers tha t have been prolific sources of water for nearly 100 years. In early days of ground-water development in the region, roughly before 1895, wells drilled to the aquifers were especially desirable because the sandstones yielded water of excellent quali ty with enough artesian pressure to cause water to flow at the surface without pumping. At lesser depths the Chicago region is underlain by glacial deposits and creviced dolomite tha t locally are excellent sources of ground water.
The diversity of water sources has promoted industrial expansion of the region and also facilitated urban growth. Large users of water obtain supplies from deep rock wells when water is not available from Lake Michigan and other surface sources. Small users of water, such as suburban residences or farms, obtain adequate water at reasonable cost from shallow wells finished in the glacial deposits or under lying creviced dolomite.
However, the tremendous industr ial and municipal growth in the Chicago region has brought about local problems of water supply. Exploitation of the deep rock aquifers has lowered water levels in some areas to the point where pumping costs are restr ict ing fur ther development at present water rates. The expansion of suburban residential areas with individual sewerage systems and wells has in some areas adversely affected shallow ground-water sources.
PURPOSE AND SCOPE
This repor t is based on all da ta on file at the Illinois State Wate r Survey and the Illinois State Geological Survey and on other published reports. I t presents the hydrologic and geologic factors along with history, present conditions, and effects of possible future development on the ground-water resources of the Chicago region. Special emphasis is placed on the most heavily developed deep sandstone aquifers. Basic geologic, hydrologic, and chemical data applicable to local problems and to regional and long-range interpretat ions are presented to help formulate future policy on water resource planning and development in northeastern Illinois.
The investigation was begun in 1942 with a program to collect data in the Chicago region. Da ta on water levels, pumpage, mineral quali ty of water, and well tests were collected by the State Wa te r Survey. Well logs, dril l ing samples, geophysical logs and other geologic information were collected by the State Geological Survey.
Although the repor t summarizes present-day knowledge of ground-water conditions in the Chicago region, it must be considered a prel iminary repor t in the sense that it is pa r t of a continuing study of the Chicago region ground-water resources, and its conclusions and
interpretat ions will be modified and expanded as more data are obtained.
All elevations given in this report refer to mean sea level (m.s.L), 1929 general adjustment, Coast and Geodetic Survey.
PREVIOUS REPORTS
The geology and water resources of the region have received considerable s tudy and many reports have been published. The major reports are listed in the Selected References at the end of the report .
ACKNOWLEDGMENTS
Many persons and organizations have assisted in the collection of data and prepara t ion of the repor t for this investigation. Much of the basic data was collected by Jacob S. Randall , J. G. Geils, J o h n B. Millis, Robert T. Sasman, and W. J. Wood, of the Wate r Survey and Lowell A. Reed and A r t h u r J. Zeizel of the Geological Survey.
W. H. Voskuil prepared the section on economy. George E. Ekblaw prepared the m a p of glacial geology and a port ion of the map of bedrock topography. John W. Hawley helped prepare the maps showing the thickness of the unconsolidated deposits and the Silurian rocks. All three are staff members of the Geological Survey. Stanley A. Changnon, J r . , of the Wate r Survey prepared the material on climate. Helpful suggestions and criticisms were given, par t icular ly by G. B. Maxey but also by many individuals from both Surveys, du r ing the course of the investigation.
The Wisconsin Geological Survey and the Ground-Water Branch of the United States Geological Survey at Madison generously gave the authors access to logs' and hydrographs of wells in southeastern Wisconsin.
This repor t would have been impossible without the generous cooperation of municipal officials, industries, engineers, and water-well contractors who provided information on wells, water levels, and pumpage.
LOCATION AND GENERAL FEATURES
The Chicago region of Illinois described in this report includes Cook, DuPage , Kane, Kendall, Lake, and McHenry Counties, and the par t s of Grundy and Will Counties nor th of the nor th boundary of T. 32 N. (figs. 1 and 2 ) . Quadrangle topographic maps of this area have been prepared unde r a cooperative arrangement between the United States Geological Survey and the Illinois State Geological Survey. F igure 3 is an index map showing the location of the quadrangles.
The region is the most densely populated and heavily industrialized section of Illinois. The area and population are given in table 1. The region under consideration contains only 7.5 percent of the land area of the state of Illinois but has 61.3 percent of the population.


INTRODUCTION 11
TABLE 1. AREA AND POPULATION OF THE CHICAGO REGION BY COUNTY
According to the 1954 Census of Manufactures, the eight counties under study had 13,279 manufacturing establishments producing goods valued, after deduction of labor and supply costs, at $7,010,865,000 that year. The state as a whole had 17,628 manufacturing establishments with a net production value of $9,668,752,000. Thus the Chicago region has 75.2 percent of the state's manufacturing establishments and produced 72.5 percent of the value added by manufacturing.
The vast economic importance of the area is a result of many factors (Fryxell, 1927, p. 1-10) : 1) it is near the center of one of the richest agricultural belts in the world; 2) favorable terrain and location have made Chicago a major railway and highway center; 3) the Great Lakes afford a water transportation system that links Chicago with the other great ports of the world; 4) the Chicago Drainage Canal and the Calumet-Sag Channel connect Chicago with the Illinois and Mississippi River systems; 5) adequate resources and moderate climate are favorable for supporting a large population.
All cities that border Lake Michigan in the Chicago region, except Lake Bluff, Zion, and Winthrop Harbor, obtain water supplies from the lake. The City of Chicago, which serves about 60 municipalities and pumps more than a billion gallons a day from the lake, is the largest user of water.
Some 110 municipalities not served by water from Lake Michigan obtain supplies from wells. Suburban and rural water supplies beyond the municipal distribution system are obtained from ground water. Many industries, including a large number of plants within the area served by Lake Michigan water, have private wells and use ground water for processing and cooling.
Some industrial water is obtained from surface sources other than Lake Michigan.
Fig. 3. Quadrangle topographic maps of the Chicago region.
Fig. 2. Chicago region with location of selected wells. Shown are most wells in Cambrian-Ordovician Aquifer for which geologic or hydrologic records are on file at the State Surveys. Only a few wells in shallow dolomite and glacial drift aquifers, representative of the several thousand for which records are on file, are shown. See Appendix B for summaries of well data.

12 CHICAGO REGION GROUND-WATER RESOURCES
GEOGRAPHY TOPOGRAPHY
The Chicago region lies near the center of the physiographic Central Lowland Province, a glaciated lowland that stretches from the Appalachian Plateau on the east to the Great Plains of Kansas, Nebraska,. and the Dakotas on the west. It includes five physiographic subdivisions (fig. 1) : 1) the Chicago lake plain, 2) the Wheaton morainal country, 3) the Kankakee plain, 4) the Bloomington ridged plain, and 5) the Rock River hill country.
The Chicago lake plain, extending from Indiana as far north as Winnetka and as far west as LaGrange, is a low, flat surface sloping gently toward the lake, interrupted by a few low ridges and knolls and by two large valleys along the Des Plaines River and Sag Channel (figs. 2, 4). Low, discontinuous ridges (fig. 5, in pocket) on the lake plain mark the position of three former levels of Glacial Lake Chicago, the ancestor of Lake Michigan. The highest and earliest beach ridge, the Glenwood stage shore line, has an elevation of about 635 feet or 55 feet above present lake level (fig. 6, in pocket). About 20 feet lower (615-foot elevation) is the Calumet stage shore line, and about 15 feet still lower (600-foot elevation) is the Toleston stage shore line. Present lake level is about 580 feet.
Bordering the lake plain to the north, west, and south is the Wheaton morainal country, characterized by hilly topography, broad parallel morainic ridges, lakes, and swamps (figs. 5 and 6). This is the most extensive physiographic subdivision in the region, and includes most of Lake, McHenry, DuPage, and Will Counties. It also contains the highest land, for extensive tracts in Kane and McHenry Counties are more than 900 feet above sea level. The highest point in the region, four miles northeast of Harvard, is 1192 feet.
The Kankakee plain, including western Will, southeastern Kendal], and Grundy Counties, is a level to gently undulatory plain that occupies the position of a basin between higher morainic country to the west and east. Low ridges, terraces, bars, and dunes locally rise above the general level.
The Bloomington ridged plain lies west of the Kankakee plain. Only the northeastern part of it, in southwestern Kane and northwestern Kendall Counties, is within the region covered by this report. It is characterized by broad, morainic ridges with intervening wide stretches of relatively flat or gently rolling plains. Lakes and swamps are less common than in the Wheaton morainal country.
The Rock River hill country extends into the area of this report only in western McHenry County and the northwest corner of Kane County. It is characterized by rolling hills, thin glacial drift, and narrow valleys.
Fryxell (1927, p. 1-10), Bretz (1955, p. 27-41), and Leighton, Ekblaw, and Horberg (1948, p. 21-26) present descriptions of the physiography of the region.
Fig. 4. Drainage and watersheds of the Chicago region.
DRAINAGE
The drainage map of the Chicago region (fig. 4), showing all streamways however slightly incised, has many blank areas, indicating poor drainage. Much of the morainal country is without integrated drainage-ways and still has the constructional slopes that were fashioned by the glaciers. Swamps and lakes are common. Most of the lake plain is without natural drain-ageways.
The drainage divide between the Great Lakes and the Mississippi River systems crosses the region only a few miles from the lake (fig. 4). About 68 square miles along Lake Michigan north of downtown Chicago and some 294 square miles around and south of Calumet Lake drain into Lake Michigan. The remainder of the region drains into the Mississippi River system, 465 square miles through the Kishwaukee-Rock Rivers, and 3,342 square miles through the Illinois by way of the Des Plaines, DuPage, Fox, and Kankakee Rivers.

CLIMATE 13
TABLE 2. HIGHEST AND LOWEST MONTHLY PRECIPITATION DURING 1938-1957
CLIMATE
Precipitation, evaporation, and temperature are the most commonly measured climatic factors that are directly related to the availability, storage, movement, and withdrawal of ground water. Precipitation adds water to the land and evaporation takes it away. Temperature influences evaporation and infiltration and also affects the rate and distribution of ground-water withdrawal.
The climate of the Chicago region is classified as continental with warm summers and cold winters. Precipi-tation, evaporation, and temperature vary with the latitude. Aside from local influences, such as Lake Michigan and the large urban area of Chicago, the average annual precipitation for the period 1938-1957 ranged from about 32 inches in the north to about 36 inches in the southeast (fig. 7) and the average annual temperature ranged from about 48°F. to 51°P. (fig. 8).
Precipitation varies through a wide range in intensity, geographic distribution, and frequency of storms. During the period 1938-1957, June was the wettest month with 4.15 inches of rain and February was the driest, with 1.7 inches. Highest and lowest precipitation for each month for the 20-year period, regardless of location, are shown in Table 2. The table illustrates the wide variation in amount of precipitation that may be expected for a given month over a number of years. The greatest range shown in the table is for October when a trace of precipitation was recorded at Waukegan in 1952 whereas 14.86 inches of precipitation were recorded at Aurora in 1954.
On the average, 120 days per year have measurable precipitation. The average annual snowfall is 31 inches, and normally nine days each winter have snowfall of more than one inch.
The Chicago region has a wide seasonal range of temperatures. January, the coldest month, had a mean temperature of 25.1 degrees, ranging from 22.7 degrees at Antioch to 27.2 degrees at Joliet. July, the warmest month, had a mean temperature of 74.1 degrees, ranging from 75.5 degrees at Joliet to 72.4 degrees at Antioch.
During the period of frequent and persistent daily
temperatures below freezing little or no' recharge to the ground-water reservoir occurs because much of the time the ground is frozen and relatively impermeable. During the 1938-57 period the region averaged 90 days per year with mean daily temperatures below freezing.
The length of the growing season also influences recharge because plants intercept most of the water soaking into the soil zone during this period. The growing season for the Chicago region ranges from 150 to 180 days with most of the region in the 160- to 170-day range. The average dates of beginning and end of the growing season (the period between killing frosts) occur in late April or early May and in October, respectively.
Temperatures during the summer months directly influence ground-water pumpage because ground water
Fig. 7. Average annual precipitation in the Chicago region.

14 CHICAGO REGION GROUND-WATER RESOURCES
Fig. 8. Mean annual temperature in the Chicago region.
is widely used for air conditioning and other cooling purposes in the Chicago region. To estimate the magnitude of cooling requirements, a classification of cooling degree days is used and computed on a daily basis by subtracting 75 degrees from the mean daily temperature. For the months during which cooling degree days normally occur, the average and extreme values for Chicago are shown in figure 9. On an annual basis, Chicago averages 139 cooling degree days per year. The annual average in the eight county area ranges from 80 in northeastern Lake County to approximately 150 per year in southwestern Grundy County.
In general, recharge from precipitation to the groundwater reservoir is greatest in the spring, that is, after the ground thaws and before vigorous plant growth begins. This has been substantiated by observations of water-levels in the Chicago region and also in adjacent areas. It has been estimated that about 10 to 12 percent of the annual precipitation reaches the ground-water reservoirs in Illinois, and it is reasonable to believe that recharge in the Chicago region is within this order of magnitude. More study is needed to determine accurately the amount of recharge in the region.
POPULATION
The pattern of population controls ground-water use. In the Chicago region the large urban area is the main factor. The extension of urban areas affects groundwater conditions in the following ways: 1) newly built-up areas obtain water supplies from many individual wells whose combined effect increases pumpage over a widespread area; 2) such areas later develop communal water supplies that increase local concentrations of pumpage; 3) urbanization may affect ground-water recharge and is known to alter the run-off relationships of the natural terrain.
The first settlements in the Chicago area were at the mouth of the Chicago River where Fort Dearborn was built in 1803. Cook County was established in 1831 and the other seven counties of the area within the following 10 years.
The growth of the population in the region is shown in figures 10 and 11, which also show the predominance of the population of Chicago compared with that of the rest of the state. The region under consideration has had one-half the state's population since 1914, and Cook County has had more than one-half the state's population since 1927. Population is given in table 1, p. 11.
The growth of urban areas in Illinois has accompanied the growth in population, especially in the last 30 years. Much of the urban growth has taken place in suburbs of the larger cities.
ECONOMY
The economy of northeastern Illinois is based on manufacturing, agriculture, and mining, named in the
Fig. 9. Cooling degree days at Chicago.

ECONOMY 15
order of. value of output. In addition, Chicago is the focal point for vast rail and truck systems and for petroleum and natural gas pipelines that transport raw materials into the Chicago industrial district and also distribute the products manufactured from these raw materials.
Of the 20 manufacturing groups in the Chicago area classified by the Census of Manufactures for 1954, the iron and steel industry is the largest and is also the largest industrial user of ground water.
Pood processing, including the meat, dairy products, canned and frozen goods, grain mill products, and bakery products industries, ranks second to the metal work-
Fig. 10. Growth of population by county (except Cook). Data from U. S. Census; 1956 estimate from Illinois Department of Public Health.
Fig. 11. Growth of population of region compared with that of Illinois. Data from U. S. Census; 1956 estimate from Illinois
Department of Public Health.
ing industries in northeastern Illinois in terms of number employed and wages paid and these industries are the second largest industrial users of ground water.
Chicago is the second largest printing and publishing center in the nation. Commercial printing is the largest branch of the industry, followed by newspaper publishing and lithographing.
The manufacture of apparel, chemicals, petroleum products, furniture, and pulp and paper follow in order of value of output.
Electric utility power plants in the Chicago area, including plants at Waukegan, Aurora, Joliet, and Lockport, have a capacity of 3,000,000 kilowatts and an annual electric power output of approximately 15 billion kilowatt hours. Electric power plants use large amounts of surface water but only minor amounts of ground water.
Agriculture also is of considerable importance in northeastern Illinois. The eight counties in the region have 2,027,000 acres, or 71 percent of the area, in farms, compared with 86.5 percent for the state as a whole. In the dominantly agricultural counties of Grundy, Kane, Kendall, McHenry, and Will, the land in farms is 87.3 percent of the total land area. Farm water supplies are generally drawn from ground-water sources,

16 CHICAGO REGION GROUND-WATER RESOURCES
including water for domestic use, watering stock, and some for irrigation.
The principal mineral products of the area are sand, gravel, stone, and clay, with small quantities of coal. The value of quarry products in the area in 1956 was $36 million, about half the total value for the state. About 70 percent of the quarry products come from Cook County and the remainder from the other seven counties in the area. Ground water is heavily used in the washing processes in sand and gravel production, and pits and quarries influence the local hydrology.
SOURCE, MOVEMENT, AND OCCURRENCE OF GROUND WATER
The general principles underlying the source, movement, and occurrence of ground water have been described by Meinzer (1923, 1942, p. 385-487) and others. They are summarized here to explain technical terms used in this report.
Ground water is derived from precipitation that falls mainly as rainfall and seeps into the ground. The water infiltrates through loose particles of the soil and percolates downward. Below a certain depth all openings in the earth materials are filled with water. Ground water is defined as water in the zone of saturation. The process of addition of water to the ground-water reservoir is called recharge.
Openings in which ground-water is stored in the zone of saturation range in size from tiny pores between particles of clay and silt to large crevices in dolomite and limestone. The porosity of an earth material refers to its pore space and is expressed quantitatively as the percentage of its total volume.
Earth materials that have interconnected openings large enough to store and transmit water readily into a well or spring are called aquifers. The capacity of an earth material to transmit water under pressure is called its permeability.
The upper limit of the saturated zone is called the water table. The water immediately below the water table is unconfined and can rise or lower freely, as water is added or withdrawn. In wells that penetrate the saturated zone under these conditions the water level indicates the elevation of the water table; such wells are called water-table wells.
Under natural conditions, the water table roughly parallels the surface topography, rising under the uplands and intersecting the ground surface along perennial streams, lakes, and swamps into which groundwater is discharged by gravity flow from adjacent areas where the water table is higher. The position and shape of the water table may be modified by the kind of rocks present or by other factors affecting permeability. The position of the water table and the discharge of groundwater to streams fluctuate from season to season and year to year.
If a permeable water-bearing formation, or aquifer, is confined between nonpermeable beds and water is supplied to it from a higher elevation, the water is confined under hydraulic pressure. When such an aquifer is penetrated by a well, water will rise above the aquifer in the well to a height equal to the hydraulic head of the aquifier. Ground water that is confined under pressure iu this manner is said to be under artesian conditions. Wells penetrating such aquifers are called artesian wells. If the hydraulic head is above land surface at the well, the well will flow.
To supply a producing well, ground water must move through the aquifers toward the well. Under water-table conditions, pumping lowers the water table in the vicinity of the well and induces the flow of ground water toward the well from adjacent areas. Under artesian conditions, pumping causes, in the vicinity of the well, a reduction of hydrostatic pressure that induces the flow of ground water toward the well. The aquifer under artesian conditions is not dewatered but remains full because the discharged water is derived by the compaction of the aquifer and associated beds, by the expansion of the confined water, and by flow from the recharge area. The compaction of the aquifer and associated beds and expansion of confined water constitute the storage factor of an artesian aquifer.
The depression of the water table, or the reduction of artesian pressure, that results from pumping is in the form of an inverted cone with the well at the center, and is called the cone of depression.
The measurement of the elevation of the water level or artesian pressure surface is made by determining the water levels in wells. Two types of water levels are recognized: nonpumping levels and pumping levels.
The nonpumping level is the level at which the water stands in a well not influenced by pumping in the immediate vicinity of the well. The level may change over long periods of time, and also it may be affected by regional pumpage and changes in barometric pressure. It is of great importance in evaluating the water resources of a region.
The pumping level is the level to which the water surface lowers in wells during pumping. This level depends on rate and duration of pumping, permeability and thickness of the aquifer, and well characteristics.
The difference between the nonpumping level and the pumping level in a well is called drawdown. The drawdown is a temporary lowering of the water level due to pumpage in the well. When the pump is stopped the water level rises. This rise in the water level is called recovery. The yield of a well in gallons per minute per foot of drawdown is the specific capacity.
A continued lowering of the nonpumping level of a region is called a water level decline. Decline of water level is usually caused by excessive pumpage, diversion of recharge, or drought.

BEDROCK STRATIGRAPHY 17
TABLE 3. WELLS TO PRECAMBRIAN ROCKS NEAR THE CHICAGO REGION
GEOLOGY Unconsolidated deposits of glacial and Recent age,
which overlie the layered bedrock in most of the region (figs. 5-6, in pocket) range from a foot or less to more than 400 feet thick (fig. .12). They are mainly of Wisconsin age, the last major episode of glaciation in the Midwest, as shown in the classification of Pleistocene deposits. Illinoian and possibly older glacial deposits are preserved beneath the Wisconsin drift at some places.
CLASSIFICATION OF PLEISTOCENE DEPOSITS Recent stage Wisconsin (glacial) stage
Mankato substage Cary Tazewell Towan Farmndale
Sangamon (interglaeial) Illinoian (glacial) Yarmouth (interglacial) Kansan (glacial) Aftonian (interglaeial) Nebraskan (glacial)
The glacial deposits rest on an eroded bedrock surface of considerable relief (fig. 13), a surface that was carved primarily by streams before the Pleistocene glaciers advanced across the region (fig. 14). The configuration of the bedrock surface strongly influenced the deposition of glacial materials.
Beneath the glacial deposits the bedrock formations, consisting mainly of beds of dolomite (a limestone-like rock), shale, and sandstone, dip slightly south of east about 10 feet per mile (fig. 15). In some places the rocks are broken and displaced along faults. They are also warped into synclines and anticlines.
The bedrock formations range in age from Precambrian to Pennsylvanian, but rocks below the Silurian in the eastern three-quarters of the region are known only
from wells (figs. 16 and 17). Silurian age dolomite, which commonly yields ground water from crevices, underlies the drift in most of the region. The oldest rocks encountered directly below the drift are dolomites and sandstones of the Prairie du Chien Series (lower Ordovician) south of the Sandwich fault zone in western Kendall County. The youngest are Pennsylvanian rocks in Grundy and Will Counties.
BEDROCK STRATIGRAPHY
The stratigraphy, description and water-yielding characteristics of the rocks in the region are summarized in figure 17. Figure 18 gives the stratigraphic nomenclature used in this report, compared with that of previous reports relating to the Chicago region. Some formations have been grouped or boundaries modified to form what are considered geohydrologic units.
Precambrian Rocks
Rocks of Precambrian age form the basement below the layered sedimentary rocks. No wells are known to have been drilled to the Precambrian rocks in the region of the report, although several have been drilled in adjoining parts of Illinois and Wisconsin. These are listed in Table 3.
The Precambrian rock encountered in most wells in Illinois has been granite or related crystalline rocks. In Wisconsin, wells reaching the Precambrian have encountered granitic rocks or metamorphosed sediments, particularly quartzite. Much of the quartzite appears to stand as " ranges" or "monadnocks" above the general Precambrian level (Thwaites, 1957).
From data on Precambrian depths and Mt. Simon (Cambrian) thicknesses in adjoining Boone, DeKalb, LaSalle, and Kankakee Counties, it appears that the Precambrian surface in the Chicago region slopes eastward and ranges from about 2000 to more than 4000 feet below sea level. Depth to the Precambrian ranges from 3000 to 5000 feet.
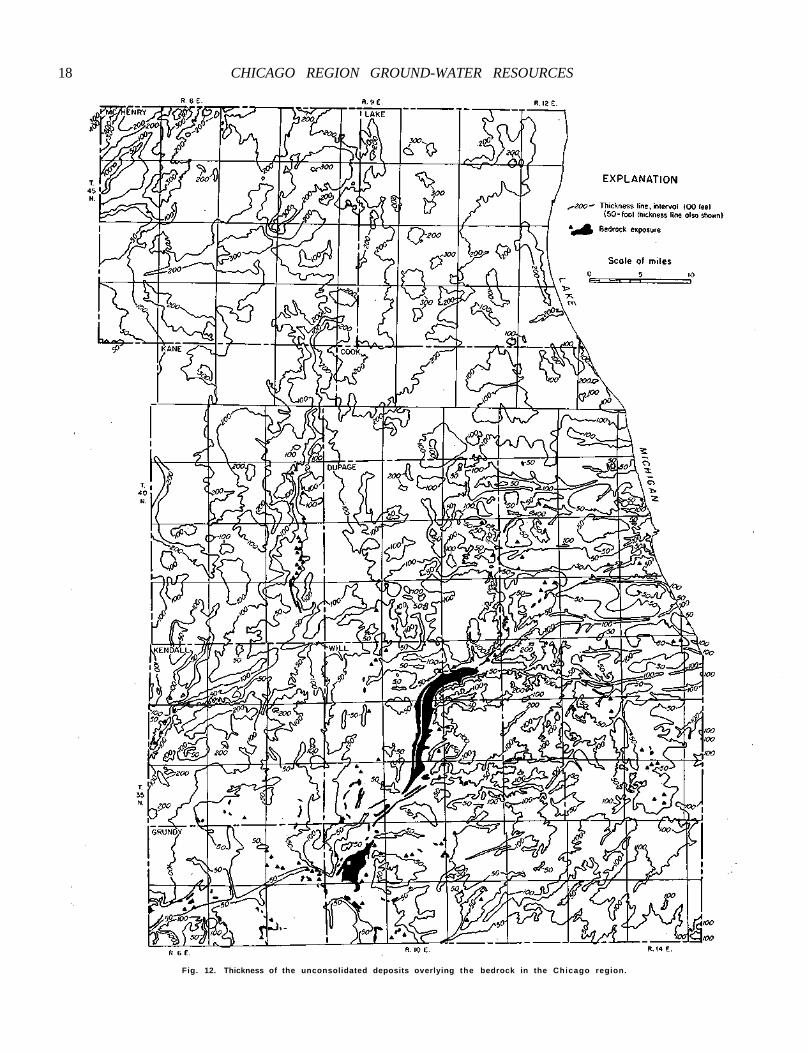
18 CHICAGO REGION GROUND-WATER RESOURCES
Fig. 12. Thickness of the unconsolidated deposits overlying the bedrock in the Chicago region.

CAMBRIAN ROCKS 19
The Precambrian rocks are not sources of ground water but form an impermeable basement complex below the sedimentary rocks.
Cambrian Rocks
The Cambrian rocks (fig. 15) in the area of this report unconformably overlie the Precambrian rocks and are known only from deep wells, none of which penetrate the complete section. These rocks range in thickness from approximatly 2000 feet near the Wisconsin border to more than 3000 feet in Will and Grundy Counties. The lower two-thirds of the Cambrian rocks are generally fine- to coarse-grained sandstones and are overlain by interbedded sandstone, dolomite, and shales, and an upper dolomite.
The Cambrian rocks are divided in this report into five units on the basis of geohydrologic characteristics. The units in ascending order are : 1) Mt. Simon Sandstone and lower sandstone of the Eau Claire Formation; 2) middle and upper members of the Eau Claire Formation; 3) Ironton-Galesville Sandstone; 4) Franconia Formation; and 5) Trempealeau Dolomite.
The Mt. Simon Sandstone and lower incoherent sandstone of the E'au Claire Formation are hydrologically connected and in this report are considered as one unit, called the Mt. Simon Aquifer. The Mt. Simon Sandstone includes the sandstone called Fond du Lac on the state geologic map (1945).
The Mt. Simon Sandstone is fine- to coarse-grained, pink, yellow, and white, incoherent to friable sandstone. In some places it is arkosic and contains red to green shale beds near the base. Granules up to 6 mm in diameter are common in the upper part of the sandstone, and red, micaceous, hematitic shale beds occur at some places in the northern counties. The lower sandstone unit of the Eau Claire Formation may contain a "sooty" zone resulting from incrustations of black pyrite on sand grains.
Wells in nearby counties (table 3) indicate that the sandstones of the Mt. Simon and Eau Claire Formations near Wisconsin are approximately 1500 feet thick and thicken southward to approximately 2000 feet. The top of the sandstones (fig. 19) dips from the northwest to the southeast at a rate of 10 feet to the mile. Because of a paucity of information, the structure of the Mt. Simon is not well known. Figure 19 is doubtless a simplification of the true structural picture.
The Eau Claire Formation overlies the Mt. Simon Sandstone throughout the region and consists of shale, sandstone, and dolomite that grade laterally from one to another within short distances. The middle and upper parts of the Eau Claire Formation are dolomitic, micaceous, fine- to medium-grained, compact sandstone with variable amounts of green to gray, sandy shale and siltstone, and sandy, brown dolomite. Cemented sandstone predominates in the middle unit. Glauconite is common throughout the formation.
The Eau Claire Formation is known only from wells that generally are grouped around the major cities, with
the result that regional control for a structure map is uneven. The formation dips from the northwest to the southeast at a rate of about 11 feet to the mile (fig. 20A). The thickness of the middle and upper Eau Claire units is variable. They range in total thickness from less than '300 feet to over 400 feet (fig. 20B).
The Ironton-Galesville Sandstone is the major bedrock aquifer in northeastern Illinois. It conformably overlies the Eau Claire Formation and grades upward into the Franconia Formation throughout northern Illinois. The unit is composed of white to light gray, fine- to coarse-grained sandstone, some of which is dolomitic. The dolomite may cement the sandstone or occur as interbedded sandy, pinkish buff lenses. The Ironton-Galesville Sandstone is nonglaueonitic except at the top and its compactness varies with the amount of dolomite present as cementing material. The following sample study log illustrates the typical lithology. The well number is based on geographic location and the system is described in the appendix.
Well No. COK 38N12E-18.8g Suburban Cook County Tuberculosis Sanitarium District,
Well No. 3, Illinois Geological Survey Sample Set No. 31261.
Thickness Depth (feet) (feet)
Cambrian System Ironton-Galesville Sandstone
Sandstone, silty, light gray, fine to coarse grains, incoherent; dolomite, sandy, light buff to pinkish buff, very fine, crystalline 31 1400 Sandstone, silty, light buff, coarse to fine grains, incoherent 10 1410 Sandstone, silty, light gray, fine to coarse grains, incoherent; dolomite, sandy, light brown to a pinkish buff, very fine, crystalline 10 1420 Sandstone, silty, light gray, fine to coarse grains, incoherent . - 40 1460 Sandstone, slightly silty, light gray, medium to fine grains, few coarse grains, incoherent 50 1510 Sandstone, white, fine grains, incoherent to friable 25 1535
Total thickness 166
All information on the Ironton-Galesville Sandstone in the Chicago region is based on well records. The sandstone dips to the southeast at a rate of about 10 feet to the mile, is generally 175 to 200 feet thick (fig. 21) but thins rapidly to the northeast.
The Franconia Formation is composed of varying amounts of sandstone, shale, and dolomite and is in many ways similar to the Eau Claire Formation. The different rocks grade rapidly from one to another laterally and are commonly interbedded. The sandstone is variegated, dolomitic, fine-grained, compact, micaceous, silty, and grades to buff, pink, greenish gray, finely crystalline, sandy dolomite. The shales are sandy, gray, green, red, micaceous, and weak (caves and slakes

ORDOVICIAN ROCKS . 21
easily). Throughout the Franconia Formation are large amounts of coarse glauconite that commonly give a greenish tint to the sandstones and shales.
The Franconia Formation underlies the entire region but is known only from wells. It is approximately 100 feet thick and dips from northwest to southeast, as do the underlying formations.
The Trempealeau Dolomite is the uppermost formation of Cambrian age. It grades upward from the underlying Franconia Formation and is commonly slightly sandy and glauconitie at the base. The Trempealeau is buff to gray, very finely crystalline, dense dolomite with minor amounts of geodic quartz and is slightly sandy at the top.
The unconformity that separates the Cambrian and Ordovician rocks occurs at the top of the Trempealeau, causing variation in its thickness. In the northern half of the region the Trempealeau is overlain by the Glen-wood-St. Peter Sandstone. The Trempealeau Dolomite has an average thickness of 150 to 200 feet in the region of this report.
Ordovician Rocks
Rocks of Ordovician age in northeastern Illinois are divided in this report into the following geohydrologic units, in ascending order: 1) Prairie du Chien Series, 2) Glenwood-St. Peter Sandstone, 3) Galena-Platteville Dolomite, and 4) Maquoketa Formation (fig. 15). These rocks are predominately carbonate with a middle sand unit (Glenwood-St. Peter) and an upper shale and dolomite unit (Maquoketa). The Ordovician rocks underlie the drift along the western margin of the area (fig. 16) and dip to the southeast. They range in thickness from approximately 500 feet in western McHenry County to more than 1050 feet in southwestern Will County.
The Prairie du Chien Series, consisting of three formations (Oneota Dolomite, New Richmond Sandstone, and Shakopee Dolomite), are considered here as one geohydrologic unit. The series is composed almost entirely of finely to coarsely crystalline, cherty (oolitic), white to light gray to pink dolomite with lenses of sandstone.
The Prairie du Chien rocks are approximately 300 feet thick in southern Will County and thin northward to a feather edge in Cook, DuPage, and Kendall Counties. North of these counties the rocks have been removed, except for isolated outliers, by pre-St. Peter erosion. Prairie du Chien rocks underlie the drift in western Kendall County southwest of the Sandwich Fault zone (fig. 16).
The Glenwood-St. Peter Sandstone underlies all the area reviewed by this report except extreme western Kendall County (fig. 22). It is white to light gray and buff, fine- to coarse-grained, friable sandstone with varying amounts of silt. Near the top, the sandstone is finegrained with dispersed coarse grains, dolomitic, with
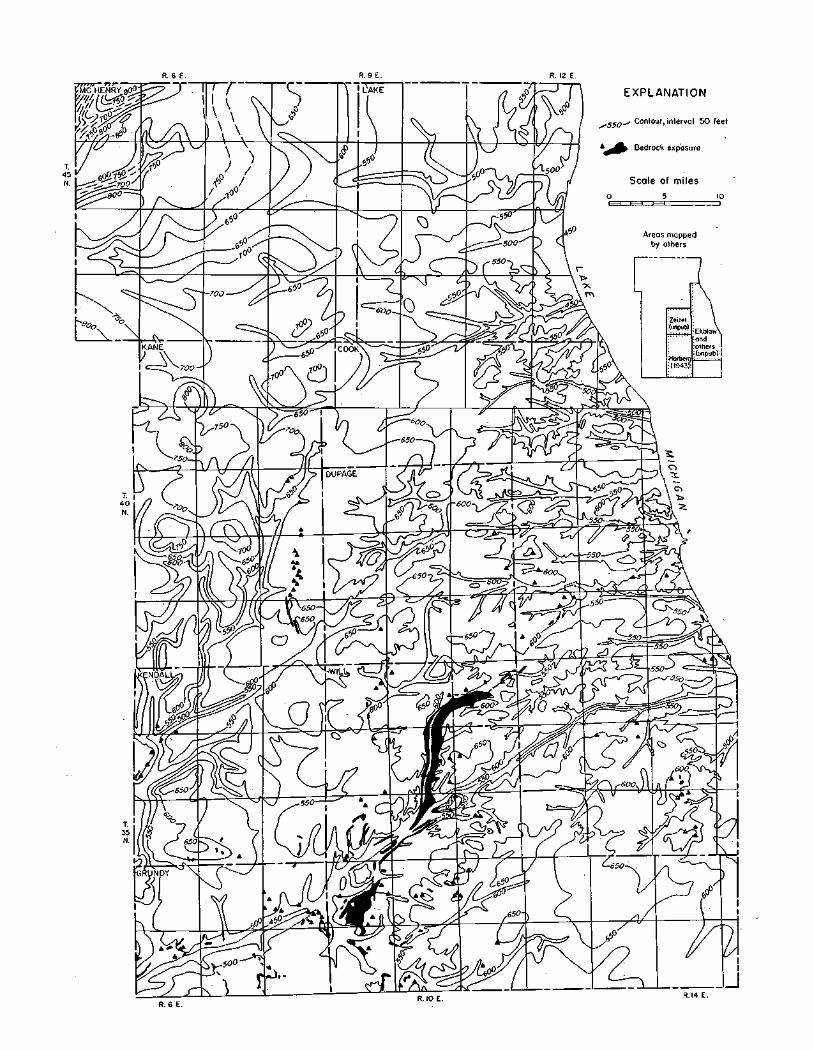
Fig. 13. Bedrock topography.
occasional lenses of sandy, green shale and buff to greenish gray, argillaceous dolomite. Most of the Glenwood-St. Peter is a fine- to medium-grained, incoherent to friable sandstone. The sandstone was deposited on a very uneven surface and its thickness varies greatly (figs. 15 and 22B). Where the sandstone is exceptionally thick the lower section may consist of fine- to coarsegrained, pink to reddish brown sandstone with varying amounts of shale, chert, and dolomite fragments. The shale is commonly red or green, sandy, and weak.
Fig. 14. Bedrock valleys.
The pattern of variation in the thickness of the sandstone (fig. 22B) suggests deposition in previously eroded ' channels and on adjacent uplands. In some channel areas the Glenwood-St. Peter Sandstone is as much as 650 feet thick. Outside the channel areas, it averages from 150 feet to 250 feet in thickness. The Glenwood-St. Peter Sandstone underlies the drift in only a small part of the area covered by this report and dips generally from the northwest to the southeast at a rate of approximately 10 feet to the mile (figs. 15 and 22A).

22 CHICAGO REGION GROUND-WATER RESOURCES
Fig. 15. Cross sections of the structure and stratigraphy of the bedrock and piezometric profiles of the Cambrian-Ordovician Aquifer in the Chicago region.

AREAL GEOLOGY 23
F!g. 16. Areal geology of the bedrock surface and major structures in the Chicago region.

[ 2 4 ] Fig. 17. Stratigraphy and water-yielding properties of the

rocks and character of the ground water in the Chicago region. [ 25 ]
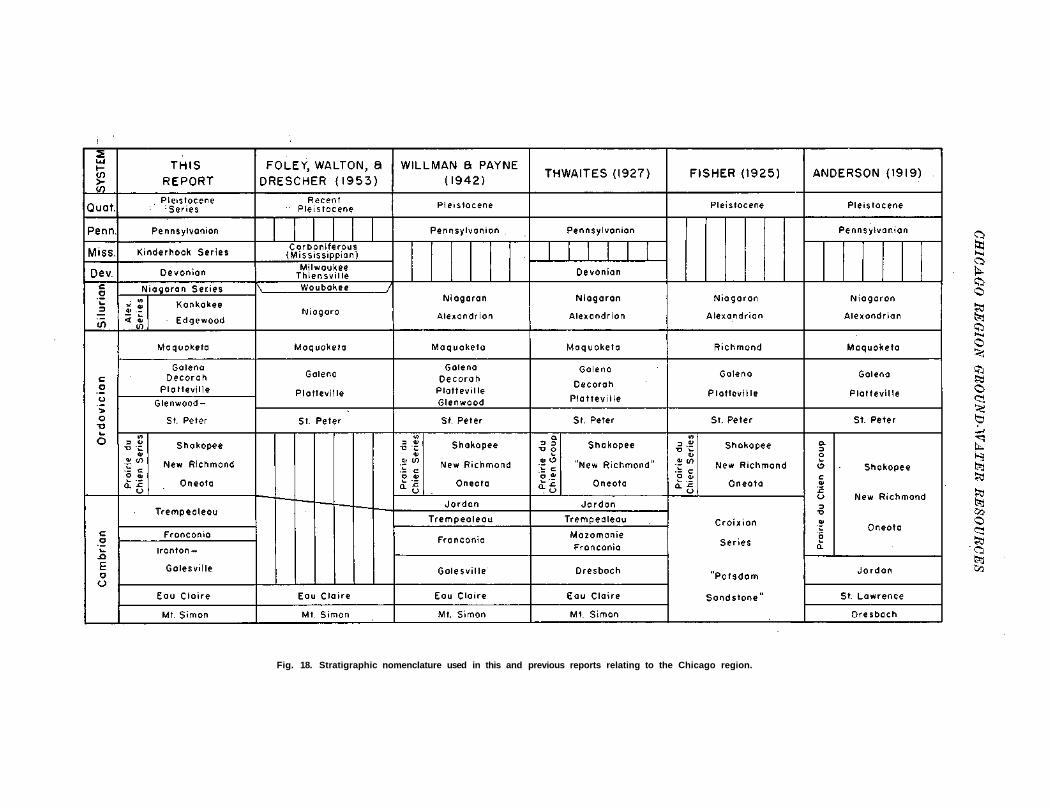
Fig. 18. Stratigraphic nomenclature used in this and previous reports relating to the Chicago region.

ORDOVICIAN BOCKS 27
Fig. 19. Elevation of the top of the Mt. Simon Aquifer.
The extreme variability in thickness and lithologic character of the Glenwood-St. Peter are exemplified by the following logs of the Automatic Electric Company Wells No. 1 and No. 2, which are 770 feet apart : Well No. COK 40N12E-31.4d Automatic Electric Company Well No. 1, Illinois Geological Survey Sample Set No. 27117
Thickness Depth Ordovician System (feet) (feet)
Glenwood-St. Peter Sandstone Sandstone, partly dolomitic, white, fine t o medium, few coarse grains . . . . 1 0 800 Sandstone, silty, white, very fine to coarse grains, incoherent . . . . . . . 100 900 Sandstone, slightly silty, white, fine t o coarse grains, incoherent . . . . 6 0 960 Sandstone, silty, white, very fine to coarse grains 10 970
Total thickness 180
Well No. COK 40N12E-31.4c Automatic Electric Company Well No. 2, Illinois Geological Survey Sample Set No. 27118
Thickness Depth Ordovician System (feet) (feet)
Glenwood-St. Peter Sandstone Sandstone, dolomitic, gray, fine and coarse grains 7 790 Sandstone, white, fine to coarse grains . 5 795 Sandstone, partly silty, white, very f i n e t o coarse grains, incoherent . . . 4 0 835 Sandstone, silty, white, very fine to fine grains, few medium grains, incoherent . 5 840 Sandstone, silty to slightly silty, white, very fine to coarse grains, incoherent . 45 885 Sandstone, partly silty, white, very fine to coarse grains, some siliceous cementing at base 135 1020 Sandstone, white, very fine to coarse grains, incoherent 55 1075 Sandstone, silty at top, pink to light red, very fine to coarse grains, incoherent . 115 1190 Sandstone, silty, very fine to coarse grains, shale, red, green, purple, weak 10 1200
Total thickness 417

Fig. 20. Elevation of the top (A) and thickness of the upper and middle units (B) of the Eau Claire Formation.
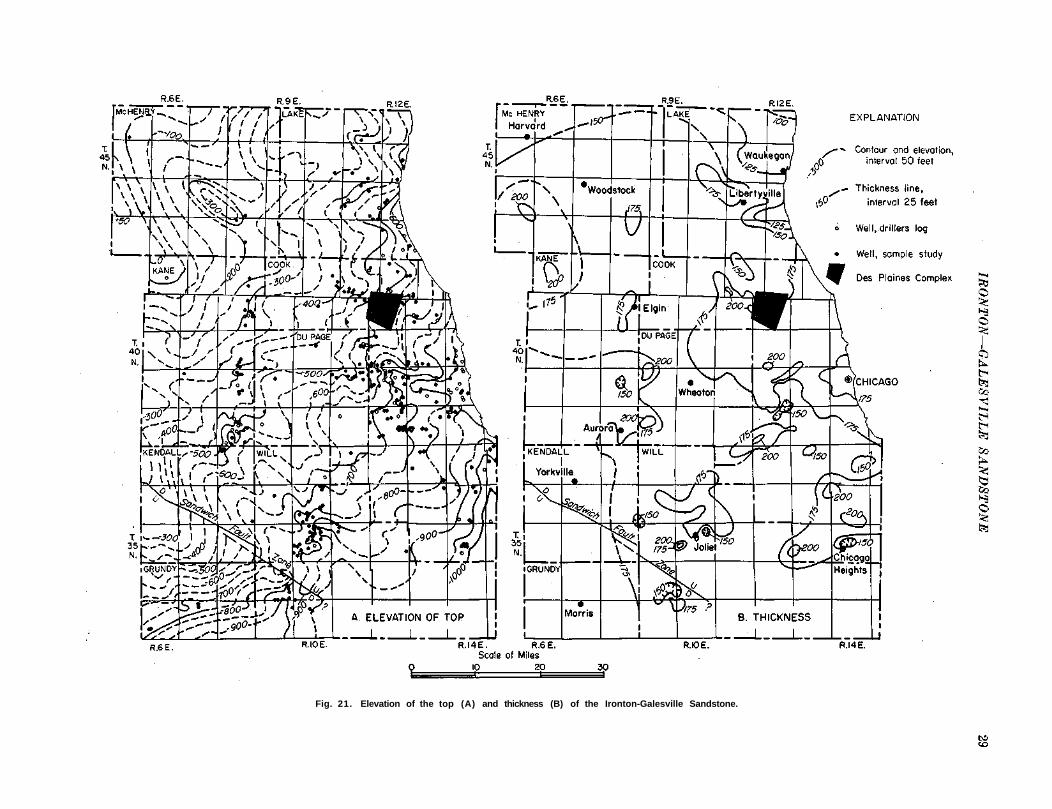
Fig. 21. Elevation of the top (A) and thickness (B) of the Ironton-Galesville Sandstone.

Fig. 22. Elevation of the top (A) and thickness (B) of the Glenwood-St. Peter Sandstone.

OBDOVICIAN BOCKS 31
Fig. 23. Thickness of the rocks between the top of the Glenwood-St. Peter Sandstone and the top of the Ironton-Galesville Sandstone.
Considerable thinning of beds between the Glenwood-St. Peter and Ironton-Galesville Sandstones occurs between Grundy and Lake Counties (fig. 23). Much of the northward thinning was produced by pre-St. Peter uplift and subsequent erosion. Following the erosion the St. Peter Sandstone was deposited on beds that range from Shakopee to Franconia in age.
The Galena-Platteville Dolomite consists of three formations that are considered one geohydrologic unit. The lowest formation is the Platteville Dolomite, which is commonly argillaceous, cherty in the upper half, buff to gray, very fine- to fine-grained, and commonly mottled. Near the base it is sandy. The Decorah Formation lies above the Platteville and consists of fine- to medium-grained, speckled (red and black) dolomite with thin
gray to red shale partings. The overlying Galena Dolomite is cherty in the lower half, fine- to medium-grained, buff to brown, and includes scattered thin shale beds. In Grundy, Kendall, DuPage, southeastern Kane, and western Will Counties the Galena-Platteville is inter-bedded dolomitic limestone and calcareous dolomite that grade into one another.
The Galena-Platteville Dolomite is uniform in thickness, ranging from approximately 300 to 350 feet (fig. 24B). It dips generally to the east at a rate of about 10 feet to the mile (fig. 24A). Galena-Platteville rocks underlie the drift in northwestern McHenry, southwestern Kane, western Kendall, and northwestern Grundy Counties (fig. 16) and are known from wells in the rest of the region.

Fig. 24. Elevation of the top (A) and thickness (B) of the Galena-Platteville Dolomite.

SILURIAN BOCKS 33
The Maquoketa Formation can be divided into three units (fig. 25) : 1) lower shale, 2) middle dolomite and/or limestone and shale, and 3) upper dolomitic shale. There is commonly difficulty in separating the middle and upper units that may grade into each other.
The lower unit is normally a brittle, dark brown, occasionally gray or grayish brown, dolomitic shale grading' locally to dark brown, argillaceous dolomite. This unit is thicker in Cook and Will Counties where it exceeds 100 feet (fig. 25C). It thins to the north and west to less than 50 feet. Local variations in the thickness of the lower unit may be a result of its grading into the middle unit.
The middle unit is dominantly brown to gray, fine- to coarse-grained, fossiliferous, argillaceous, speckled dolomite and limestone. It is commonly interbedded with a fossiliferous brownish gray to gray, dolomitic shale. This unit is thicker to the west where it is more than 100 feet locally, and thins to the east (fig. 25B).
The upper unit of the Maquoketa Formation is a greenish gray, weak, silty, dolomitic shale that grades into very argillaceous, greenish gray to gray dolomite. This dolomite is distinguishable with difficulty from the dolomite of the middle unit or from the overlying dolomite of Silurian age. It ranges in thickness from less than 50 feet in the west to more than 100 feet in parts of Cook and Will Counties (fig. 25A). The three divisions of the Maquoketa Formation are shown in the following log:
Well No. COK 35N14E-21.3h Calumet Steel Division, Borg Warner Corporation, Well No. 4, Illinois Geological Survey Sample Set No. 21216
Thickness Depth (feet) (feet)
Ordovician System Maquoketa Formation
Shale, dolomitic, greenish gray, weak; interbedded dolomite, pale yellowish brown to green, fine, silty 80 525 Dolomite, silty, green, light to dark gray, fine to coarse, mottled; few shale streaks in lower half, sandy, olive, weak . . 40 565 Shale, slightly dolomitic, grayish brown to brown, weak to brittle; interbedded thin dolomite, olive, finely crystalline 114, 679
Total thickness . . . . 234
The Maquoketa Formation underlies the drift along most of the western margin of the region and is overlain by the dolomite of Silurian age to the east. It attains a thickness of as much as 250 feet and thins to the west (fig. 26B). The formation dips to the east at a rate of about 10 feet to the mile (fig. 26A).
Silurian Rocks
Rocks of Silurian age form the bedrock surface
throughout the eastern three-quarters of the region (fig. 16). They are mainly dolomites (popularly called limestones) and are silty at the base. The Silurian rocks are divided into the Alexandrian Series below and the Niagaran Series above (fig. 17). The Alexandrian Series consists of two formations: Edgewood below and Kankakee above.
The Edgewood Formation is an argillaceous to finely sandy, light gray to gray brown, finely crystalline dolomite. At some places it is quite similar to the dolomite of the Maquoketa Formation. The Kankakee Formation is a light gray to buff, cherty, finely crystalline dolomite.
The Niagaran Series is white to light gray, finely to medium crystalline, compact dolomite with varying amounts of silt. White to light gray chert generally occurs in the upper part. At the base the dolomite is commonly green, pink, or red and is slightly silty.
The Silurian rocks are buried beneath glacial deposits except in small areas. They have been deeply eroded during pre-Pleistocene and Pleistocene time, producing variations in thickness (fig. 27). They range from a feather edge to more than 450 feet thick, thickening to the southeast.
Devonian and Mississippian Rocks
Rocks of Devonian and Mississippian age occur locally on top of Silurian rocks in Will and Cook Counties. They are covered by glacial drift and known only from well records.
Rocks of possible Devonian age (fig. 17) are reported in a few drillers' logs. The rocks are generally blue to dark colored, " l imy" shale.
The Mississippian rocks (fig. 17) are known only from the area of the Des Plaines Complex (fig. 16), where they are dolomitic, gray to brown, weak shales interbedded with silty, slightly cherty, brown to gray, finely crystalline dolomite. They are reported from only a few wells and range in thickness up to 375 feet.
Pennsylvanian Rocks
Rocks of Pennsylvanian age (fig. 17) are the youngest bedrock strata in the region. They are exposed or underlie the glacial drift only in Grundy and southwestern Will Counties (fig. 16) and overlie unconformably the older rocks of the region.
The Pennsylvanian rocks are composed of gray to black, partly calcareous, pyritic, weak to brittle shale; argillaceous, brownish gray, calcareous, pyritic sandstone; gray, argillaceous limestone; and coal. They range in thickness from less than a foot to more than 190 feet in the area of study.

34 CHICAGO REGION GROUND-WATER RESOURCES
Fig. 25. Lithologic character and thickness of the upper ( A ) , middle ( B ) , and lower ( C ) units of the Maquoketa Formation.

Fig. 26. Elevation of the top (A) and thickness (B) of the Maquoketa Formation. Thickness is not shown where the Maquoketa crops out or directly underlies the glacial drift.
36 CHICAGO REGION GROUND-WATER RESOURCES
BEDROCK STRUCTURE
Structure Contour Maps
Structure contours are lines connecting points of equal elevation of a given rock formation. Depth to the formation can be estimated for any location by subtracting the elevation on the structure contour map from the surface elevation at that point. Structure contour maps (figs. 19, 20A, 21A, 22A, 24A, and 26A) show elevations of the tops of the following units: Mt. Simon Aquifer, Eau Claire, Ironton-Galesville, Glen-wood-St. Peter, Galena-Platteville, and Maquoketa. Because of the uneven spacing of well control points for the Ironton-Galesville and lower formations, many elevations for the structure maps in figures 19, 20A, and 21A were estimated. Estimates were made of Ironton-Galesville elevations by subtracting from elevations of the Glenwood-St. Peter Sandstone the thickness of the interval from the top of the Glenwood-St. Peter to the top of the Ironton-Galesville (fig. 23). Estimates made in a similar manner were used in constructing the Eau Claire and the Mt. Simon Aquifer structure contour maps.
Regional Structure
Northeastern Illinois is on a structural high called the Kankakee Arch between two major structural basins, the Michigan Basin to the northeast and the Illinois Basin to the south. In the Chicago region the beds have a gentle regional dip to the east and south of about 10 feet to the mile (fig. 15).
Folds
A series of folds trending east-west and pitching eastward with the regional dip are well defined locally by all stratigraphic horizons and appear to be at least post-Silurian in age. The axes of these folds are shown in figure 16.
Faults
The Sandwich Fault zone (figs. 15 and 16) extends eastward from Sandwich, DeKalb County, and into Will County. Faulting is complex. There are at least two major faults with possible minor faults paralleling or at angles to the general trend. In Kendall County a fault in this zone strikes northwest-southeast with the south side upthrown. The throw is more than 50 feet in western Kendall County, but it decreases to the southeast. Farther east in Will County a fault in the same zone strikes northwest-southeast with the north side up-thrown and has a throw of more than 125 feet which decreases to the west. The eastern extent of the fault zone is not known due to lack of information in southeastern Will County:
Faulting in the Des Plaines area, Cook County, is complex and has no apparent relationship to regional structure. The 25-square-mile area is bounded and cut by a series of faults. Within the complex, rocks as old as Prairie du Chien occur just below the drift and rocks
as young as Mississippian have been preserved. Because of the complexity and lack of data, the Des Plaines Complex is not considered in detail in this report.
HISTORY OF BEDROCK
The bedded sedimentary rocks beneath the glacial drift record the advance and retreat of shallow seas across northeastern Illinois. Sandstones and shales were formed from sands and muds washed into the sea, whereas most dolomites and limestones were formed by deposition of carbonates in clear, shallow seas away from the influx of clastic sediments. Slow general subsidence of the whole area permitted the accumulation of more than 3000 feet of sedimentary rocks, though from time to time episodes of uplift and erosion produced breaks in the sedimentary record. One of the more prominent episodes of uplift occurred after the deposition of the Prairie du Chien rocks, when erosion beveled rocks ranging in age from Prairie du Chien to Fran-conia and cut deep channels that were later filled by St. Peter Sandstone.
Final emergence from beneath the sea occurred during Pennsylvanian time when the region lay close to sea level and was successively the site of shallow marine basins and terrestrial coal swamps.
Local deformations of the sedimentary rocks probably occurred during the latter part of the Paleozoic Era. The widespread absence of Paleozoic rocks younger than Silurian in northeastern Illinois makes precise dating of such structures as the Sandwich Fault zone, Des Plaines Complex, and local anticlines and synclines highly speculative.
BEDROCK TOPOGRAPHY
The contouring of the bedrock topography (fig. 13) and the thickness of the unconsolidated deposits (fig. 12) is made possible by the hundreds of well records that are available for the region. Most features of the bedrock topography shown in figure 13 have been previously delineated, named, and discussed by Horberg (1950) in his study of the bedrock topography of the state. Bretz (1955, p. 51-57) also described the bedrock topography of the Chicago region.
The depth to bedrock at any location can be estimated by subtracting the bedrock surface elevation (fig. 13) from the land surface elevation at that point.
The surface of the bedrock topography slopes with the bedding, descending gradually toward the east. This is shown by the cross sections of the glacial drift and bedrock (figs. 6 and 15) and the various bedrock structure maps. Along the western townships the highest bedrock surfaces rise from slightly more than 650 feet elevation in Kendall County to more than 850 feet in McHenry County, whereas much of the bedrock surface in the eastern half of the region is well below the level of present Lake Michigan (580 feet).
Fig. 27. Thickness of the Silurian rocks.


38 CHICAGO REGION GROUND-WATER RESOURCES
The bedrock surface is scored by a number of stream valleys and their tributaries whose bottom slopes are either directed eastward toward present Lake Michigan, southwestward toward the Illinois-Mississippi drainage system, or southward toward the Mahomet-Mississippi drainage system. Figure 14 shows the axes of the main valleys and the major drainage divide prior to glacia-tion of the region. The divide, passing from southeastern Will County to northwestern McHenry County, is well west of the present divide developed on the glaciated surface (fig. 4).
Most of the bedrock valleys that slope eastward toward Lake Michigan head near the crest of the Silurian highlands. They are commonly cut less than 100 feet below the adjoining bedrock uplands and pass below the present shore of Lake Michigan at elevations of about 450 feet above sea level.
The valleys west of the divide belong to the Illinois-Newark network or to the Troy-Rock network. Troy Valley, which passes through the northwest township of the region, is cut more than 250 feet below the adjacent upland and is overlain by the thickest glacial deposits in the region (fig. 12). A tributary of the Troy Valley underlies the next township south.
Most of the bedrock valleys of Kendall and southern Kane Counties belong to the Newark system. The main valley heads in the Silurian escarpment in northeastern Kane County and crosses the Maquoketa, Galena-Platte-ville, Glenwood-St. Peter, and Pennsylvanian rocks. The valley has an average width of a mile and is 100 to 150 feet deep. Before glaciation the Newark drainage continued southward through Grund.y and Livingston Counties toward Mahomet Valley, but it was diverted westward, perhaps by Kansan or Nebraskan glaciers. The valleys in western and southern Will, southeastern Kendal], and northeastern Grundy Counties had a similar history.
Two glacial spillways, the Glacial Lake Chicago Outlet and the buried Hadley Valley, breach the bedrock divide in northeastern Will County. Hadley Valley is cut 100 feet or more below the nearby Chicago Outlet (BB, fig. 6, in pocket). The bedrock surface map (fig. 13) suggests that prior to glaciation of the region an eastward flowing stream occupied Hadley Valley east of the divide. A westward flowing tributary of Newark Valley may have headed in the divide west of Hadley Valley. Prior to Illinoian time, glacial melt-waters cut a deep trench through the drainage divide. The Chicago Outlet was cut after Hadley Valley was buried.
UNCONSOLIDATED DEPOSITS
The unconsolidated material above the bedrock consists of glacial drift and Recent deposits. The drift is differentiated into that deposited directly from the ice (till) and that modified by the associated melt-water into glaeiofluvial (glacial river) and glaciolacustrine
(glacial lake) deposits. Recent deposits include those made by wind, running water, standing water, waves, and organisms under present-day conditions.
Glacial Drift
Till is ice-laid debris, a mixture of fragments of all sizes with rarely any stratification. It occurs in the form of marginal morainic ridges and intervening undu-latory plains. The marginal moraines record times when the ice front temporarily maintained a fixed position and the intervening plains record times when the ice front melted back.
In composition the tills of the region range from dense clayey silt with few pebbles to gravelly sand containing abundant stratified material. The till of the Valparaiso, Tinley, and Lake Border moraines in Lake, Cook, DuPage, and Will Counties (fig. 5, in pocket) has high clay content and scarcity of pebbles and coarser fragments (Krumbein, 1933, p. 385; Bretz, 1955, p. 43). Clayey till also occurs in Will, Grundy, and Kendall Counties in the Manhattan, Rockdale, Minooka, and Marseilles moraines. The West Chicago moraine of the Valparaiso system, from West Chicago and Elgin northwestward into McHenry County, is composed of sandy, gravelly, bouldery till associated with water-laid deposits.
The older moraines west of the Minooka and West Chicago in McHenry and Kane Counties (fig. 5) are highly variable. Some of them are principally clayey till; others are less clayey and are associated with much sand and gravel, and they form rough, irregular topography. Where the Lemont Till east of Joliet is seen below the Valparaiso drift—as along Sag Channel and the Des Plaines Valley—it is silty rather than clayey, and contains abundant stratified material.
Glaciofluvial deposits were laid down by meltwater that was discharged along the front of the ice and through crevasses and channels extending back into the ice. The meltwater contained rock debris ranging from fine clay and rock flour to gravel, and, in response to changing volume and velocity of flow; sorted the particles as it deposited them downstream. Sand and gravel generally were deposited close to the ice front or along channelways that carried a large volume of meltwater. The finer particles were carried farther, often not settling out until they reached the quiet water of a pond or lake.
The types and character of glaciofluvial deposits are summarized in table 4.
Surficial glaeiofluvial deposits are most common in McHenry, Kane, Kendall, Grundy, and Will Counties. They consist mainly of very coarse gravel and sand in the form of outwash plains, valley trains, and kames in McHenry and Kane Counties and sandy valley trains along the Fox River in Kendall County, along the Illinois River in Grundy County and along the Des Plaines and Kankakee Rivers in Will County (fig. 5).

GLACIAL DRIFT AND RECENT DEPOSITS 39
TABLE 4. CHARACTERISTICS OF GLACIOFLUVIAL DEPOSITS
Glaciolacustrine deposits consist of well sorted sand and gravel accumulated along beaches by wave action, inclined sand and gravel beds laid down in deltas, and fine sediment that settled in quiet waters off shore. They are characteristically found on the Chicago lake plain, though not restricted to it in the area of the report. The most extensive and conspicuous deposits of the lake plain are the beach ridges and spits (fig. 5). The prominence of some of the beach ridges was increased during glacial times by the deposition of wind-blown sand in the form of dunes.
Recent Deposits
Much of the deposition of sediments taking place today in the region involves the reworking or redistribution of glacial deposits. Silts, sands, and gravels are shifted about by scour and fill in floodplains. Coarse to fine sediments are deposited as alluvial fans where tributary streams of relatively high gradients enter the floodplain of a larger stream. Silts are carried by slope wash to lower ground and eventually into ponds, lakes, swamps, and streams. Along Lake Michigan waves and shore currents are forming beach deposits. The wind has formed dunes along the lake in Recent time, particularly east of the Chicago region in Indiana.
Organic matter is an additional component of Recent deposition. Peat, marl, and driftwood are common in present-day floodplains. Many swamps in the poorly drained morainal areas and on the lake plain fill with water-loving vegetation and other sediments, forming peat and muck.
Thickness
The map of the thickness of the unconsolidated deposits (fig. 12) shows that the drift is thinner (commonly less than 50 feet thick) in the low area between the Marseilles and Valparaiso moraines (fig. 5) in Grundy, southeastern Kendall, and southwestern Will Counties, and thicker (commonly more than 200 feet thick) in the morainal areas of McHenry, Lake, and Kane Counties.
The lines that show thickness of the drift more or less parallel bedrock surface contours in areas of thin
drift, but in areas of thick drift they may correspond with either bedrock or surface features. The alignment of thickness lines in the relatively flat Chicago lake plain reflects mainly bedrock valleys and intervening divides at right angles to Lake Michigan. Some of the thickness lines in DuPage, Kendall, Kane, and McHenry Counties outline the higher moraines. More often the thickness lines have irregular patterns because the topographies of the surface and bedrock do not conform and have considerable relief.
History
Between the time the rocks of Pennsylvanian age were formed and the glaciers advanced from centers of snow accumulation in Canada, hundreds of feet of rock were eroded. Prior to the advance of glaciers, the topography of the bedrock was similar to that shown in figure 13. The master stream in the region probably occupied a valley approximately along the axis of Lake Michigan and had as tributaries streams that headed in western McHenry and DuPage Counties.
Pre-Illinoian Pleistocene history is not well recorded in the Chicago region. It is summarized by Bretz (1955, p. 99-132).
The. Illinoian ice covered the region and deposited drift that has been identified in wells in McHenry and Kane Counties (Horberg, 1953, p. 26). The Lemont drift, which is exposed east of Joliet and which nearly fills Hadley Valley, may be Illinoian in age (Horberg and Potter, 1955, p. 18). Glacial scour doubtless had created a lake basin in the pre-existing valley along the Lake Michigan axis, and as the Illinoian ice retreated a glacial lake was formed which discharged westward across the area of the Lemont drift.
The Tazewell glacier of Wisconsin age advanced across the region and south and west beyond it to as far as Mattoon and Peoria, and across the Mississippi River near Fulton, Illinois. The Bloomington, Marengo, Elburn, Gilberts, Farm Ridge; and Marseilles moraines were built during successive partial retreats and re-advances of the Tazewell glacier.
A great volume of meltwater was discharged by the ice retreating from the Marseilles moraine in the upper part of the Fox River Valley north of Elgin, resulting in the deposition of thick, coarse outwash and the breaching of the Bloomington morainal dam at Peoria.
Following the withdrawal of the ice at the end of Tazewell time, the Fox River and its tributaries cut deep valleys. A new valley was cut across the bedrock divide north of buried Hadley Valley.
The Cary glacier advanced out of the Lake Michigan basin with change in alignment of the ice front to build the Minooka, Manhattan, and Valparaiso moraines. North of Elgin, the Valparaiso ice incorporated abundant coarse material in overriding coarse Marseilles outwash.
Enormous quantities of meltwater were discharged down the Kankakee and Illinois Valleys during the Val-

40 CHICAGO REGION GROUND-WATER RESOURCES
paraiso glaciation. The meltwater came from glacial lobes in northeastern Illinois, south-central Michigan, and northern Indiana. Outwash was deposited along the Fox River Valley. In the Kankakee Valley the water constituted a flood with currents that transported large slabs of limestone and built bars of rubble. The volume of water was so great that it could not all escape down the Illinois Valley and therefore rose to form a series of lakes between the younger Tazewell moraines (figs. 5 and 6B-B). In the lakes, channels were eroded and gravels were deposited by strong currents, silt and sand settled in backwaters, and higher, submerged areas were smoothed by cutting and filling.
After the ice retreated from the position of the Valparaiso moraines, it readvanced and built the slender Tinley moraine as a continuous ridge parallel to the lake basin. With the melting back of the ice from the Tinley moraine, Glacial Lake Chicago formed between the ice front and the moraine. Water that was ponded behind the moraine found an outlet along the already existing Sag and Des Plaines Valleys.
The three beach levels—Glenwood, Calumet, and Tol-eston (fig. 6B-B')—correspond to stillstands of the lake. During the Glenwood and Calumet stages stillstands were produced by residual concentrations of boulders from the till (boulder pavements) in the outlet channel; during the Toleston stage further downcutting was checked when the outlet floor had been cut to bedrock. Deepenings of the outlet occurred during times of increased discharge, when outlets to the east were blocked and drainage from glacial lakes in Ontario, southeastern Michigan, and western Ohio was added to that from Lake Chicago.
During the Glenwood stage the ice advanced out of the Lake Michigan basin north of Winnetka to build the four moraines of the Lake Border system.
After retreat of the ice beyond the straits of Mackinac, an eastward outlet into the Atlantic Ocean was established. The lake lowered to the present level of Lake Michigan, and the present Chicago lake plain emerged.
RELATIONSHIP OF GEOLOGY TO GROUND WATER
GENERAL RELATIONS
The source, occurrence, movement, quality, and availability of ground water are controlled by the nature, distribution, and structure of the various earth materials below the land surface. Of prime importance is the occurrence of permeable formations that serve as aquifers, storing ground water, channelling the movement, and acting as avenues of recharge.
The nature of the permeable formations has hydro-logic significance because it affects water quality, rate of yield, and design of wells. Relatively impermeable beds such as shales act as barriers to ground-water movement or maintain pressure differences between
aquifers and sometimes require special handling during drilling or well construction. Geologic structure commonly influences the direction of ground-water movement, artesian pressures, water quality and temperature, and areas of recharge. A study of the geologic history, particularly episodes of uplift, weathering, and erosion, sometimes explains the occurrence of zones of porosity, permeability, or cementation.
CAMBRIAN-ORDOVICIAN AND MT. SIMON AQUIFERS
The Mt. Simon Aquifer, previously defined, is the lowest known hydrologic system of the area. It is separated from the overlying system by the middle and upper parts of the Eau Claire Formation.
Above the Eau Claire occurs a sequence of rocks hy-drologically interconnected and referred to in this report as the Cambrian-Ordovician Aquifer. It consists in upward order of the Ironton-Galesville Sandstone, Franconia Formation, Trempealeau Dolomite, Prairie du Chien Series, Glenwood-St. Peter Sandstone, and Galena-Platteville Dolomite. This interconnected hydro-logical system is, in most of the area, separated from the overlying aquifers by the Maquoketa Formation. In general, the principal water-yielding units are the sandstones of the Ironton-Galesville and Glenwood-St. Peter.
Many of the deep bedrock wells in this region are not limited to a single aquifer but are open to the Mt. Simon Aquifer as well as the Cambrian-Ordovician Aquifer, and even to the Silurian age dolomite above the Maquoketa Formation.
The various units, as they are encountered in drilling wells, are described below.
Galena-Platteville Dolomite
The Galena-Platteville Dolomite yields small quantities of water from joints, fissures, and solution cavities. Yields are greater in the western part of the region where the dolomite directly underlies the drift and is weathered. Finely disseminated pyrite in the rock is responsible for dark, sulfurous water in many wells. Occasionally oil shows are encountered. Because the dolomite is firm, homogeneous rock of uniform thickness (fig. 24B) it is easily recognized during drilling and is a favorable unit in which to seat casing.
Glenwood-St. Peter Sandstone
The variability of the Glenwood-St. Peter Sandstone in texture, cementation, and thickness creates anomalies in water-yielding capacity and problems in drilling and well construction. The upper part generally is not productive because of the shaly or dolomitic character of the sandstone. The basal part, composed of shale and conglomerate, sometimes called by drillers the "St . Peter caving zone, "a l so is unproductive. Thus groundwater production from the Glenwood-St. Peter generally is restricted to 60 to 80 feet of sandstone that occurs 35 to 200 feet below the top of the formation.

GROUND-WATER GEOLOGY 41
The occurrence of unusual thicknesses of Glenwood-St. Peter in channel areas (fig. 22B) may result in greater yields where the sand is clean. Often, however, the thickening in the channel areas is a result of thickening of the lower shale or rubble zone, which does not readily yield water. Water in the lower part of the Glenwood-St. Peter in the channel areas may be slightly more highly mineralized because it circulates poorly in the less permeable part of the sandstone.
The Glenwood-St. Peter presents some difficulties in drilling and well construction because the friable sands tend to slough off and the lower shale and rubble zone tends to cave. It is common practice to set a liner through the lower part of the formation.
Prairie du Chien Series
The Shakopee and Oneota Dolomites are not well creviced and yield little ground water. The New Richmond Sandstone no doubt furnishes some ground water in deep rock wells, but its variation in dolomite content and thickness makes it unpredictable as a groundwater source.
Trempealeau Dolomite
The presence of water-yielding crevices in the upper part of the Trempealeau Dolomite in some wells is reported by drilling contractors and is indicated in a few caliper logs of deep wells. Crevicing may be related' to the unconformity between the Trempealeau and Prairie du Chien Series or, in the northern half of the region, between the Trempealeau and Glenwood-St. Peter Sandstone. Filling of the fissure systems has occurred locally. Where unusually high specific capacities of deep rock wells are obtained it is likely that cavities in the Trempealeau provide substantial quantities of water.
Franconia Formation
Although the shales and dolomites of the Franconia do not readily yield water, the sandy portion of the formation is permeable and probably contributes some water in deep rock wells where it is not cased off by liners.
Ironton-Galesville Sandstone
The Ironton-Galesville Sandstone is the most consistently permeable and productive aquifer in northeastern Illinois. Although the lower 20 to 85 feet of the sandstone is commonly the least cemented and most permeable part of the interval, clean friable zones also are encountered in its upper dolomitic part in some wells. Because the most favorable water-producing zone occurs in the lower part of the unit, it is advisable to penetrate the full thickness of the Ironton-Galesville if maximum well yield is desired. In fact, drilling to a short distance below the base of the Ironton-Galesville is advisable so that caving in the well will not shut off the lower productive section.
The poor cementation of the sandstone is responsible for some of the caving and sand-pumping problems in
deep wells. Study of cuttings and caliper logging can sometimes lead to identification of cemented and weak zones and thereby guide shooting and rehabilitation of wells.
Eau Claire Formation
The middle and upper parts of the Eau Claire Formation in the Chicago region are primarily shale, dolomitic sandstone, and dolomite and are, therefore, not a productive part of the deep aquifers. However, the unit is of hydrologic importance in that it is a barrier between the Ironton-Galesville Sandstone and Mt. Simon Aquifer which contain water of different quality and head. The shales of the Eau Claire Formation protect the Ironton-Galesville from the intrusion of highly mineralized water from the Mt. Simon Aquifer. The effectiveness of this barrier under various pressures needs further study.
M t . Simon Aquifer
The coarse, clean portions of the Mt. Simon Aquifer are capable of yielding moderate quantities of water. However, the erratic distribution of the clean beds, the occurrence of micaceous shales and siltstones, and the presence of warmer, more highly mineralized water make the Mt. Simon a less consistently favorable aquifer than the Ironton-Galesville. Wells that withdraw water from the Mt. Simon Aquifer at an elevation of 1300 feet or more below sea level commonly yield water too salty for ordinary use.
MAQUOKETA FORMATION
The Maquoketa Formation is at least a partial barrier between the shallow ground water of the drift and Silurian age dolomite above and the deeper ground water of the Cambrian-Ordovician Aquifer. The lower dense shale unit of the Maquoketa Formation is the most persistent and doubtless the most impermeable unit (fig. 25C). The effectiveness of the Maquoketa as a barrier is indicated by the reduction in crevicing and water-yielding capacity of the Galena-Platteville Dolomite where the Maquoketa overlies it (fig. 16). This is also suggested by studies by Foley and Smith (1954, p. 228) of recharge of the deep sandstone aquifer.
Dolomite beds in the middle unit of the formation yield small quantities of ground water. These beds are best developed in Kane County.
The Maquoketa is subject to swelling and caving and is customarily cased in deep rock wells.
SHALLOW DOLOMITE AQUIFERS
Ground water in the shallow dolomite occurs in joints, fissures, and solution cavities,. so yields at any given location generally are unpredictable. The reservoir
-capacity of the rock as a rule is controlled more by solution openings below the weathered bedrock surface than by stratigraphic position. The development of. solution
42 CHICAGO REGION GROUND-WATER RESOURCES
openings has been controlled by fracture and bedding planes near the surface and by regional dips.
About 75 percent of the dolomite wells in a selected 17-township area in southern Cook and Will Counties are completed within the upper 75 feet of the rock (fig. 41).
Because the openings occur mainly in the upper part of the rock it is likely that there is good connection with the overlying glacial drift.
In the circulation of ground water in other limestone terrains, concentration of flow and greater velocities near the points of discharge along drainage lines result in the enlargement of channels. If in the northeast region of Illinois the bedrock valleys were lines of discharge during the development of solution openings, they should be bordered by areas of high permeability and consequently high productivity. Available production figures are inadequate to test this hypothesis.
There is, however, an additional reason why higher yields may be anticipated in the areas underlying and adjoining bedrock valleys. As openings in the dolomite are connected with porous zones in the drift, it follows that where creviced dolomite is overlain by water-bearing sand and gravel deposits there will be more immediate recharge of the dolomite aquifer than in areas where glacial till rests on the bedrock.
Production records and drillers reports indicate that in some generally definable areas in the region crevicing is extensive and high yields can be obtained, and in other areas the dolomite is generally dense and " t ight ." DuPage County and eastward to the Des Plaines River south of LaGrange is one such favorable area, whereas a 2- to 8-mile belt along Lake Michigan is generally unfavorable.
Among the factors that may be responsible for differences in ground water productivity of the dolomite in various areas in northeastern Illinois are:
1. Differences in development of solution zones with respect to bedrock topography.
2. Differences in depth of ground water circulation and therefore depth of solution. For example, shallow impermeable shales in a given limestone area may limit solutional downcutting and promote extensive enlargement channels in the soluble rock above.
3. Differences in permeability of the overlying drift. 4. Differences in solubility of the various dolomite
units.
GLACIAL, DRIFT AQUIFERS
Ground water in the drift is obtained mainly from sands and gravels that occur as surficial deposits or, more commonly, as deposits underlying or interbedded with glacial till. Because of their irregularity of occurrence, glacial drift aquifers are more difficult to locate than bedrock aquifers. The difficulties are compensated for in part by lower costs of drilling and pumping, often
by water that is cooler or of better quality, and at some places by greater yields.
Surficial sand and gravel deposits are fairly widespread in Kane, McHenry, and western Lake Counties. Esker and kame deposits, restricted in areal extent and standing above the surrounding countryside where they are often excavated for gravel operations, are of limited importance as sources of ground water. In contrast, deposits of outwash plains and valley trains, being more extensive and occurring in lowlands where they are likely to be below the water table, are of considerable importance.
Large supplies of ground water are often encountered in sand and gravel at the base of the drift, directly above bedrock. The chances of penetrating continuous waterbearing beds of considerable thickness are better within . the bedrock valleys than in bedrock uplands because 1) the drift is thicker above bedrock valleys, increasing the probability of encountering sand and gravel, and 2) meltwaters were concentrated in valleys during glacial stages, locally resulting in the deposition of sorted deposits. The bedrock valleys that slope eastward toward Lake Michigan and up which the glaciers advanced, are generally filled with till or with fine sediments of slack water origin.
Buried sand and gravel deposits commonly occur near the outer margin of end moraines. Here the waterbearing deposits are often found at the boundary between till sheets and may be continuous over wide areas. Drift aquifers in areas between the moraines are commonly lenticular and discontinuous.
Favorable Localities
Favorable areas for sand and gravel aquifers, as interpreted from surficial geology, well records, and earth-resistivity surveys, include the following:
Surficial outwash plains and valley trains (figs. 2 and 5)
1. Lowland of Rush Creek and Piscasaw Creek Valleys west of Harvard.
2. Valleys of Kishwaukee River and North and South Branches west of Woodstock and Crystal Lake.
3. Nippersink Creek lowland west and south of Hebron.
4. Coon Creek lowland northwest of Hampshire. 5. West Chicago outwash between Naperville and
Elgin and along the Fox River Valley south of Elgin.
6. Des Plaines River Valley north of River Forest. 7. DuPage River Valley south of Wheaton and
Naperville. 8. Des Plaines and DuPage River Valleys in vicinity
of Joliet and Plainfield.

PUMPAGE 43
Glacial fill in buried bedrock valleys (figs. 6 and 17) 1. Troy Valley. 2. Newark Valley. 3. Hadley Valley.
Buried sand and gravel deposits of various origins (figs. 2, 5, and 6)
1. Lemont drift of Joliet, Orland Park, Downers Grove, and Worth area.
2. Marseilles sand and gravel along the Fox River north of Elgin.
STRUCTURE
Geologic structure exercises a strong control over the circulation of ground water in the sandstone aquifers of northeastern Illinois. Water moves eastward in the same direction as the regional dip. Modifications of the regional pattern of movement are brought about by: 1) pumpage, 2) local structures, and 3) lithologic variations in the aquifers. No evidence indicates that local folds that have axes parallel to regional dip modify the general movement of ground water down-dip.
Faults act as barriers to ground-water movement where displacements are large enough to bring impermeable beds into contact with permeable beds, where gouge or shale is smeared along the zone of displacement, or where a fault brecciated zone has been re-cemented.
In areas of complex faulting, such as the Des Plaines area, ground-water circulation is disturbed to the extent that recharge and flushing are difficult and the area as a whole should be avoided for ground-water development.
PUMPAGE Pumpage use data are classified in this report accord
ing to the four main categories used by the U. S. Bureau of the Census. These are: 1) public, including a) municipal, and b) institutional; 2) industrial; 3) rural non-irrigation; 4) irrigation, including a) farm, and b) golf courses and cemeteries.
Most water-supply systems furnish water for several types of use. For example, a public supply commonly includes water used for drinking and other domestic uses, manufacturing processes, and lawn sprinkling. The
' water supplies for industries as well as those for golf courses, and cemeteries, may also be used for drinking. In all cases, the total pumpage may be known approximately, but the final use of the water cannot always be determined.
Public water supplies furnish water that has been approved as sanitary under the supervision of health departments. Municipal systems are either publicly or privately owned for incorporated cities or villages. Institutional supplies furnish sanitary water to settlements, motels, schools, and other institutions.
Any water pumped by an industry is called an industrial supply, regardless of the use of the water.
Rural non-irrigation supplies include farm or individual residence supplies which are not under the regular supervision of a health department. These supplies may also be used for lawns and home gardens.
Irrigation water is that which is applied to the land to supplement natural soil moisture for growing plants. In the Chicago region farm irrigation is practiced primarily by commercial truck farmers. The water pumped for golf courses and cemeteries may be in part used for drinking purposes but is used chiefly for watering lawns and gardens. This use is placed in a separate category in this report because it is great enough to have marked local effects.
Pumpage is also classified according to the aquifer in which the well is finished. In the Chicago region the water is obtained from wells finished in the glacial drift, the shallow dolomite, and the Cambrian-Ordovician and Mt. Simon Aquifers. For simplicity in this report the Cambrian-Ordovician and Mt. Simon Aquifers are called deep aquifers in the tables showing pumpage. In these tables, the term "apparent source" is used because the pumped water is assigned in each well to the aquifer in which the well is finished, although many wells are open to more than one aquifer. Additional uncertainty in the classification results from the fact that in systems obtaining water from more than one source, pumpage from individual sources may not be separately recorded and their use may be irregular.
In general, glacial drift wells and dolomite wells supply residences although some municipal and industrial wells depend on these sources. The deep aquifers are used exclusively for municipal and industrial supplies.
The industrial wells generally have the most uniform pumpage over the year unless large air-conditioning installations are used or the industry is seasonal. However, if a change in operation occurs, as on strikes or vacation shut-downs, the variation in pumpage is radical and sudden.
Municipal pumpage shows a gradual change with seasons, the average winter use being about three fourths of the average summer use.
Pumpage for irrigation is fully seasonal and varies considerably from year to year, depending on weather conditions.
The reliability of pumpage data varies greatly. Municipal pumpage is nearly always metered in cities, but many smaller villages operate without meters. Only a small part of the industrial supply is metered. Pumpage data from municipalities and the larger industrial establishments are systematically recorded. The pumpage from farm wells and from the many thousands of individual residential wells is estimated on the basis of detailed surveys of a few selected sections considered typical. In some districts, the water supply from individual wells is often replaced by a municipal supply, but often the old wells are retained for certain purposes such as sprinkling. For all these reasons it is difficult to ascertain exact pumpage figures.

44 CHICAGO REGION GROUND-WATER RESOURCES
PUBLIC SUPPLIES Municipal
The data on municipal pumpage from 1938 to 1955 inclusive (table 5) have been taken as published periodically by the Illinois Department of Public Health. The data for 1957 (table 5) were collected by the State Water Survey.
In general table 5 shows a steady increase in municipal pumpage. The reductions shown for the 1938-1944 period are attributed to extension of Lake Michigan supplies to communities in Cook and Lake Counties that formerly were supplied by well water. In McHenry County the apparent decline is not real because of a change in method of estimation.
Comparison of the increase in municipal pumpage during the period 1938-1957 with the increase in population 1940-1957 (figs. 10 and 11) shows that the pumpage increased 3.7 times as fast as the population on an average yearly basis. This rapid increase in municipal pumpage is due partly to an increase in industrial use and partly to the development of new municipal supplies.
The distribution by apparent source of the total municipal pumpage of 70,403,000 gallons per day (gpd) in 1957 is shown in table 6.
Table 6 shows that the municipalities supplied from deep wells are the largest water producers. The municipalities supplied from dolomite wells, although forming the largest group, pump an intermediate amount. The ones supplied from drift wells or springs pump the least water. This generalization becomes more evident if the two largest cities having part of their supplies from drift wells, Joliet and Woodstock, are subtracted. The remaining 19 municipalities pump an average of only 120,000 gpd each.
TABLE 5. MUNICIPAL GROUND-WATER PUMPAGE In 1,000 gallons per day
Institutional
Reliable data on institutional pumpage are essentially unavailable. No institution was found which metered its pumpage. At a few institutions the power for pumpage is metered separately, especially in housing groups where the water is sold to the individual houses.
Table 7 shows the total pumpage of 20 institutions in the region is estimated at 8.5 million gallons per day (mgd), the largest consumers being state institutions.
TABLE 6. MUNICIPAL PUMPAGE BY APPARENT SOURCE, 1957 In 1,000 gallons per day
* The number of municipalities is shown in parentheses.
TABLE 7. ESTIMATED INSTITUTIONAL PUMPAGE BY APPARENT SOURCE, 1957
In 1,000 gallons per day
INDUSTRIAL SUPPLIES
Data on industrial pumpage were obtained at 130 plants, as summarized in table 8. It is likely that some plants have been overlooked; however, they are probably the small ones and have small pumpage. A much greater source of error is found in inaccurate estimates of pumpage of the large industrial plants. Only a few plants have meters to measure the pumpage, and the metered pumpage amounts to only about 10 percent of the total industrial pumpage. The remainder of the pumpage is determined from a measured or estimated time the pump operates or is estimated by factory officials. It is assumed that the total pumpage per county is more nearly correct than individual plant pumpage, as compensation for errors occurs because the pumpage in some plants is probably overestimated and in others, underestimated.
The industrial pumpage is about one half that of the municipal pumpage. Nearly 94 percent of the industrial pumpage is obtained from the deep aquifers. Owing to this concentration the industrial pumpage from the deep aquifers is nearly as great as the municipal pumpage from them.

TOTAL PUMPAGE 45
TABLE 8. ESTIMATED INDUSTRIAL PUMPAGE BY APPARENT SOURCE. 1957
In 1,000 gallons per day
RURAL NON-IRRIGATION SUPPLIES
Pumpage for farms and individual residences is rarely measured. The data summarized in table 9 are estimates obtained by considering the rural population of each county as given in the 1950 report of the U.S. Bureau of the Census, the population increase for 1956 as shown by the Illinois Department of Public Health, and the probable percentage of the population which depends on individual water supplies. Based on a survey of selected rural areas within the Chicago region, it was determined that the per capita use averages 50 gallons per day. This figure, as determined by the sampling, should not be confused with higher use per capita figures commonly cited which include municipal, industrial, and commercial uses. Rural non-irrigation, in this report, refers to domestic and livestock uses.
None of this pumpage is from the deeper sandstones. Much of the pumpage from the glacial drift is from dug wells. Currently, many wells in the shallow aquifers are equipped with electric pumps. Although these installations are still in the minority, their pumpage is greater because they are more convenient than manually operated pumps.
The total rural non-irrigation pumpage amounts to 13,160,000 gpd which is about one fourth of the total pumpage from the shallow aquifers. The water comes from small, wells of low capacity that are distributed generally throughout the region. Being widely distributed, these wells make an efficient use of ground water, without the problems of interference and drawdown inherent in the industrial and municipal pumpage.
TABLE 9. ESTIMATED RURAL NON-IRRIGATION PUMPAGE BY APPARENT SOURCE, 1957
In 1,000 gallons per day
IRRIGATION SUPPLIES Farm
There are 45 known irrigation systems in the eight counties, but only 12 of these, as summarized in table 10, use ground water. Pumpage for irrigation is irregular in that it is highly seasonal and also varies greatly from year to year. The momentary use may be high but of short duration. The total pumpage is calculated on an annual basis. Ground-water pumpage for irrigation is from the glacial drift and shallow dolomite aquifers.
Golf Courses and Cemeteries
The pumpage shown in table 11 is used primarily for irrigating grass and perennial plants in golf courses and cemeteries throughout the growing season. Wells in glacial drift aquifers were not considered in this table and are believed to be of minor significance.
TABLE 10. ESTIMATED FARM IRRIGATION PUMPAGE BY APPARENT SOURCE, 1957
In 1,000 gallons per day
TABLE I I . ESTIMATED GOLF COURSE AND CEMETERY IRRIGATION PUMPAGE BY APPARENT SOURCE, 1957
In 1,000 gallons per day
TOTAL PUMPAGE
The estimated total pumpage of ground water in the region for 1957 is 127.9 mgd. The distribution of pumpage by use and by apparent source is shown in tables 12 and 13 respectively. Table 12 shows that public systems took more than twice as much ground water as any other category of use and pumped 61.6 percent of the total in 1957. Table 13 shows that wells finished in the deep aquifers yielded a little more than half of the total pumpage in 1957.
Pumpage from the deep wells at six pumping centers was estimated for 1958. This estimate, with break-down into actual source, is discussed in a subsequent section.
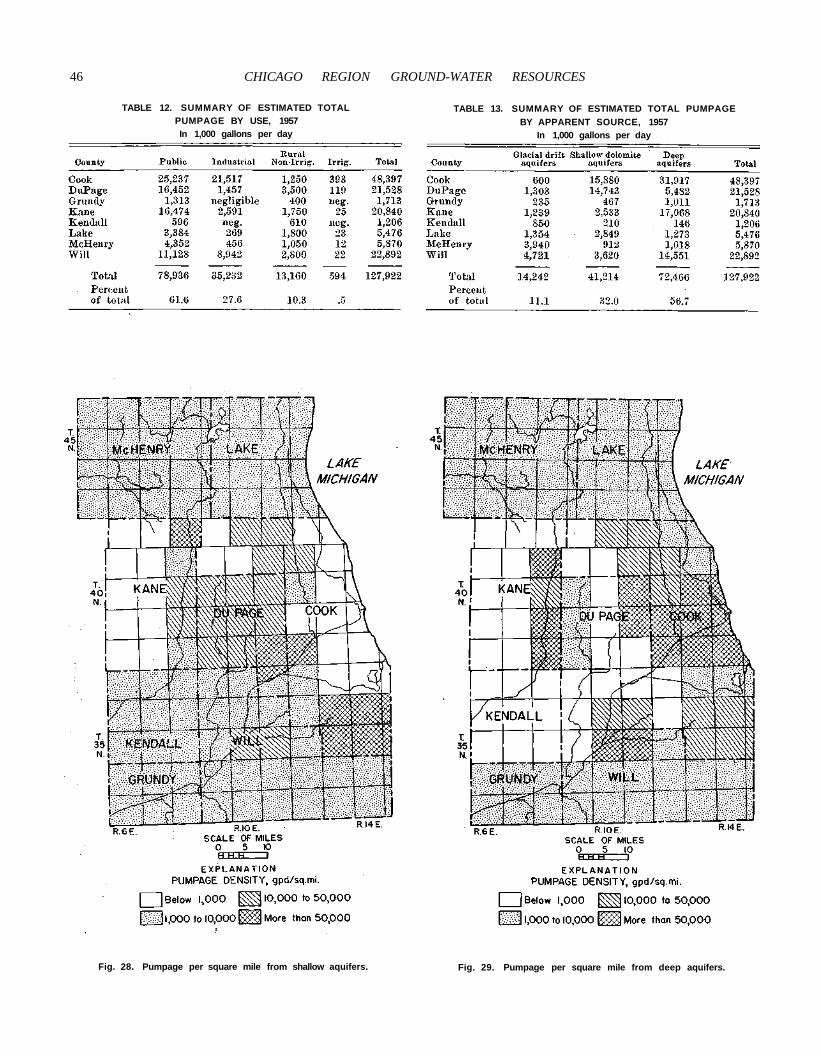
46 CHICAGO REGION GROUND-WATER RESOURCES
TABLE 12. SUMMARY OF ESTIMATED TOTAL PUMPAGE BY USE, 1957 In 1,000 gallons per day
Fig. 28. Pumpage per square mile from shallow aquifers.
TABLE 13. SUMMARY OF ESTIMATED TOTAL PUMPAGE BY APPARENT SOURCE, 1957
In 1,000 gallons per day
Fig. 29. Pumpage per square mile from deep aquifers.
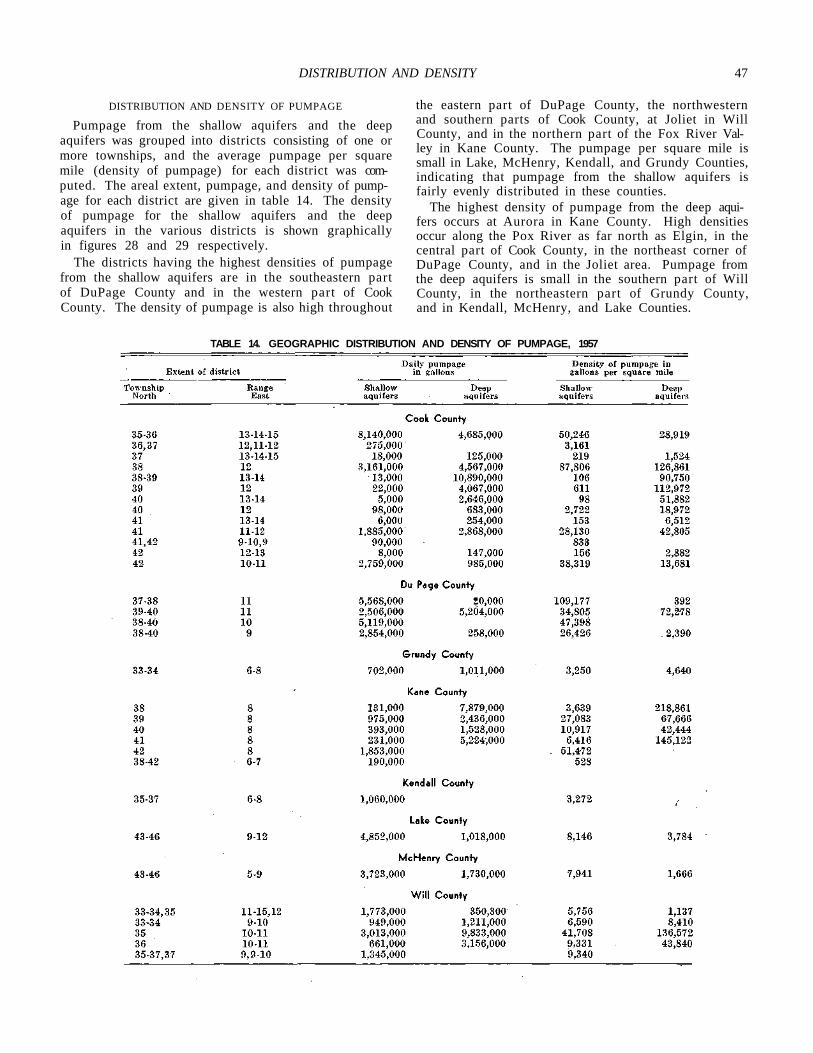
DISTRIBUTION AND DENSITY 47
DISTRIBUTION AND DENSITY OF PUMPAGE
Pumpage from the shallow aquifers and the deep aquifers was grouped into districts consisting of one or more townships, and the average pumpage per square mile (density of pumpage) for each district was computed. The areal extent, pumpage, and density of pumpage for each district are given in table 14. The density of pumpage for the shallow aquifers and the deep aquifers in the various districts is shown graphically in figures 28 and 29 respectively.
The districts having the highest densities of pumpage from the shallow aquifers are in the southeastern part of DuPage County and in the western part of Cook County. The density of pumpage is also high throughout
the eastern part of DuPage County, the northwestern and southern parts of Cook County, at Joliet in Will County, and in the northern part of the Fox River Valley in Kane County. The pumpage per square mile is small in Lake, McHenry, Kendall, and Grundy Counties, indicating that pumpage from the shallow aquifers is fairly evenly distributed in these counties.
The highest density of pumpage from the deep aquifers occurs at Aurora in Kane County. High densities occur along the Pox River as far north as Elgin, in the central part of Cook County, in the northeast corner of DuPage County, and in the Joliet area. Pumpage from the deep aquifers is small in the southern part of Will County, in the northeastern part of Grundy County, and in Kendall, McHenry, and Lake Counties.
TABLE 14. GEOGRAPHIC DISTRIBUTION AND DENSITY OF PUMPAGE, 1957

48 CHICAGO REGION GROUND-WATER RESOURCES
H Y D R O L O G Y O F A Q U I F E R S
CAMBRIAN-ORDOVICIAN AND MT. SIMON AQUIFERS
The Cambrian-Ordovieian Aquifer consists in downward order of the Galena-Platteville Dolomite, Glen-wood-St. Peter Sandstone, Prairie du Chien Series, Trempealeau Dolomite, Franconia Formation, and Iron-ton-Galesville Sandstone. It is considered in most detail in this report.
The Ironton-Galesville Sandstone is the most productive formation of the group. The Galena-Platteville Dolomite and Prairie du Chien Series generally are not well creviced and are not major contributors. The Trempealeau Dolomite is locally well creviced and is partly responsible for exceptionally high yields of several deep wells in the Chicago-Joliet-Fox Valley area. The Mt. Simon Aquifer, consisting of the sandstone of the Mt. Simon and lower Eau Claire Formations (fig. 19), yields moderate supplies in the western part of the area where the water is of acceptable quality.
The Maquoketa Formation above the Galena-Platteville Dolomite acts as a barrier between the shallow dolomite and deeper aquifers and confines the water in the deeper aquifers under artesian pressure. Any original differences in artesian pressure among the units of the Cambrian-Ordovician Aquifer have been largely equalized by the great number of wells open in all units. Available data indicate that on a regional basis, the entire sequence of strata, from the top of the Galena-Platteville to the top of the shale beds of the Eau Claire Formation, essentially behave hydraulically as one aquifer. Some differences in pressure in the various strata probably still exist in places where the permeability of intervening beds is low and there are not enough wells to have permitted equalization. However, the entire sequence of strata is treated as one aquifer in this report.
The Mt. Simon Aquifer beneath the Eau Claire Formation is fairly permeable and yields moderate amounts of water to wells. The Cambrian-Ordovician Aquifer is effectively separated from the Mt. Simon Aquifer by impermeable beds of the Eau Claire Formation. The artesian pressure in the Mt. Simon Aquifer is greater than that in the Cambrian-Ordovieian Aquifer.
In wells open to the Cambrian-Ordovieian Aquifer, Silurian age dolomite, and Mt. Simon Aquifer, ground water moves downward from the dolomite and upward from the Mt. Simon into the Cambrian-Ordovieian Aquifer.
HYDRAULIC PROPERTIES
The significant hydraulic properties of aquifers are expressed mathematically by the coefficients of trans-missibility, T, and storage, S. The capacity of a formation to transmit ground water is expressed by the coefficient of transmissibility, which is defined as the rate of flow of water in gallons per day, through a vertical
strip of the aquifer one foot wide and extending the full saturated thickness under a hydraulic gradient of 100 percent (one foot per foot) at the prevailing temperature of the water. The storage properties of an aquifer are expressed by the coefficient of storage, which is defined as the volume of water in cubic feet released from or taken into storage per square foot of surface area of the aquifer per foot change in the component of head normal to that surface. Under artesian conditions, water is derived from storage by the compaction of the aquifer and its associated beds and by expansion of the water itself.
Pumping Tests
The hydraulic properties of an aquifer are determined by means of pumping tests, wherein the effect of pumping a well at a known constant rate is measured in the pumped well and at observation wells penetrating the aquifer. Graphs of drawdown versus time after pumping started, and/or of drawdown versus distance from the pumped well, are used to solve equations which express the relation between the coefficient of transmissibility and storage of an aquifer and the lowering of water levels in the vicinity of a pumped well.
During the period 1922-1954, 63 pumping tests were made in northeastern Illinois to determine the hydraulic properties of the Cambrian-Ordovieian Aquifer. The data collected during the pumping tests were analyzed by means of the Thiem (see Wenzel, 1942, p. 81) and the nonequilibrium (Theis, 1935, p. 519-24) formulas. The Thiem formula is
where T is the coefficient of transmissibility, in gallons per day per foot; Q is the rate of pumping, in gallons per minute (gpm); r1 and r2 are the distances, in feet, of two observation wells from the pumped well; and S1 and S2 are the respective drawdowns, in feet, in the two observation wells.
The nonequilibrium formula is
or, evaluating the integral,
where u = ; s is the drawdown, in feet, at a dis
tance, r, in feet, from a pumped well discharging at rate Q, in gallons per minute, for a time, t, in days; T is the coefficient of transmissibility, in gallons per day per foot; and S is the storage coefficient of the aquifer.

HYDROLOGY OF AQUIFERS 49
TABLE 15. REPRESENTATIVE COEFFICIENTS OF TRANSMISSIBILITY OF THE CAMBRIAN-ORDOVICIAN AQUIFER

50 CHICAGO REGION GROUND-WATER RESOURCES
TABLE 16. COEFFICIENTS OF STORAGE OF THE CAMBRIAN-ORDOVICIAN AQUIFER
A summary of the coefficients of transmissibility and storage obtained from the various pumping tests is given in tables 15 and 16. The coefficients of storage in table 16 are averages of several wells at each location.
Summary of the Results of Tests
Coefficients of transmissibility listed in table 15 range from 10,800 gpd per foot to 26,900 gpd per foot and average 17,400 gpd per foot. The coefficients of storage given in table 16 are characteristic of artesian conditions
Fig. 30. Coefficients of transmissibility of Cambrian-Ordovician Aquifer.
and range from 0.00016 to 0.00068 and average 0.00035. For comparison, the average coefficients of transmissibility and storage for the Cambrian-Ordovician Aquifer in the Milwaukee-Waukesha area, Wisconsin (Foley, Walton, Drescher, 1953, p. 72) are 23,800 gpd per foot and 0.00039 respectively.
Computed coefficients of transmissibility were used to prepare figure 30. The data indicate that the coefficient of transmissibility is fairly uniform throughout large areas in northern Illinois. The average coefficient of transmissibility of the portion of the aquifer between Chicago and the border of the Maquoketa Formation (fig. 16) is 17,000 gpd per foot. Based on a study of the data in figure 30, the coefficients of transmissibility, T, of the aquifer decrease in a southeasterly direction from an average value of 22,000 gpd per foot in Boone, De-Kalb and LaSalle Counties to an average value of 15,000 gpd per foot in the southern parts of Cook and Will Counties. Deep wells in Kankakee County and near the Indiana state line have small yields indicating that the coefficients of transmissibility of the aquifer rapidly decrease south of Joliet and east of Chicago in the northwestern part of Indiana.
The coefficients of storage, S, given in table 16 were computed from the results of relatively short-term tests. The calculated coefficient of storage generally increases with time (Guyton, 1941, p. 770; Jacob, 1941, p. 786). Longer pumping tests would give larger coefficients of storage as has been demonstrated by Jacob in an analysis of data for the Kankakee Ordnance Works. Therefore, for periods of pumping involving several years or more, a coefficient of storage of 0.0006, is believed to be more realistic than the determined figure 0.00035, and is used in this report.
THEORETICAL EFFECTS OF PUMPING The Cambrian-Ordovician Aquifer under natural con
ditions, prior to development of wells, was in approximate dynamic equilibrium in which discharge balanced recharge. The small amount of water that entered the aquifer in recharge areas was discharged naturally by leakage through the confining bed (Maquoketa Formation) in the parts of the aquifer under artesian conditions and by leakage into the Illinois River.
The withdrawal of water by wells disturbs the natural equilibrium. Cones of depression, with centers at the pumped wells, spread out in all directions and water is taken from storage within the aquifer as water levels are

EFFECTS OF PUMPING 51
lowered in the areas under the influence, of pumping. The cones overlap and continue to grow until: (1) the lowering of water levels results in increased recharge to, or decreased natural discharge from, the aquifer or a combination of these, and (2) hydraulic gradients are established from the recharge or natural discharge area to the pumped wells sufficient to bring from the area the amounts of water pumped. The natural discharge cannot be decreased, nor the recharge increased, unless the hydraulic gradients are changed in areas of discharge and recharge. The dimensions of the cones of depression depend largely upon the hydraulic properties of the aquifer (coefficients of transmissibility and storage), the location and character of geohydrologic boundaries, and the rates of pumping.
Considerable time elapses before a cone of depression stabilizes, water is no longer taken from storage, and a new state of approximate equilibrium is established. The time required to reach approximate equilibrium may be computed by using the following equation (see Foley, Walton, Drescher, 1953, p. 86) :
where t = time required to reach approximate equilibrium, in years; R = distance, in feet, from recharge boundary to pumped well; S = coefficient of storage; T = coefficient of transmissibility, in gallons per day per foot; r = distance, in feet, from pumped well to observation point; t = deviation from absolute equilibrium (arbitrarily assumed to be 0.05 in computations given below).
Computations made assuming distances of 47 miles (the average distance from Chicago [Loop] to recharge areas) from a pumped well to a source of recharge and 10 miles from a pumped well to an observation point, indicate that time in the magnitude of 180 years would elapse before the cone stabilized at the observation point.
A large part of the water withdrawn from the Cam-brian-Ordovician Aquifer during the period in which the cone of depression is expanding and deepening is derived from storage by compaction of the aquifer and by expansion of the water itself.
Pumping from the Cambrian-Ordovician Aquifer has a widespread effect on water levels. Ground-water withdrawals at Chicago affect water levels in the Joliet area and in pumping centers in Kane and DuPage Counties. The development of ground water from areas in Kane, DuPage, and Will Counties also affects water levels at Chicago. The nonequilibrium formula (2) and the coefficients of transmissibility and storage, computed from the results of pumping tests, can be used to evaluate the magnitude of interference between wells and well fields and to compute the theoretical decline in artesian head at any distance from a pumped well and within any length of time after pumping is started.
Fig. 3 1 . Graphs of theoretical distance-drawdown ( A ) , t ime-drawdown (B) , and time-drawdown considering boundaries ( C ) for
Cambrian-Ordovician Aquifer .
Figure 31A shows the amount of interference that will occur at distances of 100 feet to 19 miles from a deep well pumping continuously at 695 gpm, or 1 mgd for 30 days, 1 year, 10 years, and 100 years. The average coefficients of transmissibility and storage computed from pumping test data were used to construct the graphs. The graphs assume that all the water pumped is withdrawn from storage and that the aquifer is infinite in areal extent.
Figure 31B shows the amount of interference that will occur at any time from 37 days to 100 years 0.5 mile, 1 mile, 5 miles, and 10 miles from a well being pumped continuously at 695 gpm. Again an aquifer infinite in areal extent is assumed. The theoretical drawdown is directly proportional to the pumping rate. If the pumping rate is 347 gpm instead of 695 gpm the drawdown would be half that shown in figures 31A and 31B.
Influence of Geohydrologic Boundaries
The graphs shown in figures 31A and 31B were constructed assuming an aquifer infinite in areal extent. However, the Cambrian-Ordovician Aquifer has several

52 CHICAGO REGION GROUND-WATER RESOURCES
boundaries. A recharge boundary exists about 47 miles west of Chicago (see subsequent section on recharge). Geologic and hydrologic data collected in northern Illinois indicate that permeabilities in the Cambrian-Ordovician Aquifer decrease south and east of Chicago and that changes in the water-bearing properties great enough to approximate the effect of barrier boundaries occur at distances of about 37 miles east and about 60 miles south of Chicago. Thus, the Cambrian-Ordovician Aquifer is enclosed by two barrier boundaries and one recharge boundary. The effect of the recharge boundary is to decrease the drawdown in a well. The effect of the barrier boundaries is to increase the drawdown in a well.
The influence of the geohydrologic boundaries, one recharge and two barrier boundaries, on the regional effects of pumping can be determined by means of the image-well theory (see Ferris, 1951, p. 247-59). The image-well theory as applied to ground-water hydrology may be stated as follows: the effect of a barrier boundary on the drawdown in a well as a result of pumping from
Fig. 32. Piezomefric surface of Cambrian-Ordovician Aquifer about 1864 and 1895.
another well is the same as though the aquifer were infinite and a like discharging well were located across the real boundary on a perpendicular thereto and at the same distance from the boundary as the real pumping well. For a recharge boundary the principle is the same except that the image well is assumed to be recharging the aquifer instead of pumping from it.
The recharge boundary west of Chicago and the barrier boundary east of Chicago are for practical purposes parallel. These two boundaries are intersected at approximate right angles by a barrier boundary south of Chicago. Analysis of a multiple-boundary system with parallel boundaries by the image-well theory requires use of a multiple image-well system (Knowles, 1955, p. 88-91).
The results of geologic and hydrologic studies made in northern Illinois indicate that the effects of the geohydrologic boundaries on the response of the Cambrian-Ordovician Aquifer to development of wells can be simulated by mathematical analysis of a hypothetical hydrologic system. The system consists of a rectangular aquifer 84 miles in width enclosed by a recharge boundary 47 miles west of Chicago and by two intersecting barrier boundaries 37 and 60 miles east and south of Chicago.
Figure 31C shows the effects of the geohydrologic boundaries on the drawdown at an observation point 16 miles west of Chicago. Distances from the pumped well to the observation point of 16 miles, to the recharge boundary of 40 miles, to the barrier boundary of 58 miles south of Chicago, and to the barrier boundary of 45 miles east of Chicago were assumed in constructing the graph.
The Sandwich Fault Zone, previously discussed, runs in a northwest-southeast direction about 10 miles southwest of Joliet. There is evidence that this fault has local effects as a barrier boundary, but it does not seem to displace or modify the regional piezometric pattern. Another geologic structure, previously described, is the Des Plaines Complex which controls the hydrology locally, but does not seem to affect the surrounding piezometric pattern.
PIEZOMETRIC SURFACE OF CAMBRIAN-ORDOVICIAN AQUIFER
The piezometric surface is an imaginary surface to which water will rise in artesian wells. Imaginary lines of equal elevation (representing equal pressure) on the piezometric surface are called isopiestic lines. Ground water moves down gradient at right angles to isopiestic lines.
The exact shape of the piezometric surface of the Cambrian-Ordovician Aquifer before extensive groundwater development occurred in the Chicago-Joliet-Fox Valley area is not known. However, water-level data given by Anderson (1919) and by Weidman (1915) indicate that, under natural conditions, the piezometric surface was relatively featureless and sloped gently toward the southeast, as shown by the estimated isopiestic lines for 1864 in figure 32. As shown in this figure, a ground-

ARTESIAN PRESSURE 53
TABLE 17. WATER LEVELS IN DEEP WELLS ABOUT 1895 Elevations in Feet Above Mean Sea Level
water ridge existed in parts of McHenry, Kane, and DeKalb Counties. Ground water moved under natural conditions toward Chicago from the ground-water ridge. In the western part of McHenry County and in the northwest, part of DeKalb County the slope of piezometric surface was to the west, and the movement of water in these areas therefore was not toward the Chicago-Joliet-Pox Valley area but was toward the Rock River Valley. Under natural conditions, the isopiestic lines bent in an upstream direction around the Illinois River in Grundy and LaSalle Counties west of the border of the Maquo-keta Formation, indicating that there was leakage from the Cambrian-Ordovician Aquifer into parts of the Illinois River Valley.
Artesian Pressure in 1864 and 1895 The first deep well in Chicago was drilled in 1864 at
the corner of Chicago and Western Avenues. This well was 711 feet deep and probably terminated in the lower part of the Galena-Platteville Dolomite. The well flowed with a head of 80 feet above the surface or to an elevation of 695 feet above mean sea level. It is reasonable to assume that the water in the sandstones beneath the Galena-Platteville Dolomite had a head somewhat higher than that in the first drilled well. The piezometric sur
face of the sandstone aquifers in the Chicago area is estimated to have had an elevation of about 710 feet in 1864 as shown in figure 32. Based largely on the water-level data given by Wiedman (1915), the elevation of the piezometric surface was between 750 and 850 feet in 1864 in McHenry, Kane, Boone, and DeKalb Counties, between 40 and 140 feet higher than at Chicago. In 1864 the 650-foot isopiestic line bent southward in Will County and some water moved toward Grundy, Livingston, and Kankakee Counties south of Chicago.
Hundreds of deep wells were drilled in Chicago and in Joliet after 1864, and the pumping of large quantities of ground water changed considerably the direction and rate of ground-water movement in northern Illinois. The artesian pressure was lowered (table 17) and cones of depression were produced. As early as about 1895 the piezometric surface was greatly modified owing to heavy withdrawals of water. The hydraulic gradients from the west were steepened and the slopes of the piezometric surface east and south of Chicago were reversed, as shown in figure 32. By 1895 water was moving from nearly all directions toward Chicago and Joliet. The 700-foot isopiestic line had migrated in a northwesterly direction about 22 miles from its estimated position in

54 CHICAGO REGION GROUND-WATER RESOURCES
Fig. 33. Piezometric surface of Cambrian-Ordovician Aquifer about 1915.
1864. The 550-foot line had moved northwestward from northern Indiana and south of Kankakee, Illinois, to a position west of the centers of pumpage in the vicinity of Chicago, as large quantities of water were taken from storage within the aquifer.
Artesian Pressure about 1915.
Pumpage of ground water continued to increase. By 1915 the cones of depression around Chicago and Joliet had deepened since 1864 about 300 feet to elevations of about 400 feet (table 18) and isopiestic lines were distorted around pumpage centers along the Fox Valley in Kane County (fig. 33). Discharge of ground water to the Illinois River was decreased as the cone of depression moved into Kendall County. The 700-foot isopiestic line had migrated six miles from its estimated position in 1895.
Artesian Pressure in 1958
Figure 34 shows the piezometric surface of the Cambrian-Ordovician Aquifer in 1958. The levels used to
prepare the map (table 19) are nonpumping water levels. Geologic cross sections and profiles of the piezometric surface of the Cambrian-Ordovician Aquifer in 1958, which were prepared for four lines across northern Illinois, are shown in figure 15. These two illustrations show clearly the cones of depression in the piezometric surface which have developed as the result of heavy pumping. It will be noted that a considerable lowering has taken place in the pressure surface since 1915. A 400-foot isopiestic line closed around Chicago in 1915, with the cone of depression centered in the Stock Yards area. During recent years the area of lowest water levels has shifted toward the west. In 1958 the deepest cone of depression in Cook County (50 feet above sea level) was in the vicinity of Summit which is southwest of Chicago.
Another pronounced cone is centered at Joliet where the artesian pressure was at an elevation of about 25 feet above sea level in 1958. Several small cones that developed within the large cones mentioned above distort the isopiestic lines, causing them to bend irregularly around many scattered pumpage centers. Depressions
Fig. 34. Piezometric surface of Cambrian-Ordovician Aquifer in 1958.

WATER LEVELS 55
TABLE 18. WATER LEVELS IN DEEP WELLS ABOUT 1915 Elevations in Feet Above Mean Sea Level

56 CHICAGO REGION GROUND-WATER RESOURCES
TABLE 19. WATER LEVELS IN DEEP WELLS IN 1958 Elevations In Feet Above Mean Sea Level

WATER LEVELS 57
TABLE 19. (Continued)

58 CHICAGO REGION GROUND-WATER RESOURCES
TABLE 19. (Continued)
in the piezometric surface occur in the vicinity of Elm-hurst and at Des Plaines. A significant feature shown in figure 34 is the bending of isopiestic lines around pumpage centers in the Elgin and Aurora areas along the Fox Valley in Kane County.
Changes in artesian pressure produced by pumping since the days of early settlement have been pronounced and widespread. The artesian pressure in the vicinity of Chicago has declined on the average about 600 feet. In 1864 the 700-foot isopiestic line passed through Chicago. By 1958 the 700-foot isopiestic line had migrated northwestward about 52 miles to a position in western McHenry County and eastern DeKalb County. A
ground-water divide exists in eastern Boone County and in northeastern DeKalb County.
The general pattern of flow of water in the Cambrian-Ordovician Aquifer in 1958 is slow movement from all directions toward the deep cones of depression centered at Chicago and at Joliet. Some of the water flowing toward Chicago and Joliet is intercepted by cones of depression developed locally within the large cones in the Aurora, Elgin, Des Plaines, and Elmhurst areas. The lowering of head that has accompanied the withdrawals of ground water has established steep hydraulic gradients west and north of Chicago, and large quantities of water are at present being transmitted from
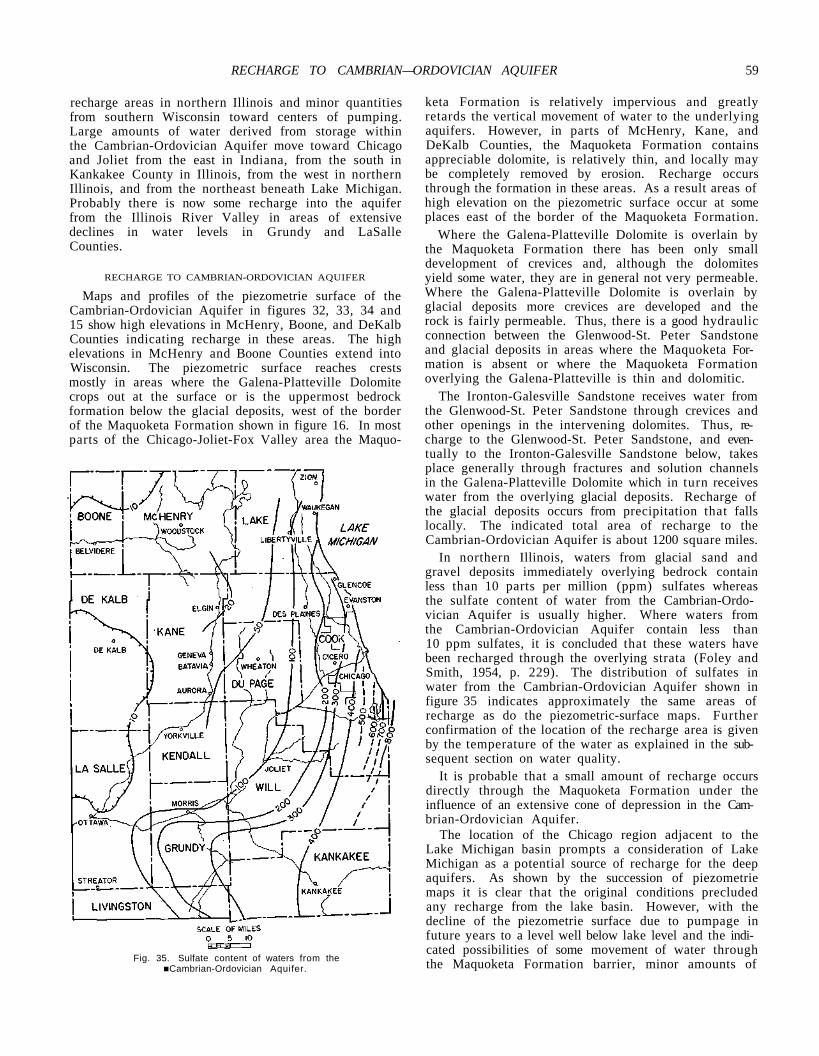
RECHARGE TO CAMBRIAN—ORDOVICIAN AQUIFER 59
recharge areas in northern Illinois and minor quantities from southern Wisconsin toward centers of pumping. Large amounts of water derived from storage within the Cambrian-Ordovician Aquifer move toward Chicago and Joliet from the east in Indiana, from the south in Kankakee County in Illinois, from the west in northern Illinois, and from the northeast beneath Lake Michigan. Probably there is now some recharge into the aquifer from the Illinois River Valley in areas of extensive declines in water levels in Grundy and LaSalle Counties.
RECHARGE TO CAMBRIAN-ORDOVICIAN AQUIFER
Maps and profiles of the piezometrie surface of the Cambrian-Ordovician Aquifer in figures 32, 33, 34 and 15 show high elevations in McHenry, Boone, and DeKalb Counties indicating recharge in these areas. The high elevations in McHenry and Boone Counties extend into Wisconsin. The piezometric surface reaches crests mostly in areas where the Galena-Platteville Dolomite crops out at the surface or is the uppermost bedrock formation below the glacial deposits, west of the border of the Maquoketa Formation shown in figure 16. In most parts of the Chicago-Joliet-Fox Valley area the Maquo-
Fig. 35. Sulfate content of waters from the ■Cambrian-Ordovician Aquifer.
keta Formation is relatively impervious and greatly retards the vertical movement of water to the underlying aquifers. However, in parts of McHenry, Kane, and DeKalb Counties, the Maquoketa Formation contains appreciable dolomite, is relatively thin, and locally may be completely removed by erosion. Recharge occurs through the formation in these areas. As a result areas of high elevation on the piezometric surface occur at some places east of the border of the Maquoketa Formation.
Where the Galena-Platteville Dolomite is overlain by the Maquoketa Formation there has been only small development of crevices and, although the dolomites yield some water, they are in general not very permeable. Where the Galena-Platteville Dolomite is overlain by glacial deposits more crevices are developed and the rock is fairly permeable. Thus, there is a good hydraulic connection between the Glenwood-St. Peter Sandstone and glacial deposits in areas where the Maquoketa Formation is absent or where the Maquoketa Formation overlying the Galena-Platteville is thin and dolomitic.
The Ironton-Galesville Sandstone receives water from the Glenwood-St. Peter Sandstone through crevices and other openings in the intervening dolomites. Thus, recharge to the Glenwood-St. Peter Sandstone, and eventually to the Ironton-Galesville Sandstone below, takes place generally through fractures and solution channels in the Galena-Platteville Dolomite which in turn receives water from the overlying glacial deposits. Recharge of the glacial deposits occurs from precipitation that falls locally. The indicated total area of recharge to the Cambrian-Ordovician Aquifer is about 1200 square miles.
In northern Illinois, waters from glacial sand and gravel deposits immediately overlying bedrock contain less than 10 parts per million (ppm) sulfates whereas the sulfate content of water from the Cambrian-Ordovician Aquifer is usually higher. Where waters from the Cambrian-Ordovician Aquifer contain less than 10 ppm sulfates, it is concluded that these waters have been recharged through the overlying strata (Foley and Smith, 1954, p. 229). The distribution of sulfates in water from the Cambrian-Ordovician Aquifer shown in figure 35 indicates approximately the same areas of recharge as do the piezometric-surface maps. Further confirmation of the location of the recharge area is given by the temperature of the water as explained in the subsequent section on water quality.
It is probable that a small amount of recharge occurs directly through the Maquoketa Formation under the influence of an extensive cone of depression in the Cambrian-Ordovician Aquifer.
The location of the Chicago region adjacent to the Lake Michigan basin prompts a consideration of Lake Michigan as a potential source of recharge for the deep aquifers. As shown by the succession of piezometrie maps it is clear that the original conditions precluded any recharge from the lake basin. However, with the decline of the piezometrie surface due to pumpage in future years to a level well below lake level and the indicated possibilities of some movement of water through the Maquoketa Formation barrier, minor amounts of

60 CHICAGO REGION GROUNDWATER RESOURCES
recharge may be derived in the future from the Lake Michigan basin. The present study indicates no significant amount of recharge from Lake Michigan at this time.
MOVEMENT OF WATER IN CAMBRIAN-ORDOVICIAN AQUIFER
The quantity of water percolating through a given cross section of an aquifer is proportional to the hydraulic gradient (slope of the piezometric surface) and the coefficient of transmissibility, and it can be computed by using the following modified form of the Darcy equation (see Ferris, 1951, p. 226):
Q = TIL (3)
in which Q is the discharge in gallons per day; T is the coefficient of transmissibility in gallons per day per foot; I is the hydraulic gradient in feet per mile; and L is the width of the cross section through which discharge occurs in miles.
A study was made of the movement of ground water towards Chicago in response to the natural hydraulic gradient of the piezometric surface. Flow lines were drawn from McHenry and Kane Counties toward the northern and southern boundaries of Cook County at right angles to the estimated piezometric surface contours for 1864 given in figure 32. These two flow lines delimit the section of the Cambrian-Ordovician Aquifer through which water was transmitted to Chicago under natural conditions. Considering the section of the aquifer midway between the 750-foot and 700-foot contours, the hydraulic gradient was 1.7 feet per mile and the distance between the limiting flow lines was 30 miles. Based on the data summarized in figure 30, the average coefficient of transmissibility of the section of the aquifer between the 750-foot and 700-foot lines is about 17,000 gpd per foot. Using equation (3) and the data given above, the quantity of water moving towards Chicago is computed to be about 900,000 gpd which was all that moved in this direction under the natural hydraulic gradient of the piezometric surface before pumping started.
In 1958 the amount of water moving through the Cambrian-Ordovician Aquifer southeastward from Mc-Henry and Kane Counties was determined to be about 19 mgd, or about 20 times that flowing under natural conditions. This results from about a tenfold increase in hydraulic gradient (fig. 34) and an increase in the distance between limiting flow lines.
The cone of depression at Joliet was studied to check the accuracy of the coefficients of transmissibility computed from the results of pumping tests. The area bounded by isopiestic lines having elevations of 200 and 150 feet (fig. 34) was selected for the analysis.
From equation (3)
(4)
The quantity of water, Q, moving midway between the 200-foot and 150-foot isopiestic lines is equal to the total pumpage (11.6 mgd, fig. 36B) from the Cambrian-Ordovician Aquifer in the Joliet area minus the amount of water taken from storage within the area enclosed by the 150-foot isopiestic line. The amount of water taken from storage is very small; therefore, Q is essentially equal to 11.6 mgd. The hydraulic gradient, I, and the length of cross section, L, midway between the 200-foot and 150-foot isopiestic lines, were scaled from figure 34. Computations made using the data mentioned above and equation (4) indicate that the average coefficient of transmissibility of the part of the Cambrian-Ordovician Aquifer within the Joliet cone of depression is 16,600 gpd per foot. This value compares favorably with the coefficients of transmissibility computed from the results of pumping tests in the Joliet area (table 15).
Quantity of Water from Recha rge Areas in 1958
The piezometric-surface map given in figure 34 indicates that in 1958 some water was transmitted from recharge areas in Walworth County in southeastern Wisconsin to cones of depression in northeastern Illinois. Because of the lack of piezometric data for the aquifer where it extends under Lake Michigan, it is impossible to compute with any degree of accuracy the quantity of water involved. A reasonable estimate, based on the hydraulic gradient midway between the 700-foot and 650-foot lines in McHenry County, is about 2 mgd.
Based on a study of the movement of water through sections of the Cambrian-Ordovician Aquifer near the border of the Maquoketa Formation, it is estimated that in 1958 approximately 20 mgd were transmitted from recharge areas in northeastern Illinois and southeastern Wisconsin toward cones of depression along the Fox Valley, in the vicinity of Chicago, and at Joliet.
Limiting flow lines were drawn from recharge areas through DeKalb, Kendall, LaSalle, and Grundy Counties to the Joliet cone of depression. The quantity of water transmitted in 1958 from recharge areas toward Joliet was computed to be 5.8 mgd. The calculation was based on the movement of water through the section of the aquifer midway between the 500-foot and 450-foot lines near the border of the Maquoketa Formation and enclosed by the limiting flow lines. The total quantity of water pumped from the Cambrian-Ordovician Aquifer is derived from recharge areas and from storage within the aquifer. Thus, of the total 11.6 mgd of water pumped from the Cambrian-Ordovician Aquifer in 1958 in the Joliet area, 5.8 mgd of water, or 50 percent, was derived from storage within the aquifer.
Quantity of Water Moving into Cones of Depression in 1958
The quantities of water percolating in 1958 through sections of the Cambrian-Ordovician Aquifer into the cones of depression in the Aurora, Elgin, Des Plaines, Elmhurst, Joliet, and Chicago areas were computed, by using data in figures 30 and 34 and equation (3), to be as given in table 20.

DISCHARGE FROM DEEP WELLS 61
TABLE 20. AMOUNT OF WATER MOVING INTO THE CONES OF DEPRESSION OF PUMPING CENTERS IN 1958
Many deep wells in the Chicago-Joliet-Fox Valley area are uncased in the Mt. Simon Aquifer as well as in the Cambrian-Ordovician Aquifer and the Silurian age dolomite. Thus, a large portion of the water pumped from deep wells is obtained from the aquifers above and below the Cambrian-Ordovician Aquifer. The difference, 33.3 mgd, between the' total pumpage of 76.1 mgd from deep wells in the Chicago-Joliet-Fox Valley area and the total of 42.8 mgd of water diverted into the cones of depression is the amount of water derived from the Mt. Simon Aquifer and the Silurian age dolomite.
DISCHARGE FROM DEEP WELLS Pumpage
The first deep well in Chicago, drilled at the corner of Chicago and "Western Avenues in 1864, had an artesian flow estimated at about 150 gpm or about 200,000 gpd. The estimated pumpage from deep wells in the Chicago-Joliet-Fox Valley area increased gradually from 200,000 gpd in 1864 to more than 76 mgd in 1958. Figure 36 shows estimated withdrawal rates for 1864-1958 in the six major pumping centers of the Chicago-Joliet-Fox Valley area. Records of pumpage are fairly complete for the period 1942-1958; very few records of pumpage are available for years prior to 1942. The graphs in figure 36 were constructed by piecing together fragments of information on pumpage found in published reports and in the files of the State Water Survey, by making evaluations based on the number of wells, their reported yields, and their time of construction, and by taking into consideration population growth and per capita consumption.
TABLE 21. DISTRIBUTION OF PUMPAGE FROM DEEP WELLS IN 1908 AND 1958
Fig. 36. Pumpage from the deep wells for the period of record.
Figure 37 and table 21 show the distribution of estimated pumpage from deep wells in 1958. The greatest quantities of water were withdrawn from deep wells in the Chicago; Joliet, and Aurora areas.

62 CHICAGO REGION GROUNDWATER RESOURCES
In 1908, 50 years ago, there was very little pumpage outside Chicago except at Aurora and Elgin (table 21). Since that time the net increase in pumpage at Chicago has been only about 10 percent although in the 1920's and 1940's much higher pumping rates were obtained. Pumpage in areas near Chicago (Elmhurst and Des Plaines) has increased to 15 times that recorded in 1908. During the past 50 years, pumpage at Joliet has increased from 1.8 to 14.0 mgd and pumpage along the Fox Valley in the Aurora and Elgin areas has more than tripled.
As shown in figures 36C and D, prior to about 1940 pumpage in the Elmhurst and Des Plaines areas increased fairly uniformly at an average rate of about 50,000 gpd per year. The total pumpage in 1940 was 2.3 mgd in the Elmhurst area and 1.7 mgd in the Des Plaines area. During and after World War II, pumpage in these two areas increased very rapidly at an average rate of 400,000 gpd per year, or at a rate 8 times that recorded for the period prior to 1940.
The rate of increase in withdrawal in the Aurora area has been very uniform since 1890 and has averaged about 110,000 gpd per year. Pumpage in the Elgin area increased gradually during the period 1904-1928 after which it increased rapidly until about 1952. From 1952 to 1958 pumpage at this center has remained fairly constant at about 8 mgd.
As shown in figure 36B, pumpage in the Joliet area greatly increased during World Wars I and II and the Korean War in response to water demands of manufacturing industries. Pumpage at Joliet has also fluctuated with economic conditions as indicated by the decrease in pumpage during the 1930's.
Pumpage in the Chicago area increased at a rapid rate from about 200,000 gpd in 1864 to a maximum of 34.4 mgd in 1924. During the period, 1925-1937, pumpage decreased rapidly as many industries, including the Stock Yards, abandoned deep wells owing to the great decline in artesian pressure and began using the city of Chicago water supply. Economic conditions during the depression in the 1930's also contributed to the decrease in pumpage at Chicago. From 1940 to 1942 pumpage increased rapidly from 21.6 to 31 mgd, and after that it decreased to 22 mgd in 1954 and was 23.4 mgd in 1958.
Quantity of Water Derived from Silurian Age Dolomite and Mt. Simon Aquifer
The amount of water derived in 1958 from the Silurian age dolomite and the Mt. Simon Aquifer was calculated using figures 30 and 34 and equation (3) by subtracting the amounts of water moving through the Cambrian-Ordovician Aquifer into the pumping centers from the total withdrawals from deep wells in the pumping centers. Figure 37 shows the distribution of estimated pumpage from the Silurian age dolomite and Mt. Simon and Cambrian-Ordovician Aquifers in 1958. In 1958 about 33.3 mgd or 43 percent of the total amount of 76 mgd pumped from deep wells was derived from the Silurian age dolomite and the Mt. Simon Aquifer. Based
Fig. 37. Distribution of estimated pumpage from deep wells in 1958. Pumpage is proportional to radius of circle.
on an inventory of well construction and quality of water studies, it is estimated that in 1958 about 20.5 mgd were derived from the Silurian age dolomite and about 12.8 mgd were obtained from the Mt. Simon Aquifer. A large part of the water derived from the Mt. Simon Aquifer was pumped from deep wells in the Fox Valley.
Figure 36 gives approximate amounts of water derived from Silurian age dolomite and the Mt. Simon and Cambrian-Ordovician Aquifers in the pumping centers prior to 1958. The figure was constructed after considering mineral content and temperature data and by evaluating the number of wells open in the Cambrian-Ordovician Aquifer, the Silurian age dolomite, and/or the Mt. Simon Aquifer, their yield, and their time of construction. It is estimated that the amount of water derived from sources other than the Cambrian-Ordovician Aquifer increased from about 16.4 mgd in 1915 to 33.3 mgd in 1958. Also considered was the fact that leakage of water from the Silurian age dolomite into deep wells remains fairly constant after the artesian pressure in the Cambrian-Ordovician Aquifer declines below the base of the Silurian age dolomite.
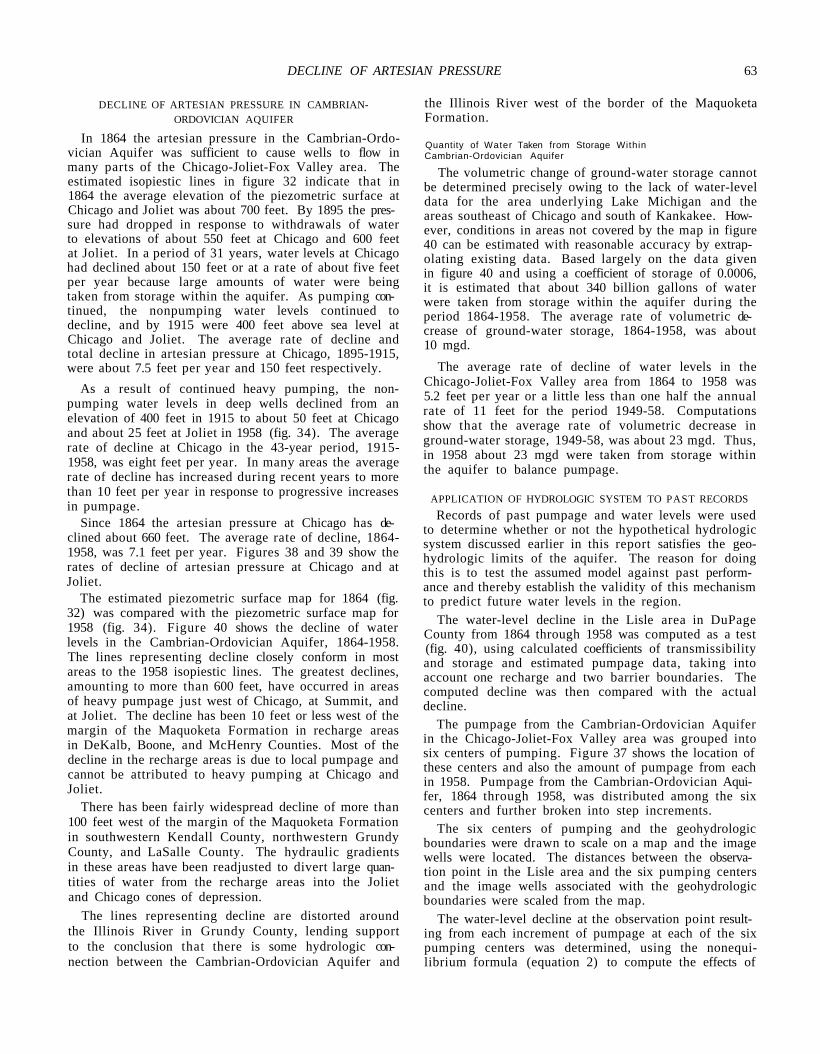
DECLINE OF ARTESIAN PRESSURE 63
DECLINE OF ARTESIAN PRESSURE IN CAMBRIAN-ORDOVICIAN AQUIFER
In 1864 the artesian pressure in the Cambrian-Ordo-vician Aquifer was sufficient to cause wells to flow in many parts of the Chicago-Joliet-Fox Valley area. The estimated isopiestic lines in figure 32 indicate that in 1864 the average elevation of the piezometric surface at Chicago and Joliet was about 700 feet. By 1895 the pressure had dropped in response to withdrawals of water to elevations of about 550 feet at Chicago and 600 feet at Joliet. In a period of 31 years, water levels at Chicago had declined about 150 feet or at a rate of about five feet per year because large amounts of water were being taken from storage within the aquifer. As pumping continued, the nonpumping water levels continued to decline, and by 1915 were 400 feet above sea level at Chicago and Joliet. The average rate of decline and total decline in artesian pressure at Chicago, 1895-1915, were about 7.5 feet per year and 150 feet respectively.
As a result of continued heavy pumping, the non-pumping water levels in deep wells declined from an elevation of 400 feet in 1915 to about 50 feet at Chicago and about 25 feet at Joliet in 1958 (fig. 34). The average rate of decline at Chicago in the 43-year period, 1915-1958, was eight feet per year. In many areas the average rate of decline has increased during recent years to more than 10 feet per year in response to progressive increases in pumpage.
Since 1864 the artesian pressure at Chicago has declined about 660 feet. The average rate of decline, 1864-1958, was 7.1 feet per year. Figures 38 and 39 show the rates of decline of artesian pressure at Chicago and at Joliet.
The estimated piezometric surface map for 1864 (fig. 32) was compared with the piezometric surface map for 1958 (fig. 34). Figure 40 shows the decline of water levels in the Cambrian-Ordovician Aquifer, 1864-1958. The lines representing decline closely conform in most areas to the 1958 isopiestic lines. The greatest declines, amounting to more than 600 feet, have occurred in areas of heavy pumpage just west of Chicago, at Summit, and at Joliet. The decline has been 10 feet or less west of the margin of the Maquoketa Formation in recharge areas in DeKalb, Boone, and McHenry Counties. Most of the decline in the recharge areas is due to local pumpage and cannot be attributed to heavy pumping at Chicago and Joliet.
There has been fairly widespread decline of more than 100 feet west of the margin of the Maquoketa Formation in southwestern Kendall County, northwestern Grundy County, and LaSalle County. The hydraulic gradients in these areas have been readjusted to divert large quantities of water from the recharge areas into the Joliet and Chicago cones of depression.
The lines representing decline are distorted around the Illinois River in Grundy County, lending support to the conclusion that there is some hydrologic connection between the Cambrian-Ordovician Aquifer and
the Illinois River west of the border of the Maquoketa Formation.
Quantity of Water Taken from Storage Within Cambrian-Ordovician Aquifer
The volumetric change of ground-water storage cannot be determined precisely owing to the lack of water-level data for the area underlying Lake Michigan and the areas southeast of Chicago and south of Kankakee. However, conditions in areas not covered by the map in figure 40 can be estimated with reasonable accuracy by extrapolating existing data. Based largely on the data given in figure 40 and using a coefficient of storage of 0.0006, it is estimated that about 340 billion gallons of water were taken from storage within the aquifer during the period 1864-1958. The average rate of volumetric decrease of ground-water storage, 1864-1958, was about 10 mgd.
The average rate of decline of water levels in the Chicago-Joliet-Fox Valley area from 1864 to 1958 was 5.2 feet per year or a little less than one half the annual rate of 11 feet for the period 1949-58. Computations show that the average rate of volumetric decrease in ground-water storage, 1949-58, was about 23 mgd. Thus, in 1958 about 23 mgd were taken from storage within the aquifer to balance pumpage.
APPLICATION OF HYDROLOGIC SYSTEM TO PAST RECORDS Records of past pumpage and water levels were used
to determine whether or not the hypothetical hydrologic system discussed earlier in this report satisfies the geo-hydrologic limits of the aquifer. The reason for doing this is to test the assumed model against past performance and thereby establish the validity of this mechanism to predict future water levels in the region.
The water-level decline in the Lisle area in DuPage County from 1864 through 1958 was computed as a test (fig. 40), using calculated coefficients of transmissibility and storage and estimated pumpage data, taking into account one recharge and two barrier boundaries. The computed decline was then compared with the actual decline.
The pumpage from the Cambrian-Ordovician Aquifer in the Chicago-Joliet-Fox Valley area was grouped into six centers of pumping. Figure 37 shows the location of these centers and also the amount of pumpage from each in 1958. Pumpage from the Cambrian-Ordovician Aquifer, 1864 through 1958, was distributed among the six centers and further broken into step increments.
The six centers of pumping and the geohydrologic boundaries were drawn to scale on a map and the image wells were located. The distances between the observation point in the Lisle area and the six pumping centers and the image wells associated with the geohydrologic boundaries were scaled from the map.
The water-level decline at the observation point resulting from each increment of pumpage at each of the six pumping centers was determined, using the nonequi-librium formula (equation 2) to compute the effects of
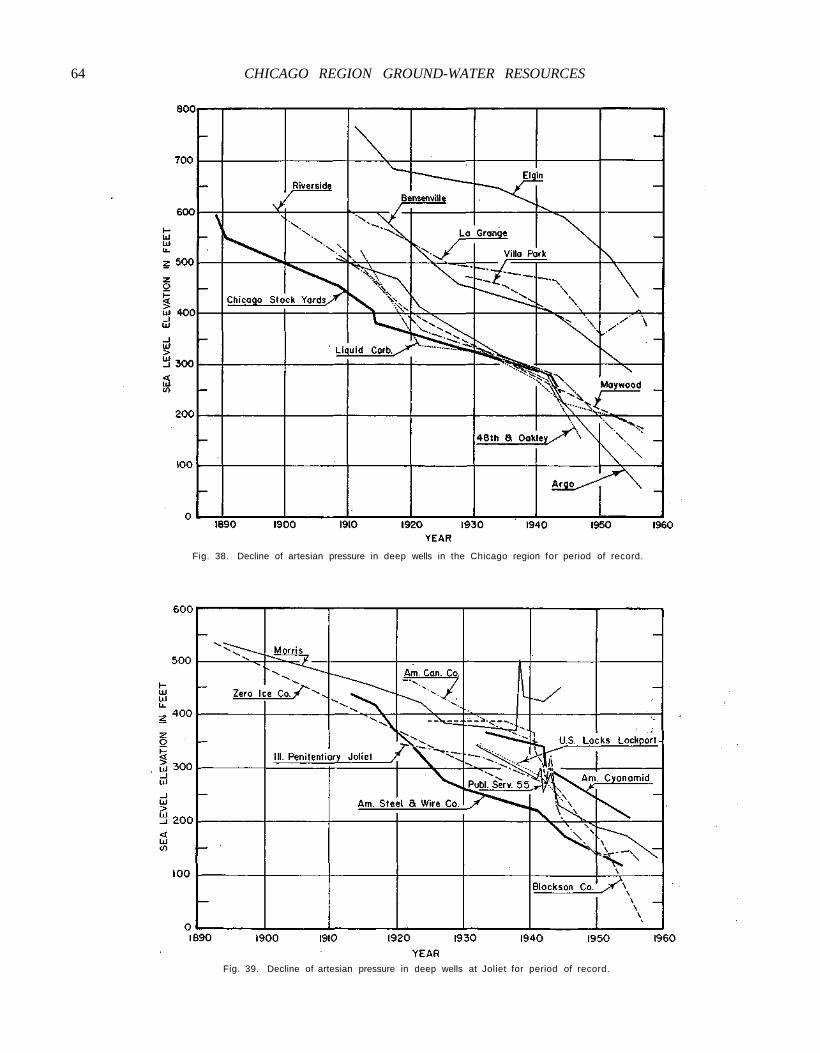
64 CHICAGO REGION GROUND-WATER RESOURCES
Fig. 38. Decline of artesian pressure in deep wells in the Chicago region for period of record.
Fig. 39. Decline of artesian pressure in deep wells at Joliet for period of record.

POTENTIAL GROUND WATER 65
Fig. 40. Decline of artesian pressure in Cambrian-Ordovician Aquifer, 1864-1958.
the real and image wells. The computed nonpumping water-level decline in the Lisle area resulting from past withdrawals of water from each pumping center is given in table 22.
The computed total decline in nonpumping water level in the Lisle area, 1864 through 1958, is 450 feet. The actual decline, obtained from figure 40, is 420 feet.
TABLE 22. COMPUTED NONPUMPING WATER-LEVEL DECLINE IN THE LISLE AREA
The computed decline is within about 7 percent of the actual decline. Even though the estimates of pumpage upon which calculations are based may be about 10 percent in error, the close agreement between computed and actual decline indicates that the hypothetical hydrologic system used closely describes the geohydrologic limits of the Cambrian-Ordovician Aquifer. It is believed that the hydrologic system may be used to predict with reasonable accuracy the effects of future ground-water development.
POTENTIAL GROUND-WATER DEVELOPMENT AND ITS EFFECTS
Pumpage between the present time and any future date must be estimated before further declines in water levels in wells in the Cambrian-Ordovician Aquifer can be calculated. Graphs showing the pumpage from 1864 through 1958 in each of the six pumping centers in the Chicago-Joliet-Fox Valley area are given in figure 36. Pumpage in the centers from 1958 through 1980 was extrapolated taking into consideration the past rates of growth of pumpage. Assuming that the total pumpage from deep wells in the six centers will increase at fairly uniform rates, from 76 mgd in 1958 to about 92 mgd in 1980, the daily withdrawal from the Cambrian-Ordovician Aquifer in 1980 will be about 56 mgd.
Decline in water levels which may be expected on the basis of these assumptions, from 1958 through 1980, at Chicago, Joliet, Des Plaines, Elmhurst, Elgin, and Aurora, were calculated using the same principles outlined in the preceding section. Computed declines in each pumping center which are presented in table 23 are
TABLE 23. COMPUTED FUTURE NONPUMPING WATER-LEVEL DECLINE, 1958-1980
based on the assumption that the distribution of pumping remains the same and that the pumpage increases at the rates given in figure 36. It should be emphasized that the declines in water levels cited are nonpumping water levels. Pumping levels will decline about the same amount as the nonpumping water levels if the present rates of pumping from individual wells are maintained.
Considering the great complexity of ground-water conditions in the Chicago-Joliet-Fox Valley area, the accuracy of the predicted future declines in water levels is probably about ±15 percent.
By 1980 the Galena-Platteville Dolomite and the Glen-wood-St. Peter Sandstone will be partially dewatered in parts of the Chicago-Joliet-Fox Valley area. The effects of partial dewatering on future declines in water levels
66 CHICAGO REGION GROUND-WATER RESOURCES
in deep wells were estimated on the basis of available geologic and hydrologic data. It is important that collection of water-level and pumpage records be continued so that the effects of dewatering can be appraised. It may be necessary to recompute future declines in water levels within ten years on the basis of data collected under dewatering conditions.
PRACTICAL SUSTAINED YIELD OF THE CAMBRIAN-ORDOVICIAN AQUIFER
Aside from economic considerations and quality of the water, the sustained yield of the Cambrian-Ordovician Aquifer is dependent on the rate of recharge, on the coefficient of transmissibility, and on the spacing of wells and well fields. The quantity of water that can be withdrawn indefinitely from the Cambrian-Ordovician Aquifer depends in part upon the quantity of water that can be induced to enter the aquifer in recharge areas, which in turn is dependent on the rate at which precipitation enters the ground. It is estimated that the recharge area of the Cambrian-Ordovician Aquifer that affects the Chicago-Joliet-Fox Valley area is about 1200 square miles. If five percent of the average annual precipitation can be induced to infiltrate into the aquifer in recharge areas, a conservative figure, the total available water at the recharge areas would be about 100 mgd.
The coefficient of transmissibility of the Cambrian-Ordovician Aquifer is low. To transmit 25 mgd from recharge areas, at a hydraulic gradient of 20 feet per mile, would require a cross section 73 miles wide. The maximum hydraulic gradient that theoretically could be developed from recharge areas toward pumping centers in the Fox Valley, in the Chicago area, and in the Joliet area, without dewatering a portion of the Ironton-Galesville Sandstone and thereby greatly decreasing the coefficient of transmissibility of the Cambrian-Ordovician Aquifer, is about 44 feet to the mile. It is estimated that the width of the cross section through which movement from recharge areas could occur is about 85 miles. Computations made with equation (3) show that the maximum quantity of water that could be transmitted down-dip from recharge areas is about 65 mgd. This quantity is less than the estimated recharge rate. Thus the sustained yield of the Cambrian-Ordovician Aquifer depends on the coefficient of transmissibility and the maximum available gradient of the aquifer rather than on potential replenishment to the aquifer.
The maximum amount of water that can be transmitted from recharge areas cannot be developed unless water is withdrawn from a large number of uniformly and widely spaced wells. However, pumping has been and probably will continue to be concentrated in industrial and municipal centers. From a hydrologic standpoint concentrated pumping is inefficient, and development of the full capacity of the aquifer is impossible under existing and foreseeable pumping conditions. Thus, the practical sustained yield of the Cambrian-Ordovician Aquifer is less than the maximum amount of 65 mgd which can be transmitted down-dip from recharge areas.
As explained earlier in this report, considerable time passes before water levels reach approximate equilibrium and the full effects of pumping are realized. Computations made using the nonequilibrium formula (2), the image-well theory, and the hydrologic system previously described indicate that, if the distribution and amount of pumping, 43 mgd, from the Cambrian-Ordovician Aquifer in the Chicago-Joliet-Fox Valley area remain indefinitely the same as in 1958, the nonpumping water level at Chicago will eventually decline to an elevation of about 550 feet below sea level under equilibrium conditions. The nonpumping water level at Chicago would be about 200 feet above the top of the Ironton-Galesville Sandstone. Withdrawal rates could be slightly increased over those of 1958 without dewatering the Ironton-Galesville Sandstone. Therefore, the practical sustained yield of the Cambrian-Ordovician Aquifer is somewhat greater than 43 mgd.
Computations made, taking into consideration de-watering, indicate that if the distribution of pumpage remains the same as in 1958 and the amount of pumpage from the Cambrian-Ordovician Aquifer increases to a total of 46 mgd and then remains the same, the nonpumping level in Chicago will eventually decline to a position about 100 feet above the top of the Ironton-Galesville Sandstone and at an elevation of about 650 feet below sea level. Pumping levels in wells, if the present rates of pumping from individual wells are maintained, would be within a few feet of the top of the Ironton-Galesville Sandstone. The pumping levels locally would be below the top of the Galena-Platteville Dolomite, the Glenwood-St. Peter Sandstone, the Prairie du Chien Series, Trempealeau Dolomite, and the Franconia Formation, and these formations would be dewatered. The dolomites and the Franconia Formation generally are not very permeable, and dewatering of these formations would not appreciably decrease the coefficient of transmissibility of the entire Cambrian-Ordovician Aquifer. However, the Glenwood-St. Peter Sandstone has some permeability. The specific capacities of deep wells would probably decrease on the average about 15 percent as the result of dewatering the Glenwood-St. Peter Sandstone.
The practical sustained yield of the Cambrian-Ordovician Aquifer is, therefore, estimated to be about 46 mgd. The practical sustained yield of this aquifer will be developed when the total pumpage from deep wells in the Chicago-Joliet-Fox Valley area is about 81 mgd. If pumpage increases at the rates assumed in figure 36, the practical sustained yield will be exceeded in about 1965 although equilibrium conditions will not yet have been achieved. The practical sustained yield of the Cambrian-Ordovician Aquifer could be increased by shifting centers of pumping to the west and by spacing wells at greater distances.
SHALLOW DOLOMITE AQUIFERS The shallow dolomite aquifers consist of Silurian rocks
in most of the region (note extent of Silurian in fig. 16)

SHALLOW DOLOMITE AQUIFERS 67
and dolomites of the Maquoketa and Galena-Platteville Formations in the western part of the region.
Ground water occurs in joints, fissures, and solution channels that range in size from hairline cracks to caverns. The locations of these openings cannot be predicted from the surface. Locally such openings may be partly filled with silt and clay which may be troublesome in development of wells. However, the upper part of the dolomite is usually the most productive. The thickness of the Silurian rocks ranges from a feather edge in the western part of the area to more than 450 feet in the southeast (fig. 27). Silurian rocks are the primary source of water for most household and farm wells and for many municipal and industrial wells. Many of the wells penetrate only the upper part of the dolomite, as shown in figure 41. Usually only the municipal and industrial wells penetrate the entire thickness of the aquifer.
The daily pumpage during 1957 from wells penetrating the shallow dolomite aquifers is given in table 13. The greater part of this pumpage occurs in Cook and DuPage Counties. Many high capacity wells have been constructed in parts of these counties where many crevices have been encountered.
A study was made of the specific capacities of municipal and industrial supply wells in the shallow dolomite in Cook, DuPage, Kane, Lake, McHenry, and Will Counties. Specific-capacity data obtained from the files of the State Water Survey, for 154 wells, are given in
table 24. The data for the counties are summarized in table 25.
Specific capacities listed in the tables range from 0.1 to 550 gpm per foot. Wells in DuPage County have the highest average specific capacity (54.5 gpm per foot), and wells in Lake County have the lowest average specific capacity (5.0 gpm per foot). The average specific capacity per foot of penetration of wells in DuPage County is much greater than that of wells in other counties.
Fig. 41. Depth-frequency histogram (A) and depth-cumulative percentage curve (B) of wells completed in shallow dolomite
in 17 townships in Will and Cook Counties.
Fig. 42. Penetration versus specific capacity of wells in shallow dolomite aquifers.

68 CHICAGO REGION GROUND-WATER RESOURCES
TABLE 24. SPECIFIC-CAPACITY DATA FOR WELLS IN SHALLOW DOLOMITE

SPECIFIC-CAPACITY DATA 69
TABLE 24. (Continued)

70 CHICAGO REGION GROUND-WATER RESOURCES
TABLE 24. (Continued)

GLACIAL DRIFT AQUIFERS 71
TABLE 25. SPECIFIC-CAPACITY DATA FOR WELLS IN SHALLOW DOLOMITE, SUMMARY BY COUNTY
A graph (fig. 42) of specific capacity versus penetration of well below the top of the shallow dolomite was prepared using the data in table 24, which is based primarily on the larger municipal and industrial wells. The graph indicates that there is no definite relation between depth of penetration and the specific capacity of a well. The data are widely scattered because the distribution of the water-bearing openings in the shallow dolomite is not uniform from depth to depth and from place to place. Most of the data are aligned vertically in the range of specific capacity from 0-20 gpm per foot indicating that the water-bearing openings in the shallow dolomite are normally more abundant and larger in the upper part of the aquifers and that the specific capacity of a well is not greatly increased with large depths of penetration.
Rough estimates of the coefficient of transmissibility of the shallow dolomite were made by substituting in the non-equilibrium formula (2) an artesian coefficient of storage, and well-construction data and average specific capacities from table 25. Based on average specific-capacity data, the coefficient of transmissibility of the shallow dolomite averages about 100,000 gpd per foot in DuPage County, 52,000 gpd per foot in Cook County, 24,000 gpd per foot in Will County, 14,000 gpd per foot in Kane and McHenry Counties, and 9,000 gpd per foot in Lake County. The estimated average coefficient of transmissibility of the shallow dolomite in DuPage, Cook, and Will Counties is much greater than the average coefficient of transmissibility of the Cambrian-Ordovician Aquifer in these counties.
The shallow dolomite immediately underlies and is readily recharged by precipitation through the glacial deposits.
The water levels in the dolomite vary greatly from time to time and place to place; however, at no location is there any apparent permanent decline. The differing water levels are caused by pumpage and by variations in recharge from precipitation. A typical example is at Chicago Heights where water levels are extremely responsive to fluctuations in precipitation as shown in figure 43. The water levels rise when precipitation is above normal and fall when precipitation is below normal.
Recharge by individual storms has been observed by variable water-level rises in wells. Such variation results from a number of factors, such as permeability of the overlying glacial drift, degree of crevices connecting
with the overlying drift, and the extent of saturation produced locally by an individual storm.
Fig. 43. Water levels compared with departure from normal precipitation at Chicago Heights.
GLACIAL DRIFT AQUIFERS Numerous rural and residential water supplies, but
only a few large supplies, are drawn from the glacial drift. The largest supplies are withdrawn from the fill of the buried Hadley Valley northeast of Joliet. The city of Joliet constructed five gravel wells that produce 650 gpm each. Several other municipal and industrial installations that obtain water from the drift are located in the region, none of which is overpumping the aquifer at the present time.
Specific-capacity data for municipal and industrial wells in the glacial drift aquifers throughout northeastern Illinois are summarized in table 26. This tabulation indicates that the range in specific capacity is from 2.1 to 66 gpm per foot and averages about 12 gpm per foot. The average depth and diameter of wells is 126 feet and 12 inches respectively, and the average aquifer thickness is 107 feet. Of the 40 wells listed only 4 were unscreened. The average length of screen used in the

72 CHICAGO REGION GROUND-WATER RESOURCES
36 screened wells was 25.5 feet. The data in table 26 indicate that the coefficient of transmissibility of the sand and gravel aquifers in northeastern Illinois ranges between 3,400 and 100,000 gpd per foot and averages 25,000 gpd per foot.
POTENTIAL YIELD OF SHALLOW AQUIFERS The glacial drift and shallow dolomite aquifers yielded
more than 75 mgd of ground water in 1957, over half of the pumpage of the region. Of the 75 mgd, 41.2 mgd were from wells finished in shallow dolomite aquifers and 14.2 mgd were from wells finished in glacial drift aquifers (table 13). The remaining 20 mgd were obtained mainly from Silurian age dolomite through deep wells that were uncased or were ineffectively cased below the drift (see section on Quantity of Water Derived from Silurian Age Dolomite and Mt. Simon Aquifer and fig. 37).
The most concentrated pumpage from the shallow aquifers in 1957 (table 14) occurred in southeastern DuPage County and adjoining Cook County around
La Grange (fig. 28), where most of the wells are finished in Silurian age dolomite.
Figure 44 shows hydrographs of water levels in the shallow aquifers. Most of the hydrographs are from wells in the area of concentrated pumpage in southeastern DuPage County. Although the water levels vary greatly from time to time and from place to place, the hydrographs indicate no general or permanent decline in water levels.
Fig. 44. Hydrographs of water levels in the shallow aquifers.

SPECIFIC-CAPACITY DATA 73
TABLE 26. SPECIFIC-CAPACITY DATA FOR WELLS IN GLACIAL DRIFT
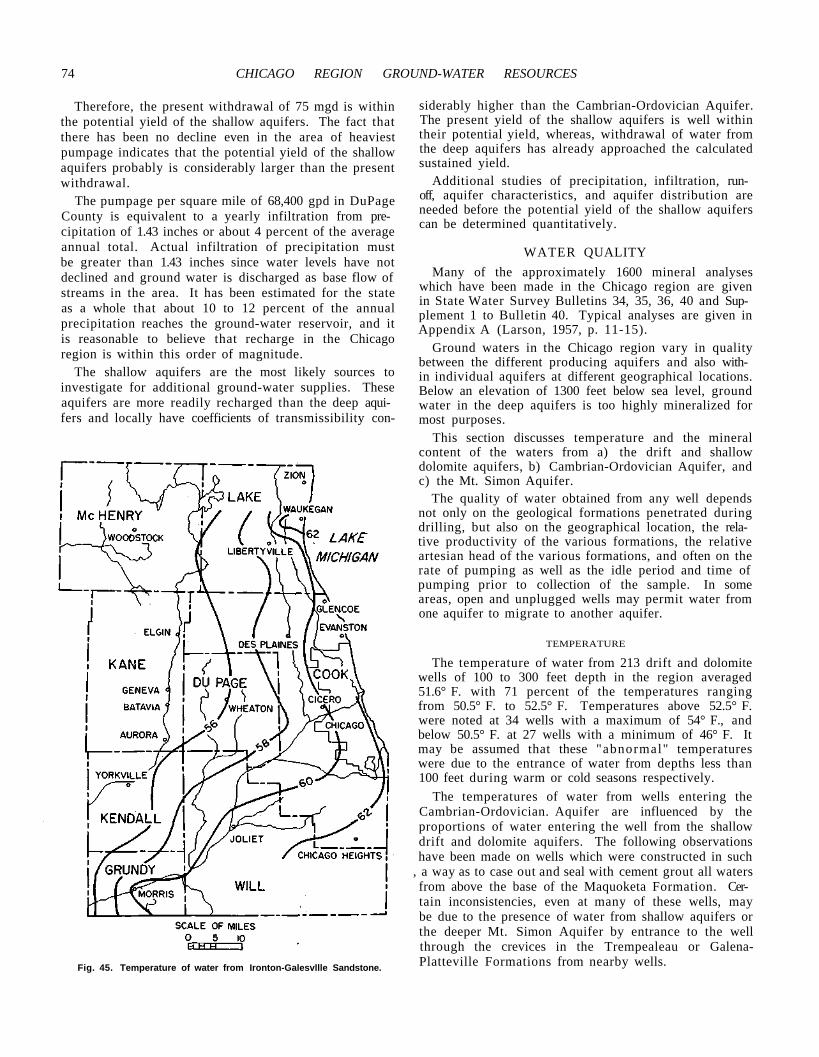
74 CHICAGO REGION GROUND-WATER RESOURCES
Therefore, the present withdrawal of 75 mgd is within the potential yield of the shallow aquifers. The fact that there has been no decline even in the area of heaviest pumpage indicates that the potential yield of the shallow aquifers probably is considerably larger than the present withdrawal.
The pumpage per square mile of 68,400 gpd in DuPage County is equivalent to a yearly infiltration from precipitation of 1.43 inches or about 4 percent of the average annual total. Actual infiltration of precipitation must be greater than 1.43 inches since water levels have not declined and ground water is discharged as base flow of streams in the area. It has been estimated for the state as a whole that about 10 to 12 percent of the annual precipitation reaches the ground-water reservoir, and it is reasonable to believe that recharge in the Chicago region is within this order of magnitude.
The shallow aquifers are the most likely sources to investigate for additional ground-water supplies. These aquifers are more readily recharged than the deep aquifers and locally have coefficients of transmissibility con-
Fig. 45. Temperature of water from Ironton-Galesvllle Sandstone.
siderably higher than the Cambrian-Ordovician Aquifer. The present yield of the shallow aquifers is well within their potential yield, whereas, withdrawal of water from the deep aquifers has already approached the calculated sustained yield.
Additional studies of precipitation, infiltration, runoff, aquifer characteristics, and aquifer distribution are needed before the potential yield of the shallow aquifers can be determined quantitatively.
WATER QUALITY Many of the approximately 1600 mineral analyses
which have been made in the Chicago region are given in State Water Survey Bulletins 34, 35, 36, 40 and Supplement 1 to Bulletin 40. Typical analyses are given in Appendix A (Larson, 1957, p. 11-15).
Ground waters in the Chicago region vary in quality between the different producing aquifers and also within individual aquifers at different geographical locations. Below an elevation of 1300 feet below sea level, ground water in the deep aquifers is too highly mineralized for most purposes.
This section discusses temperature and the mineral content of the waters from a) the drift and shallow dolomite aquifers, b) Cambrian-Ordovician Aquifer, and c) the Mt. Simon Aquifer.
The quality of water obtained from any well depends not only on the geological formations penetrated during drilling, but also on the geographical location, the relative productivity of the various formations, the relative artesian head of the various formations, and often on the rate of pumping as well as the idle period and time of pumping prior to collection of the sample. In some areas, open and unplugged wells may permit water from one aquifer to migrate to another aquifer.
TEMPERATURE
The temperature of water from 213 drift and dolomite wells of 100 to 300 feet depth in the region averaged 51.6°F. with 71 percent of the temperatures ranging from 50.5°F. to 52.5°F. Temperatures above 52.5°F. were noted at 34 wells with a maximum of 54°F., and below 50.5°F. at 27 wells with a minimum of 46°F. It may be assumed that these "abnormal" temperatures were due to the entrance of water from depths less than 100 feet during warm or cold seasons respectively.
The temperatures of water from wells entering the Cambrian-Ordovician. Aquifer are influenced by the proportions of water entering the well from the shallow drift and dolomite aquifers. The following observations have been made on wells which were constructed in such
, a way as to case out and seal with cement grout all waters from above the base of the Maquoketa Formation. Certain inconsistencies, even at many of these wells, may be due to the presence of water from shallow aquifers or the deeper Mt. Simon Aquifer by entrance to the well through the crevices in the Trempealeau or Galena-Platteville Formations from nearby wells.
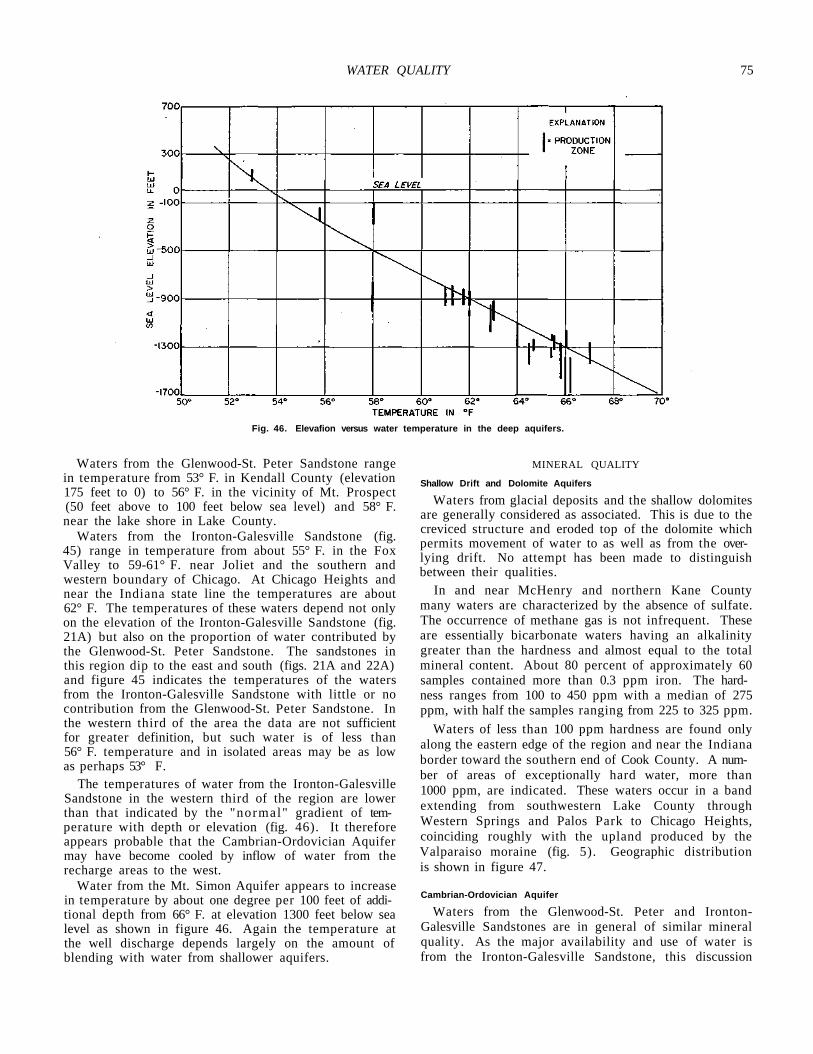
WATER QUALITY 75
Fig. 46. Elevafion versus water temperature in the deep aquifers.
Waters from the Glenwood-St. Peter Sandstone range in temperature from 53°F. in Kendall County (elevation 175 feet to 0) to 56°F. in the vicinity of Mt. Prospect (50 feet above to 100 feet below sea level) and 58°F. near the lake shore in Lake County.
Waters from the Ironton-Galesville Sandstone (fig. 45) range in temperature from about 55°F. in the Fox Valley to 59-61°F. near Joliet and the southern and western boundary of Chicago. At Chicago Heights and near the Indiana state line the temperatures are about 62°F. The temperatures of these waters depend not only on the elevation of the Ironton-Galesville Sandstone (fig. 21A) but also on the proportion of water contributed by the Glenwood-St. Peter Sandstone. The sandstones in this region dip to the east and south (figs. 21A and 22A) and figure 45 indicates the temperatures of the waters from the Ironton-Galesville Sandstone with little or no contribution from the Glenwood-St. Peter Sandstone. In the western third of the area the data are not sufficient for greater definition, but such water is of less than 56°F. temperature and in isolated areas may be as low as perhaps 53° F.
The temperatures of water from the Ironton-Galesville Sandstone in the western third of the region are lower than that indicated by the "normal" gradient of temperature with depth or elevation (fig. 46). It therefore appears probable that the Cambrian-Ordovician Aquifer may have become cooled by inflow of water from the recharge areas to the west.
Water from the Mt. Simon Aquifer appears to increase in temperature by about one degree per 100 feet of additional depth from 66°F. at elevation 1300 feet below sea level as shown in figure 46. Again the temperature at the well discharge depends largely on the amount of blending with water from shallower aquifers.
MINERAL QUALITY
Shallow Drift and Dolomite Aquifers
Waters from glacial deposits and the shallow dolomites are generally considered as associated. This is due to the creviced structure and eroded top of the dolomite which permits movement of water to as well as from the overlying drift. No attempt has been made to distinguish between their qualities.
In and near McHenry and northern Kane County many waters are characterized by the absence of sulfate. The occurrence of methane gas is not infrequent. These are essentially bicarbonate waters having an alkalinity greater than the hardness and almost equal to the total mineral content. About 80 percent of approximately 60 samples contained more than 0.3 ppm iron. The hardness ranges from 100 to 450 ppm with a median of 275 ppm, with half the samples ranging from 225 to 325 ppm.
Waters of less than 100 ppm hardness are found only along the eastern edge of the region and near the Indiana border toward the southern end of Cook County. A number of areas of exceptionally hard water, more than 1000 ppm, are indicated. These waters occur in a band extending from southwestern Lake County through Western Springs and Palos Park to Chicago Heights, coinciding roughly with the upland produced by the Valparaiso moraine (fig. 5). Geographic distribution is shown in figure 47.
Cambrian-Ordovician Aquifer
Waters from the Glenwood-St. Peter and Ironton-Galesville Sandstones are in general of similar mineral quality. As the major availability and use of water is from the Ironton-Galesville Sandstone, this discussion
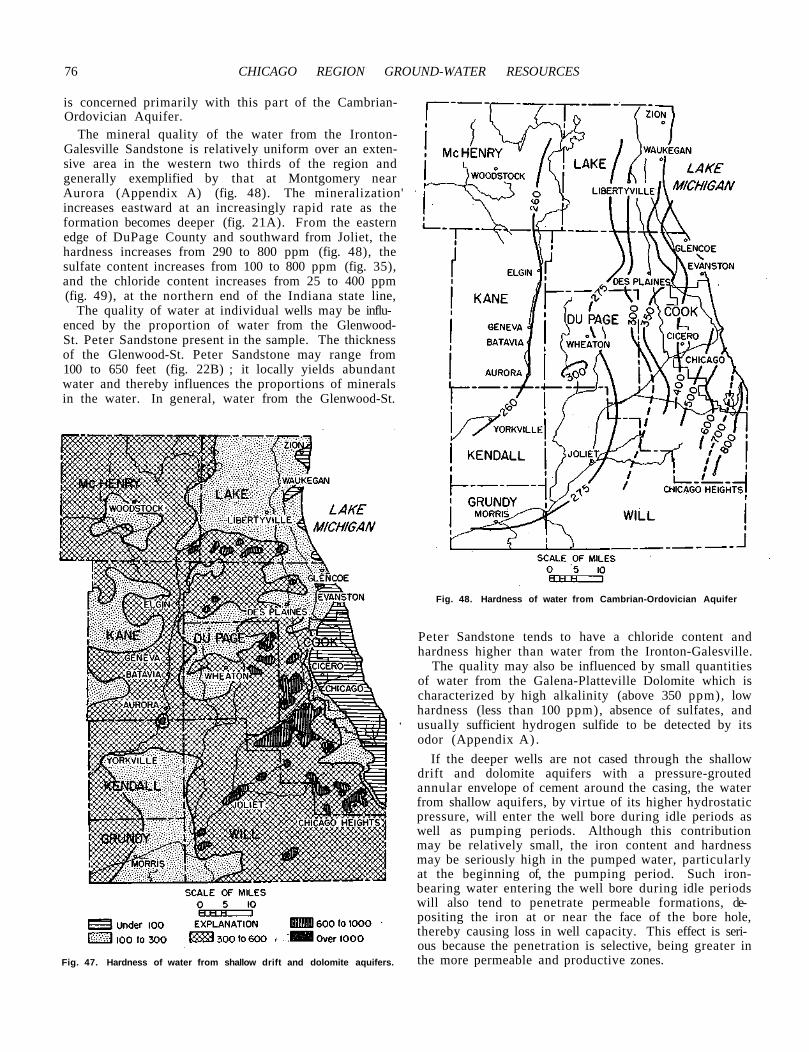
76 CHICAGO REGION GROUND-WATER RESOURCES
is concerned primarily with this part of the Cambrian-Ordovician Aquifer.
The mineral quality of the water from the Ironton-Galesville Sandstone is relatively uniform over an exten-sive area in the western two thirds of the region and generally exemplified by that at Montgomery near Aurora (Appendix A) (fig. 48). The mineralization' increases eastward at an increasingly rapid rate as the formation becomes deeper (fig. 21A). From the eastern edge of DuPage County and southward from Joliet, the hardness increases from 290 to 800 ppm (fig. 48), the sulfate content increases from 100 to 800 ppm (fig. 35), and the chloride content increases from 25 to 400 ppm (fig. 49), at the northern end of the Indiana state line,
The quality of water at individual wells may be influenced by the proportion of water from the Glenwood-St. Peter Sandstone present in the sample. The thickness of the Glenwood-St. Peter Sandstone may range from 100 to 650 feet (fig. 22B) ; it locally yields abundant water and thereby influences the proportions of minerals in the water. In general, water from the Glenwood-St.
Fig. 47. Hardness of water from shallow drift and dolomite aquifers.
Fig. 48. Hardness of water from Cambrian-Ordovician Aquifer
Peter Sandstone tends to have a chloride content and hardness higher than water from the Ironton-Galesville.
The quality may also be influenced by small quantities of water from the Galena-Platteville Dolomite which is characterized by high alkalinity (above 350 ppm), low hardness (less than 100 ppm), absence of sulfates, and usually sufficient hydrogen sulfide to be detected by its odor (Appendix A) .
If the deeper wells are not cased through the shallow drift and dolomite aquifers with a pressure-grouted annular envelope of cement around the casing, the water from shallow aquifers, by virtue of its higher hydrostatic pressure, will enter the well bore during idle periods as well as pumping periods. Although this contribution may be relatively small, the iron content and hardness may be seriously high in the pumped water, particularly at the beginning of, the pumping period. Such iron-bearing water entering the well bore during idle periods will also tend to penetrate permeable formations, depositing the iron at or near the face of the bore hole, thereby causing loss in well capacity. This effect is serious because the penetration is selective, being greater in the more permeable and productive zones.

RECOMMENDATIONS FOR STUDY 77
Fig. 49. Chloride content of water from Cambrian-Ordovician Aquifer.
When not blended with waters from other formations, waters from the Glenwood-St. Peter and Ironton-Gales-ville Sandstones usually have low iron content (0.2-0.4 ppm) and an almost uniform concentration of 1.0 ppm fluoride.
Mt. Simon Aquifer
The primary characteristic of the quality of water from the Mt. Simon Aquifer is its rapid increase in chloride concentration with depth of penetration or lower elevation, as shown in figure 50. With increasing penetration below an elevation of 1275 feet below sea level, greater quantities of water with high chloride content and high hardness are permitted to enter a well. The rate of increase in chloride concentration with increasing depth in the aquifer approaches 400 ppm per additional 25 feet of penetration. This rate is based largely on data from a sample collected from an oil test well in Kankakee County at an elevation of 2200 feet below sea level (Appendix A).
Abandoned wells penetrating Mt. Simon Aquifer in the region may contribute high chloride water to the
Fig. 50. Elevation versus chlorides in the Mt. Simon Aquifer.
overlying Cambrian-Ordovician Aquifer because the major pumpage and water-level decline is in the latter. Therefore the upper aquifer in the immediate area of such abandoned wells may yield an increasing proportion of Mt. Simon water with continued water-level decline.
RECOMMENDATIONS FOR FURTHER STUDY The presently available data are insufficient to form a
basis for a complete or accurate water resources budget of the Chicago region. More detailed geologic, hydro-logic, meteorologic, and engineering data, bearing on both ground water and surface water, are needed. With respect to ground water the following investigations are recommended:
1) Study of the shallow aquifers to delineate favorable and unfavorable areas for additional groundwater development, and to determine recharge, hydraulic properties, and potential yield.
2) Regional study of the stratigraphy of the deeper formations to determine variations in permeability, nature of barrier boundaries, role of the dolomites of the Prairie du Chien and Trempealeau Formations as contributors of water, and the detailed character of the Eau Claire Formation.
3) Study of the effects that dewatering parts of the Cambrian-Ordovician Aquifer has on water-level declines.
4) Study of possible recharge of the aquifers from Lake Michigan.
5) Study of the relations between the Chicago and Milwaukee pumpage cones.
6) Application of more extensive geophysical logging and well testing to obtain additional geologic and hydrologic data on individual units of the aquifers.
7) Collection of more complete data on pumpage, particularly from the shallow aquifers.
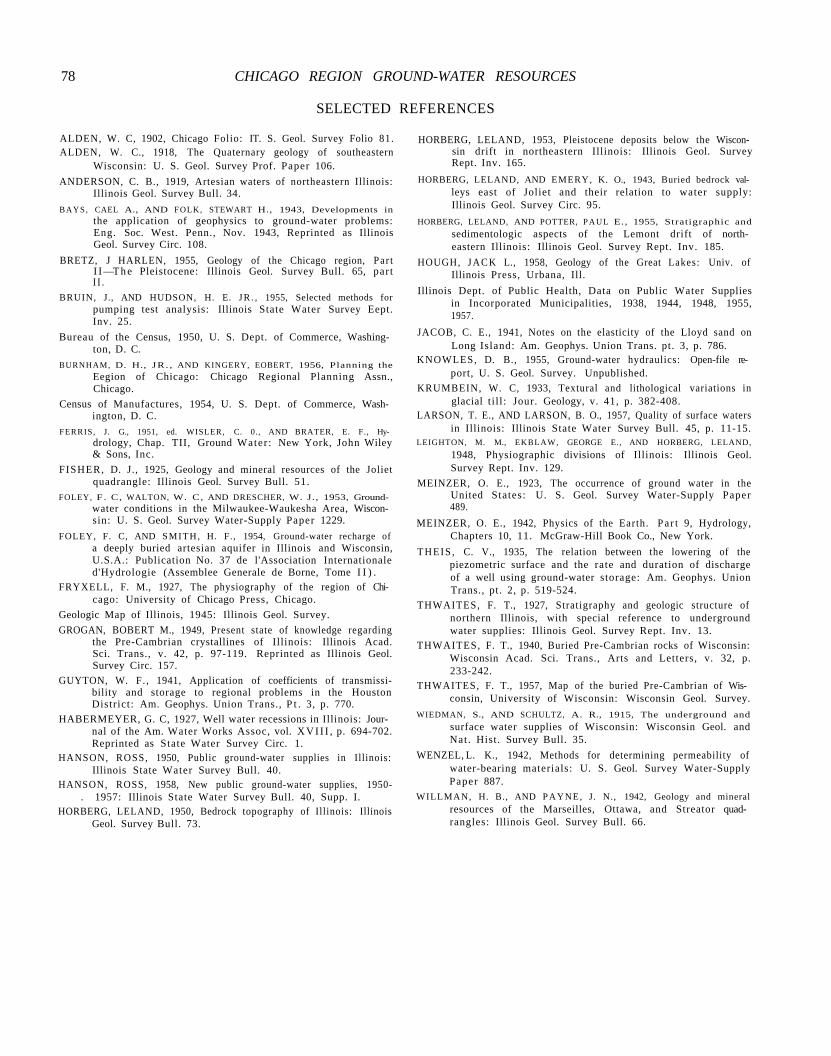
78 CHICAGO REGION GROUND-WATER RESOURCES
SELECTED REFERENCES
ALDEN, W. C, 1902, Chicago Folio: IT. S. Geol. Survey Folio 81. ALDEN, W. C., 1918, The Quaternary geology of southeastern
Wisconsin: U. S. Geol. Survey Prof. Paper 106. ANDERSON, C. B., 1919, Artesian waters of northeastern Illinois:
Illinois Geol. Survey Bull. 34. BAYS, CAEL A., AND FOLK, STEWART H., 1943, Developments in
the application of geophysics to ground-water problems: Eng. Soc. West. Penn., Nov. 1943, Reprinted as Illinois Geol. Survey Circ. 108.
BRETZ, J HARLEN, 1955, Geology of the Chicago region, Par t I I — T h e Pleistocene: Illinois Geol. Survey Bull. 65, part I I .
BRUIN, J., AND HUDSON, H. E. J R . , 1955, Selected methods for pumping test analysis: Illinois State Water Survey Eept. Inv. 25.
Bureau of the Census, 1950, U. S. Dept. of Commerce, Washington, D. C.
BURNHAM, D. H., JR . , AND KINGERY, EOBERT, 1956, Planning the Eegion of Chicago: Chicago Regional Planning Assn., Chicago.
Census of Manufactures, 1954, U. S. Dept. of Commerce, Washington, D. C.
FERRIS, J. G., 1951, ed. WISLER, C. 0., AND BRATER, E. F., Hydrology, Chap. TII, Ground Water : New York, John Wiley & Sons, Inc.
F ISHER, D. J., 1925, Geology and mineral resources of the Joliet quadrangle: Illinois Geol. Survey Bull. 51.
FOLEY, F . C, WALTON, W. C, AND DRESCHER, W. J. , 1953, Groundwater conditions in the Milwaukee-Waukesha Area, Wisconsin: U. S. Geol. Survey Water-Supply Paper 1229.
FOLEY, F. C, AND SMITH, H. F., 1954, Ground-water recharge of a deeply buried artesian aquifer in Illinois and Wisconsin, U.S.A.: Publication No. 37 de l'Association Internationale d'Hydrologie (Assemblee Generale de Borne, Tome I I ) .
FRYXELL, F. M., 1927, The physiography of the region of Chicago: University of Chicago Press, Chicago.
Geologic Map of Illinois, 1945: Illinois Geol. Survey. GROGAN, BOBERT M., 1949, Present state of knowledge regarding
the Pre-Cambrian crystallines of Illinois: Illinois Acad. Sci. Trans., v. 42, p. 97-119. Reprinted as Illinois Geol. Survey Circ. 157.
GUYTON, W. F. , 1941, Application of coefficients of transmissi-bility and storage to regional problems in the Houston District: Am. Geophys. Union Trans., P t . 3, p. 770.
HABERMEYER, G. C, 1927, Well water recessions in Illinois: Journal of the Am. Water Works Assoc, vol. X V I I I , p. 694-702. Reprinted as State Water Survey Circ. 1.
HANSON, ROSS, 1950, Public ground-water supplies in Illinois: Illinois State Water Survey Bull. 40.
HANSON, ROSS, 1958, New public ground-water supplies, 1950-. 1957: Illinois State Water Survey Bull. 40, Supp. I.
HORBERG, LELAND, 1950, Bedrock topography of Illinois: Illinois Geol. Survey Bull. 73.
HORBERG, LELAND, 1953, Pleistocene deposits below the Wisconsin drift in northeastern Illinois: Illinois Geol. Survey Rept. Inv. 165.
HORBERG, LELAND, AND EMERY, K. O., 1943, Buried bedrock valleys east of Joliet and their relation to water supply: Illinois Geol. Survey Circ. 95.
HORBERG, LELAND, AND POTTER, PAUL E., 1955, Stratigraphic and sedimentologic aspects of the Lemont drift of northeastern Illinois: Illinois Geol. Survey Rept. Inv. 185.
HOUGH, JACK L., 1958, Geology of the Great Lakes: Univ. of Illinois Press, Urbana, Ill.
Illinois Dept. of Public Health, Data on Public Water Supplies in Incorporated Municipalities, 1938, 1944, 1948, 1955, 1957.
JACOB, C. E., 1941, Notes on the elasticity of the Lloyd sand on Long Island: Am. Geophys. Union Trans. pt. 3, p. 786.
KNOWLES, D. B., 1955, Ground-water hydraulics: Open-file report, U. S. Geol. Survey. Unpublished.
KRUMBEIN, W. C, 1933, Textural and lithological variations in glacial t i l l : Jour. Geology, v. 41, p. 382-408.
LARSON, T. E., AND LARSON, B. O., 1957, Quality of surface waters in Illinois: Illinois State Water Survey Bull. 45, p. 11-15.
LEIGHTON, M. M., EKBLAW, GEORGE E., AND HORBERG, LELAND, 1948, Physiographic divisions of Illinois: Illinois Geol. Survey Rept. Inv. 129.
MEINZER, O. E., 1923, The occurrence of ground water in the United States: U. S. Geol. Survey Water-Supply Paper 489.
MEINZER, O. E., 1942, Physics of the Earth. P a r t 9, Hydrology, Chapters 10, 11. McGraw-Hill Book Co., New York.
T H E I S , C. V., 1935, The relation between the lowering of the piezometric surface and the rate and duration of discharge of a well using ground-water storage: Am. Geophys. Union Trans., pt. 2, p. 519-524.
THWAITES, F. T., 1927, Stratigraphy and geologic structure of northern Illinois, with special reference to underground water supplies: Illinois Geol. Survey Rept. Inv. 13.
THWAITES, F. T., 1940, Buried Pre-Cambrian rocks of Wisconsin: Wisconsin Acad. Sci. Trans., Arts and Letters, v. 32, p. 233-242.
THWAITES, F. T., 1957, Map of the buried Pre-Cambrian of Wisconsin, University of Wisconsin: Wisconsin Geol. Survey.
WIEDMAN, S., AND SCHULTZ, A. R., 1915, The underground and surface water supplies of Wisconsin: Wisconsin Geol. and Nat . Hist. Survey Bull. 35.
WENZEL, L. K., 1942, Methods for determining permeability of water-bearing materials: U. S. Geol. Survey Water-Supply Paper 887.
WILLMAN, H. B., AND PAYNE, J. N., 1942, Geology and mineral resources of the Marseilles, Ottawa, and Streator quadrangles: Illinois Geol. Survey Bull. 66.

APPENDIX A
SELECTED MINERAL ANALYSES OP WATER
Abbreviations used:
ppm = parts per million
epm = equivalents per million
ppm X .0583 = grains per gallon
GLACIAL DRIFT AQUIFER Sample of water collected from 6-inch well owned by the Morton Salt Co. between Woodstock and Crystal Lake, Illinois, in McHenry County. Location of well: 6 feet from 1200 feet E and 300 feet S of NW corner of Section 16, T44N, R7E. Depth of well: 231 feet.
LABORATORY NO. 134325
SHALLOW DOLOMITE AQUIFER Sample of water collected October 18, 1945, from Well No. 5
owned by the Village of Palatine, Illinois. Location of well: 2000 feet S and 2000 feet W of NE corner of Section 22, T42N, R10E. Depth of well: 209 feet. Rate of pumping: 235 gpm for 6 hours.
LABORATORY NO. 104554
SHALLOW DOLOMITE AQUIFER Sample of water collected March 18, 1958, from a well owned by the Midwest-Justice Water Co. near Justice, Illinois, in Cook County. Location of well: 500 feet E and 1430 feet S of NW corner of Section 35, T38N, R12E. Depth of well: 145 feet. Sample collected 5 minutes after pumping began while pumping at a rate of 137 gpm.
LABORATORY NO. 146026
GALENA-PLATTEVILLE DOLOMITE Sample of water collected October 5, 1936, from a well owned by the Illinois Watch Case Co., Elgin, Illinois. Location of well: Section 12, T41N, R8E. Depth of well: 981 feet.
LABORATORY NO. 78810
79

80 CHICAGO REGION GROUND-WATER RESOURCES
CAMBRIAN-ORDOVICIAN AQUIFER Sample of water collected January 13, 1957, from the No. 3 Well owned by the Caterpillar Tractor Company near Montgomery, Illinois, in Kendall County. Location of well: 2500 feet N and 2170 feet E of SW corner of Section 6, T37N, E8E. Depth of well: 1352 feet. Sample collected 24 hours after pumping began while pumping at a rate of approximately 1277 gpm.
LABORATORY NO. 142509
CAMBRIAN-ORDOVICIAN AQUIFER Sample of water collected August 21, 1942, from well owned by Carnegie Illinois Steel Corp., South Chicago, Illinois. Location of well: 2500 feet N and 2600 feet E of SW corner of Section 32, T38N, E15E. Depth of well: 1660 feet.
LABORATORY NO. 93750
MT. SIMON AQUIFER Sample of water collected October 8, 1930, by C. McRoberts from a well being drilled one-fourth mile west of Momence, Illinois, Section 24, T31N, R13E. Depth of well: 2800 feet.
LABORATORY NO. 67647

APPENDIX B
SELECTED WELL RECORDS
Wells listed below are shown in figure 2 and can be identified by the location method of numbering described in the right-hand column. Abbreviations:
COK = Cook KEN = Kendall
DUP = DuPage LKE = Lake
GRY = Grundy MCH = McHenry
KNE = Kane WIL = Will
P = Publie Supply PdC = Prairie du Chien
I = Industrial Supply Tr = Trempealeau
R = Rural (non-irrigation) Fr = Franconia Supply
I-G = Ironton-Galesville IR = Irrigation Supply
EC = Eau Claire SL = Sea Level
MS = Mt. Simon Dr = Drift
S & G = sand and gravel Sil = Silurian
Dol = dolomite Maq = Maquoketa
Ss = sandstone C-0 = Cambrian-Ordovician
SS = State Geological Survey G-P = Galena-Platteville sample set
G-SP = Glenwood-St. Peter DL = driller's log
WELL NUMBERING SYSTEM The well numbering system used in the appendix is based on
the location of the well, and uses the township, range, and section for identification.
The well number consists of five par t s : county abbreviation, township, range, section, and coordinate within the section. Sections are divided into rows of one-eighth mile squares. Each one-eighth mile square contains 10 acres and corresponds to a quarter of a quarter of a quarter section. A normal section of one square mile contains eight rows of eighth-mile squares; an odd-size section contains more or fewer rows. Rows are numbered from east to west and lettered from south to north as shown below.
Cook County T. 41 N., R. 11 E., sec. 25
The number of the well shown in sec. 25 above is as follows: COK 41NllE-25.4g
Where there is more than one well in a 10-acre square they are identified by arabic numbers after the lower case letter in the well number.
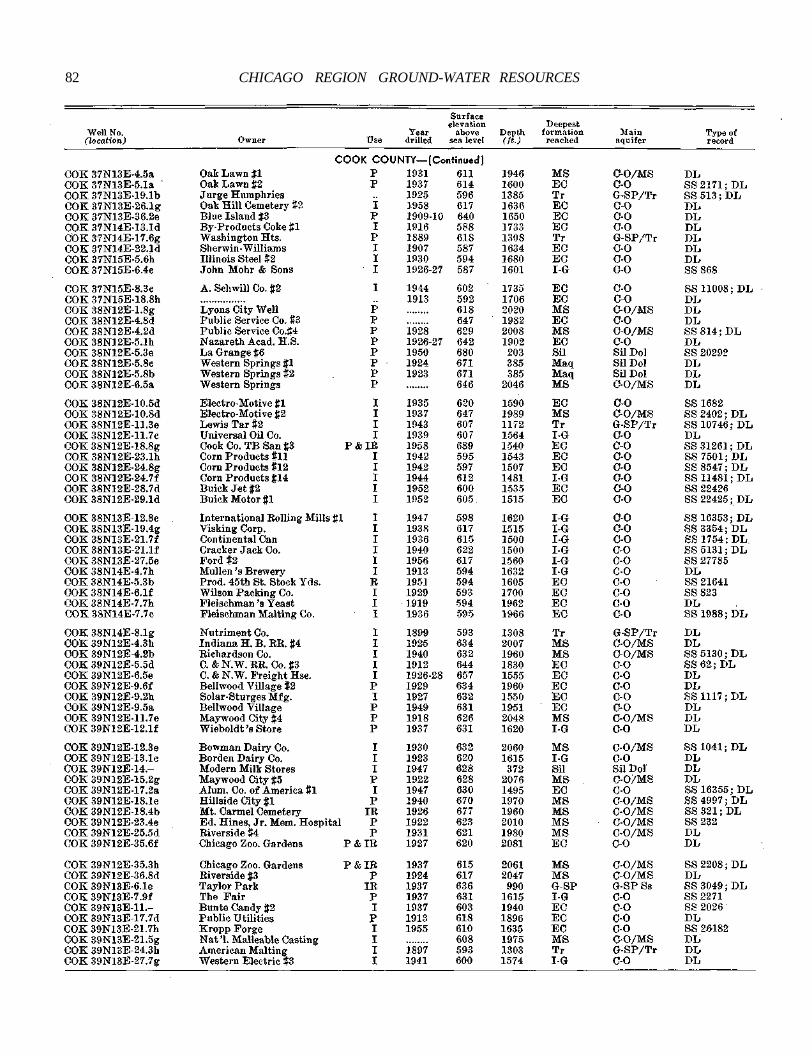
82 CHICAGO REGION GROUND-WATER RESOURCES
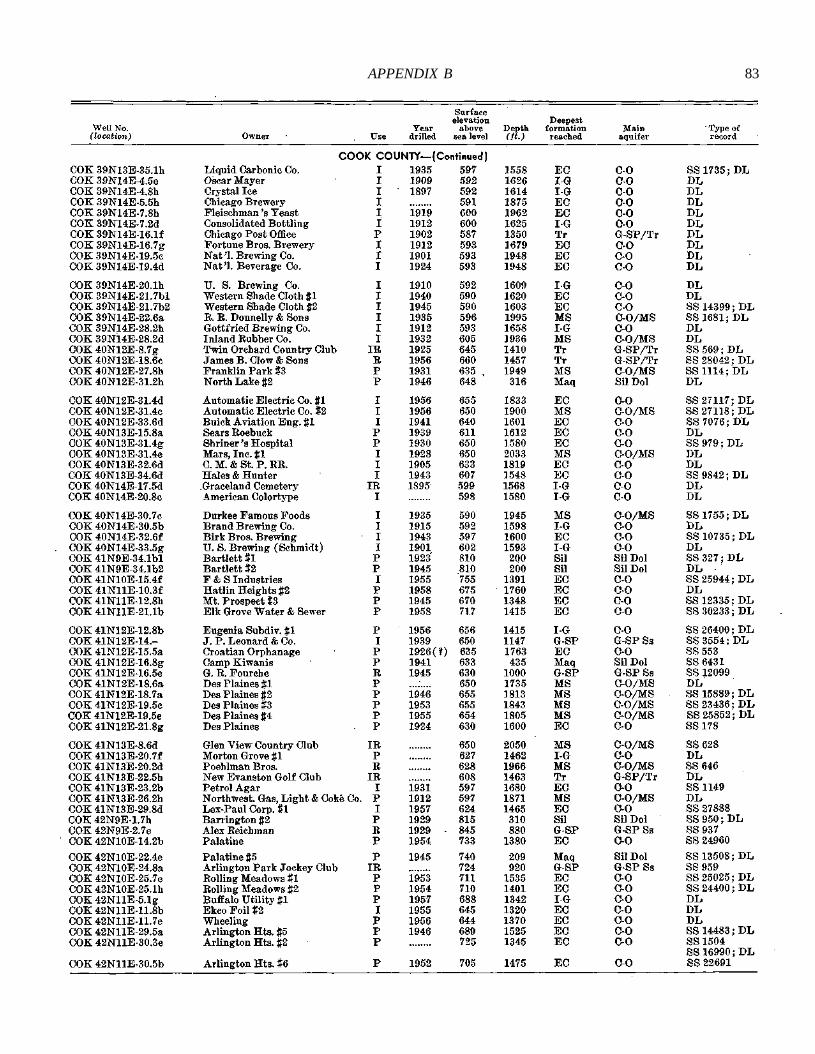
APPENDIX B 83

84 CHICAGO REGION GROUND-WATER RESOURCES

APPENDIX B 85

86 CHICAGO REGION GROUND-WATER RESOURCES
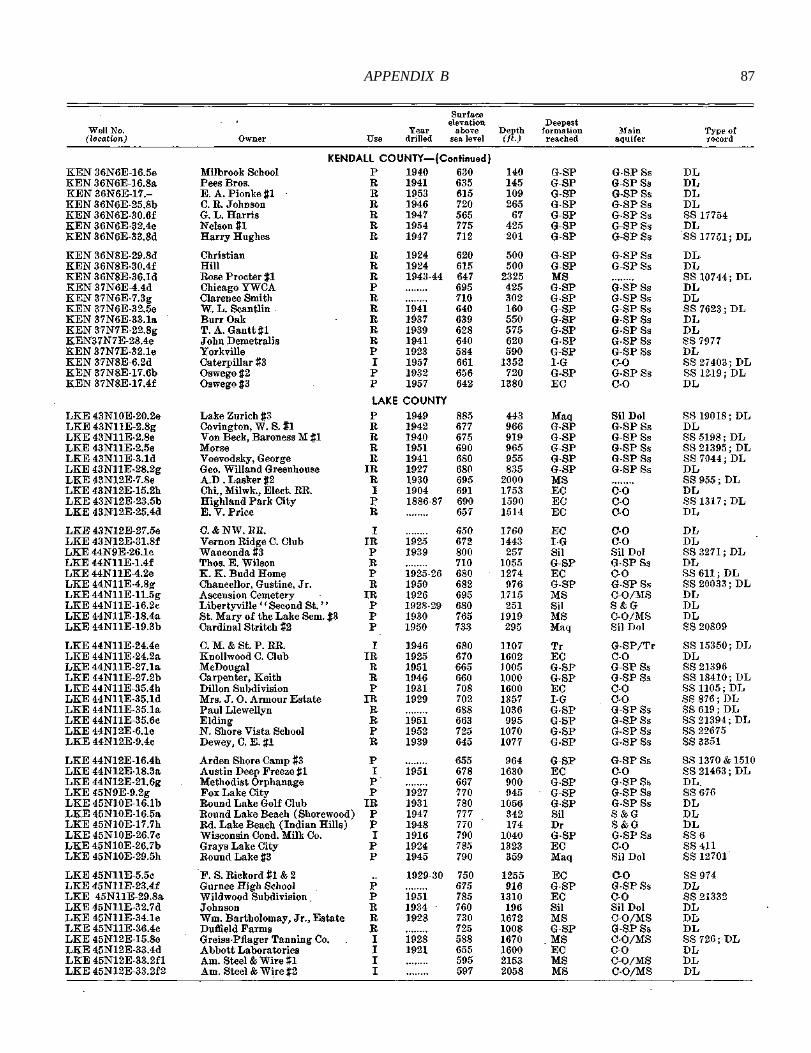
APPENDIX B 87

88 CHICAGO REGION GROUNDWATER RESOURCES
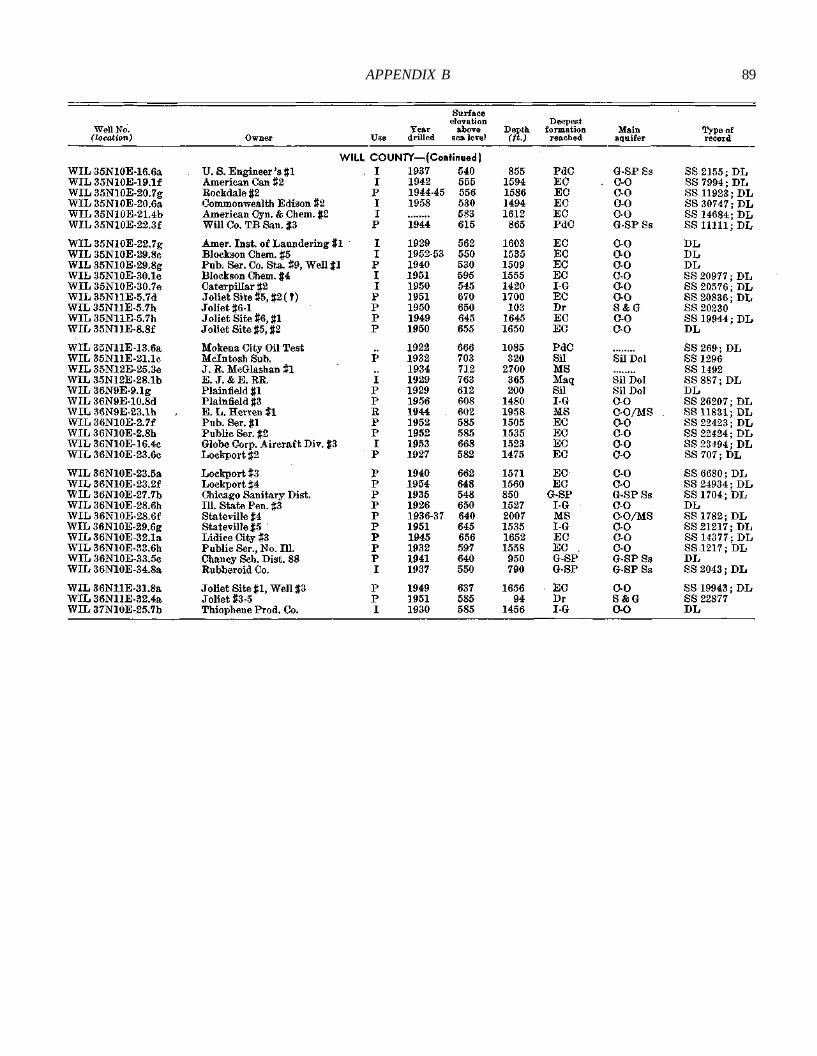
APPENDIX B 89